Article

Stereo 3D Object Detection Using a Feature Attention Module

1
School of Information, Renmin University of China, Beijing 100872, China
2
School of Computer & Communication Engineering, University of Science and Technology Beijing, Beijing 100083, China
*
Author to whom correspondence should be addressed.
Algorithms 2023, 16(12), 560; https://doi.org/10.3390/a16120560
Submission received: 24 October 2023 / Revised: 26 November 2023 / Accepted: 6 December 2023 / Published: 7 December 2023

Abstract

:
Stereo 3D object detection remains a crucial challenge within the realm of 3D vision. In the pursuit of enhancing stereo 3D object detection, feature fusion has emerged as a potent strategy. However, the design of the feature fusion module and the determination of pivotal features in this fusion process remain critical. This paper proposes a novel feature attention module tailored for stereo 3D object detection. Serving as a pivotal element for feature fusion, this module not only discerns feature importance but also facilitates informed enhancements based on its conclusions. This study delved into the various facets aided by the feature attention module. Firstly, a interpretability analysis was conducted concerning the function of the image segmentation methods. Secondly, we explored the augmentation of the feature fusion module through a category reweighting strategy. Lastly, we investigated global feature fusion methods and model compression strategies. The models devised through our proposed design underwent an effective analysis, yielding commendable performance, especially in small object detection within the pedestrian category.

1. Introduction

The advent of cutting-edge technologies like autonomous driving and robotic applications has ignited a fervent interest among researchers in intelligent object detection and localization. Networks trained on point cloud and image data aim to predict crucial object information such as position, size, and rotation angle, typically visualized through three-dimensional bounding boxes, as depicted in Figure 1. While lidar offers precise point clouds and is commonly employed for 3D object detection, its limitations in adverse weather conditions and its high cost have spurred exploration into alternative sensor forms and harnessing image information.
Image-based methodologies predominantly utilize monocular and binocular cameras, accomplishing 3D object detection through depth estimations or key point detection. Binocular vision, relying on the principles of disparity estimation and triangulation, surpasses monocular images by offering depth information independent of real depth supervision, thereby enhancing detection accuracy. Its interpretability, stability, and adaptability have captivated researchers’ attention. However, inherent errors between the principle-based point cloud accuracy and real values lead to estimation inaccuracies in positional information, creating a performance gap in 3D object detection compared to lidar-based systems.
Closing this gap and optimizing the usability of camera sensors holds significant importance in advancing 3D vision methodologies. This pursuit carries high research and application value, particularly in domains like autonomous driving and intelligent robotics.
Yet, binocular vision poses the following practical challenges in 3D object detection:
  • Without the aid of lidar, stereo 3D object detection suffers performance setbacks, requiring retraining or augmentation with lidar for “new” object categories or forms, escalating equipment costs. The use of binocular vision as a cost-effective alternative necessitates addressing accuracy challenges.
  • While 2D segmentation methods from images enhance detection [1,2], their efficacy dwindles for diverse objects like height limit devices [3], which can assume various forms (e.g., single pole, multipole, irregular natural obstacles). Exploring alternative solutions becomes imperative for enhancing detection efficacy.
Additionally, point clouds for depth estimation can suffer from artifacts and deformations, lacking the precision of lidar. Researchers are diligently seeking improved solutions for enhancing 3D object detection accuracy based on stereo vision.
This paper focuses on refining 3D object detection through stereo vision, harnessing its innate correspondence between stereo point clouds and images for seamless feature fusion. This fusion enhances the interpretability of stereo data, which is pivotal in improving 3D object detection accuracy. The proposed feature attention module quantifies feature importance, which could aid in the design of feature fusion methodologies. This study delved into both local and global feature fusion levels, categorizing methodologies into 2D-3D (local) and 3D (global) approaches. The primary contributions of this work are as follows:
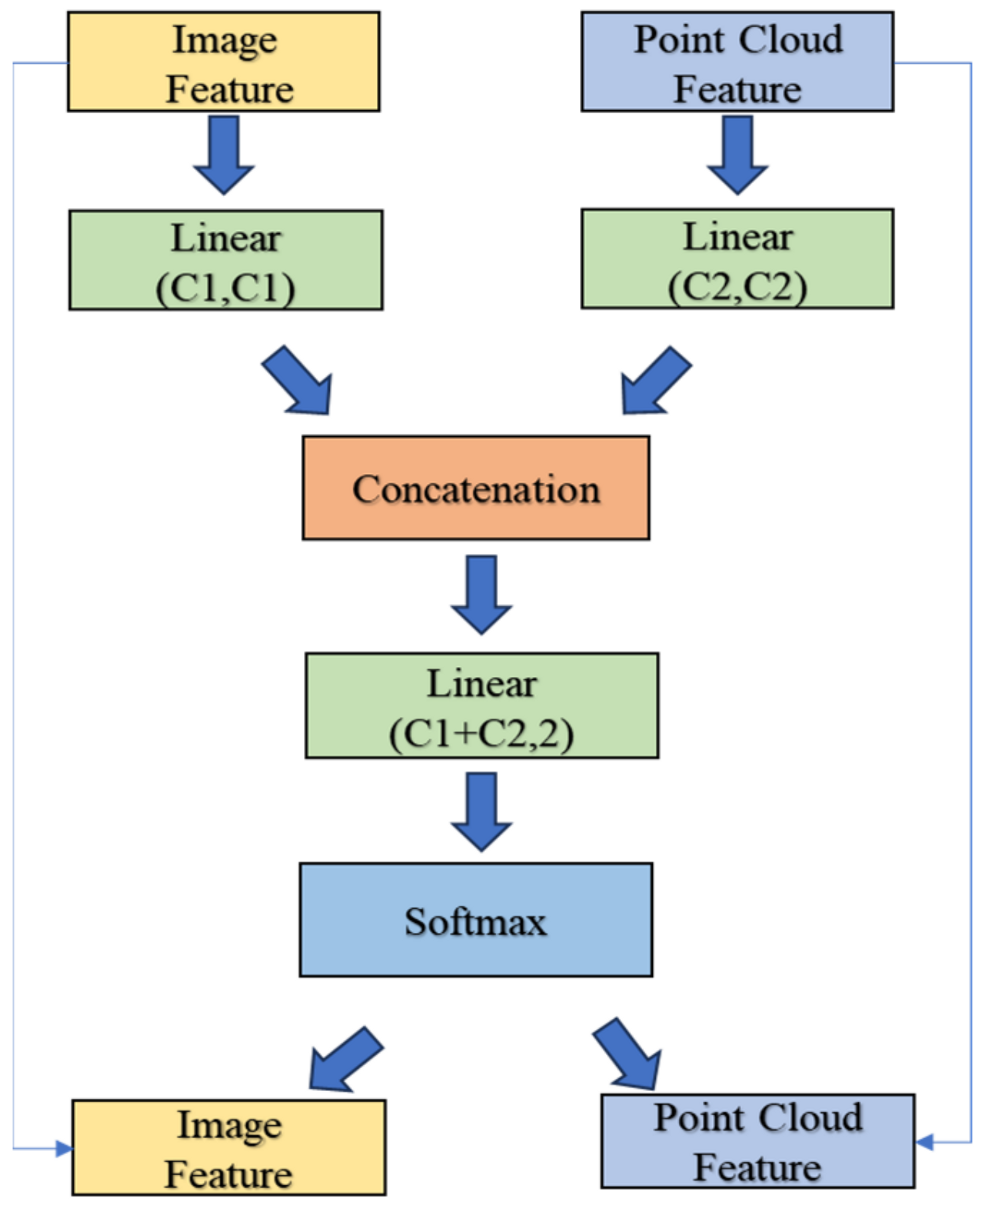
  • Our proposed feature attention module aims to facilitate feature fusion by evaluating the significance of stereo point cloud and image features across diverse models. This module effectively analyzes feature weights, offering targeted insights for model enhancements.
  • Utilizing our feature attention module, we scrutinized the relevance of stereo point cloud and image features within the local area of the PatchNet [4] model. This analysis sheds light on the impact of image segmentation methods.
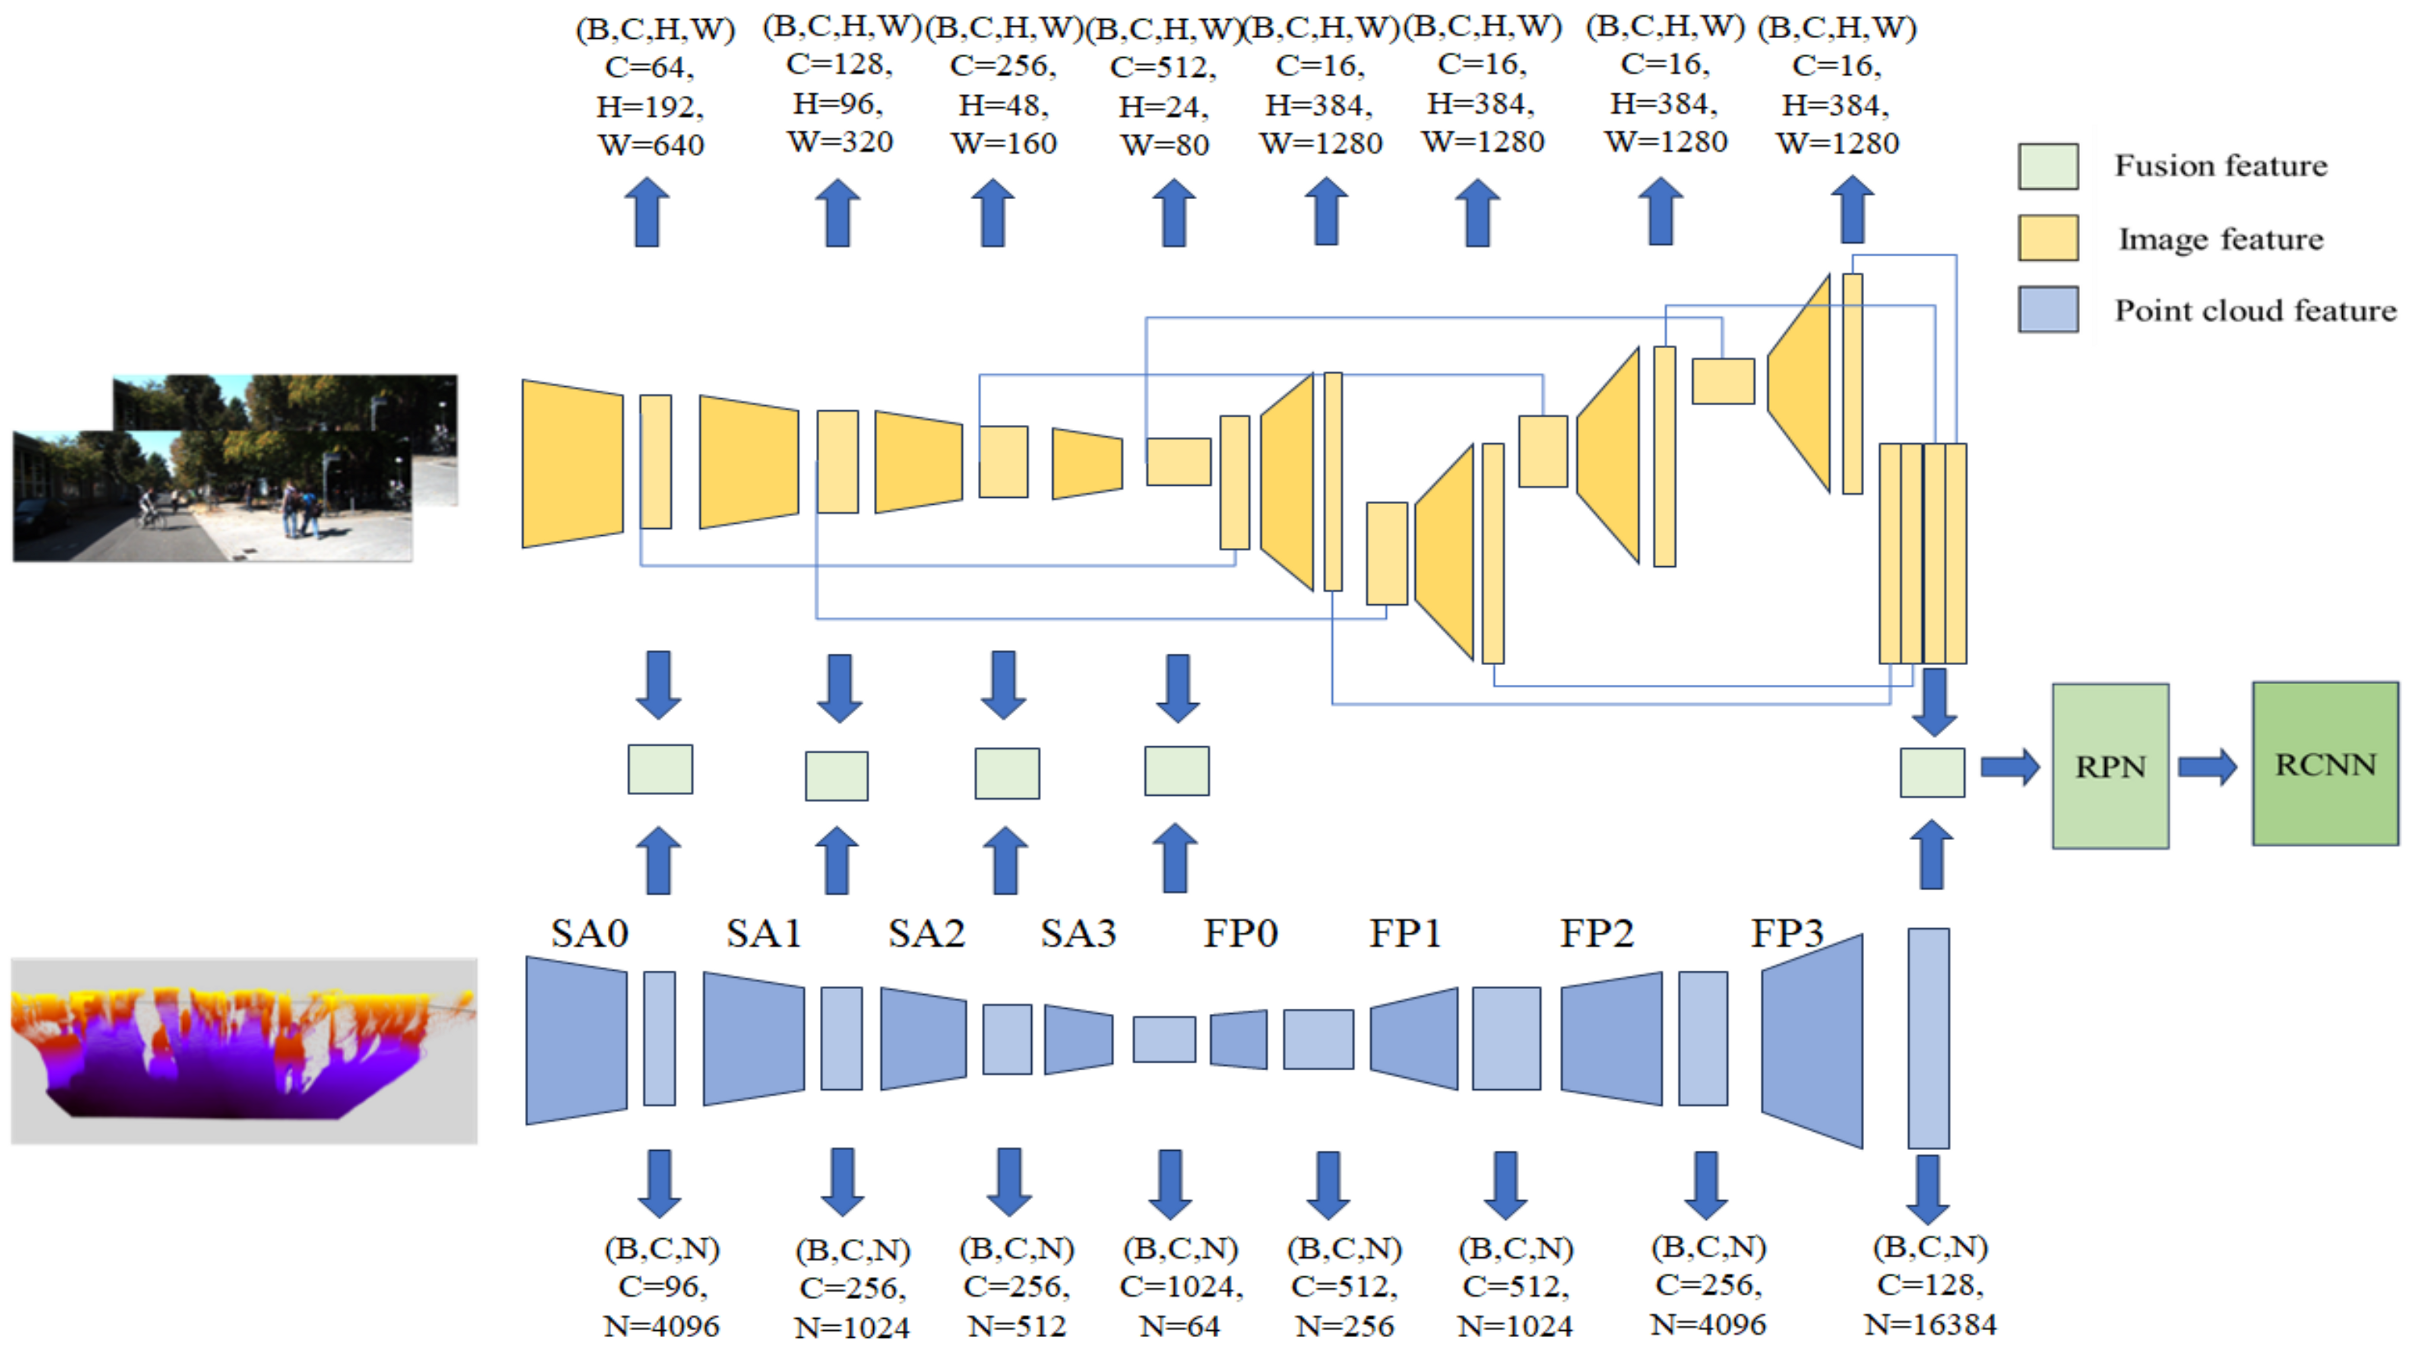
  • Employing the feature attention module, we delved into the importance of point cloud and image features within the local realm of the Pseudo-Lidar FpointNet [5,6] model. Additionally, we devised a category-based feature reweighting module to address declining foreground–background segmentation accuracy.
Our study extend the analysis of point cloud and image feature importance across different layers of the Pseudo-Lidar EPNet [5,7] model. This exploration involves designing a strategy for optimizing model parameters in layered models within the global fusion approach. Furthermore, we examined the role of image features in false detections and missed detections.

2. Related Work

2.1. Stereo-Based 3D Object Detection

The point cloud obtained using methods such as disparity estimation is not as accurate as the point cloud obtained using lidar. On the one hand, researchers are trying to improve the effect of disparity estimation to obtain more accurate point cloud data, and on the other hand, they are improving the detection effect of the model by studying methods that are more suitable for binocular 3D object detection. In this paper, we will focus on improving the method for 3D object detection rather than disparity estimation.
One idea for stereo 3D object detection is to obtain the position information corresponding to the image through disparity estimation and coordinate conversion and then finishing the 3D object detection. Chen et al. [8] referred to the method of the Faster R-CNN model [9] and designed a dual stream model based on RGB-D information, which extracts features from image and depth information, respectively, and completes the detection task after concatenation. Similarly, Xu et al. [10] used a two-step fusion method, concatenated the depth estimation feature map and the original image feature to complete the first feature fusion using a 2D proposal network, and then, based on the original input and the point cloud feature at the corresponding positions, completed the second feature fusion, thereby achieving 3D object detection. Wang et al. [5] first proposed the pseudo-lidar method, using networks such as DispNet [11] and PSMNet [12] for disparity estimation, and using models such as AVOD [13] for detection. On this basis, You et al. [14] improved the model’s architecture and loss function to improve the model’s detection performance on distant objects. Cheap but sparse lidar sensors and depth propagation algorithms were used to reduce the bias of depth estimation, further improving the detection effect of the model. Ma et al. [4] compared the detection effects of three-channel form data and point cloud form data. They found that the representation form of the data was not the decisive factor in the detection effect; rather, the decisive factor was the coordinate conversion process from the image to the three-dimensional space. When three channel features are processed together with 2D convolution, the model can achieve the same detection effect as point-by-point convolutional networks such as PointNet [15] and PointNet++ [16]. From this, the authors concluded that coordinate transformation rather than point cloud representation is the key to detection. The authors proposed the PatchNet model, which extracts features using 2D convolution, foreground and background segmentation masks, and feature maximum pooling masks to better filter useful information, and achieved excellent detection results. Garg et al. [17] researched the impact of discrete disparity distributions on object detection and the problem of depth inconsistency that easily occurs at object boundaries and proposed a disparity estimation method based on Wasserstein distance, which outputs arbitrary discrete values during the disparity or depth estimation process. To improve the accuracy and detection performance of the point cloud, Guo et al. [18] applied the distillation model to stereo 3D object detection, using the features extracted by lidar in 3D object detection as learning objects, and learned their feature representation and detection results to improve detection accuracy. D. Pon et al. [1] proposed a frame-associated object-centered stereo matching 2D detection algorithm that only performs disparity estimation on the object of interest. Sun et al. [2] observed the disparity estimation accuracy problem in low-texture areas or non-Lambertian surfaces and found that foreground objects occupy less space than background objects; they performed 2D object detection and segmentation on the images, and performed instance-level disparity estimation and 3D object detection guided by class-specific object shape priors. Xu et al. [19] proposed an adaptive scaling method that adjusts the size of the 2D instance bounding box to a unified resolution based on 2D object detection and adjusts the camera parameters accordingly to better detect objects at different distances and obtain high-quality disparity estimations.
Another idea is to perform stereo 3D object detection based on images. Qin et al. [20] proposed the TLNet model, based on the triangulation principle, which constructs object-level correspondence through 3D anchor boxes and regions of interest. At the same time, a channel reweighting strategy weakens the impact of noise. Similarly, Li et al. [21] extended Faster R-CNN [9] and used the idea of anchor boxes to perform 3D object detection. They used anchor points to associate the bounding boxes on the left and right images and proposed the Stereo R-CNN model. Coarse 3D bounding boxes are predicted via anchor points and key points and refined via photometric alignment.

2.2. Feature Fusion Strategy for 3D Object Detection

Researchers have studied the problem of improving the 3D object detection performance of multi-view or multi-modal information, and there are three main methods for information fusion: (1) early fusion, where the fusion of data occurs before feature extraction; (2) late fusion, where fusion is performed after extracting features from data of different modalities or perspectives; (3) deep fusion, where features of different scales are merged in the process of extracting features from image and point cloud data. Many researchers studied the important role of image information in point cloud-based detection methods. For example, F-PointNet [6], proposed by R. Qi et al., first performs 2D detection on the image and then uses the Frustum PointNet model based on the 2D detection results to perform regression of the 3D object box.
Chen et al. [22] studied the problem where the model partially relies on manually inputted features when generating 3D candidate boxes. They combined the top view and front view of visual and lidar information, applied 2D convolution to generate 3D candidate boxes, and proposed the MV3D model. The corresponding experiments were conducted using three kinds of fusion methods. Ku et al. [13] were inspired by the MV3D model and found that BEV and image views are sufficient to interpret the 3D space well. They proposed the AVOD model, which removed the point cloud front-view processing branch and used an FPN (feature pyramid network) [23] to extract features from images and point clouds from top views, to crop out corresponding areas from the two feature maps, and to conduct feature fusion. The proposed candidate boxes are fused again, and the detection results are obtained. The model reduces the amount of calculations required while ensuring estimation accuracy. Liang et al. [24] designed a continuous fusion layer and the ContFuse method, using a deep parameter continuous convolution network to fuse multi-scale image features into the multi-scale features of the BEV view and perform detection. Xie et al. [25] found that fusion based on a point cloud from a top view and other perspectives will have insufficient accuracy due to the corresponding ambiguity in the fusion process. Based on ContFuse, the point coordinates of the BEV view were improved into the three-dimensional space representation of the point. Using the image as additional information and using the subnetwork for segmentation, the point cloud is projected onto the image to obtain the segmentation result corresponding to the point cloud to obtain the semantic information of the fused image, and, with the help of a learnable MLP (multi-layer perception), can fuse the features of adjacent points to form an attention mechanism for adjacent features. Huang et al. [7] improved the model based on Point R-CNN [26] and proposed the EPNet model, which applied the additive attention mechanism to the deep fusion of features from point cloud and image data to improve the fusion effect.

3. Methodology

3.1. Feature Attention Module

For feature fusion problems, researchers often use feature addition or concatenation to design attention modules [7,27,28,29]. Since the importance of different features in the model often differs in different tasks, using the attention mechanism to complete the feature fusion process can make different features better adapted to the needs of the task. At the same time, because the attention mechanism has the characteristic of interpretability, it can help us analyze the necessity and function of different features in the application process so as to form a deeper understanding of the problem and make reasonable improvements and optimizations to the model. However, additive attention is more suitable for features with the same semantic information. In 3D object detection problems, point cloud features represent position information, and image features represent semantic features. The direct addition of the two features will cause the position information to blur the semantic information. Therefore, in this study, we designed a feature attention module, as shown in Figure 2, and conducted research using three different models. The module performs linear layer encoding on the original point cloud feature and image feature. After concatenating them together, an added feature dimension is encoded to two by the linear layer. Finally, the features are scaled with the result of the Softmax activation function. Thus, for each point cloud or pixel, we can obtain the weight of the point cloud and the weight of image. And, by weighing the pixel-by-pixel point cloud and image features of the research object, obtaining a sum for the point cloud and image features, and dividing them by the number of point clouds or the total number of pixels of the object, respectively, the feature weights of the two parts expressed in numerical form can be obtained. And, we obtain an average for all the scenes in the dataset. In this way, the fusion process of the two parts of the problem can be better analyzed and understood, and the model can be reasonably improved.

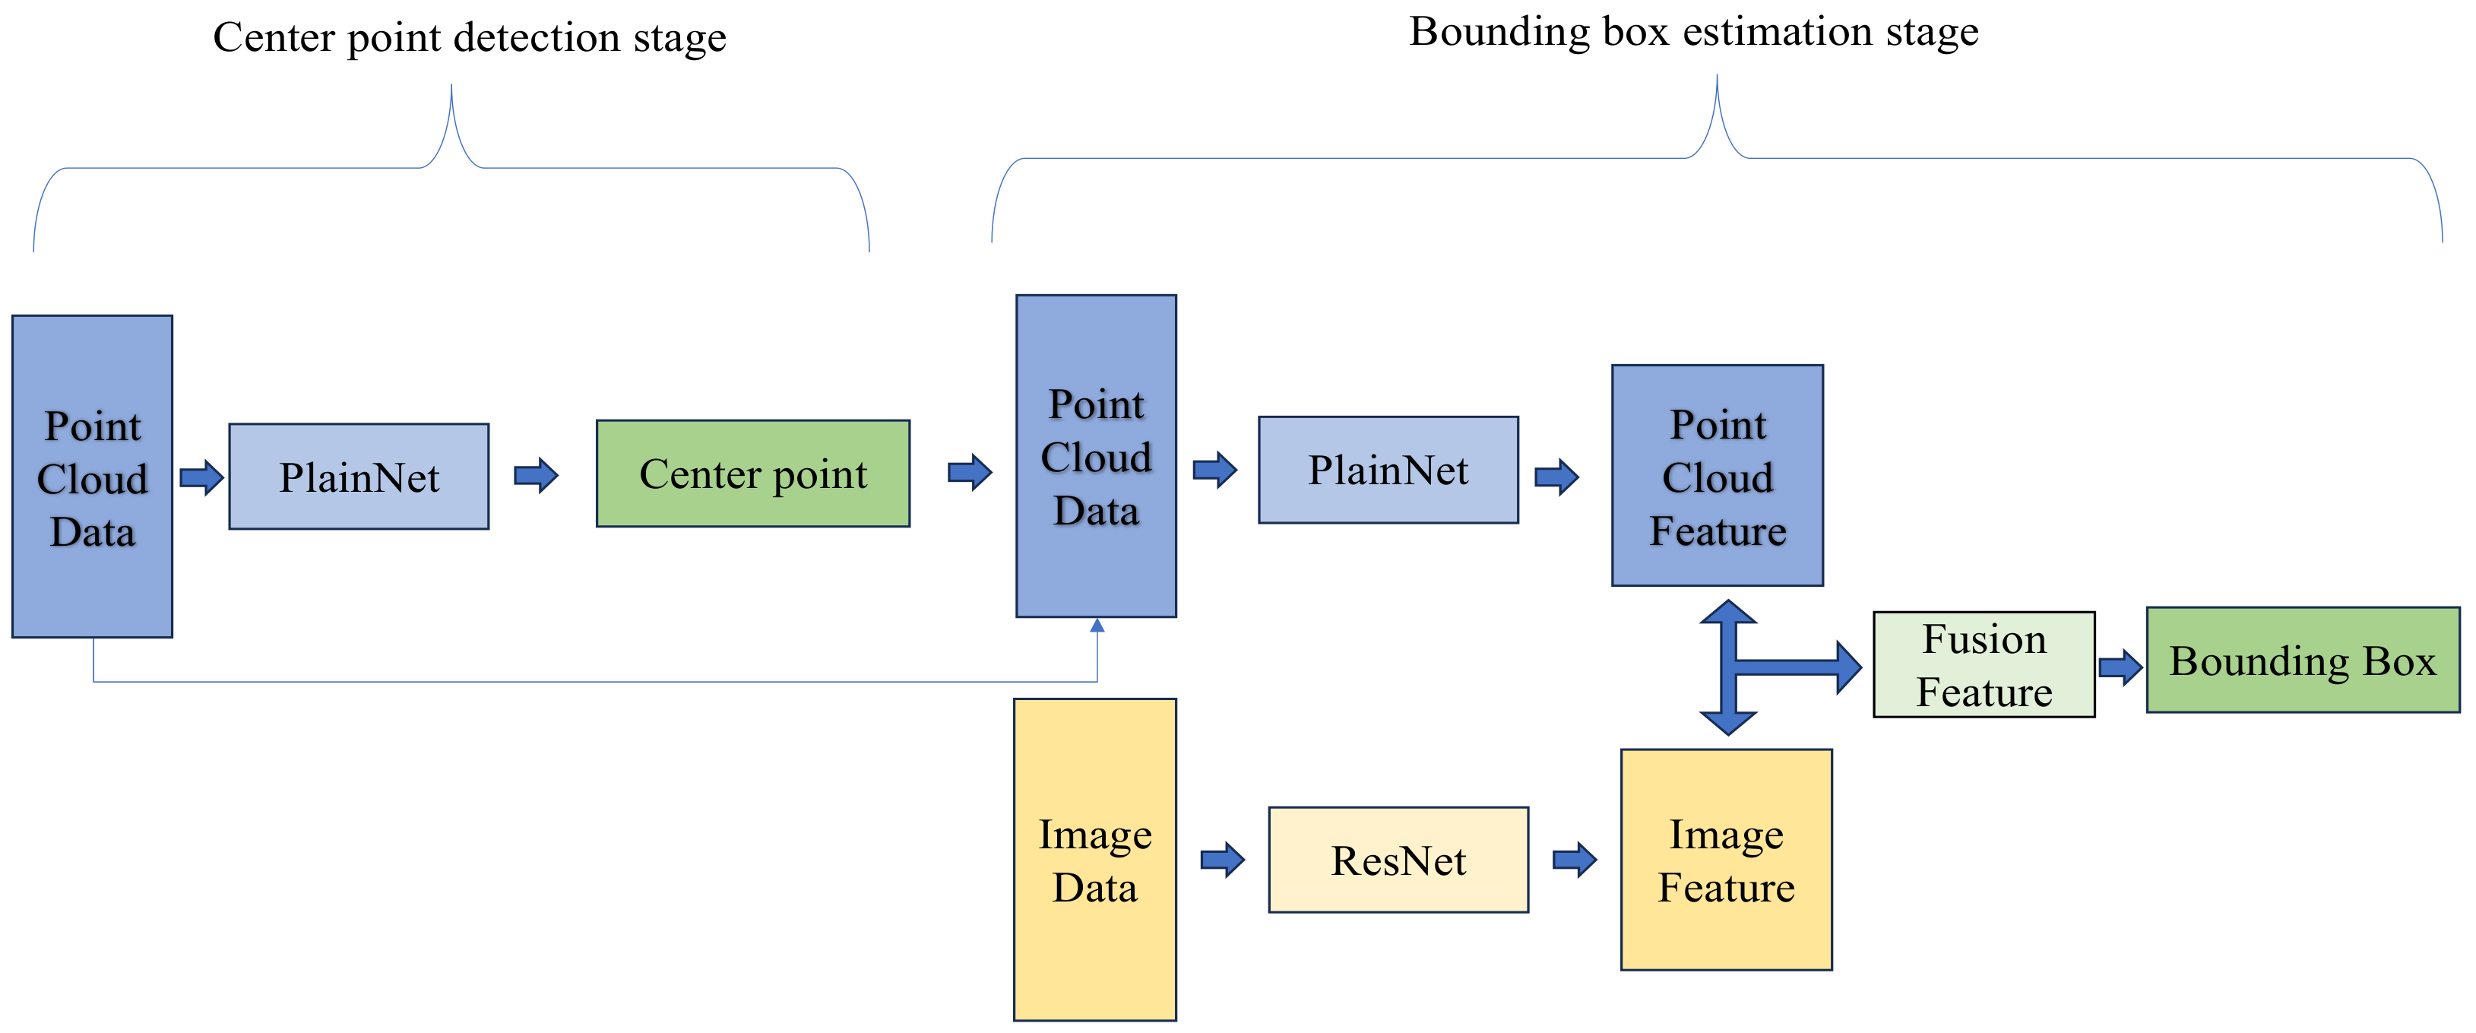
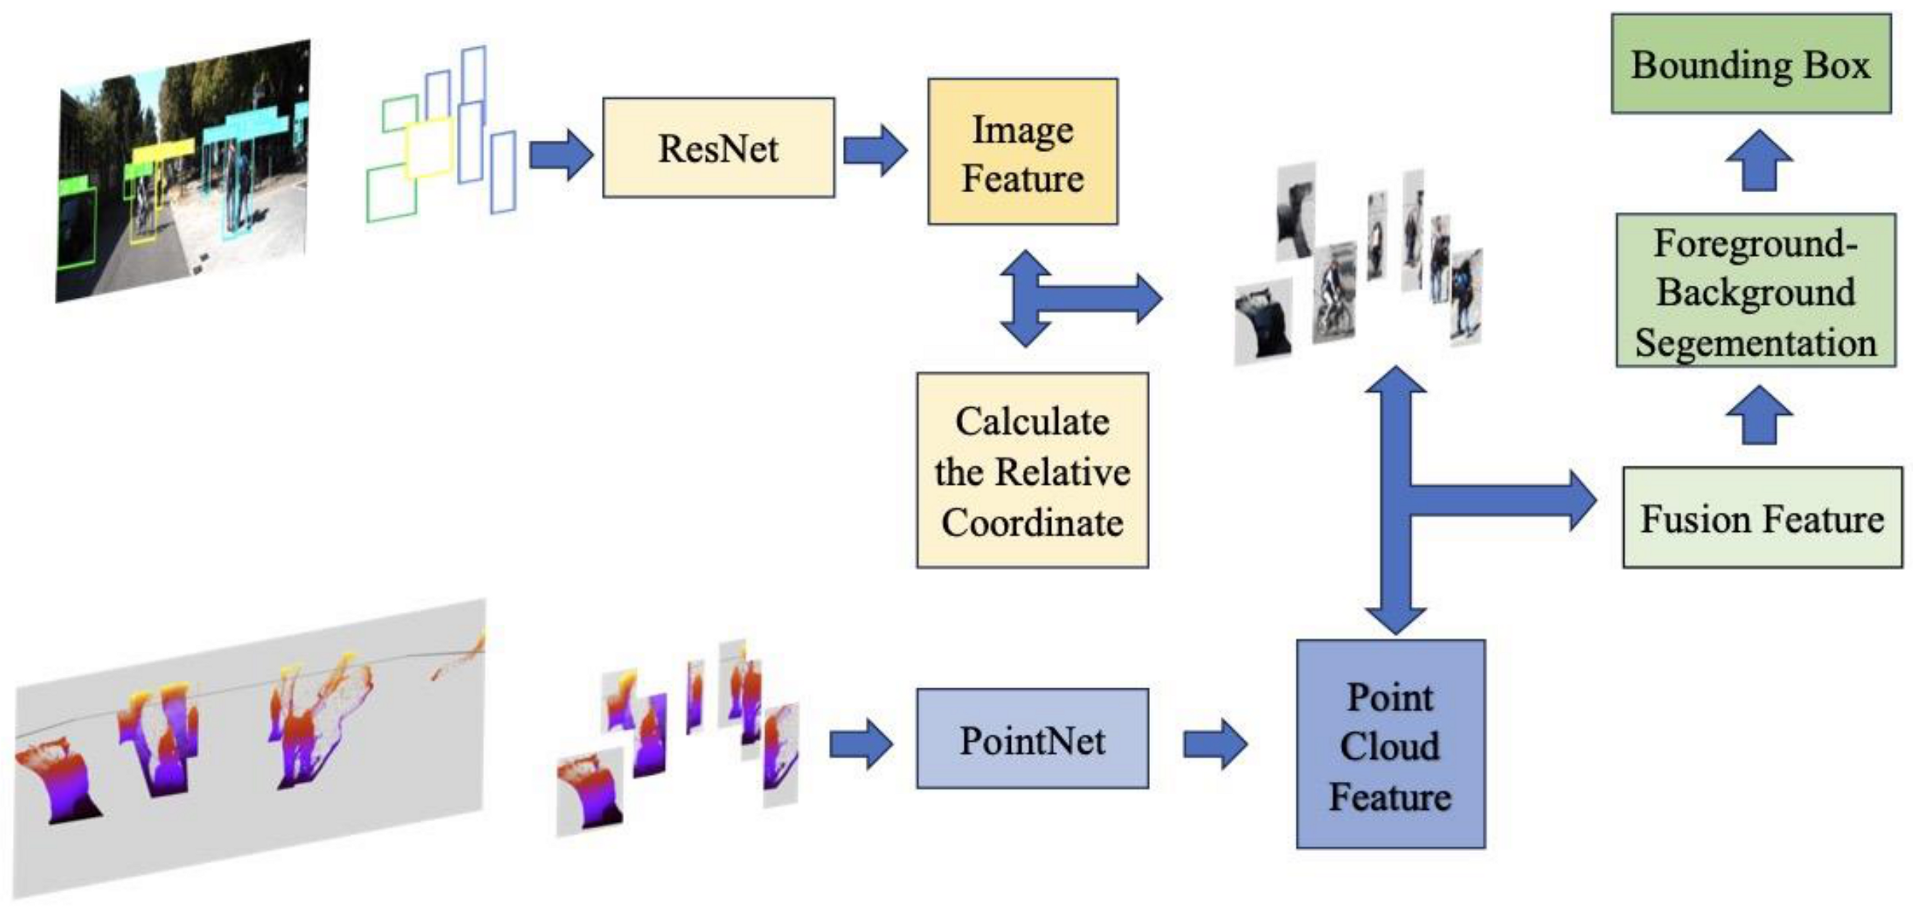
3.2. Basic Model and Feature Fusion Method

PatchNet, proposed by Ma et al. [4], is a 3D object detection model in the form of pixel-by-pixel correspondence splicing. The data are organized in the form of a three-channel point cloud, as shown in Figure 3. The RGB and XYZ information are in a one-to-one correspondence. PlainNet in PatchNet is a model that represents a network with equivalent functions to the PointNet [15] network but in the form of 2D convolution. The model performs feature extraction through the PlainNet network, and then uses the features extracted by PlainNet to perform regression of the center point and bounding box through the linear layer. This study performed late fusion of the model, that is, we used the ResNet network to extract features from three-channel picture blocks. The extracted features are concatenated with the point cloud features extracted by PlainNet in the bounding box estimation stage, and then bounding box regression is performed, as shown in Figure 4. In the bounding box regression step, we followed the work of Ma et al. [4]. Thus, we made three heads with the same structure. They differed only in learned parameters for handling the boxes of different distances. For the sequence of linear layers, the channel number varied from 643 (512 for point cloud features, 128 for image features, 3 for categories) to 128. Finally, a linear layer changed the channel from 128 to the learnable parameter number of the bounding box.
Because the image and point cloud data are in pixel-by-pixel correspondence form, the fusion process of the PatchNet model [4] is more straightforward. However, for most detection models, the data are mostly organized in the form of unordered point sets, not in the three-channel form corresponding to the image. Among the 2D-3D methods, the F-PointNet model [6] is representative and is the second model we leveraged to study the fusion problem in this paper. It is based on the F-PointNet model in the framework provided by Ma et al. [4]; the feature fusion process is shown in Figure 5.
The F-PointNet model has a module called foreground–background segmentation, which classifies the point as either foreground or background. Then, the regression can be carried out based on the classification results. Considering that the role of image semantics may be more important in the foreground and background segmentation stage based on point clouds, this module was chosen for feature fusion. In the data preparation stage, the image within the bounding box and the corresponding coordinates of the point cloud projected to the image are saved in the model’s read-in file along with the 2D bounding box information. When the model is reading data, the image within the detection frame is scaled into an image block of a specified size and the absolute coordinates corresponding to the point cloud in the 2D bounding box are converted into relative coordinates within the bounding box. For the conversion of the coordinates, specifically, we first use the x-coordinate and y-coordinate of the pixel projected by the point cloud within the bounding box, subtract the x-coordinate of left edge and y-coordinate of upper edge of the bounding box, then measure the size of the bounding box, and then normalize the x-coordinate and y-coordinate to [−1, 1]. With the result we obtained in the first two steps, we finally scale the coordinate of each pixel within the bounding box to a new coordinate in the image block through interpolation. Thus, the relative coordinates of the point cloud in the bounding box are obtained. The corresponding pixels in the bounding box are sampled with the specified number of sampling points (such as 1024). During the detection process, PointNet [15] is used to extract features from point clouds, and ResNet [30] is used to extract features from image blocks. The image features corresponding to the point cloud are found through interpolation, and their features are spliced with the point cloud features to complete the fusion process.
EPNet, proposed by Huang et al. [7], uses the image features and point cloud features to perform deep fusion. It is based on the Point R-CNN [26] detection model. The deep fusion method is shown in Figure 6. Four point set abstraction (SA) layers and four feature propagation (FP) layers are used to process the point cloud features. Convolution and deconvolution are used to process the image feature. Fusion is performed after each layer of SA and after the last layer of FP. The channel and size variation of the feature is shown in Figure 6. The feature fusion process of the EPNet model is carried out within the entire image, but it is designed for the fusion of the lidar point cloud and images. By projecting the lidar data back to the image, we obtain the corresponding pixel features by bilinear interpolation, and we fuse the image features with the point cloud point by point. The EPNet model fuses the image features in the form of additive attention. This article refers to the deep fusion method of the EPNet model and applies it to the problem of stereo 3D object detection, but we carried out the feature fusion process with our feature attention module, not with the additive attention.

3.3. The Usage of Feature Attention Module

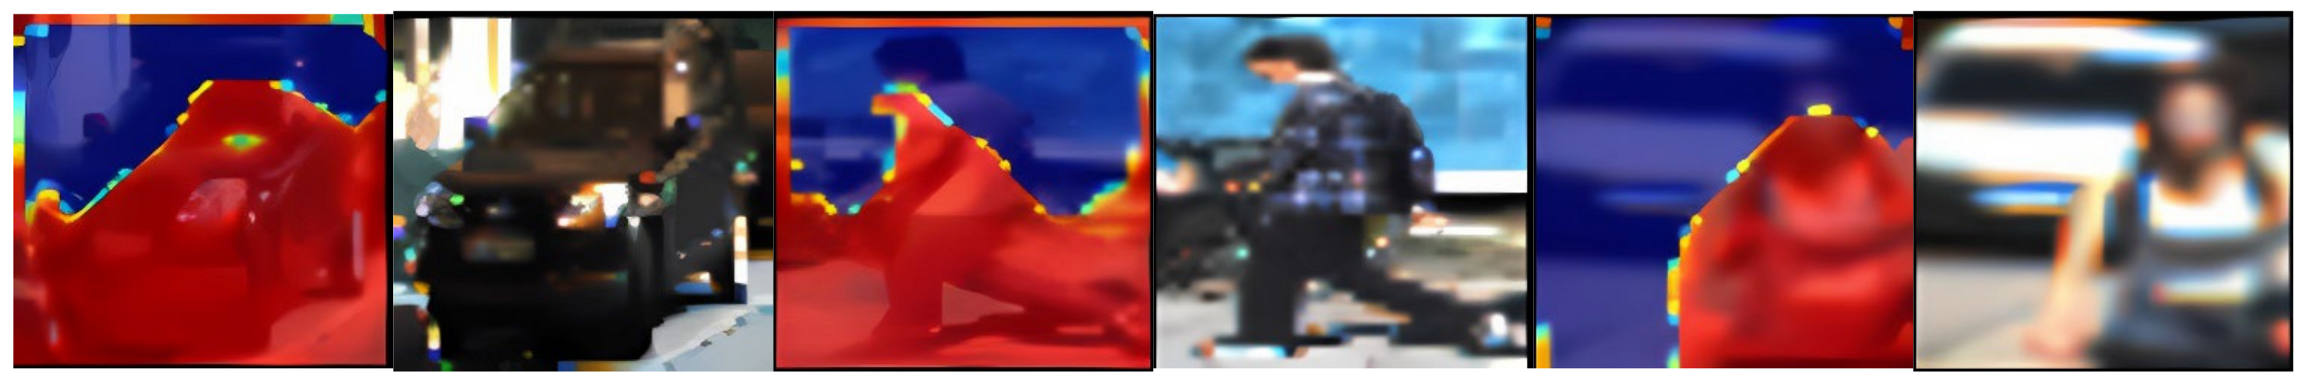
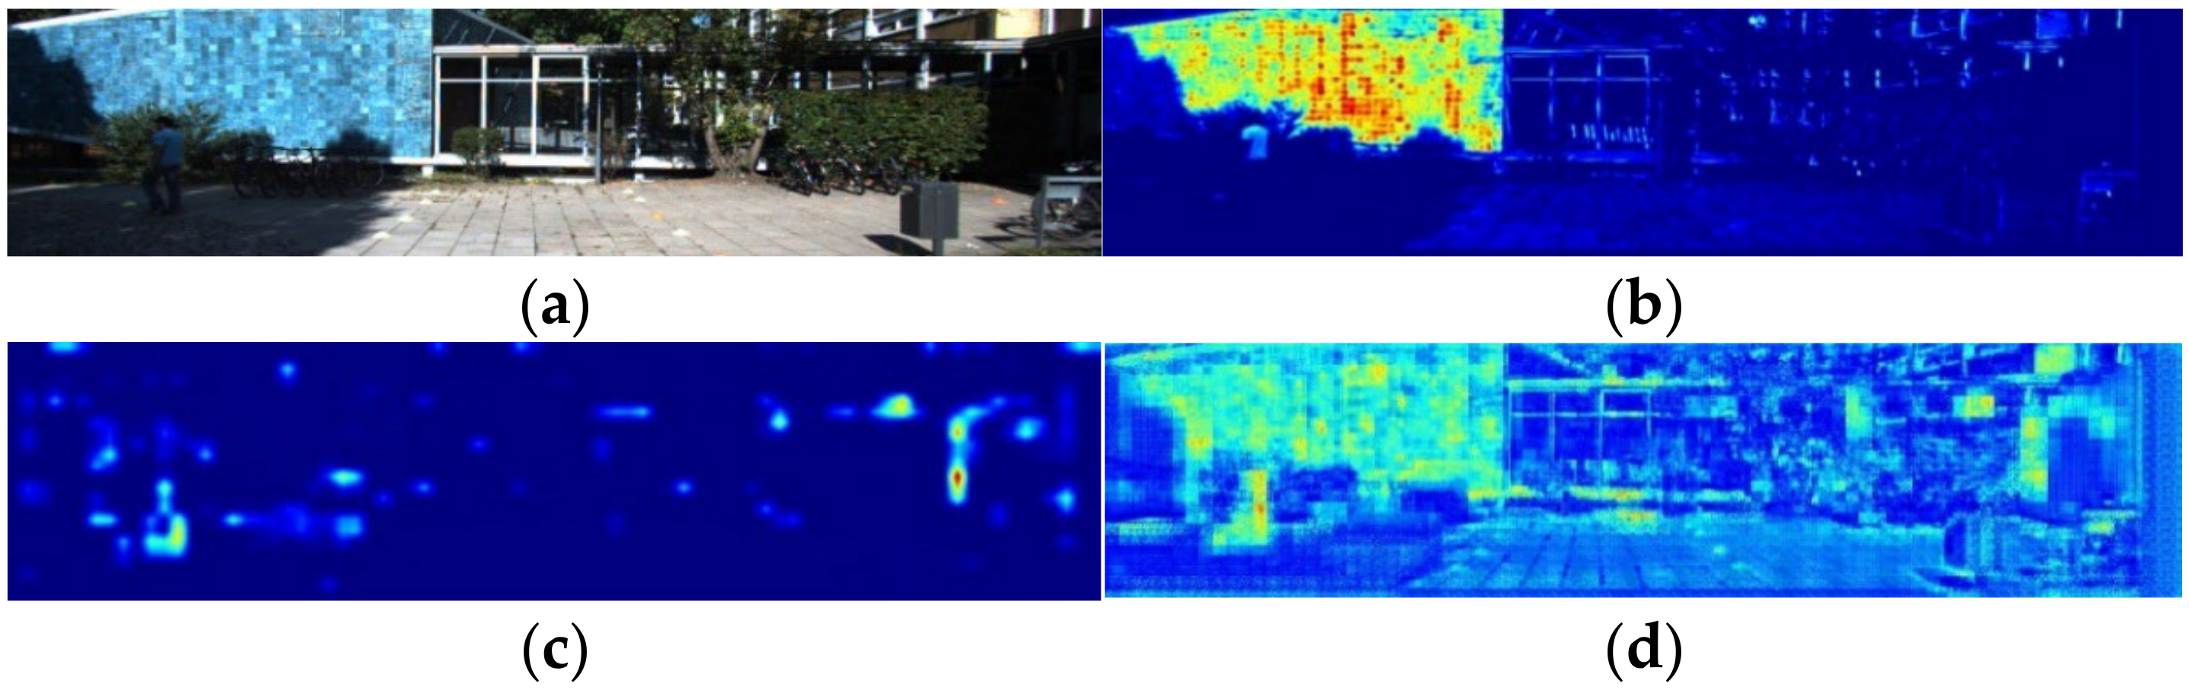
3.3.1. Interpretability of Image Segmentation with the Feature Attention Module

Firstly, we used the feature attention module to study the weight distribution in the feature fusion process. This was carried out to reasonably explain issues such as the importance of features. In the research related to the interpretability of the attention mechanism, the attention mechanism represents the importance of features to a certain extent. By numericizing and visualizing the feature weights in the fusion, the feature fusion problem can be better understood. The image-based segmentation method is not included in the models compared in this article, but through our research process, we can reasonably explain why the segmentation method is effective in the gain effect of the model.

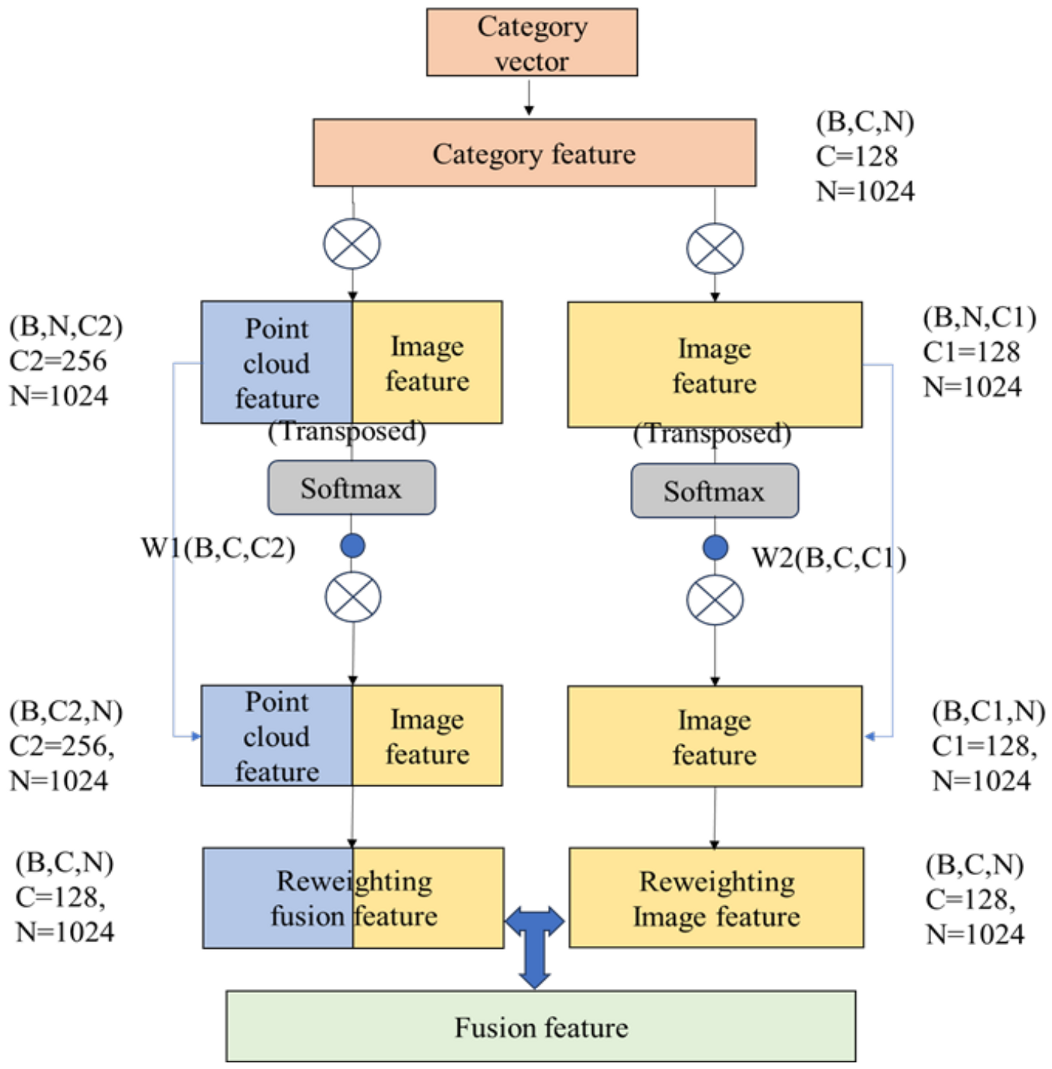
3.3.2. Design of Category Reweighting Module

In this study, in the feature fusion process of the PL-FP (Pseudo-Lidar F-PointNet) model [5,6], we found that although the feature fusion method helped improve the detection performance, its segmentation accuracy in the foreground and background segmentation module decreased. This may occur because, for the original design, without the help of image features, the category feature was directly concatenated with the point cloud feature, but for the feature fusion process, we did not use category information and only used point clouds and image features. It is difficult to distinguish some categories from the used data in some circumstances, such as a pedestrian and cyclist, so the accuracy of this module may be reduced. Thus, we hope to try to explicitly apply the category information obtained in 2D detection to enhance the difference in model weights during the object detection of different categories. In the explicit use of category information in the original paper of F-PointNet [6], the category information is presented in the form of one-hot vectors and is spliced and fused with the extracted point cloud features using one-dimensional convolution during the foreground and background segmentation process. In our work, we encoded the one-hot category vector with a linear layer and repeated the feature vector according to the number of point clouds to form a feature with a shape of (B, C, N) (B represents the number of batches, C represents the feature dimension, and N represents the number of point clouds) where C is consistent with the image feature dimension C1. After the feature weight analysis process, taking into account the important relationship between the image features and the foreground area, we concatenated the image feature and point cloud feature, and the dot product attention was used for the image–point cloud fusion feature and the image feature. The detailed design of the reweighted module is shown in Figure 7. Compared with the one-hot category feature directly concatenated with the fusion feature, the accuracy of segmentation was improved.

3.3.3. Parameter Optimization Strategy of the Global Fusion Method

In the process of solving 3D object detection problems using point cloud and image feature fusion strategies, the different perspectives of correspondence features play an important role that affects the detection effect [31,32]. Some models adopt the point cloud form of a bird’s-eye view during the process of fusion with image features; it is easy to produce fuzzy correspondence problems when using a front-view and bird’s-eye view point cloud at the same time [13,31,32]. The AVOD model [13] is a typical work on the fusion of point cloud and image features using the form of a bird’s-eye view. Another kind of work is point-by-point corresponding point cloud models, such as Point R-CNN [26]; it has a natural one-to-one correspondence when fused with image features. However, the density of binocular point clouds is far greater than that of lidar data. For this kind of model, we directly used three-dimensional point cloud data, making the parameter amount and calculation amount of the model relatively large. Adding image features increases the calculation burden to a greater extent, so the model has deficiencies in terms of calculation amount, flops, etc. In order to reduce the number of parameters and the computational burden of the model, this research used the feature attention module to observe the feature weights in the fusion process at each level of feature fusion based on the EPNet [7] model. In the experimental process of hierarchical fusion, in addition to adjusting the parameter amounts, by analyzing the feature weights and their fusion detection effects, we can obtain a more in-depth understanding of the role of global and local image features in the fusion process. The improvement using the feature fusion method model is significant.

4. Experiment

4.1. Dataset

This study mainly used KITTI’s 3D object detection dataset [33] to carry out experiments. Following the protocol of prior works [1,2,4,5], this study used 3712 and 3769 sets of image data as the training set and validation set from the training data of KITTI’s 3D object detection dataset and used the depth map generated by the PSMNet [12] model provided in the work of Ma et al. [4] to generate a stereo point cloud through the coordinate conversion formula.

4.2. PatchNet Local Fusion and Model Interpretability

This study used the depth estimation results obtained by the PSMNet model [12] provided by Ma et al. [4] as the source of stereo point cloud data and trained 100 epochs using the frame of the PatchNet model. The model used 0.001 as the initial learning rate, which decayed at a rate of 0.1 at the 40th and 80th epochs. Because the late fusion method has the most significant fusion effect, the feature attention module was inserted during the late fusion process to observe the feature weights. The feature weights of the two parts expressed in numerical form were obtained. The feature fusion method was explained based on the weight and visualization results.
Referring to the official evaluation method of the KITTI dataset, the object to be detected was divided into three difficulty levels (Easy, Moderate, and Difficult) based on the size of the object to be detected in the image, degree of occlusion, etc. The Table 1 shows the detection accuracy of bird’s-eye view (BEV) perspective/3D view of the original PatchNet model and PatchNet with late fusion.
With the comparison of detection based only on the point cloud and with late fusion strategy, we can see that the detection of small objects (Pedestrian and Cyclist) has clearly improved. After that, we calculated the weight of different features by using our feature attention module; the results can be seen in Table 2.
We can see that the image feature weight of small objects was evidently higher than that of cars. We then visualized the results. We made a figure to depict the feature weight distribution (Figure 8). The red color represents the area where the point cloud has a higher weight than the image, and the blue color represents the area where the image weight is higher than that of the point cloud. We can see the two kinds of feature weight distributions. The important image feature area is represented by the blue color, which correlates with the position and contour of the objects in the image block. For small objects, due to their small area in the image, the area and weight of the image features will be relatively large. We analyzed the reason behind this phenomenon. Specifically, since the objects must be detected and located by the point cloud feature, the main part of the objects always has a higher point cloud weight. Given that the image can help us better locate the object’s position in the image and distinguish the foreground and background area, the image feature occupies the background area, near the outline of the objects. And, as discussed in Section 1 of this article, the gain effect of the image segmentation method on 3D object detection can be discussed. The area and contour information of the object obtained from images play an auxiliary role in 3D object detection, although we did not make a segmentation for the image, the image feature tends to outline the object, and we can understand that the image segmentation method can have an evident function in stereo 3D object detection, as confirmed by other works [1,2].

4.3. Pseudo-Lidar F-PointNet Local Fusion and Improvement Strategy

In this part of the experiment, this study carried out feature fusion in the foreground and background segmentation module of Pseudo-Lidar F-PointNet [5,6]. Based on the fusion method described in Section 3.2, training was performed for 100 epochs, the model used 0.001 as the initial learning rate which decayed at a rate of 0.1 at the 40th and 80th epochs, and we only compared with the model with the point cloud data; the experiment results are shown in Table 3. We obtained the bird’s-eye view/3D detection accuracy of the three categories. During the experiment, for each object to be detected, a total of 1024 points in the foreground and background were selected, of which 512 points were sampled (downsampled or resampled) in the foreground area.
For point cloud data in the form of pseudo-lidar, the feature fusion was performed in the foreground–background segmentation module, and the detection effect was improved to a greater extent. Our first guess for why this occurred is that it is related to the important impact of image semantic information on the segmentation module. For the three categories, the detection results were significantly improved. Similarly, for the segmentation module, this study used the feature attention module to observe different feature weights within the image block. We inserted it into the feature fusion module, obtained the sum of the weights of two kinds of features, divided this by the number of the point cloud, and then obtained the average of all the scenes in the dataset. The results are shown in Table 4. And, we compared the distribution of features that are more important to the point cloud between the two kinds of features. The distribution was visualized, as shown in Figure 9.
For the image block shown in Figure 9a, the area with a higher proportion of point cloud and image features is shown in Figure 9b, where the points with a higher image weight are colored, and the points with a higher point cloud weight are shown in white. The foreground and background segmentation results from the ground truth are shown in Figure 9c, where green represents the area segmented as foreground, and white represents the area segmented as background. After comparing Figure 9b,c, we found that the area with a higher proportion of image features shown in Figure 9b and the foreground result of the foreground–background segmentation shown in Figure 9c show a similarities. The area in Figure 9b,c is the location area automatically determined in the Cloud Compare tool. Their similarities and differences can be observed from three different perspectives, as shown in Figure 9d–f. It is conjectured that there is a correlation between the weight of image features and the foreground point clouds in the foreground and background segmentation. So, the proportion of foreground point cloud was also counted. Specifically, we divided the number of foreground point clouds by the total number of point clouds. The results are shown in Table 5.
We found that the proportion of the point cloud number in the ground-true foreground area among the 1024 points is relatively consistent with the proportion of image features with higher weights. Because the foreground area is an important research object in the detection process, according to the heuristic experience, we counted the point cloud weight and image weight in the foreground point cloud. Specifically, within the point cloud in the foreground area, there were point clouds with a higher point cloud weight and higher image weight. By counting the proportion of points with higher point cloud weights and image weights in the ground-true foreground point cloud (Table 6), we found that the image features account for a relatively high proportion in the foreground area, especially for small objects, which also confirms that image features play an important role in the foreground and background segmentation module.
On the other hand, we found that although the detection accuracy was improved with the help of the fusion method, the segmentation accuracy of the foreground and background segmentation module decreased. Combining the existing experimental results, we concluded that the lack of category information in the fusion process was the cause of this significant result.
This conclusion can be understood through the problem shown in Figure 10. As shown in Figure 10, since the pedestrians in Figure 10a partially overlap with many bicycles, the foreground and background segmentation effectiveness becomes worse. In the process of foreground and background segmentation of objects using only feature fusion methods, the lack of category information leads to deficiencies in the foreground and background segmentation stage. The ground-true segmentation result is shown in Figure 10c, and the segmentation result after feature fusion is shown in Figure 10d where white represents the background point cloud, green represents the foreground point cloud, and red represents the misjudged point cloud. We can see that this method makes the segmentation results in this situation very inaccurate, so that the regression effect of the 3D box was also obviously different from the real one. Using the category reweighting method proposed in this article, inspired by the important role of image features (structure shown in Figure 7), we can achieve better results, as shown in Figure 10e. At the same time, we used PSMNet [12] and GANet [34] as models to finish the disparity estimation and generate point cloud data. We compared the segmentation and detection accuracy of different methods, and the way in which category vectors were directly concatenated with fused features. We used the small object as the research object, as shown in Table 7, Table 8, Table 9 and Table 10.
We can see that, with the point cloud obtained from PSMNet [12] and GANet [34], the accuracy of segmentation accuracy was improved with our method, and it obtained a good detection performance in most circumstances. The fusion method of directly concatenating with the category vector has an evident disadvantage in pedestrian detection, and the fusion with the reweighting module has better results than the method of feature fusion without the category vector. We compared the detection accuracy results with the other method for stereo object detection without the aid of lidar. Following other works, we used PSMNet [12] as our disparity estimation model to generate the point cloud. We were able to obtain a comparable effect for small objects. In addition, we made the point cloud–image fusion and image segmentation strategy optional in the method, and only referred to the method with image segmentation, as it’s shown in Table 11 and Table 12. We can see from the table that, although the reproduction result of PL-FP in our work had a lower detection accuracy compared with the original paper, our feature fusion method can achieve a good result compared with the other methods. For the pedestrian category, our method outperformed all the other methods in the comparison, even the methods using image segmentation.

4.4. Pseudo-Lidar EPNet Global Fusion and Model Compression Strategy

In this part of the experiment, we used the depth map obtained from the work of Ma et al. [4] to generate the point cloud of the whole scene. Based on the EPNet model proposed by Huang et al. [7], 80 epochs were trained with a learning rate of 0.002. We used the pedestrian as the research object. Firstly, the feature attention fusion method proposed in this article was compared with the detection without fusion and the detection using additive attention fusion, i.e., PL Point R-CNN [26] and PL EPNet [7], as it’s shown in Table 13. We were able to obtain a better result with the feature attention fusion method of this article.
We then compared the results with other models without the aid of lidar, and only referred to the method with image segmentation. Our model outperformed all the other methods in the comparison (Table 14).
Then, we used our feature attention module to observe two feature weights at different fusion levels. The feature weight distribution results are shown in the Table 15.
We found that for the pedestrian category, the image features occupy a greater weight on the feature immediately following the third layer of the SA module, while the point cloud features occupy the main weight on other levels. The image features occupy a certain weight on the feature after zeroth layer of the SA module and after the last layer of the FP module. Then, we visualized the feature map of the layer which has image features with the main weight and certain weight, as shown in Figure 11. We were able to find that the feature immediately following the zeroth layer of the SA module and the feature immediately following the last layer of the FP module presented the local features of the image, while the feature immediately following the third layer of the SA module presented the global features of the image.
Since this method has disadvantages in terms of model parameters and calculation amount, this study used the obtained feature weights and referred to some existing methods [36,37] of channel pruning using attention mechanisms to perform fusion of different layers. We performed feature selection for the model with the help of our module. The problem was subjected to an ablation study; the results are shown in Table 16.
We can see that with the increase in fusion levels, the detection accuracy was improved to a certain extent. Through the comparison of number 1 and number 5, we can see that the global feature had an evident effect on the increase in detection accuracy and had little effect on recall, so we can infer that the global feature is mainly helpful for the problem of false detections. Through the comparison of number 5 and number 6, we can see that the local feature was helpful in improving the recall, that is, the local feature has an effect on the problem of missed detections. With the change in fusion level, the number of parameters and flops of the model were improved to varying degrees, and the corresponding fusion method can be selected according to actual needs.

5. Conclusions

This study proposes a novel feature attention module designed specifically to address the challenge of stereo 3D object detection. Our proposed methodology leverages a concatenated attention module, enabling an in-depth analysis of feature significance during the fusion process. This analysis, in turn, empowers us to enhance the model based on the derived insights. Within this work, we explored both local and global feature fusion strategies. Within the local fusion methodology, we conducted an interpretability analysis of the image segmentation method and introduced a category reweighting fusion strategy. On the other hand, our global fusion approach encompassed a model compression strategy along with an analysis discerning the functionality of global and local features. The culmination of these methodologies results in our method achieving a competitive performance for stereo 3D object detection tasks.

Author Contributions

Conceptualization, J.H. and K.Z.; methodology, K.Z.; software, K.Z. and R.J.; validation, K.Z.; investigation, K.Z. and R.J.; resources, R.J.; data curation, K.Z. and R.J.; writing—original draft preparation, K.Z.; writing—review and editing, K.Z., R.J. and J.H.; visualization, K.Z.; supervision, J.H.; project administration, J.H. All authors have read and agreed to the published version of the manuscript.

Funding

This research received no external funding.

Data Availability Statement

The dataset KITTI was released by “Are we ready for Autonomous Driving? The KITTI Vision Benchmark Suite”, which can be downloaded from https://www.cvlibs.net/datasets/kitti/.

Conflicts of Interest

The authors declare no conflict of interest.

References

  1. Pon, A.D.; Ku, J.; Li, C.; Waslander, S.L. Object-centric stereo matching for 3d object detection. In Proceedings of the 2020 IEEE International Conference on Robotics and Automation (ICRA), Paris, France, 31 May–31 August 2020; pp. 8383–8389. [Google Scholar]
  2. Sun, J.; Chen, L.; Xie, Y.; Zhang, S.; Jiang, Q.; Zhou, X.; Bao, H. Disp r-cnn: Stereo 3d object detection via shape prior guided instance disparity estimation. In Proceedings of the IEEE/CVF Conference on Computer Vision and Pattern Recognition, Seattle, WA, USA, 14–19 June 2020; pp. 10548–10557. [Google Scholar]
  3. Li, T.; Yang, S.; Guo, Z.; Sheng, Z. Design of Monitoring System for Height Limiting Device Based on Acceleration Sensor. In Proceedings of the 2021 International Conference on Computer Engineering and Application (ICCEA), Kunming, China, 25–27 June 2021; pp. 299–302. [Google Scholar]
  4. Ma, X.; Liu, S.; Xia, Z.; Zhang, H.; Zeng, X.; Ouyang, W. Rethinking pseudo-lidar representation. In Proceedings of the European Conference on Computer Vision, Glasgow, UK, 23–28 August 2020; pp. 311–327. [Google Scholar]
  5. Wang, Y.; Chao, W.L.; Garg, D.; Hariharan, B.; Campbell, M.; Weinberger, K.Q. Pseudo-lidar from visual depth estimation: Bridging the gap in 3d object detection for autonomous driving. In Proceedings of the IEEE/CVF Conference on Computer Vision and Pattern Recognition, Long Beach, CA, USA, 15–20 June 2019; pp. 8445–8453. [Google Scholar]
  6. Qi, C.R.; Liu, W.; Wu, C.; Su, H.; Guibas, L.J. Frustum pointnets for 3d object detection from rgb-d data. In Proceedings of the IEEE Conference on Computer Vision and Pattern Recognition, Salt Lake City, UT, USA, 18–23 June 2018; pp. 918–927. [Google Scholar]
  7. Huang, T.; Liu, Z.; Chen, X.; Bai, X. Epnet: Enhancing point features with image semantics for 3d object detection. In Proceedings of the European Conference on Computer Vision, Glasgow, UK, 23–28 August 2020; pp. 35–52. [Google Scholar]
  8. Chen, X.; Kundu, K.; Zhu, Y.; Ma, H.; Fidler, S.; Urtasun, R. 3D Object Proposals Using Stereo Imagery for Accurate Object Class Detection. IEEE Trans. Pattern Anal. Mach. Intell. 2018, 40, 1259–1272. [Google Scholar] [CrossRef] [PubMed]
  9. Ren, S.; He, K.; Girshick, R.; Sun, J. Faster R-CNN: Towards Real-Time Object Detection with Region Proposal Networks. IEEE Trans. Pattern Anal. Mach. Intell. 2017, 39, 1137–1149. [Google Scholar] [CrossRef] [PubMed]
  10. Xu, B.; Chen, Z. Multi-Level Fusion Based 3D Object Detection from Monocular Images. In Proceedings of the 2018 IEEE Conference on Computer Vision and Pattern Recognition (CVPR 2018), Salt Lake City, UT, USA, 18–22 June 2018; Computer Vision Foundation/IEEE Computer Society: Washington, DC, USA, 2018; pp. 2345–2353. [Google Scholar]
  11. Mayer, N.; Ilg, E.; Hausser, P.; Fischer, P.; Cremers, D.; Dosovitskiy, A.; Brox, T. A large dataset to train convolutional networks for disparity, optical flow, and scene flow estimation. In Proceedings of the IEEE Conference on Computer Vision and Pattern Recognition, Las Vegas, NV, USA, 27–30 June 2016; pp. 4040–4048. [Google Scholar]
  12. Chang, J.R.; Chen, Y.S. Pyramid stereo matching network. In Proceedings of the IEEE Conference on Computer Vision and Pattern Recognition, Salt Lake City, UT, USA, 18–23 June 2018; pp. 5410–5418. [Google Scholar]
  13. Ku, J.; Mozifian, M.; Lee, J.; Harakeh, A.; Waslander, S.L. Joint 3d proposal generation and object detection from view aggregation. In Proceedings of the 2018 IEEE/RSJ International Conference on Intelligent Robots and Systems (IROS), Madrid, Spain, 1–5 October 2018; pp. 1–8. [Google Scholar]
  14. You, Y.; Wang, Y.; Chao, W.L.; Garg, D.; Pleiss, G.; Hariharan, B.; Campbell, M.; Weinberger, K.Q. Pseudo-LiDAR++: Accurate Depth for 3D Object Detection in Autonomous Driving. In Proceedings of the International Conference on Learning Representations, Edinburgh, UK, 4–6 September 2019. [Google Scholar]
  15. Qi, C.R.; Su, H.; Mo, K.; Guibas, L.J. Pointnet: Deep learning on point sets for 3d classification and segmentation. In Proceedings of the IEEE Conference on Computer Vision and Pattern Recognition, Honolulu, HI, USA, 21–26 July 2017; pp. 652–660. [Google Scholar]
  16. Qi, C.R.; Yi, L.; Su, H.; Guibas, L.J. PointNet++ deep hierarchical feature learning on point sets in a metric space. In Proceedings of the 31st International Conference on Neural Information Processing Systems, Long Beach, CA, USA, 4–9 December 2017; pp. 5105–5114. [Google Scholar]
  17. Garg, D.; Wang, Y.; Hariharan, B.; Campbell, M.; Weinberger, K.Q.; Chao, W.L. Wasserstein distances for stereo disparity estimation. In Proceedings of the 34th International Conference on Neural Information Processing Systems, Vancouver, BC, Canada, 6–12 December 2020; pp. 22517–22529. [Google Scholar]
  18. Guo, X.; Shi, S.; Wang, X.; Li, H. LIGA-Stereo: Learning LiDAR Geometry Aware Representations for Stereo-based 3D Detector. In Proceedings of the IEEE/CVF International Conference on Computer Vision, Montreal, QC, Canada, 10–17 October 2021; pp. 3153–3163. [Google Scholar]
  19. Xu, Z.; Zhang, W.; Ye, X.; Tan, X.; Yang, W.; Wen, S.; Ding, E.; Meng, A.; Huang, L. Part-Aware Adaptive Zooming Neural Network for 3D Object Detection. In Proceedings of the AAAI Conference on Artificial Intelligence, New York, NY, USA, 7–12 February 2020; Volume 34, pp. 12557–12564. [Google Scholar]
  20. Qin, Z.; Wang, J.; Lu, Y. Triangulation learning network: From monocular to stereo 3d object detection. In Proceedings of the IEEE/CVF Conference on Computer Vision and Pattern Recognition, Long Beach, CA, USA, 15–20 June 2019; pp. 7615–7623. [Google Scholar]
  21. Li, P.; Chen, X.; Shen, S. Stereo r-cnn based 3d object detection for autonomous driving. In Proceedings of the IEEE/CVF Conference on Computer Vision and Pattern Recognition, Long Beach, CA, USA, 15–20 June 2019; pp. 7644–7652. [Google Scholar]
  22. Chen, X.; Ma, H.; Wan, J.; Li, B.; Xia, T. Multi-view 3d object detection network for autonomous driving. In Proceedings of the IEEE Conference on Computer Vision and Pattern Recognition, Honolulu, HI, USA, 21–26 July 2017; pp. 1907–1915. [Google Scholar]
  23. Lin, T.Y.; Dollár, P.; Girshick, R.; He, K.; Hariharan, B.; Belongie, S. Feature pyramid networks for object detection. In Proceedings of the IEEE Conference on Computer Vision and Pattern Recognition, Honolulu, HI, USA, 21–26 July 2017; pp. 2117–2125. [Google Scholar]
  24. Liang, M.; Yang, B.; Wang, S.; Urtasun, R. Deep continuous fusion for multi-sensor 3d object detection. In Proceedings of the European Conference on Computer Vision (ECCV), Munich, Germany, 8–14 September 2018; pp. 641–656. [Google Scholar]
  25. Xie, L.; Xiang, C.; Yu, Z.; Xu, G.; Yang, Z.; Cai, D.; He, X. PI-RCNN: An Efficient Multi-Sensor 3D Object Detector with Point-Based Attentive Cont-Conv Fusion Module. In Proceedings of the AAAI Conference on Artificial Intelligence, New York, NY, USA, 7–12 February 2020; Volume 34, pp. 12460–12467. [Google Scholar]
  26. Shi, S.; Wang, X.; Li, H. Pointrcnn: 3d object proposal generation and detection from point cloud. In Proceedings of the IEEE/CVF Conference on Computer Vision and Pattern Recognition, Long Beach, CA, USA, 15–20 June 2019; pp. 770–779. [Google Scholar]
  27. Ayoub, S.; Gulzar, Y.; Reegu, F.A.; Turaev, S. Generating Image Captions Using Bahdanau Attention Mechanism and Transfer Learning. Symmetry 2022, 14, 2681. [Google Scholar] [CrossRef]
  28. Tian, Y.; Wang, Y.; Yang, L.; Qi, Z. CANet: Concatenated attention neural network for image restoration. IEEE Signal Process. Lett. 2020, 27, 1615–1619. [Google Scholar] [CrossRef]
  29. Gao, L.; Chen, L.; Liu, P.; Jiang, Y.; Li, Y.; Ning, J. Transformer-based visual object tracking via fine–coarse concatenated attention and cross concatenated MLP. Pattern Recognit. 2024, 146, 109964. [Google Scholar] [CrossRef]
  30. He, K.; Zhang, X.; Ren, S.; Sun, J. Deep residual learning for image recognition. In Proceedings of the IEEE Conference on Computer Vision and Pattern Recognition, Las Vegas, NV, USA, 27–30 June 2016; pp. 770–778. [Google Scholar]
  31. Vora, S.; Lang, A.H.; Helou, B.; Beijbom, O. Pointpainting: Sequential fusion for 3d object detection. In Proceedings of the IEEE/CVF Conference on Computer Vision and Pattern Recognition, Seattle, WA, USA, 14–19 June 2020; pp. 4604–4612. [Google Scholar]
  32. Pang, S.; Morris, D.; Radha, H. CLOCs: Camera-LiDAR object candidates fusion for 3D object detection. In Proceedings of the 2020 IEEE/RSJ International Conference on Intelligent Robots and Systems (IROS), Las Vegas, NV, USA, 24 January–24 October 2020; pp. 10386–10393. [Google Scholar]
  33. Geiger, A.; Lenz, P.; Urtasun, R. Are we ready for Autonomous Driving? The KITTI Vision Benchmark Suite. In Proceedings of the Conference on Computer Vision and Pattern Recognition (CVPR), Providence, RI, USA, 16–21 June 2012. [Google Scholar]
  34. Zhang, F.; Prisacariu, V.; Yang, R.; Torr, P.H. Ga-net: Guided aggregation net for end-to-end stereo matching. In Proceedings of the IEEE/CVF Conference on Computer Vision and Pattern Recognition, Long Beach, CA, USA, 15–20 June 2019; pp. 185–194. [Google Scholar]
  35. Chen, Y.; Liu, S.; Shen, X.; Jia, J. Dsgn: Deep stereo geometry network for 3d object detection. In Proceedings of the IEEE/CVF Conference on Computer Vision and Pattern Recognition, Seattle, WA, USA, 14–19 June 2020; pp. 12536–12545.
  36. Cho, S.; Kim, H.; Kwon, J. Filter pruning via softmax attention. In Proceedings of the 2021 IEEE International Conference on Image Processing (ICIP), Anchorage, AK, USA, 19–22 September 2021; pp. 3507–3511. [Google Scholar]
  37. Yu, F.; Huang, K.; Wang, M.; Cheng, Y.; Chu, W.; Cui, L. Width & Depth Pruning for Vision Transformers. Proc. AAAI Conf. Artif. Intell. (AAAI) 2022, 36, 3143–3151. [Google Scholar]
Figure 1. 3D object detection results.
Algorithms 16 00560 g001
Figure 2. Structure of feature attention module.
Algorithms 16 00560 g002
Figure 3. Data in three channels.
Algorithms 16 00560 g003
Figure 4. Feature fusion method of PatchNet.
Algorithms 16 00560 g004
Figure 5. Feature fusion method of Pseudo-Lidar F-PointNet.
Algorithms 16 00560 g005
Figure 6. Feature fusion method of Pseudo-Lidar EPNet.
Algorithms 16 00560 g006
Figure 7. Design of category reweighting module.
Algorithms 16 00560 g007
Figure 8. Fusion feature distribution map within image blocks.
Algorithms 16 00560 g008
Figure 9. Feature distribution and map of foreground–background segmentation results. (a) Image block, (b) Distribution map of point cloud and image, (c) Map of segmentation of foreground and background point cloud, (d) Comparison in view1, (e) Comparison in view2, (f) Comparison in view3.
Algorithms 16 00560 g009
Figure 10. Comparison of segmentation effects of different fusion methods. (a) The object to be detected, (b) Image block, (c) The ground-truth of segmenation, (d) The segmentation result of fusion method, (e) The segmentation result of category reweighing strategy.
Algorithms 16 00560 g010
Figure 11. Feature map of different layers. (a) image, (b) the feature immediately following the 0th layer of the SA module, (c) the feature immediately following the 3rd layer of the SA module, (d) the feature immediately following the last layer of the FP module.
Algorithms 16 00560 g011
Table 1. Detection results based on PatchNet.
CategoryPatchNetPatchNet with Late Fusion
EasyModerateDifficultEasyModerateDifficult
Car76.90/
68.44
53.00/
41.84
44.09/
33.90
76.39/
65.17
53.21/
41.35
42.92/
33.41
Pedestrian40.11/
33.53
31.73/
26.13
26.30/
21.35
41.42/
36.19
32.90/
28.29
26.75/
23.14
Cyclist40.38/
36.56
22.13/
20.02
20.43/
18.36
42.64/
36.83
23.93/
20.50
22.27/
18.97
Table 2. The weight of the feature attention module.
Category/FeaturePoint CloudImage
Car0.770.23
Pedestrian0.730.27
Cyclist0.680.31
Table 3. Detection results based on Pseudo-Lidar F-PointNet.
CategoryPseudo-Lidar F-PointNetPseudo-Lidar F-PointNet with Late Fusion
EasyModerateDifficultEasyModerateDifficult
Car71.69/
57.58
47.77/
35.16
39.43/
29.19
75.06/
62.04
51.09/
38.30
43.82/
32.17
Pedestrian43.63/
33.43
35.01/
25.65
29.37/
21.41
51.58/
42.67
41.55/
33.59
34.40/
27.83
Cyclist48.31/
40.83
27.67/
23.28
25.60/
21.62
55.20/
47.49
31.03/
26.47
28.72/
24.33
Table 4. The weight of feature attention module.
Category/FeaturePoint CloudImage
Car0.670.33
Pedestrian0.790.21
Cyclist0.810.19
Table 5. Feature weight and proportion of foreground point clouds.
Category/FeaturePoint CloudImageProportion of Foreground Point Cloud
Car0.670.330.38
Pedestrian0.790.210.32
Cyclist0.810.190.24
Table 6. The higher weight proportion of point cloud and image features in the foreground point cloud.
Category/FeaturePoint CloudImage
Car0.540.56
Pedestrian0.240.76
Cyclist0.190.81
Table 7. Comparison of different fusion methods (PSMNet-Pedestrian).
MethodSegmentation AccuracyDetection Accuracy
Point CloudImageCategory
Vector
Reweighting ModuleEasyModerateDifficult
0.85133.4325.6521.41
0.84042.6733.5927.83
0.84137.1429.2123.95
0.85144.1834.9729.05
Table 8. Comparison of different fusion methods (PSMNet-Cyclist).
MethodSegmentation AccuracyDetection Accuracy
Point CloudImageCategory
Vector
Reweighting ModuleEasyModerateDifficult
0.85140.8323.2821.62
0.84047.4926.4724.33
0.84146.6125.7423.50
0.85147.8825.2223.46
Table 9. Comparison of different fusion methods (GANet-Pedestrian).
MethodSegmentation AccuracyDetection Accuracy
Point CloudImageCategory
Vector
Reweighting ModuleEasyModerateDifficult
0.84348.4626.9625.15
0.83048.5626.8625.24
0.82951.5828.2826.25
0.84150.2427.5825.61
Table 10. Comparison of different fusion methods (GANet-Cyclist).
MethodSegmentation AccuracyDetection Accuracy
Point CloudImageCategory
Vector
Reweighting ModuleEasyModerateDifficult
0.84331.4124.5819.86
0.83044.9834.5628.59
0.82940.0931.2325.58
0.84144.3334.5728.85
Table 11. Comparison of the detection performance of different methods (pedestrian).
MethodEasyModerateDifficultFusionImage
Segmentation
Method
Type
PSMNet + AVOD [5,13]27.3926.0020.72YN3D
DSGN [35]36.8431.4227.55NN3D
PL-FP [5,6] (original paper)33.8027.4024.00NN2D-3D
PL-FP [5,6] (this paper)33.4325.6521.41NN2D-3D
Ours44.1834.9729.05YN2D-3D
OC-Stereo [1]34.8029.0528.06NY2D-3D
Disp-RCNN [2]40.4333.0327.05NY2D-3D
Table 12. Comparison of the detection effect of different methods (cyclist).
MethodEasyModerateDifficultFusionImage
Segmentation
Method
Type
PSMNet + AVOD [5,13]35.8822.7821.94YN3D
DSGN [35]35.3923.1622.29NN3D
PL-FP [5,6] (original paper)41.3025.2024.90NN2D-3D
PL-FP [5,6] (this paper)40.8323.2821.62NN2D-3D
Ours45.8825.2223.46YN2D-3D
OC-Stereo [1]45.5925.9324.62NY2D-3D
Disp-RCNN [2]55.9833.4629.51NY2D-3D
Table 13. Comparison of different detection methods (pedestrian).
MethodEasyModerateDifficult
PL Point R-CNN [26]46.1236.5930.35
PL EPNet [7]49.5640.0133.60
Ours50.5040.9134.68
Table 14. Comparison of different detection methods (pedestrian).
MethodEasyModerateDifficultFusionImage
Segmentation
Method
Type
PSMNet + AVOD [5,13]27.3926.0020.72YN3D
DSGN [35]36.8431.4227.55NN3D
PL-FP [5,6]33.8027.4024.00NN2D-3D
Ours50.5040.9134.68YN3D
OC-Stereo [1]34.8029.0528.06NY2D-3D
Disp-RCNN [2]40.4333.0327.05NY2D-3D
Table 15. Feature attention weight of different fusion layers.
LayerPoint CloudImage
The feature immediately following the 0th layer of the SA module0.9140.086
The feature immediately following the 1st layer of the SA module0.9990.001
The feature immediately following the 2nd layer of the SA module0.9990.001
The feature immediately following the 3rd layer of the SA module0.0010.999
The feature immediately following the last layer of the FP module0.8390.161
Table 16. Comparison of the precision and recall for the fusion of different layers.
NumFusion LayerPrecisionRecallParameterFlops
NOTSA0SA1SA2SA3FPEasyModerateDifficult
1 46.1236.5930.350.5123.01M6884 M
2 45.1636.9731.140.51311.11M53,657 M
3 48.2038.7432.700.51313.54M123,3136 M
4 50.5040.9134.680.52013.96M123,3304 M
5 48.6638.5032.140.48811.09M53,602 M
6 47.1737.6731.650.53113.53M123,3080 M
Disclaimer/Publisher’s Note: The statements, opinions and data contained in all publications are solely those of the individual author(s) and contributor(s) and not of MDPI and/or the editor(s). MDPI and/or the editor(s) disclaim responsibility for any injury to people or property resulting from any ideas, methods, instructions or products referred to in the content.

