
A Narrow-Down Approach Based on Machine Learning for Indoor Localization


Abstract
:1. Introduction
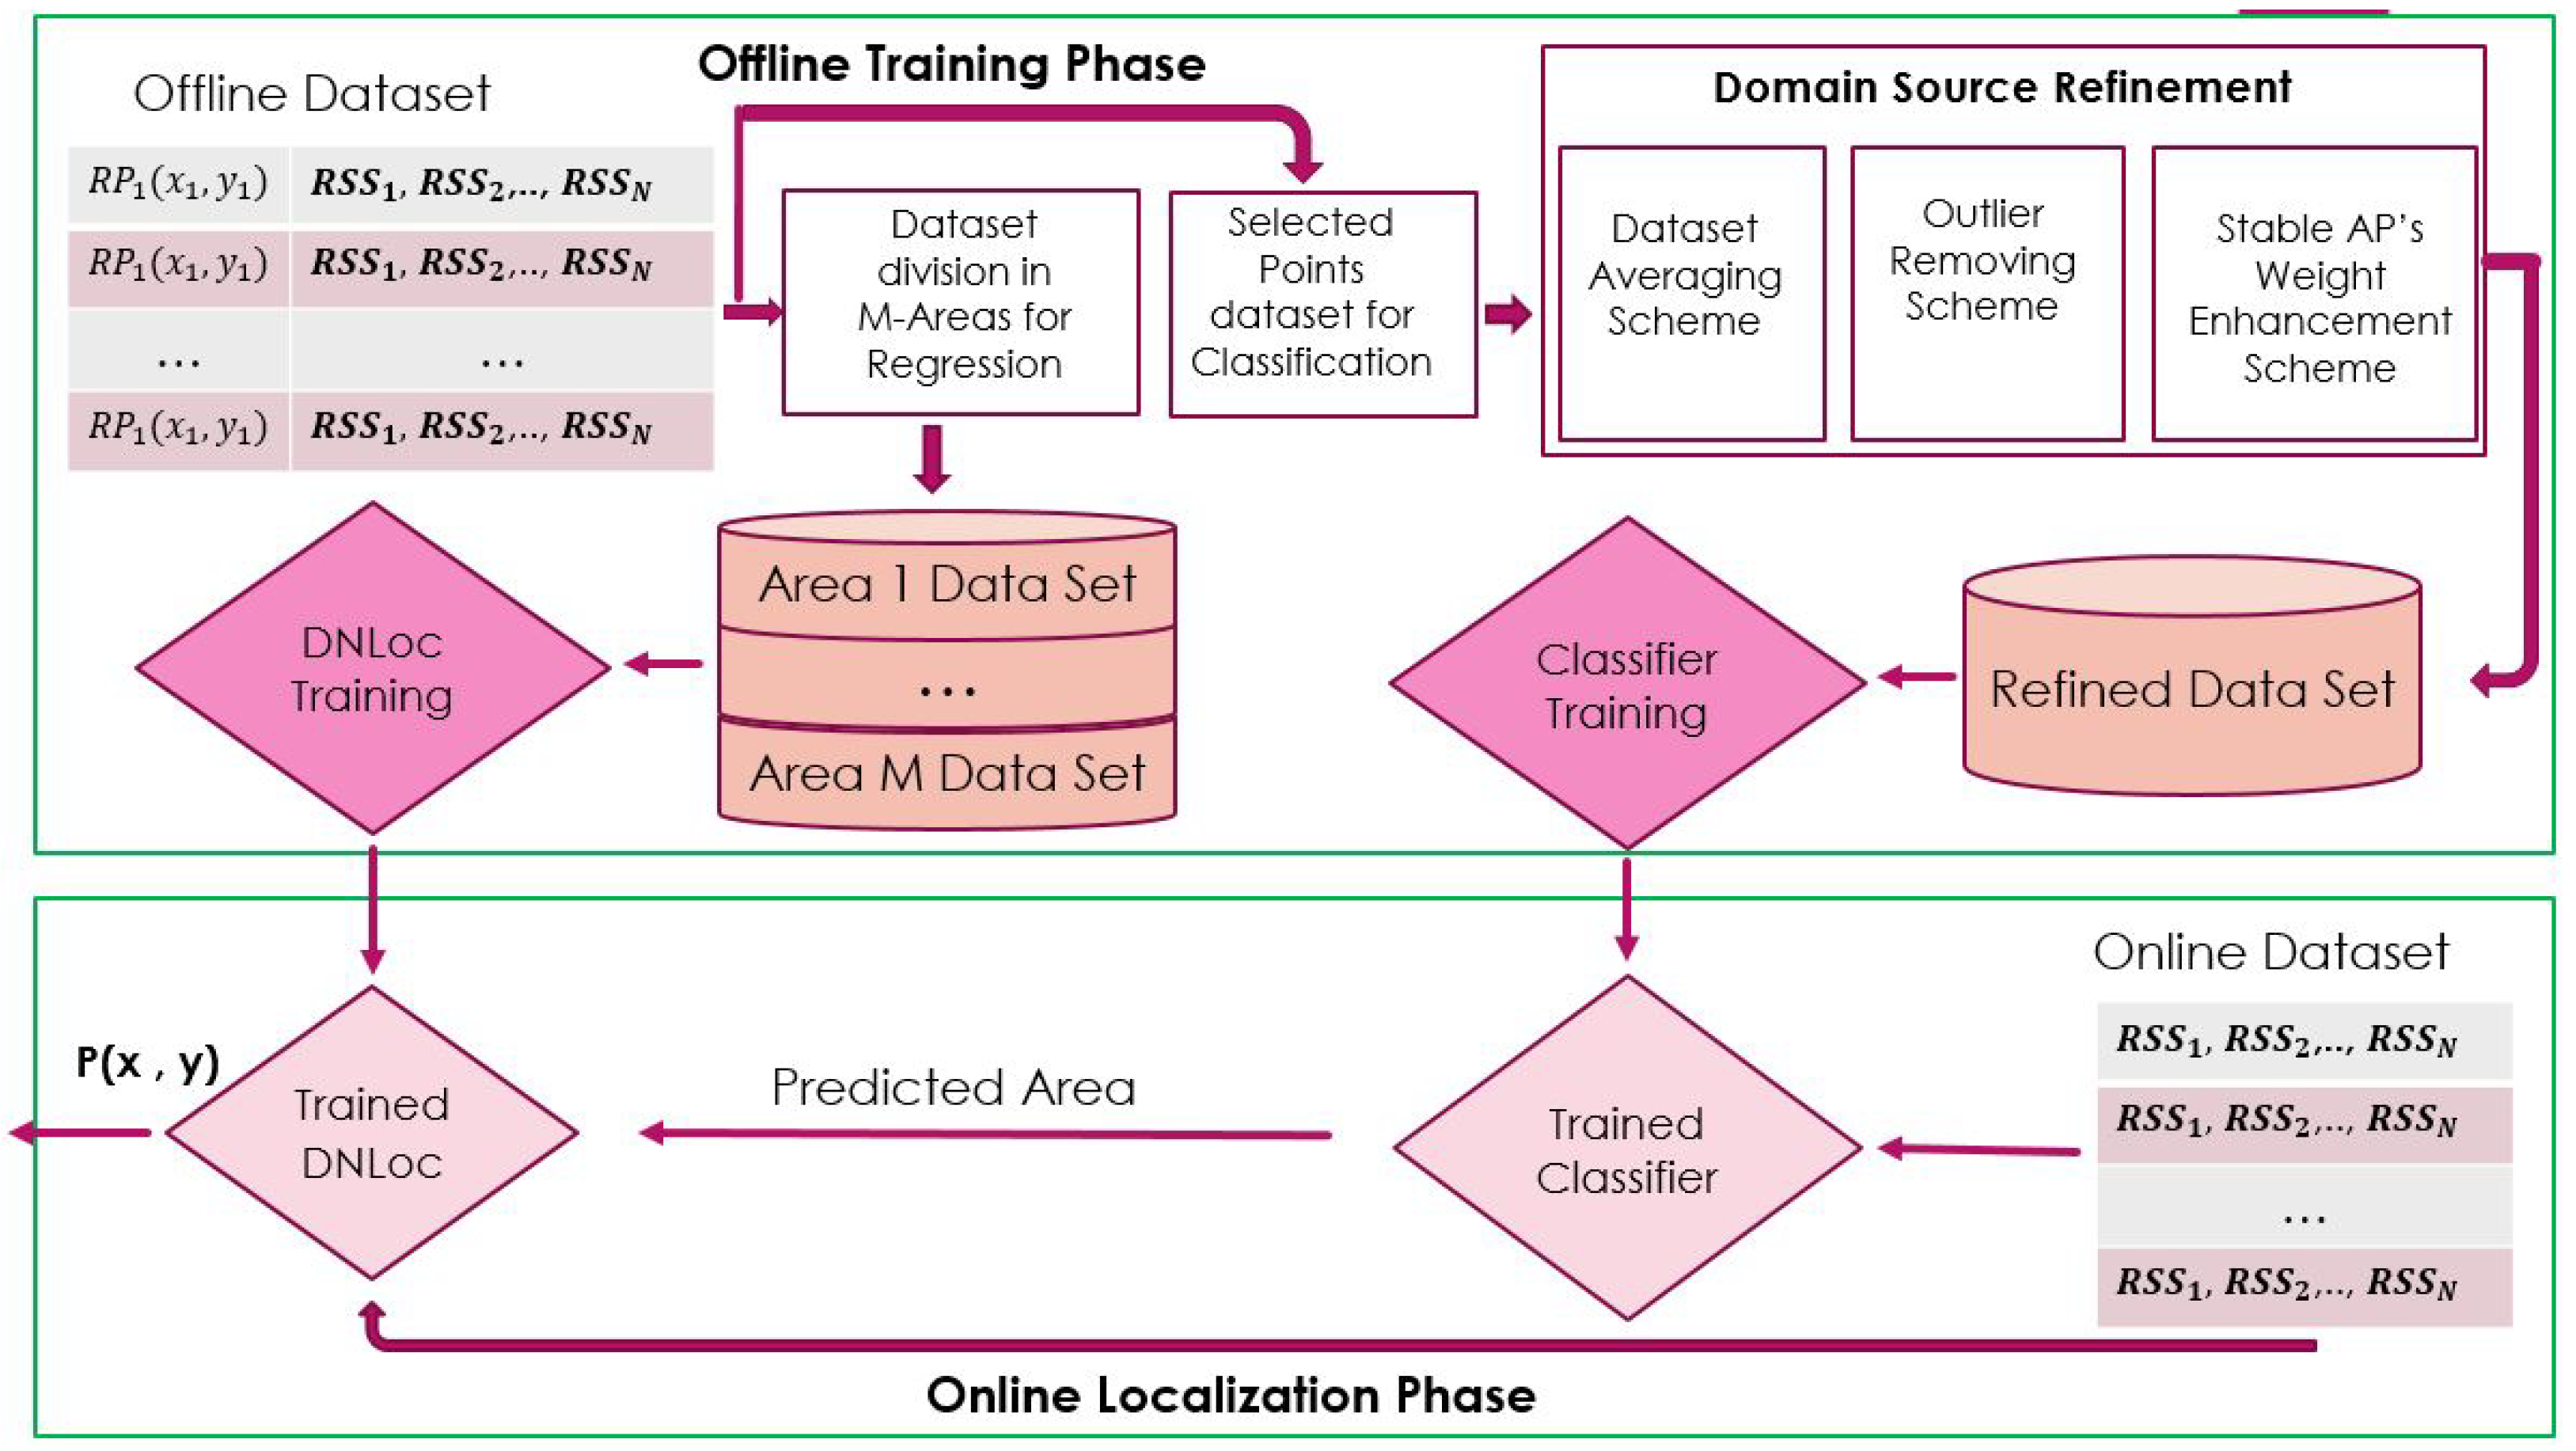
- This study proposes a narrow-down approach (NDA), which comprises the coarse and accurate positioning phases.
- The contribution is to select specific reference points (RPs) to train the classification algorithm, while the key considerations are to reduce the offline storage as we do not use all the RPs for training, and the chosen training points for the classifier are distant enough to share minimum RSSI characteristics. This strategy increases classification accuracy.
- We also propose a three-step source domain refinement (SDR) scheme to reduce the computational complexity of training data and enhance the classification accuracy at the same time.
- A very lightweight DNN-based multivariate regression (DNN-MVR) model, trained independently on each sub-cluster, is presented. The proposed methods are evaluated on a public dataset to show their reliability and robustness.
2. Related Work
3. System Design
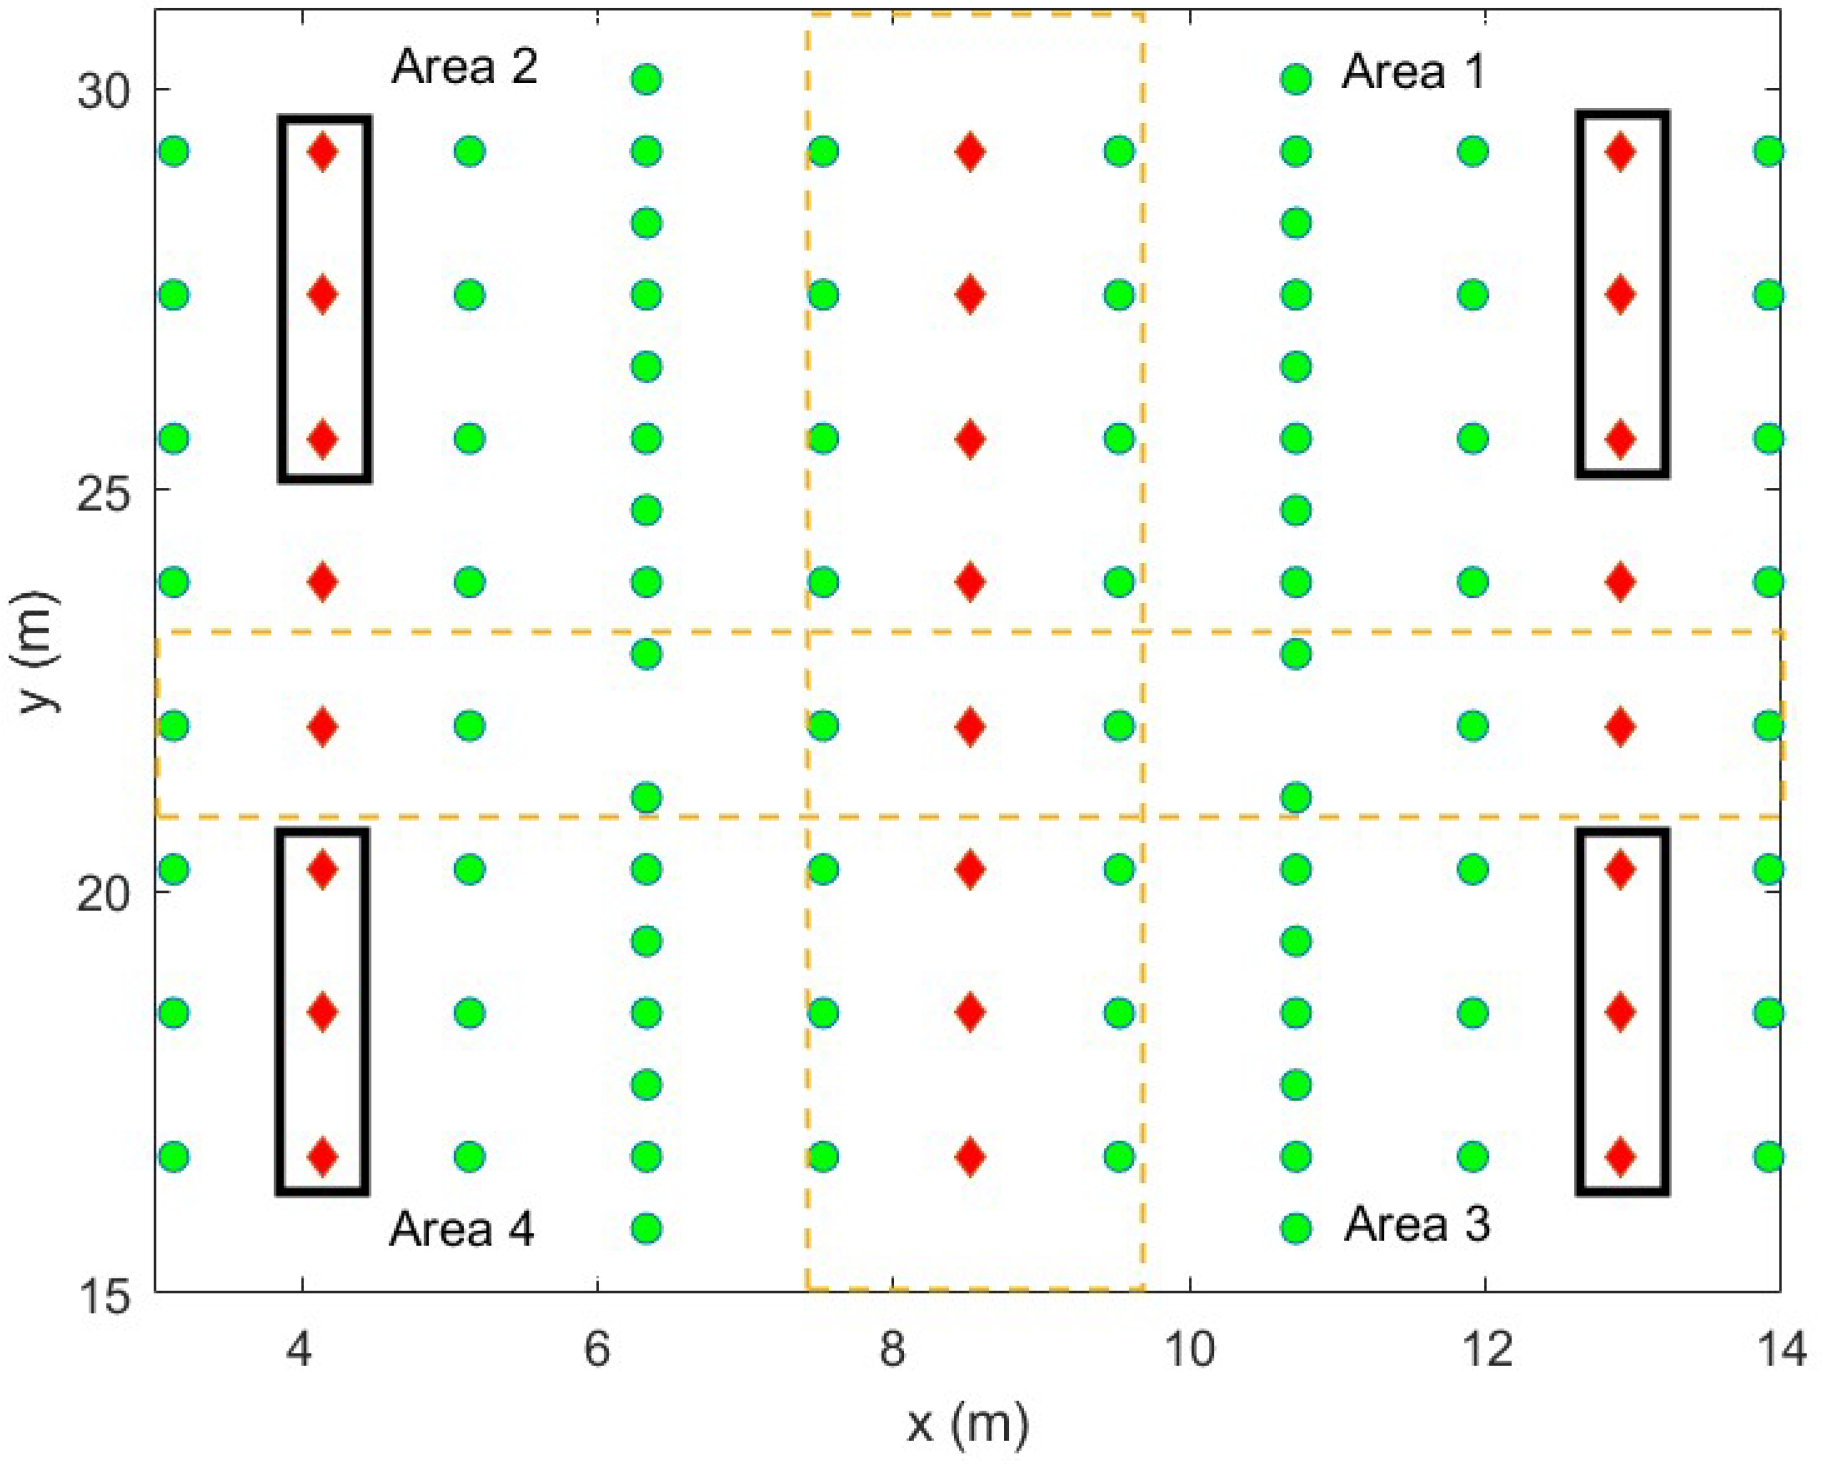
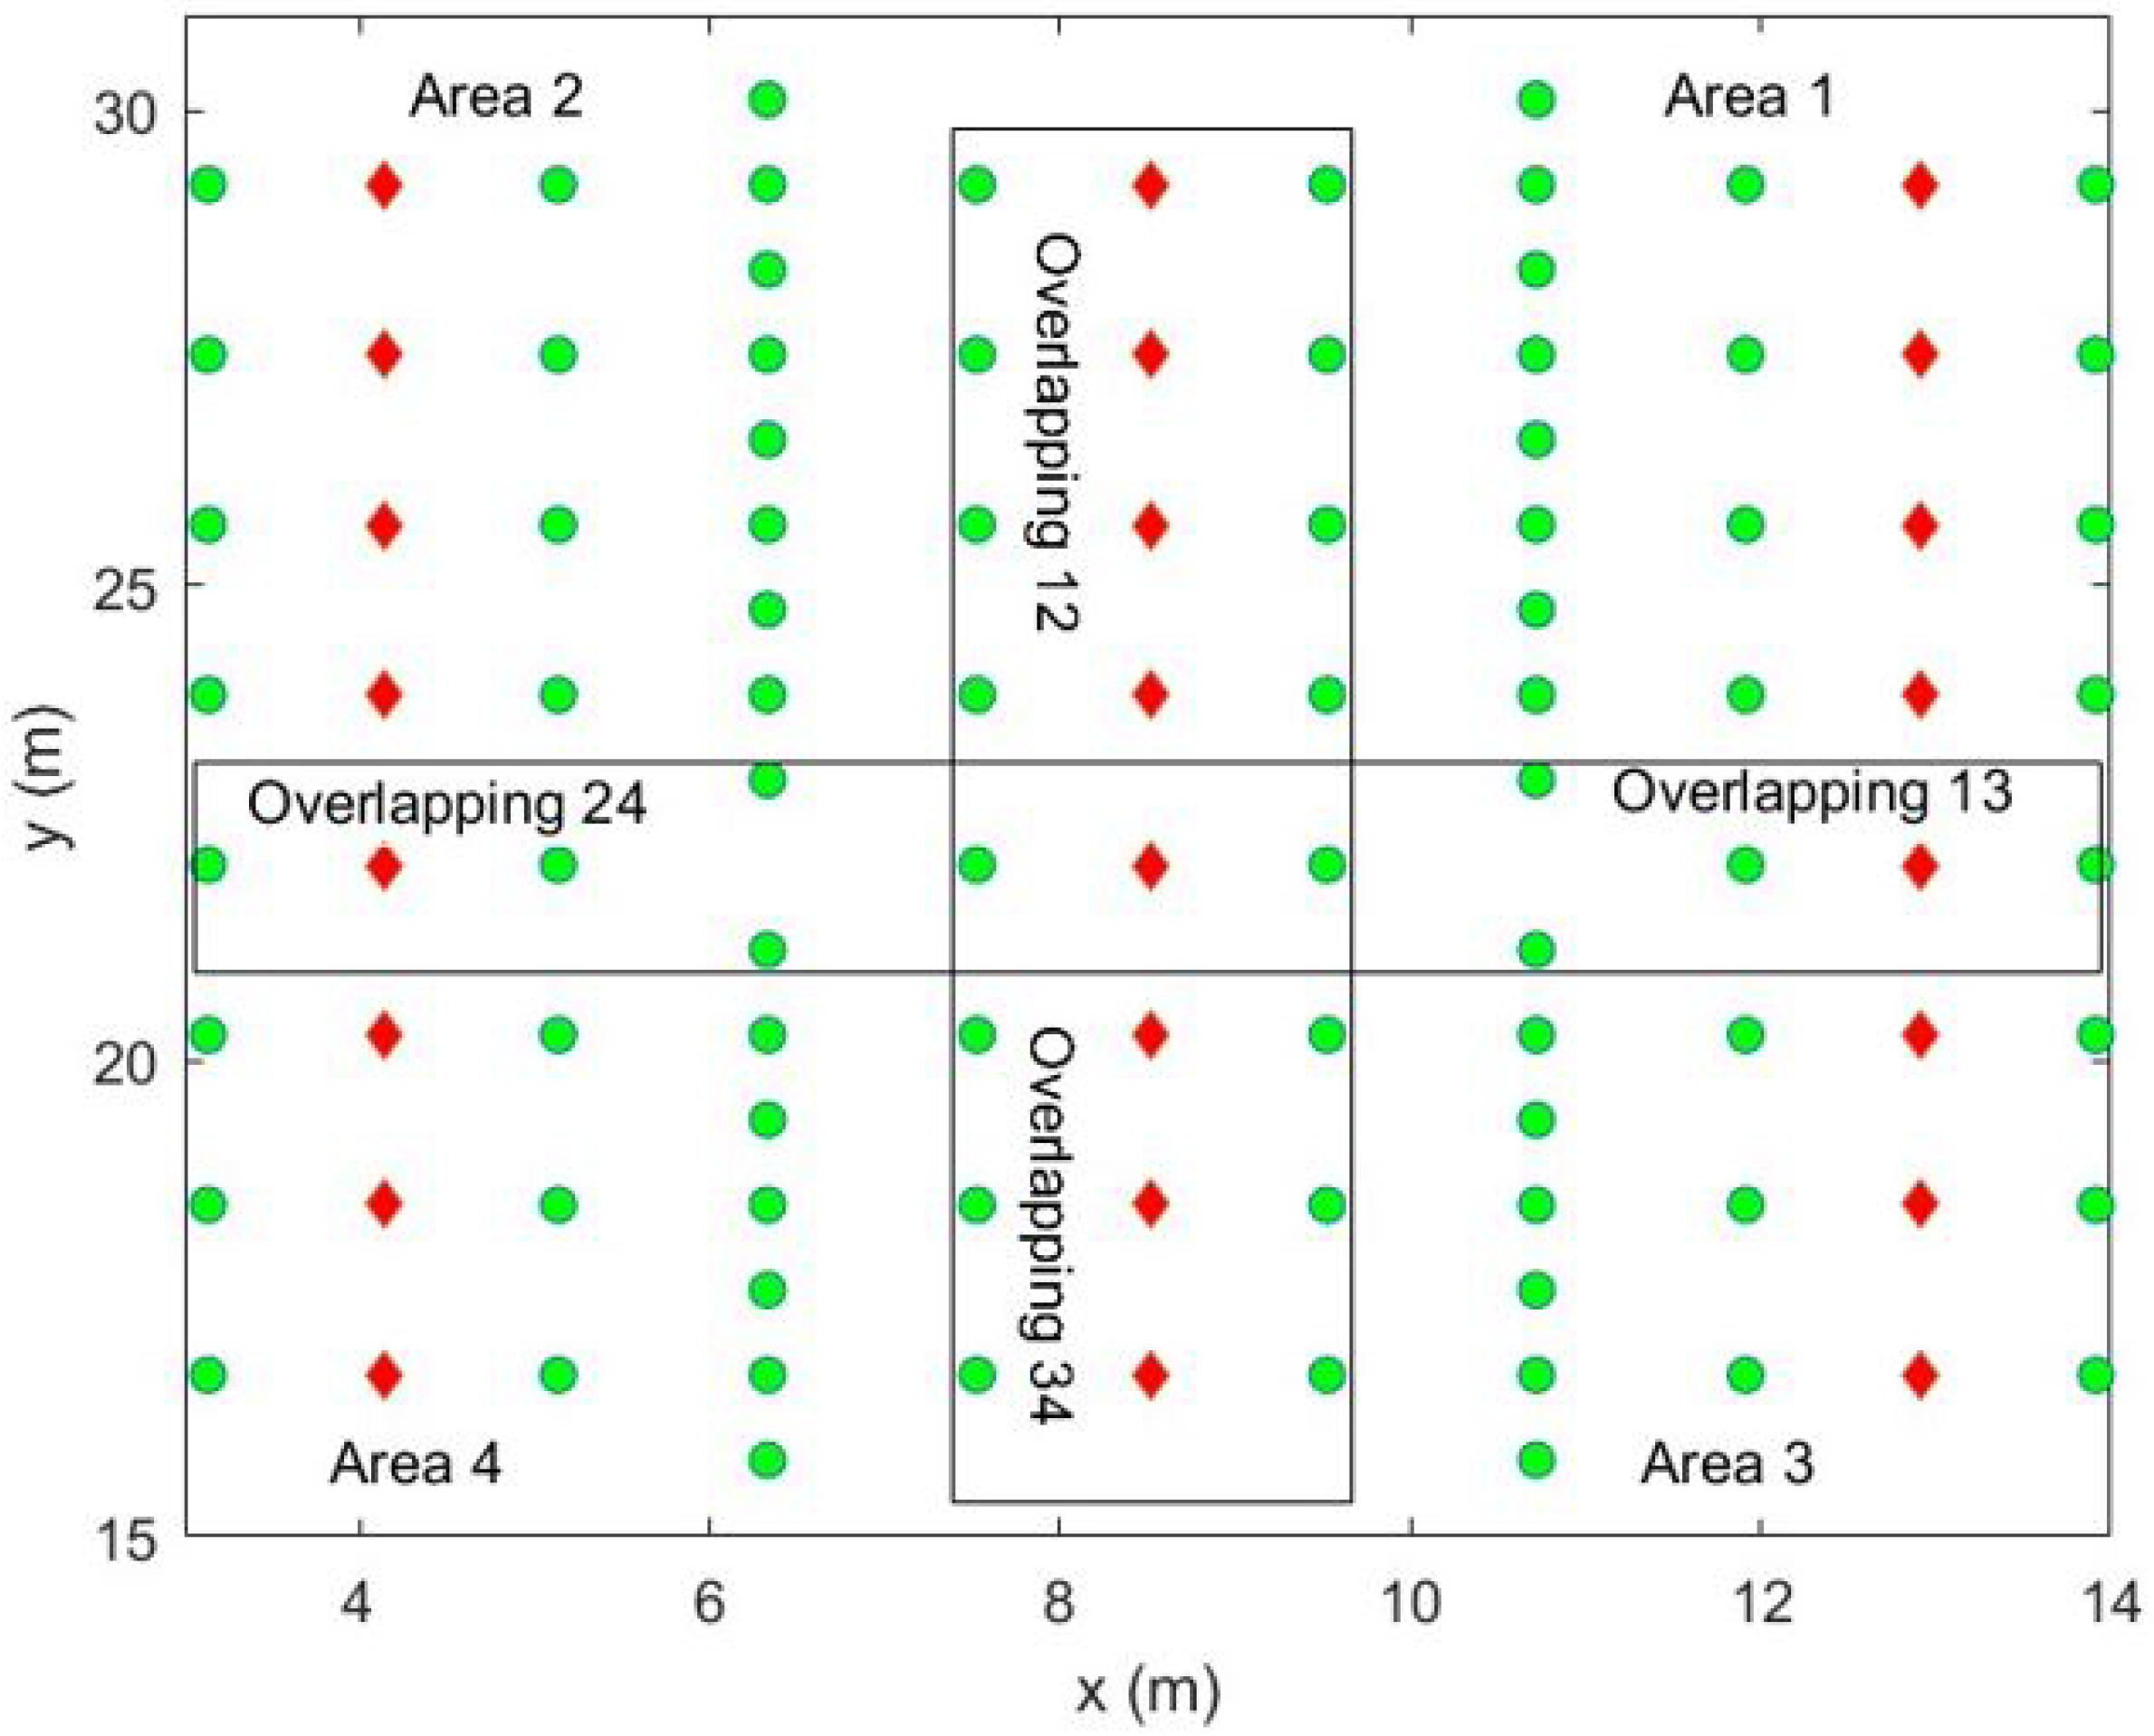
3.1. Area Division and Overlapping
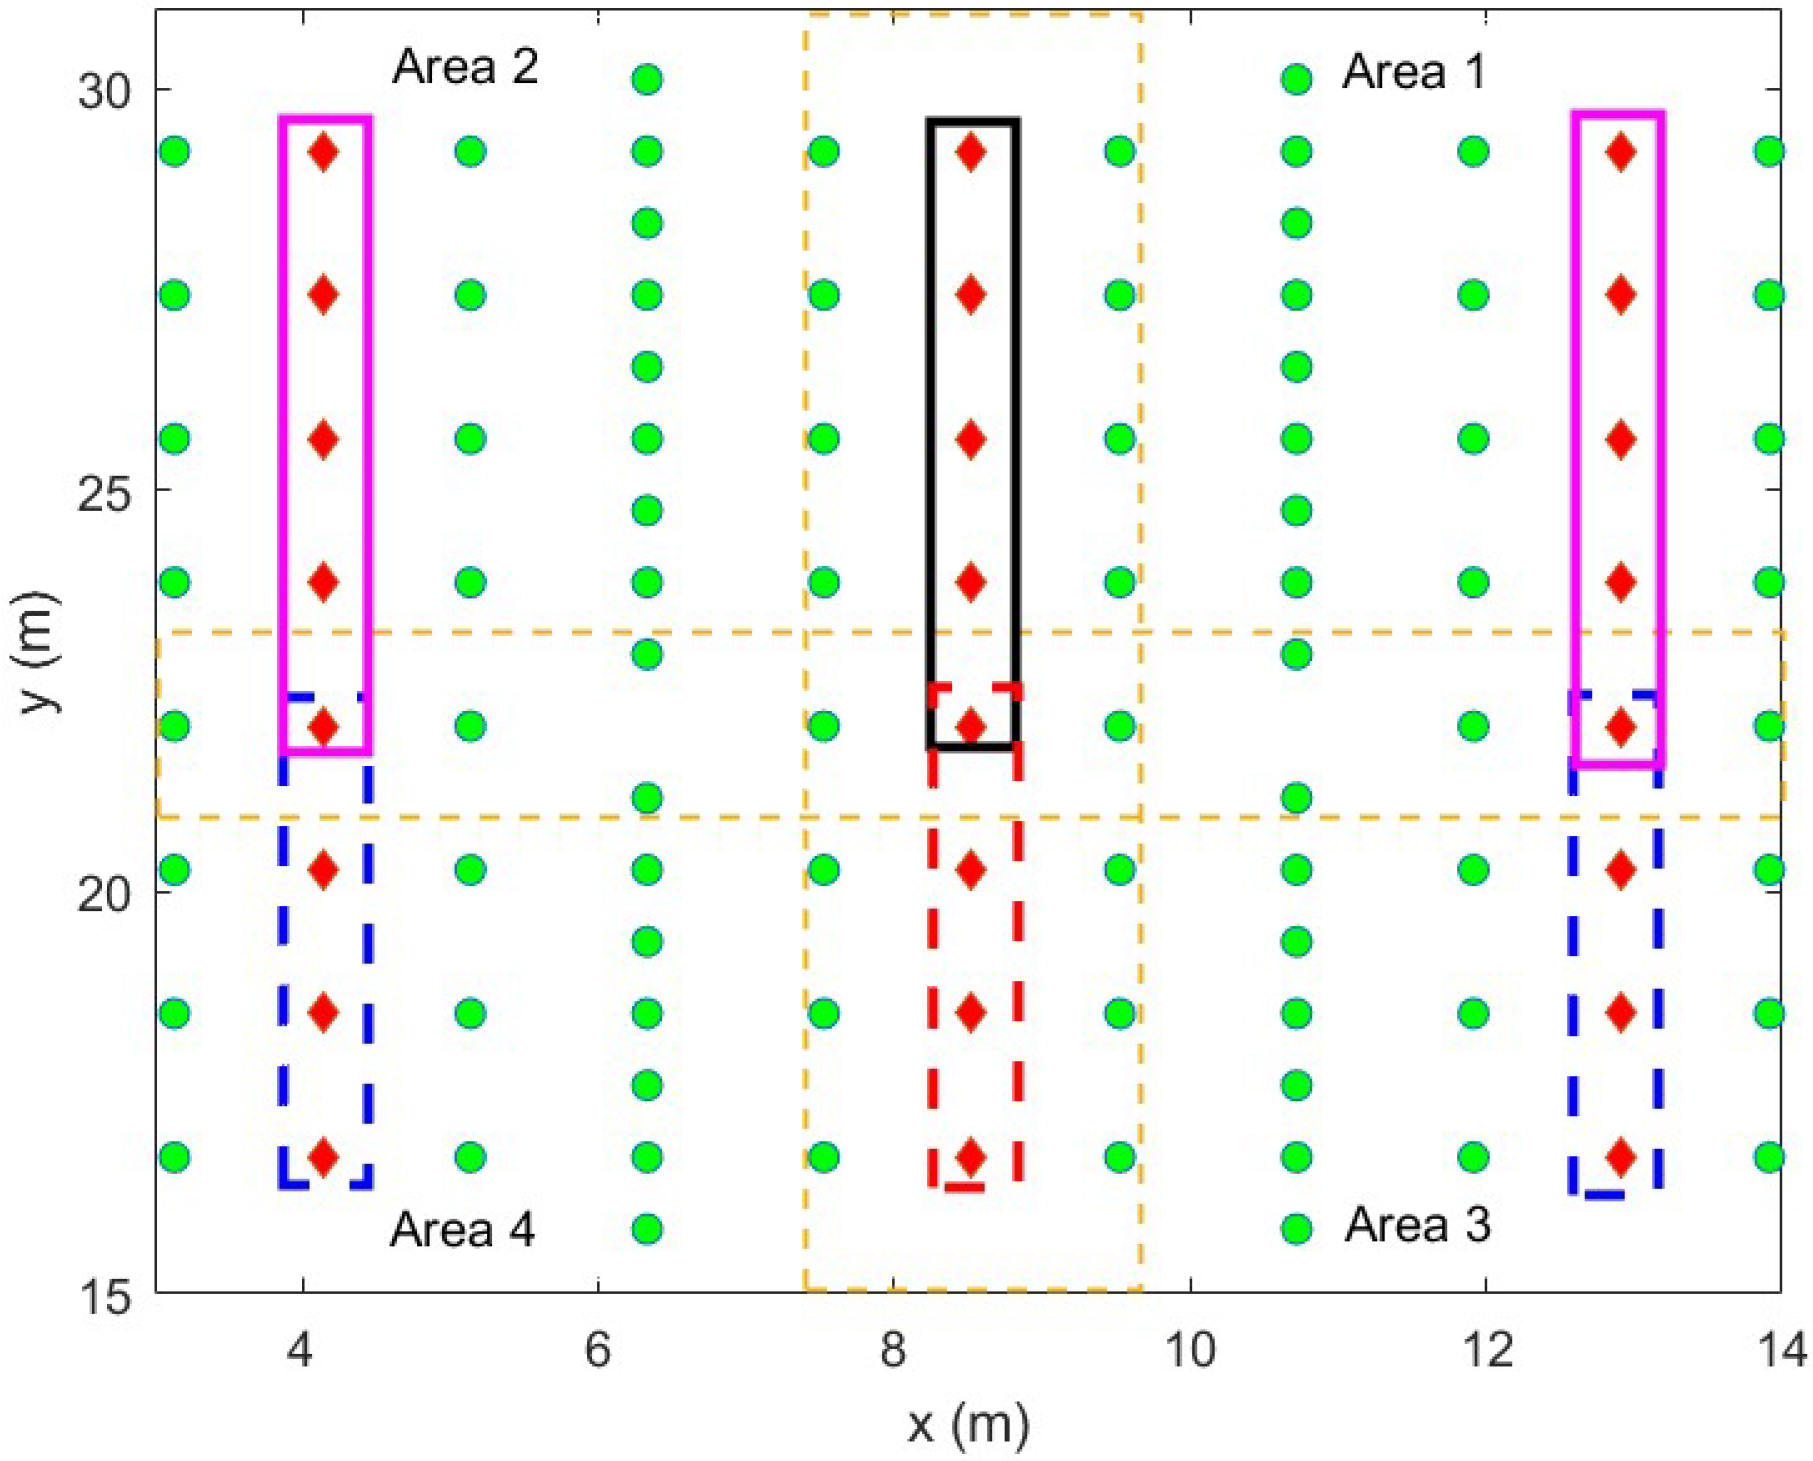
3.2. Training Data Selection
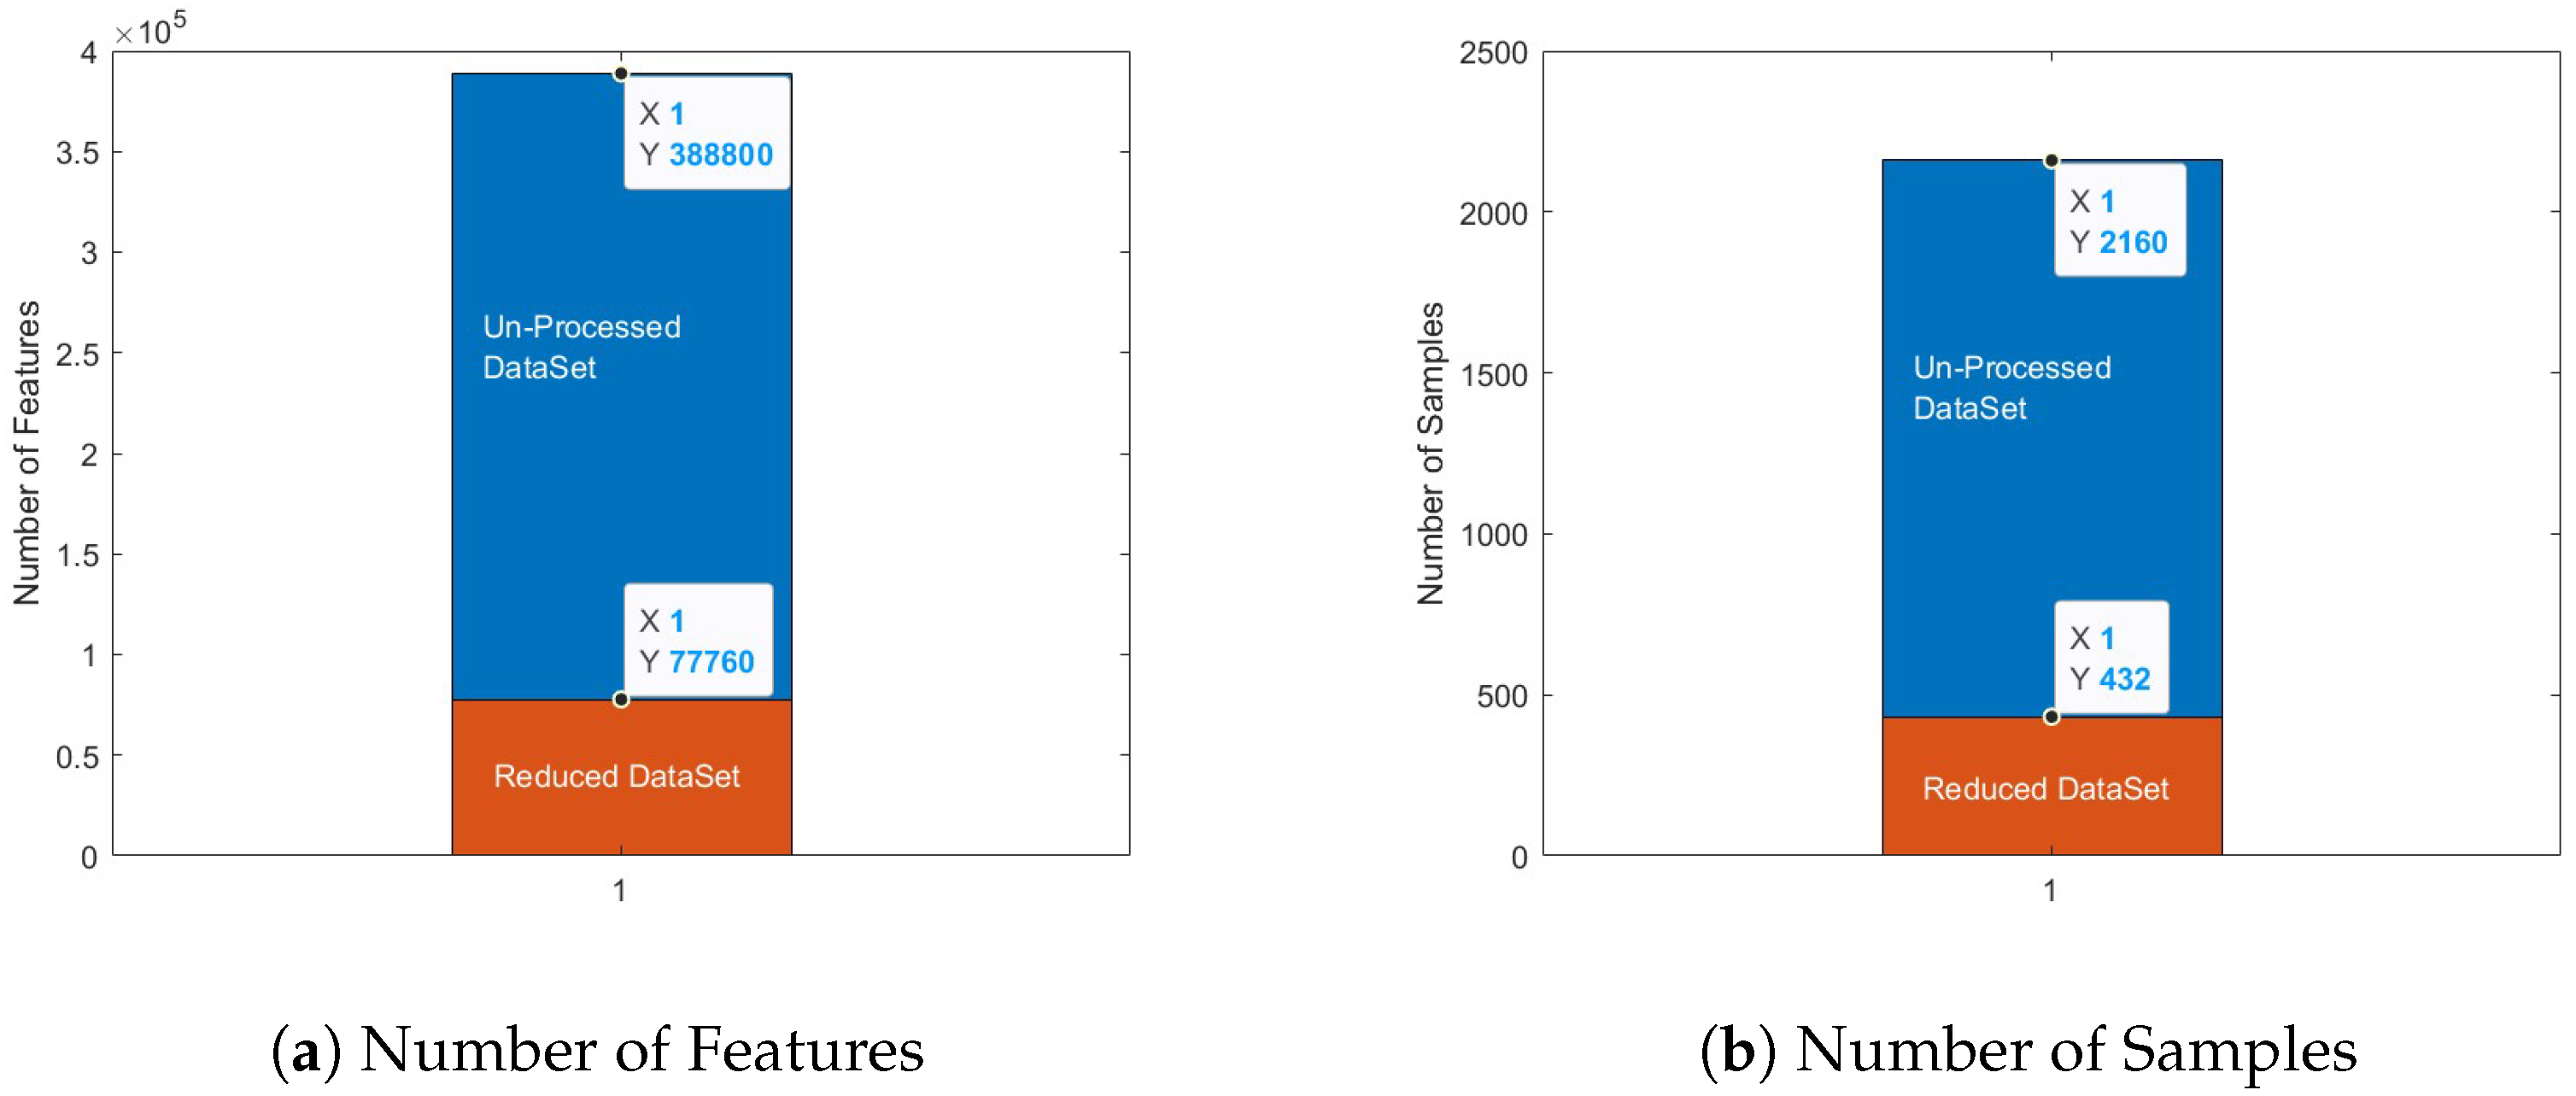
3.3. Source Domain Refinement (SDR)
3.3.1. Data Averaging Technique
3.3.2. Outlier Removal Scheme
3.3.3. Stable AP’s Weight Enhancement
- 1.
- We define a detection vector , where , is the detection indicator for the AP of sample in the sub-area “a”. When the value of a particular RSSI feature is above a threshold, , the corresponding AP is detected, and the value of would be considered as 1 or otherwise, 0. The detection vector is calculated for each AP in each sub-area.
- 2.
- For the current sub-area “a”, the sum for the AP’s detection indicators can be calculated as:And the distinction vector can be written as, , which we can normalize by dividing the whole vector by the maximum entry in the vector :
- 3.
- Sort in descending order, where each entry is the stability indicator of the corresponding AP in sub-area “a”. Now, select those APs whose stability indicator is greater than a threshold and add a small bias into the RSSI measurements of the selected APs. Remember that the values of and are arbitrary.
3.4. Sub-Clustering Algorithms
3.4.1. Support Vector Machine (SVM)
3.4.2. Random Forest (RF) Classifier
3.4.3. Multi-Variate Regression-Based DNN Algorithm
4. Experiment Evaluations
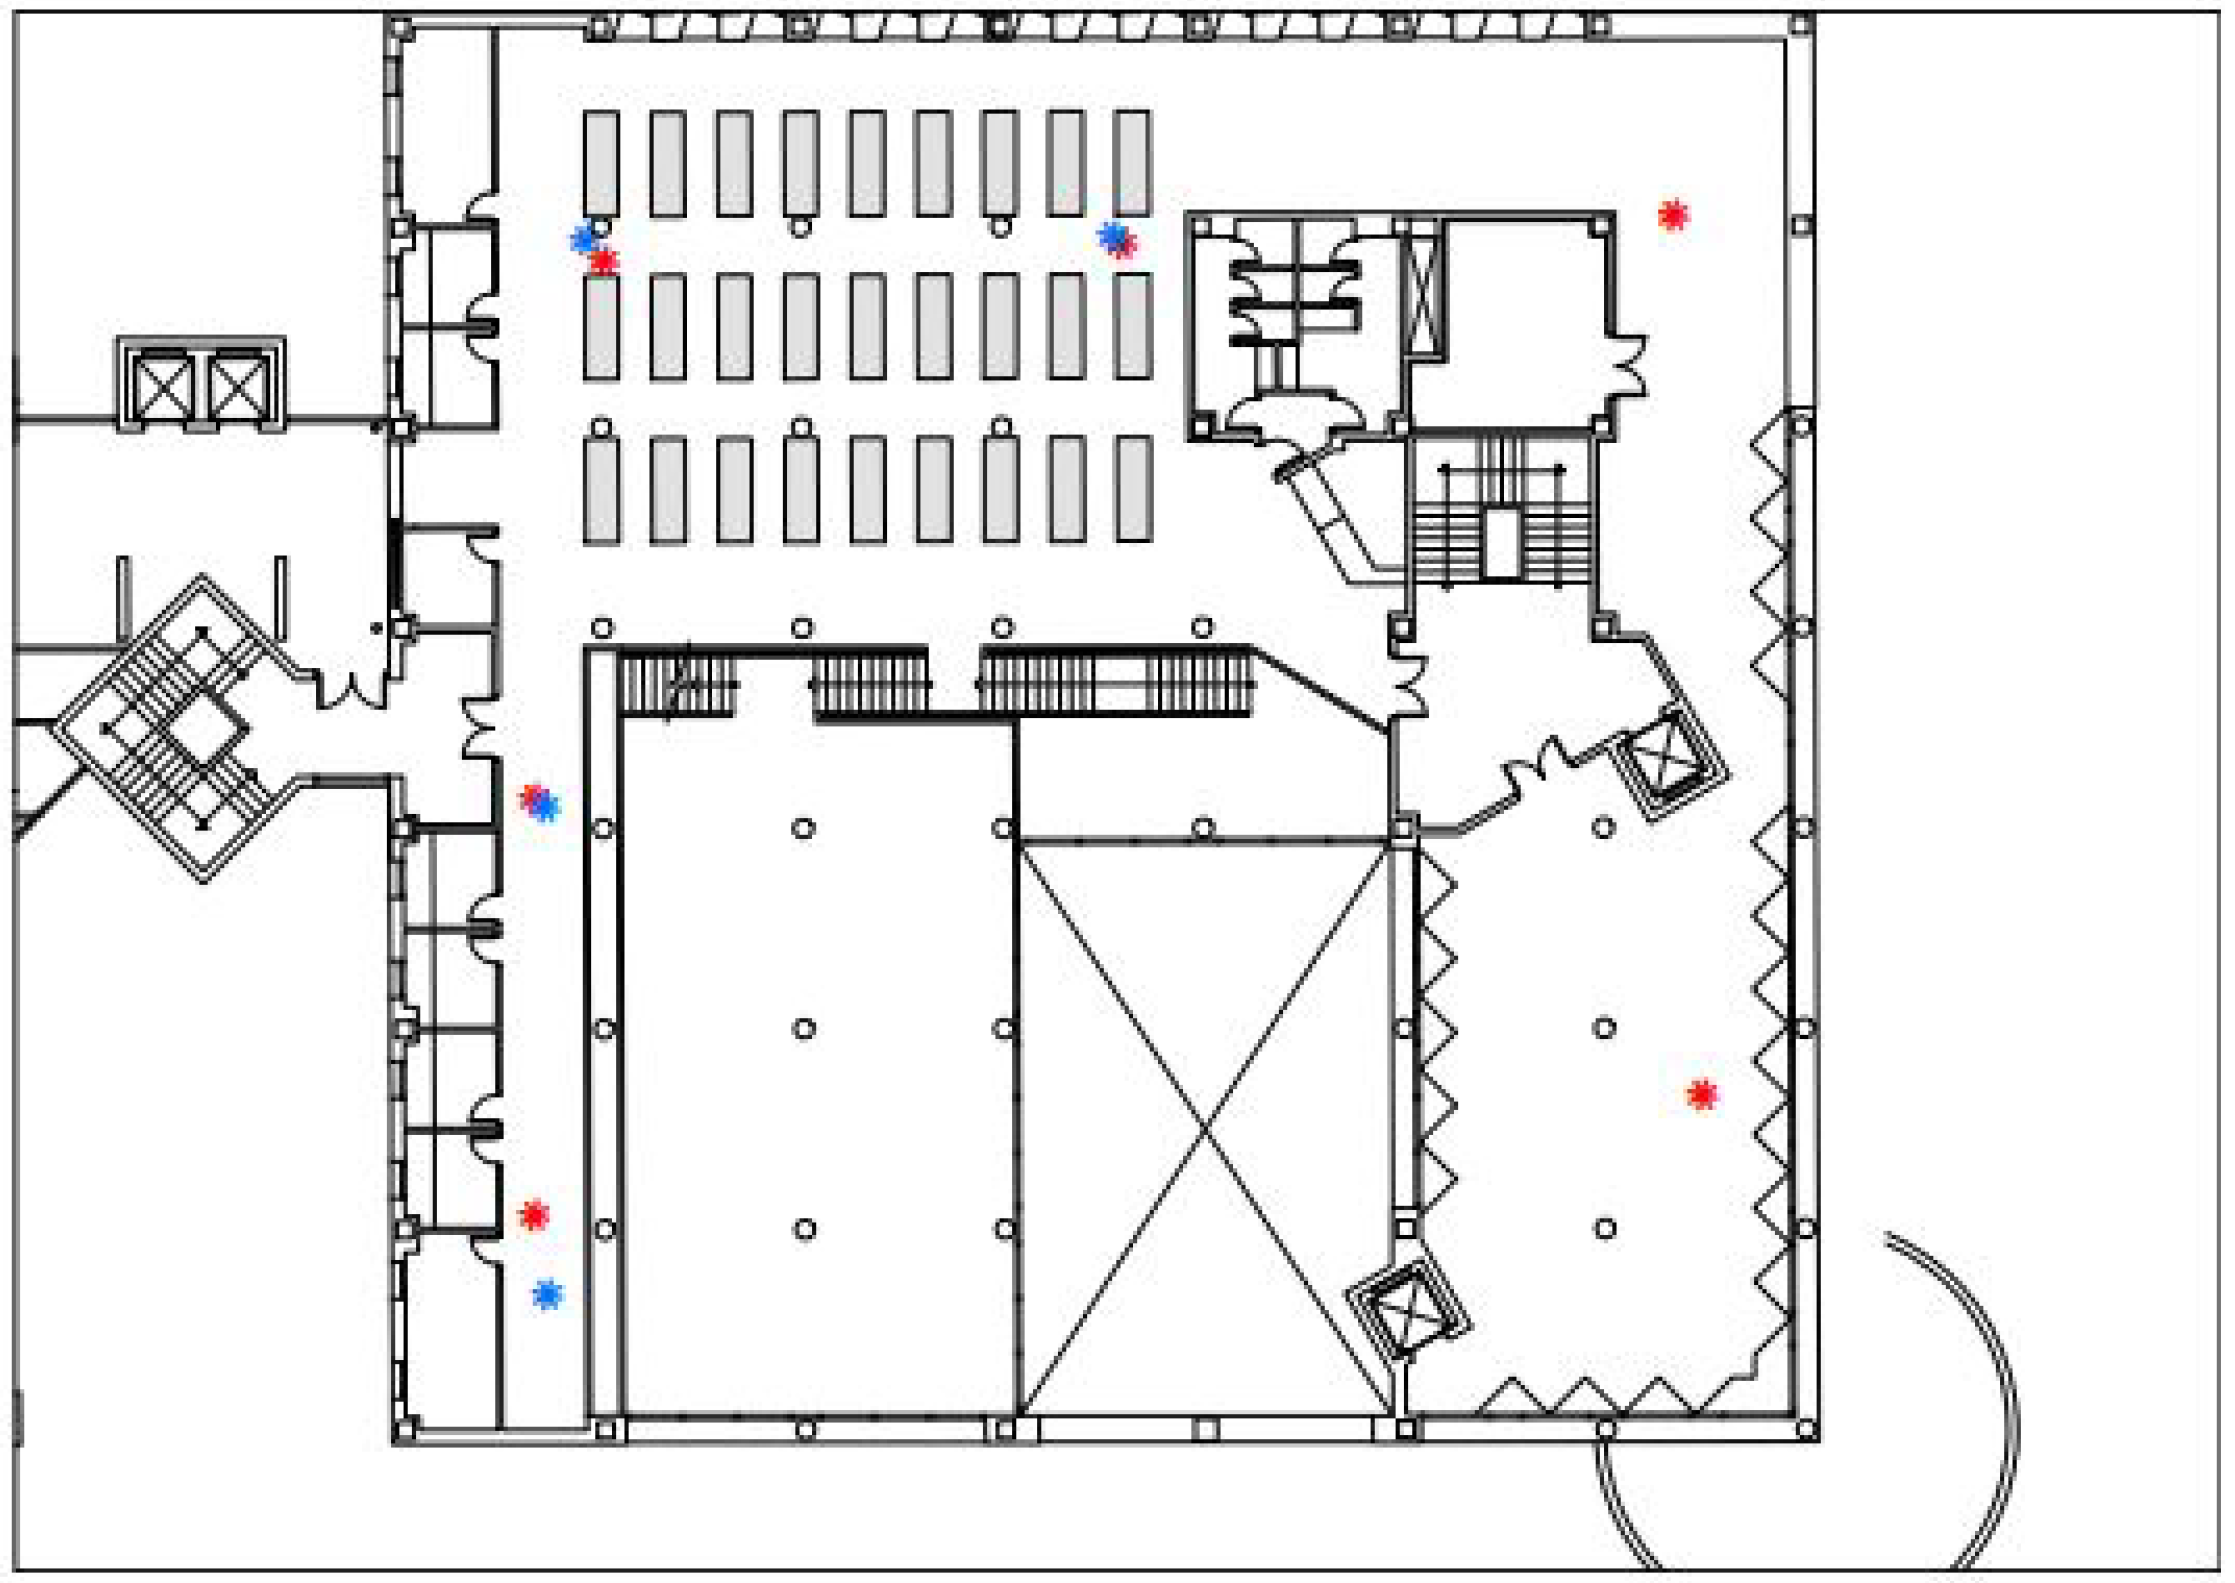
4.1. Experimental Setup
4.2. Data Description
4.3. Evaluation Metrics
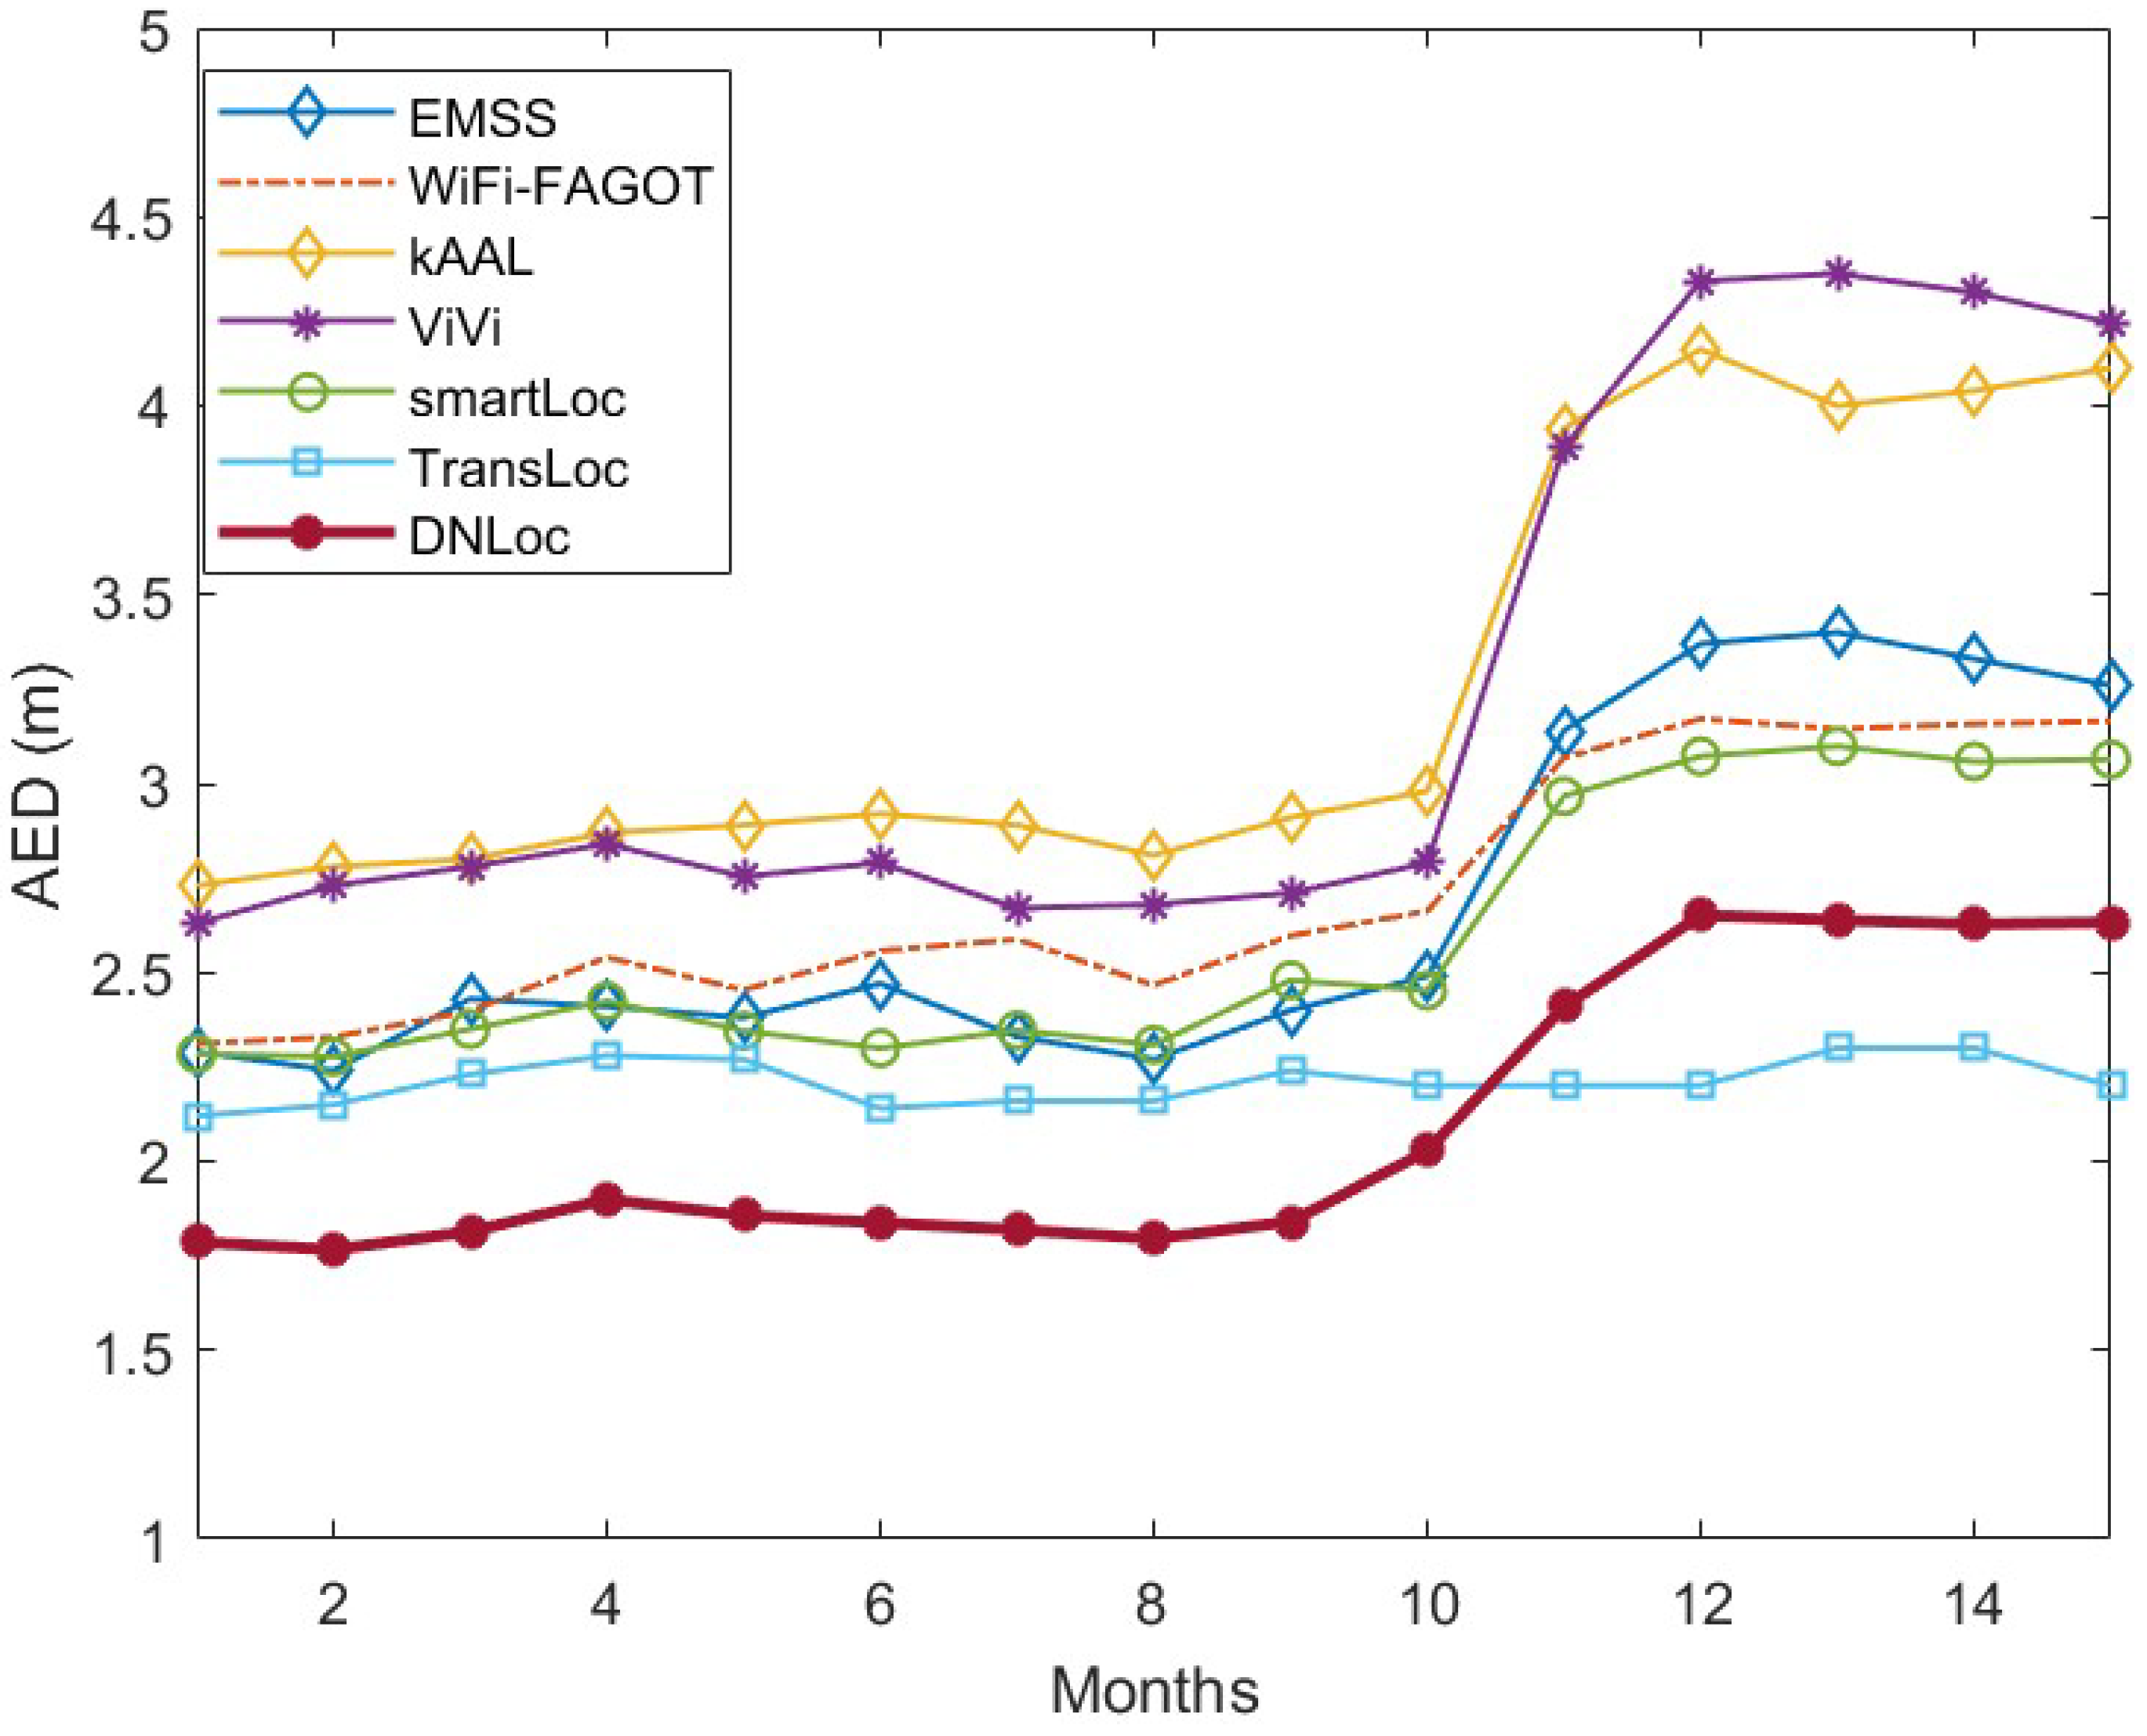
4.4. Experiment Results
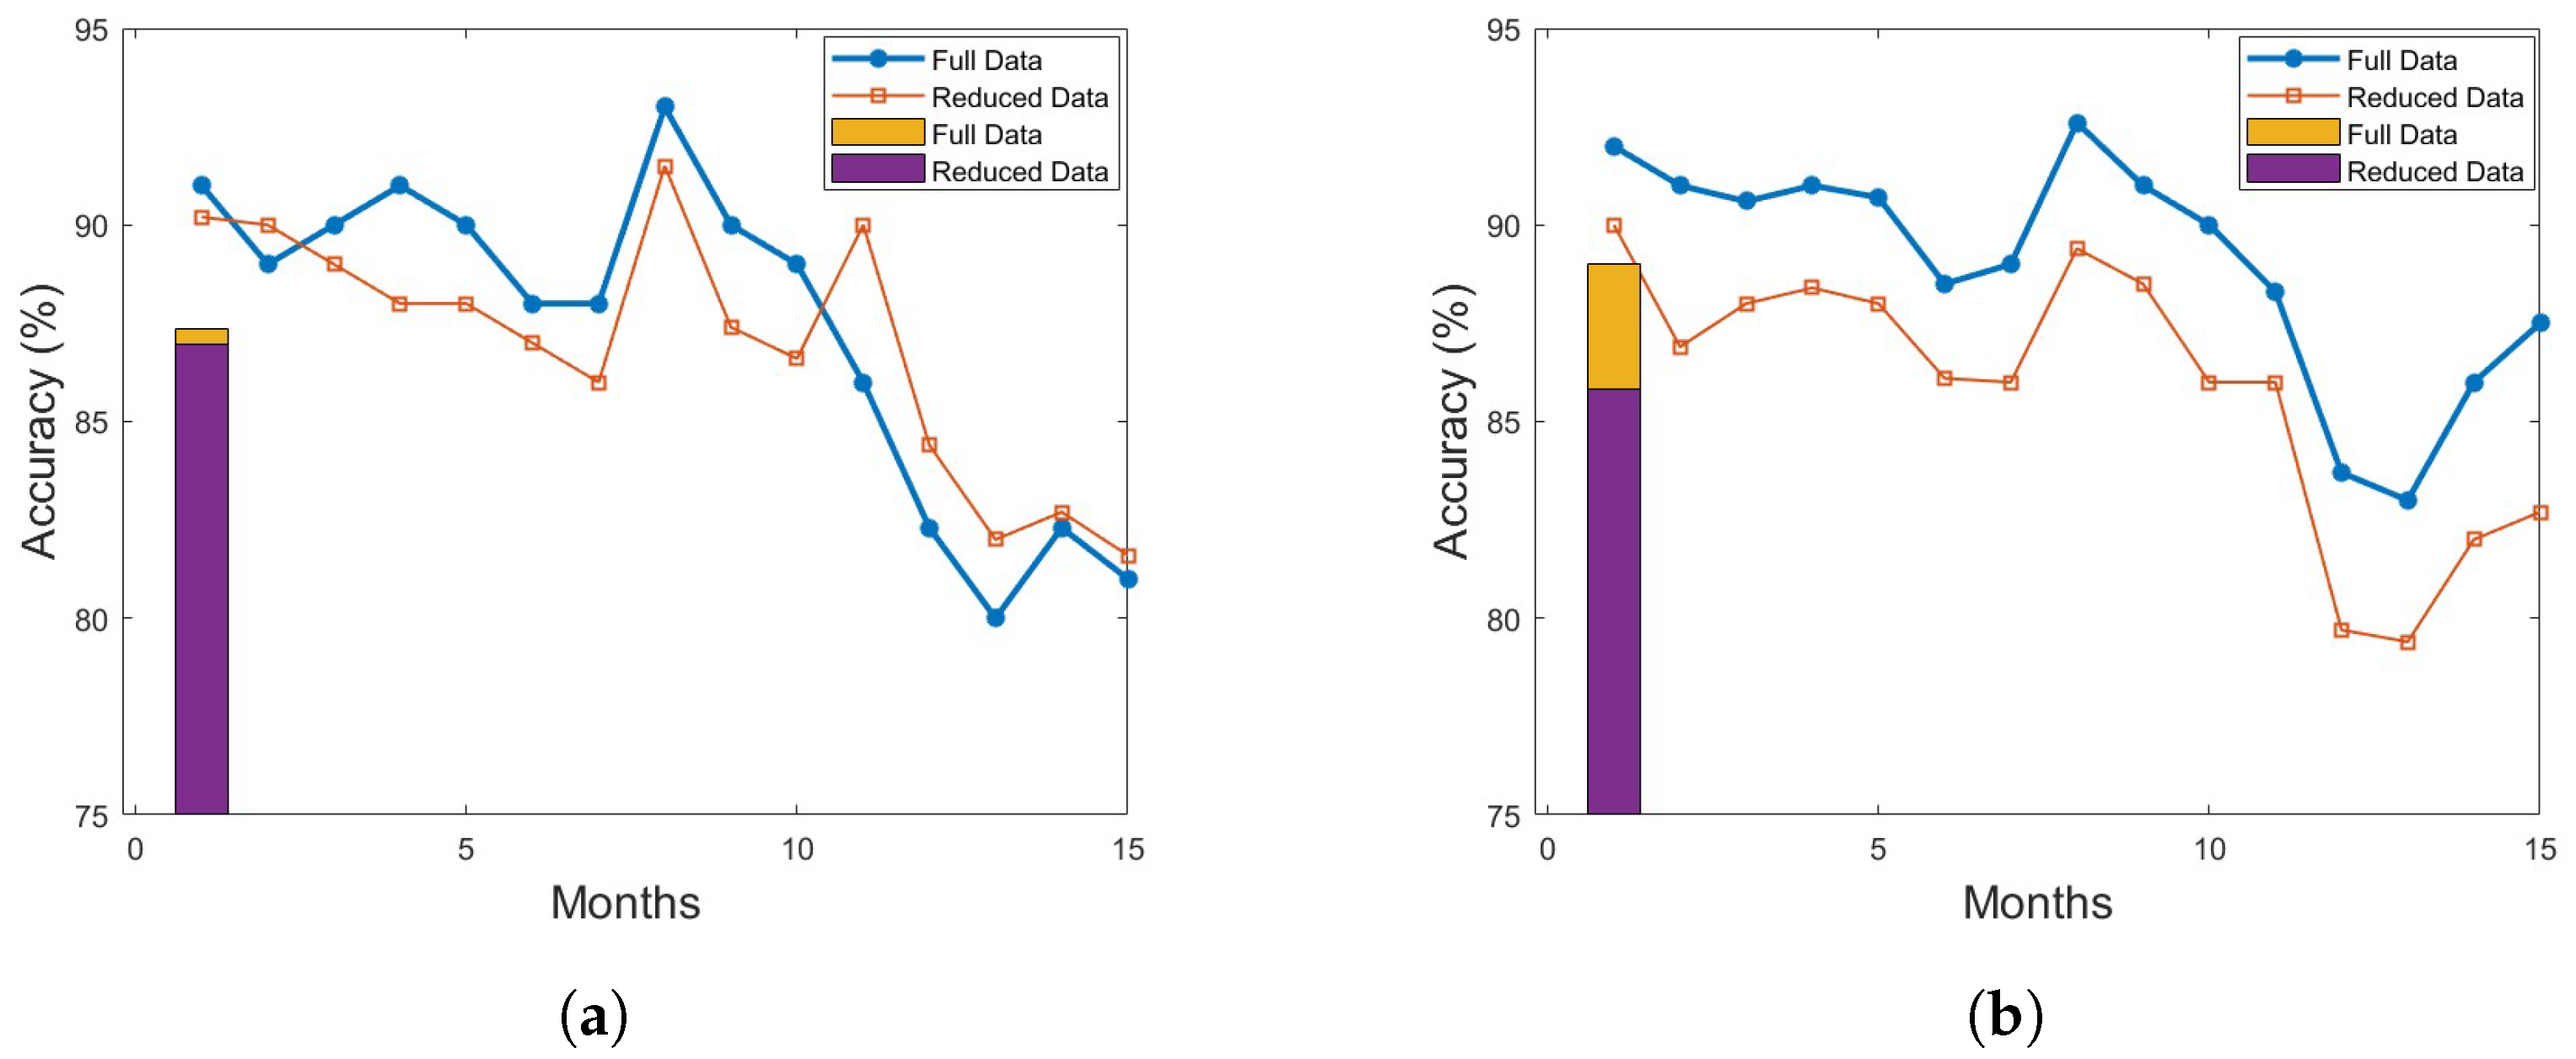
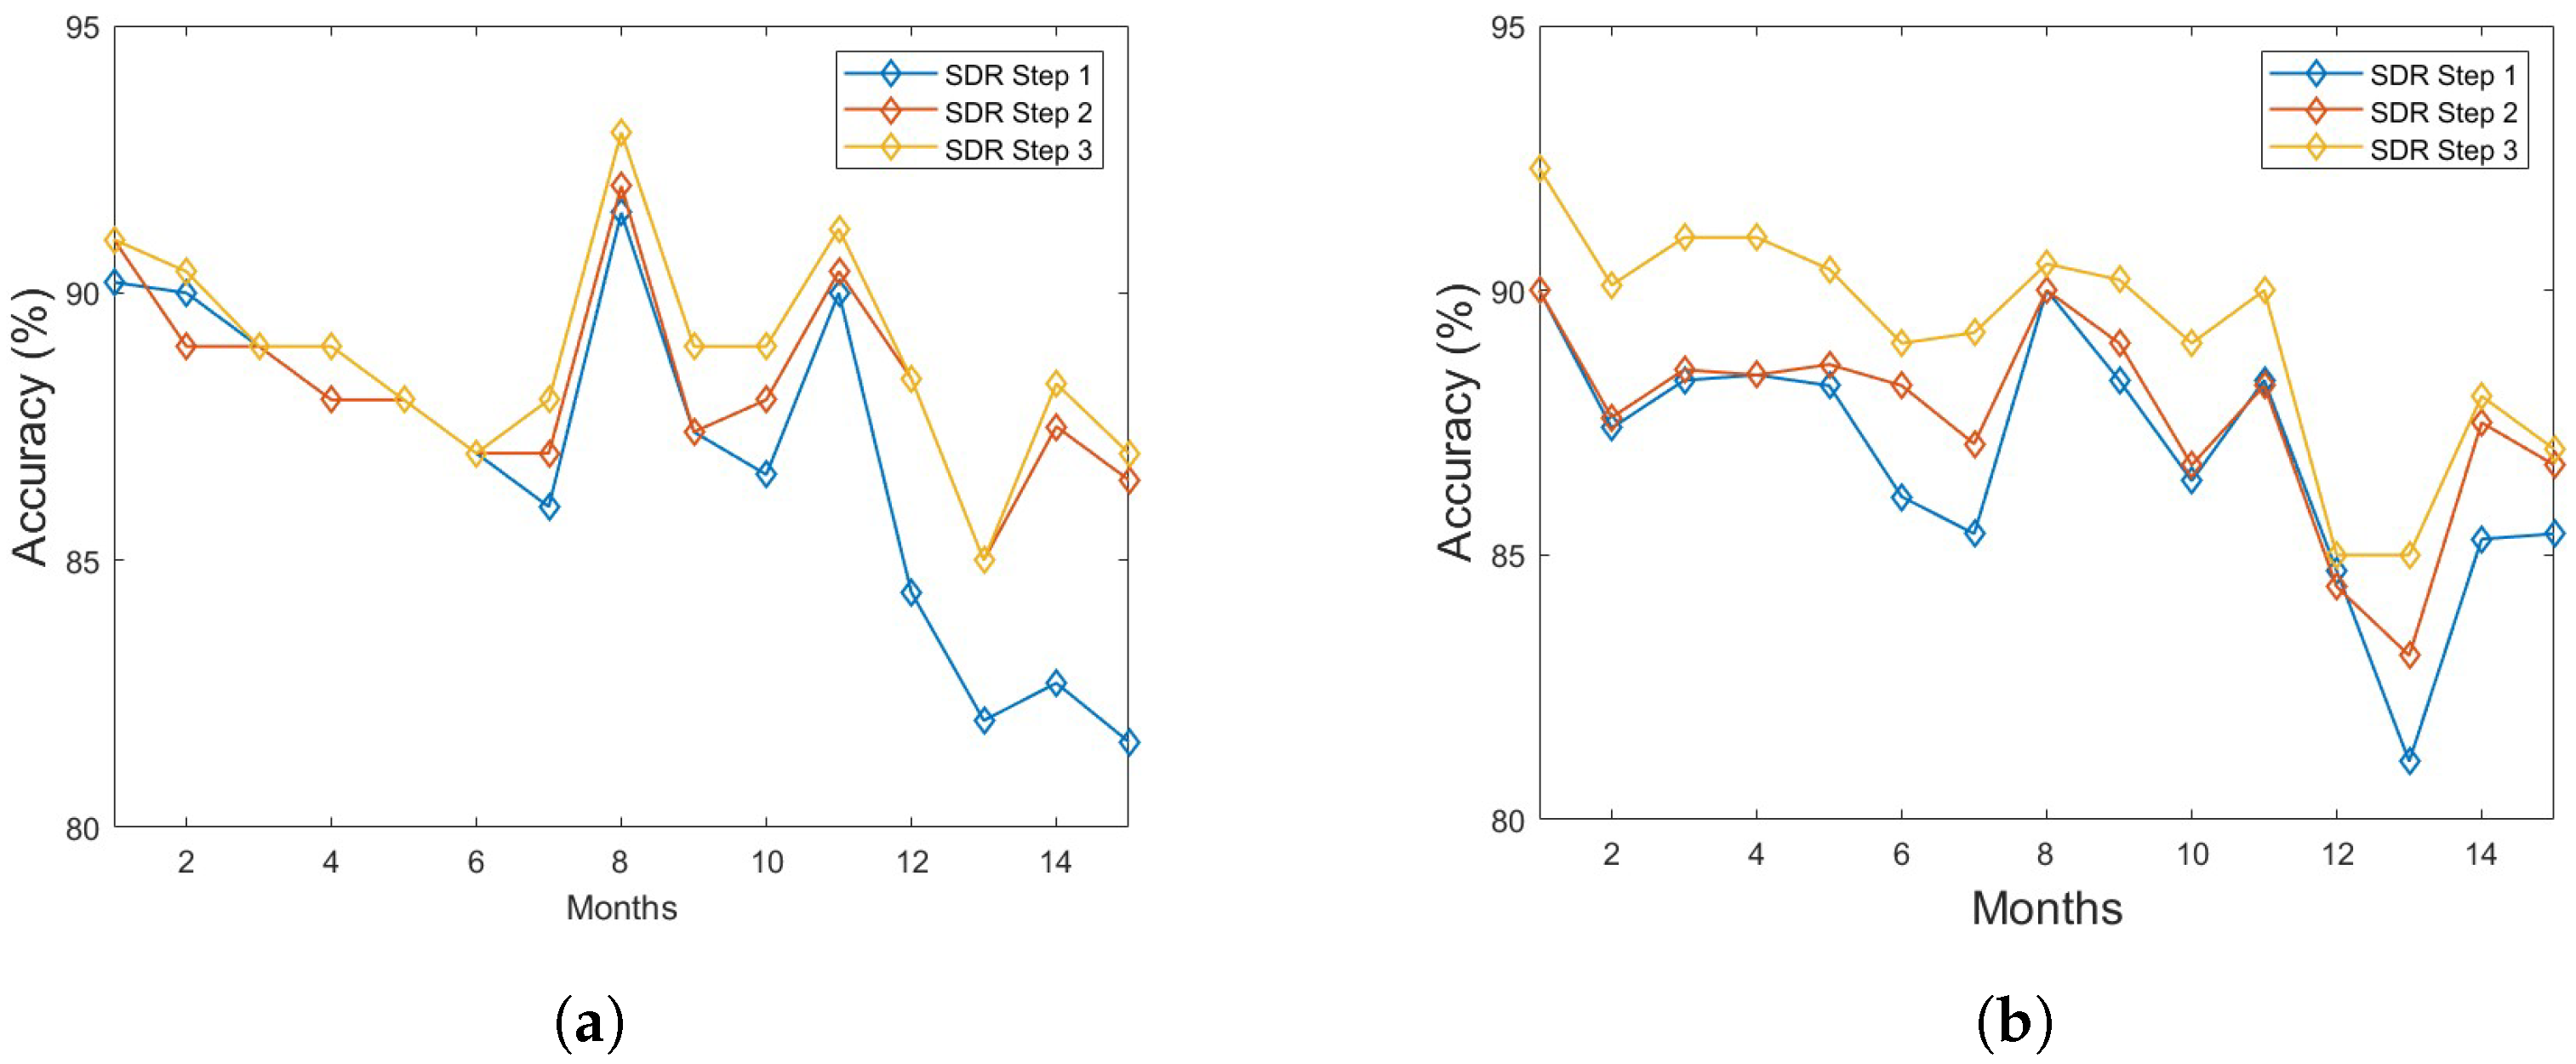
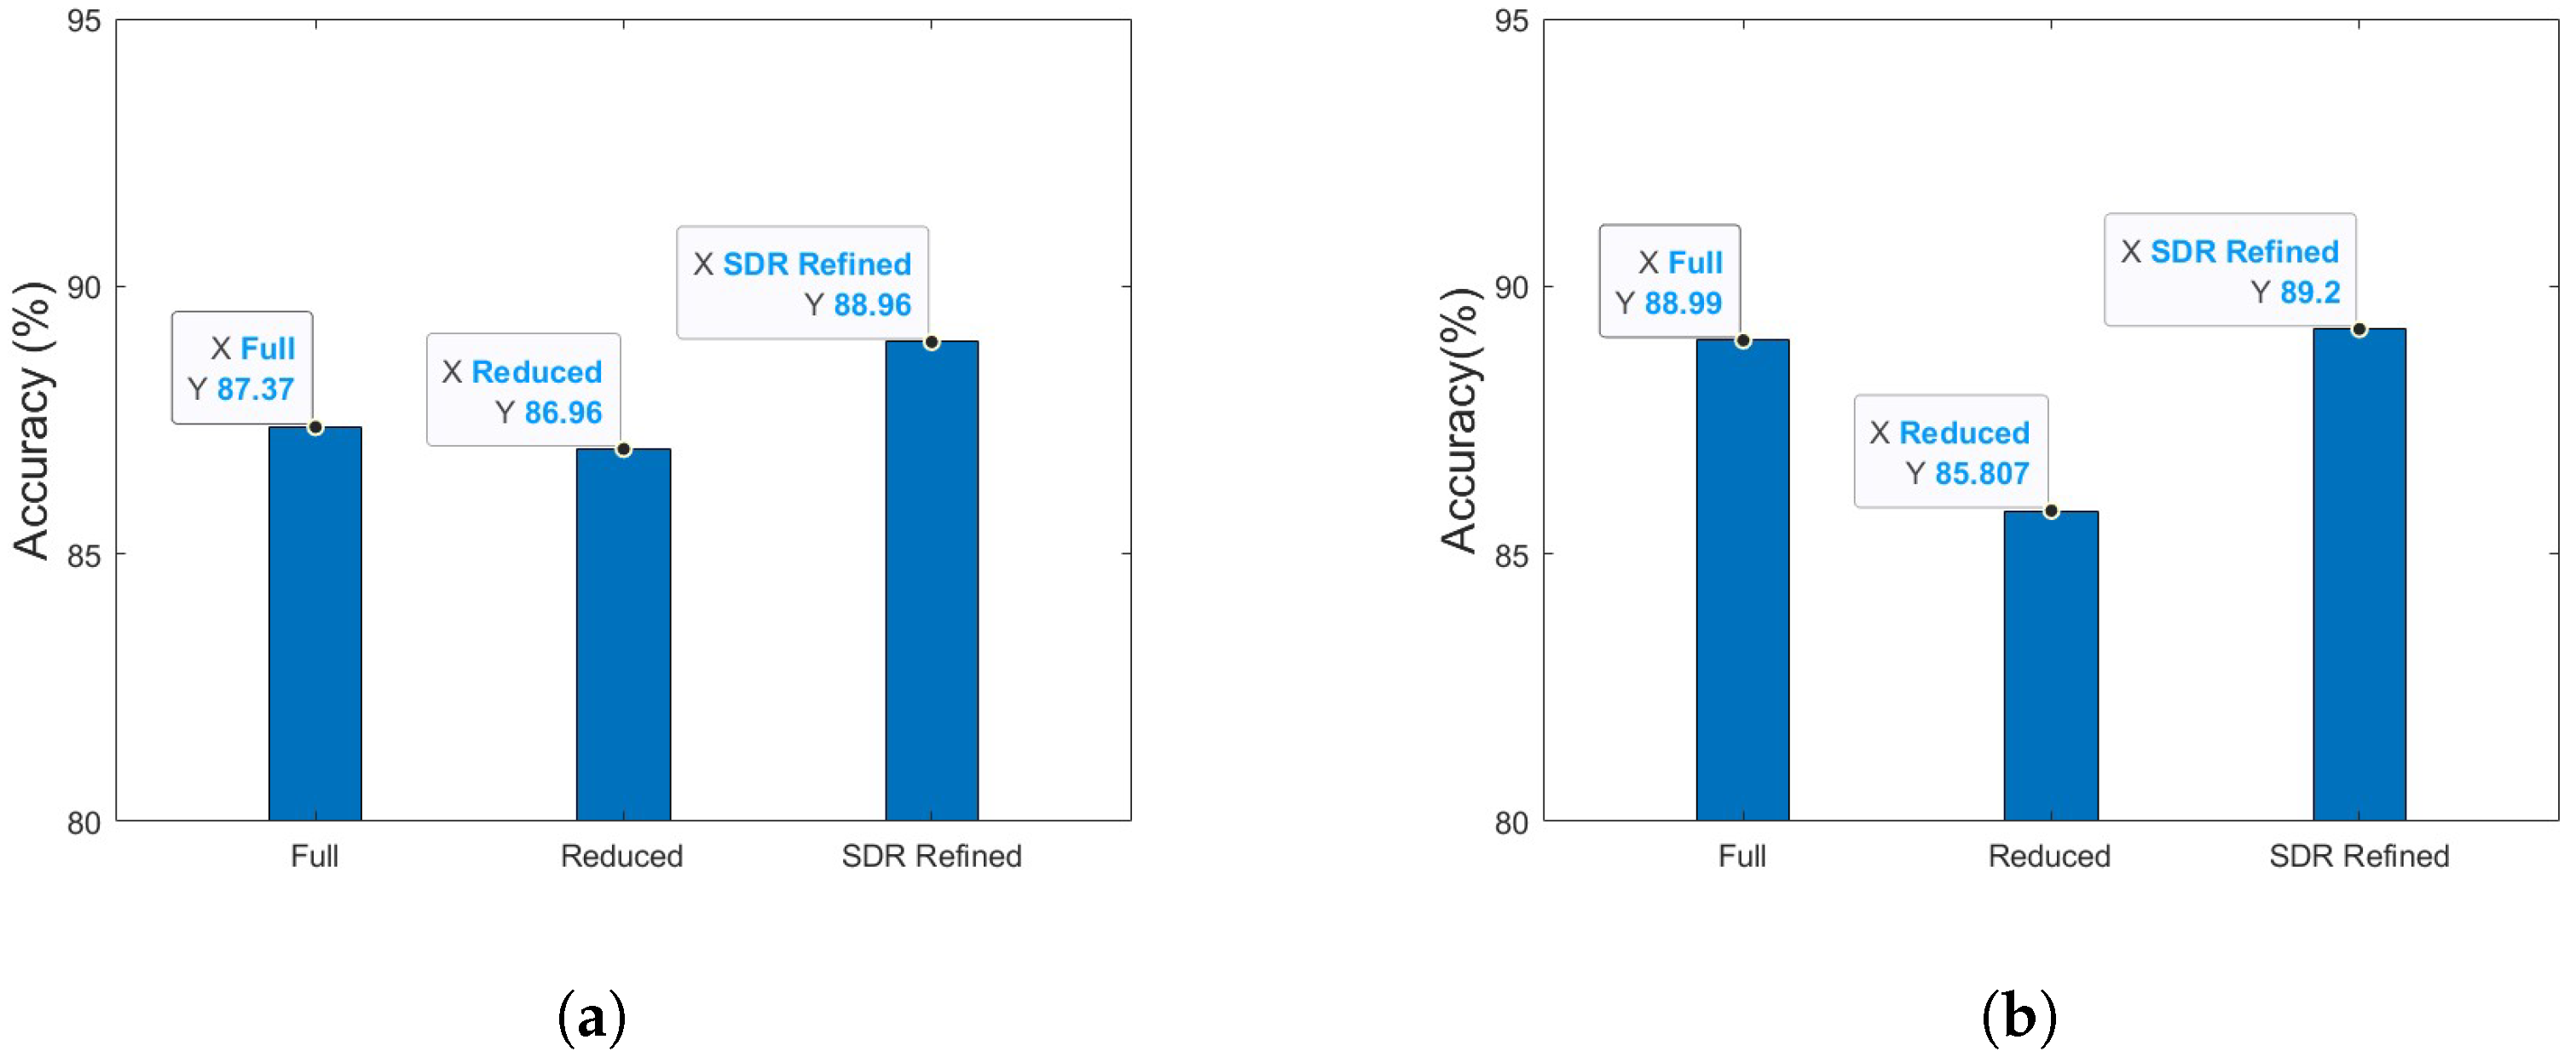
4.4.1. Classification Performance
4.4.2. Regression Performance
5. Discussion and Conclusions
Author Contributions
Funding
Data Availability Statement
Acknowledgments
Conflicts of Interest
References
- Sadowski, S.; Spachos, P.; Plataniotis, K.N. Memoryless Techniques and Wireless Technologies for Indoor Localization with the Internet of Things. IEEE Internet Things J. 2020, 7, 10996–11005. [Google Scholar]
- Sabanci, K.; Yigit, E.; Ustun, D.; Toktas, A.; Aslan, M.F. WiFi Based Indoor Localization: Application and Comparison of Machine Learning Algorithms. In Proceedings of the 2018 XXIIIrd International Seminar/Workshop on Direct and Inverse Problems of Electromagnetic and Acoustic Wave Theory (DIPED), Tbilisi, Georgia, 24–27 September 2018; pp. 246–251. [Google Scholar]
- Anzum, N.; Afroze, S.F.; Rahman, A. Zone-Based Indoor Localization Using Neural Networks: A View from a Real Testbed. In Proceedings of the 2018 IEEE International Conference on Communications (ICC), Kansas City, MO, USA, 20–24 May 2018; pp. 1–7. [Google Scholar]
- Belmonte-Fernandez, O.; Sansano-Sansano, E.; Caballer-Miedes, A.; Montoliu, R.; García-Vidal, R.; Gascó-Compte, A. A Generative Method for Indoor Localization Using Wi-Fi Fingerprinting. Sensors 2021, 21, 2392. [Google Scholar]
- Zhang, L.; Chen, Z.; Cui, W.; Li, B.; Chen, C.; Cao, Z.; Gao, K. WiFi-Based Indoor Robot Positioning Using Deep Fuzzy Forests. IEEE Internet Things J. 2020, 7, 10773–10781. [Google Scholar]
- Yang, Z.; Wu, C.; Liu, Y. Locating in fingerprint space: Wireless indoor localization with little human intervention. In Proceedings of the 18th Annual International Conference on Mobile Computing and Networking, Istanbul, Turkey, 22–26 August 2012; pp. 269–280. [Google Scholar]
- Xiang, P.; Ji, P.; Zhang, D. Enhance RSS-based indoor localization accuracy by leveraging environmental physical features. Wirel. Commun. Mob. Comput. 2018, 2018, 8956757. [Google Scholar]
- Tran, D.A.; Pham, C. Fast and accurate indoor localization based on spatially hierarchical classification. In Proceedings of the IEEE 11th International Conference on Mobile Ad Hoc and Sensor Systems (MASS), Philadelphia, PA, USA, 28–30 October 2014; pp. 118–126. [Google Scholar]
- Wang, Y.; Xiu, C.; Zhang, X.; Yang, D. WiFi indoor localization with CSI fingerprinting-based random forest. Sensors 2018, 18, 2869. [Google Scholar] [CrossRef]
- Zhang, W.; Liu, K.; Zhang, W.; Zhang, Y.; Gu, J. Deep neural networks for wireless localization in indoor and outdoor environments. Neurocomputing 2016, 194, 279–287. [Google Scholar] [CrossRef]
- Dou, F.; Lu, J.; Xu, T.; Huang, C.-H.; Bi, J. A Bisection Reinforcement Learning Approach to 3-D Indoor Localization. IEEE Internet Things J. 2021, 8, 6519–6535. [Google Scholar]
- Bi, J.; Huang, L.; Cao, H.; Yao, G.; Sang, W.; Zhen, J.; Liu, Y. Improved Indoor Fingerprinting Localization Method Using Clustering Algorithm and Dynamic Compensation. ISPRS Int. J. Geo-Inf. 2021, 10, 613. [Google Scholar]
- Gao, J.; Li, X.; Ding, Y.; Su, Q.; Liu, Z. WiFi-Based Indoor Positioning by Random Forest and Adjusted Cosine Similarity. In Proceedings of the 2020 Chinese Control And Decision Conference (CCDC), Hefei, China, 22–24 August 2020; pp. 1426–1431. [Google Scholar]
- Luo, M.; Zheng, J.; Sun, W.; Zhang, X. WiFi-based Indoor Localization Using Clustering and Fusion Fingerprint. In Proceedings of the 2021 40th Chinese Control Conference (CCC), Shanghai, China, 26–28 July 2021; pp. 3480–3485. [Google Scholar]
- Xiang, C.; Zhang, S.; Xu, S.; Chen, X.; Cao, S.; Alexandropoulos, G.C.; Lau, V.K. Robust Sub-Meter Level Indoor Localization with a Single WiFi Access Point—Regression Versus Classification. IEEE Access 2019, 7, 146309–146321. [Google Scholar] [CrossRef]
- Pinto, B.; Barreto, R.; Souto, E.; Oliveira, H. Robust RSSI-Based Indoor Positioning System Using K-Means Clustering and Bayesian Estimation. IEEE Sens. J. 2021, 21, 24462–24470. [Google Scholar]
- Gomes, R.; Ahsan, M.; Denton, A. Random Forest Classifier in SDN Framework for User-Based Indoor Localization. In Proceedings of the 2018 IEEE International Conference on Electro/Information Technology (EIT), Rochester, MI, USA, 3–5 May 2018; pp. 0537–0542. [Google Scholar]
- Liang, D.; Zhang, Z.; Peng, M. Access Point Reselection and Adaptive Cluster Splitting-Based Indoor Localization in Wireless Local Area Networks. IEEE Internet Things J. 2015, 2, 573–585. [Google Scholar] [CrossRef]
- Alraih, S.; Alhammadi, A.; Shayea, I.; Al-Samman, A.M. Improving accuracy in indoor localization system using fingerprinting technique. In Proceedings of the 2017 International Conference on Information and Communication Technology Convergence (ICTC), Jeju, Republic of Korea, 18–20 October 2017; pp. 274–277. [Google Scholar]
- Chen, W.; Chang, Q.; Hou, H.-T.; Wang, W.-P. A novel clustering and KWNN-based strategy for Wi-Fi fingerprint indoor localization. In Proceedings of the 2015 4th International Conference on Computer Science and Network Technology (ICCSNT), Harbin, China, 19–20 December 2015; pp. 49–52. [Google Scholar]
- Li, L.; Guo, X.; Zhao, M.; Li, H.; Ansari, N. TransLoc: A Heterogeneous Knowledge Transfer Framework for Fingerprint-Based Indoor Localization. IEEE Trans. Wirel. Commun. 2021, 20, 3628–3642. [Google Scholar] [CrossRef]
- Guo, X.; Elikplim, N.R.; Ansari, N.; Li, L.; Wang, L. Robust WiFi Localization by Fusing Derivative Fingerprints of RSS and Multiple Classifiers. IEEE Trans. Ind. Inf. 2020, 16, 3177–3186. [Google Scholar] [CrossRef]
- Li, L.; Guo, X.; Ansari, N. SmartLoc: Smart Wireless Indoor Localization Empowered by Machine Learning. IEEE Trans. Ind. Electron. 2020, 67, 6883–6893. [Google Scholar] [CrossRef]
- Zhang, G.; Wang, P.; Chen, H.; Zhang, L. Wireless Indoor Localization Using Convolutional Neural Network and Gaussian Process Regression. Sensors 2019, 19, 2508. [Google Scholar]
- Soro, B.; Lee, C. A Wavelet Scattering Feature Extraction Approach for Deep Neural Network Based Indoor Fingerprinting Localization. Sensors 2019, 19, 1790. [Google Scholar] [CrossRef]
- Li, L.; Guo, X.; Ansari, N. A Hybrid Fingerprint Quality Evaluation Model for WiFi Localization. IEEE Internet Things J. 2019, 6, 9829–9840. [Google Scholar] [CrossRef]
- Khassanov, Y.; Nurpeiissov, M.; Sarkytbayev, A.; Kuzdeuov, A.; Varol, H.A. Finer-level Sequential WiFi-based Indoor Localization. In Proceedings of the 2021 IEEE/SICE International Symposium on System Integration (SII), Iwaki, Japan, 11–14 January 2021; pp. 163–169. [Google Scholar]
- Sinha, R.S.; Hwang, S.H. Comparison of CNN Applications for RSSI-based Fingerprint Indoor Localization. Electronics 2019, 8, 989. [Google Scholar] [CrossRef]
- Thirunavukkarasu, K.; Sing, A.; Rai, P. Classification of IRIS Dataset using Classification Based KNN Algorithm in Supervised Learning. In Proceedings of the 2018 4th International Conference on Computing Communication and Automation (ICCCA), Greater Noida, India, 14–15 December 2018. [Google Scholar]
- Mendoza-Silva, G.; Richter, P.; Torres-Sospedra, J.; Lohan, E.; Huerta, J. Long-Term WiFi Fingerprinting Dataset for Research on Robust Indoor Positioning. Data 2018, 3, 3. [Google Scholar] [CrossRef]
- Sinaga, K.P.; Yang, M.-S. Unsupervised K-Means Clustering Algorithm. IEEE Access 2020, 8, 80716–80727. [Google Scholar] [CrossRef]
- Bhatti, M.A.; Riaz, R.; Rizvi, S.S.; Shokat, S.; Riaz, F.; Kwon, S.J. Outlier detection in indoor localization and Internet of Things (IoT) using machine learning. J. Commun. Netw. 2020, 22, 236–243. [Google Scholar] [CrossRef]
- Chamasemani, F.F.; Singh, Y.P. Multi-class Support Vector Machine (SVM) Classifiers—An Application in Hypothyroid Detection and Classification. In Proceedings of the 2011 Sixth International Conference on Bio-Inspired Computing: Theories and Applications, Penang, Malaysia, 27–29 September 2011; pp. 351–356. [Google Scholar]
- Prakash, J.S. Multi class Support Vector Machines classifier for machine vision application. In Proceedings of the 2012 International Conference on Machine Vision and Image Processing (MVIP), Coimbatore, India, 14–15 December 2012. [Google Scholar]
- Sangeetha, R. Performance Evaluation of Kernels in Multiclass Support Vector Machines. Int. J. Soft Comput. Eng. (IJSCE) 2011, 1, 2231–2307. [Google Scholar]
- Breiman, L. Random Forests. Mach. Learn. 2001, 45, 5–32. [Google Scholar] [CrossRef]
- Guo, X.; Ansari, N. Localization by fusing a group of fingerprints via multiple antennas in indoor environment. IEEE Trans. Veh. Technol. 2017, 66, 9904–9915. [Google Scholar] [CrossRef]
- Wang, R.; Fu, B. Deep and Cross Network for AD Click Predictions. In Proceedings of the ADKDD 17, Halifax, NS, Canada, 13–17 August 2017; pp. 1–7. [Google Scholar]
- Wu, H.; Shapiro, J.L. Does overfitting affect performance in estimation of distribution algorithms. In Proceedings of the Conference on Genetic and Evolutionary Computation, ACM, Seattle, WA, USA, 8–12 July 2006; pp. 433–434. [Google Scholar]
- Zou, J.; Han, Y.; So, S.S. Overview of Artificial Neural Networks. In Artificial Neural Networks. Methods in Molecular Biology™; Livingstone, D.J., Ed.; Humana Press: Totowa, NJ, USA, 2008; Volume 458. [Google Scholar]
- Bebis, G.; Georgiopoulos, M. Feed-forward neural networks. IEEE Potentials 1994, 13, 27–31. [Google Scholar] [CrossRef]
- Cybenko, G. Approximation by superpositions of a sigmoidal function. Math. Control Signal Syst. 1989, 2, 303–314. [Google Scholar] [CrossRef]
- Rizk, H.; Torki, M.; Youssef, M. CellinDeep: Robust and Accurate Cellular-Based Indoor Localization via Deep Learning. IEEE Sens. J. 2019, 19, 2305–2312. [Google Scholar] [CrossRef]
- Ruder, S. An overview of gradient descent optimization algorithms. Cornell University. [Submitted on 15 September 2016 (v1), last revised 15 June 2017 (this version, v2). Aylien Ltd., Dublin ]. arXiv 2016, arXiv:1609.04747. [Google Scholar]
- Wu, C.; Xu, J.; Yang, Z.; Lane, N.D.; Yin, Z. Gain without pain: Accurate WiFi-based localization using fingerprint spatial gradient. Proc. ACM UbiComp 2017, 1, 29. [Google Scholar] [CrossRef]
- Guo, X.; Li, L.; Ansari, N.; Liao, B. Knowledge aided adaptive localization via global fusion profile. IEEE Internet Things J. 2017, 5, 1081–1089. [Google Scholar] [CrossRef]
- Guo, X.; Zhu, S.; Li, L.; Hu, F.; Ansari, N. Accurate WiFi localization by unsupervised fusion of extended candidate location set. IEEE Internet Things J. 2018, 6, 2476–2485. [Google Scholar] [CrossRef]
- Guo, X.; Li, L.; Feng, X.; Ansari, N. Expectation maximization indoor localization utilizing supporting set for internet of things. IEEE Internet Things J. 2018, 6, 2573–2582. [Google Scholar] [CrossRef]
- Gwon, Y.; Jain, R.; Kawahara, T. Robust indoor location estimation of stationary and mobile users. In Proceedings of the IEEE INFOCOM, San Jose, CA, USA, 25–29 October 2004; pp. 1032–1043. [Google Scholar]


| Classifier | Training Time | Response Time | |
|---|---|---|---|
| Unprocessed Data | Refined Data | ||
| SVM | 0.15 | 0.01 | 0.0009 |
| RF | 9.7 | 4.7 | 0.0019 |
| Floor | Sub-Area | Offline Samples | Online Samples | Training Time (s) |
|---|---|---|---|---|
| 3 | 1 | 1800 | 9000 | 45.7 |
| 3 | 2 | 1800 | 9000 | 33.4 |
| 3 | 3 | 1800 | 9000 | 42.1 |
| 3 | 4 | 1800 | 9000 | 20.15 |
| 5 | 1 | 1800 | 9000 | 23.6 |
| 5 | 2 | 1800 | 9000 | 59.2 |
| 5 | 3 | 1800 | 9000 | 37.3 |
| 5 | 4 | 1800 | 9000 | 66.27 |
| Total/Average | 8 | 14,400 | 72,000 | 327.72 |
| Floor 3 | |||||
|---|---|---|---|---|---|
| Sub-Area | AED (m) | 25th Percentile (m) | 50th Percentile (m) | 75th Percentile (m) | 95th Percentile (m) |
| 1 | 2.02 | 1.2500 | 1.9000 | 2.6500 | 3.7900 |
| 2 | 2.316 | 1.51 | 2.20 | 2.93 | 4.0 |
| 3 | 1.94 | 1.21 | 1.862 | 2.577 | 3.6073 |
| 4 | 2.34 | 1.4000 | 2.1900 | 3.0200 | 4.2700 |
| Floor 5 | |||||
| 1 | 1.99 | 1.1500 | 1.8460 | 2.5900 | 3.4780 |
| 2 | 2.38 | 1.4320 | 2.2000 | 3.0800 | 4.3500 |
| 3 | 1.79 | 1.0000 | 1.6000 | 2.2500 | 3.1100 |
| 4 | 1.95 | 1.1000 | 1.7300 | 2.3400 | 3.2800 |
| Methods | 25th Percentile | 50th Percentile | 75th Percentile | AED | Response Time |
|---|---|---|---|---|---|
| MSSE [49] | 1.58 | 3.01 | 4.86 | 3.34 | 10.4 |
| KAAL [46] | 1.65 | 3.28 | 4.68 | 3.26 | 12.6 |
| ViVi [45] | 1.79 | 3.39 | 4.37 | 3.21 | 41.2 |
| Wi-Fi-FAGOT [47] | 1.55 | 2.47 | 3.88 | 2.79 | 228 |
| SmartLoc [23] | 1.23 | 2.29 | 3.46 | 2.58 | 281 |
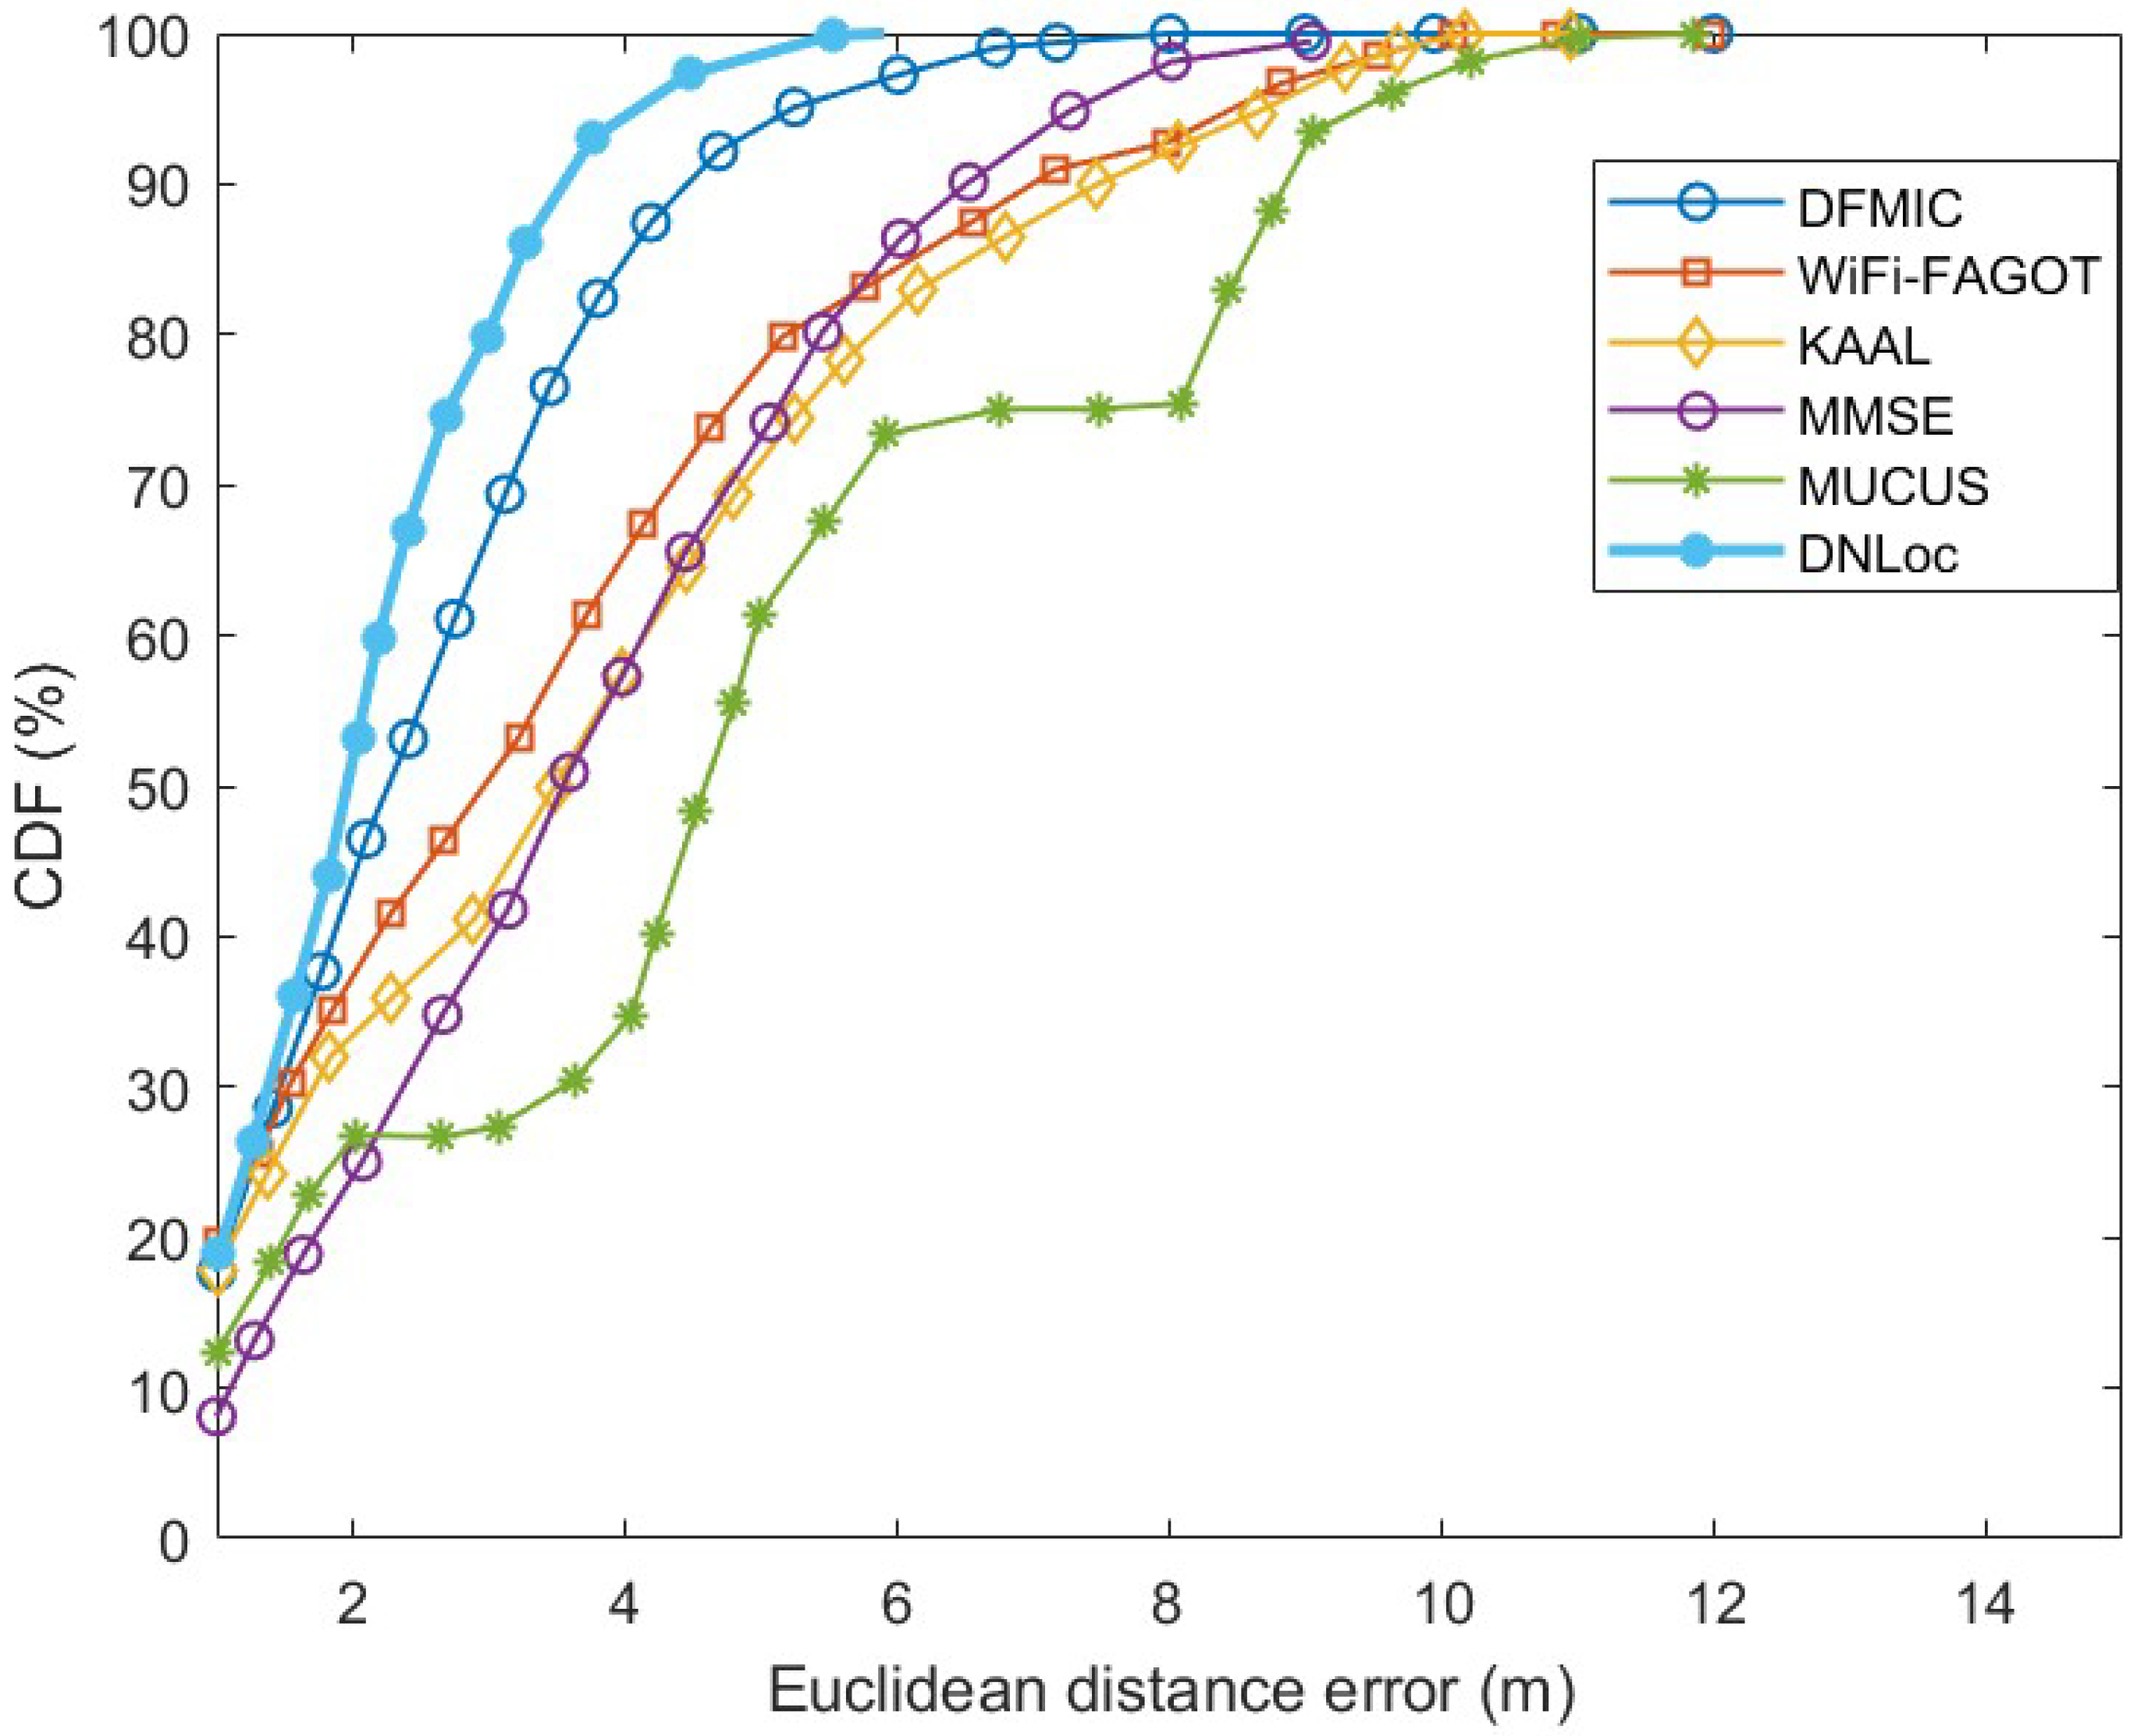
| DNLoc | 1.2565 | 1.9410 | 2.68 | 2.09 | 100 |
Disclaimer/Publisher’s Note: The statements, opinions and data contained in all publications are solely those of the individual author(s) and contributor(s) and not of MDPI and/or the editor(s). MDPI and/or the editor(s) disclaim responsibility for any injury to people or property resulting from any ideas, methods, instructions or products referred to in the content. |
© 2023 by the authors. Licensee MDPI, Basel, Switzerland. This article is an open access article distributed under the terms and conditions of the Creative Commons Attribution (CC BY) license (https://creativecommons.org/licenses/by/4.0/).
Share and Cite
Umair, S.M.A.; Arslan, T. A Narrow-Down Approach Based on Machine Learning for Indoor Localization. Algorithms 2023, 16, 529. https://doi.org/10.3390/a16110529
Umair SMA, Arslan T. A Narrow-Down Approach Based on Machine Learning for Indoor Localization. Algorithms. 2023; 16(11):529. https://doi.org/10.3390/a16110529
Chicago/Turabian StyleUmair, Sahibzada Muhammad Ahmad, and Tughrul Arslan. 2023. "A Narrow-Down Approach Based on Machine Learning for Indoor Localization" Algorithms 16, no. 11: 529. https://doi.org/10.3390/a16110529
APA StyleUmair, S. M. A., & Arslan, T. (2023). A Narrow-Down Approach Based on Machine Learning for Indoor Localization. Algorithms, 16(11), 529. https://doi.org/10.3390/a16110529