
An Intelligent Injury Rehabilitation Guidance System for Recreational Runners Using Data Mining Algorithms

 ,
,  ,
, 
Abstract
:1. Introduction
2. Related Work
2.1. Clinical Reasoning
- The degree of the symptoms, particularly the perceived level of pain, was correlated with the severity of the damage. The level to which the patient’s activities of daily living are impacted is a major factor in determining how severe the pain is quantified. Pain can be measured in a variety of methods, including using the Visual Analogue Scale (VAS).
- The degree of activity needed for symptoms to worsen, how bad the symptoms are, and how long it takes for the symptoms to go away can all be used to gauge how irritable the tissue is. The ratio of aggravating to mitigating factors is another way to measure irritability.
- The patient’s diagnosis, the sort of symptoms and/or pain, individual traits/psychosocial factors, and red and yellow flags all contribute to the injury’s nature.
- The stage of the injury, which refers to how long symptoms have been present. The primary categorizations include the acute phase (spanning less than 3 weeks), the subacute stage (occurring between 3 and 6 weeks), the chronic phase (extending beyond 6 weeks), and the acute stage of a chronic condition (which pertains to a recent exacerbation of symptoms in a condition that the patient has been managing for over 6 weeks).
- The stability of the injury, which refers to the way in which the symptoms develop, where it refers to the improvement, deterioration, and unchanging and fluctuating status of the injury.
2.2. Clinical Decision Making
3. Dataset and Data Pre-Processing
3.1. Dataset
- The age of the recreational runner (Age).
- The height of a recreational runner (Height).
- The weight of the recreational runner (Weight).
- The gender of the recreational runner (Gender).
- The experience of the recreational runner (Experience).
- Whether the recreational runner feels any musculoskeletal discomfort (e.g., pain, tightness, heaviness) related to running activity (Musculoskeletal Discomfort)
- If there is any discomfort, specify the area of the body in which it occurs (Symptom Area). The possible choices are:
- (a)
- Lower back
- (b)
- Knee
- (c)
- Calf muscle
- (d)
- Hip
- (e)
- Sole
- (f)
- Thigh
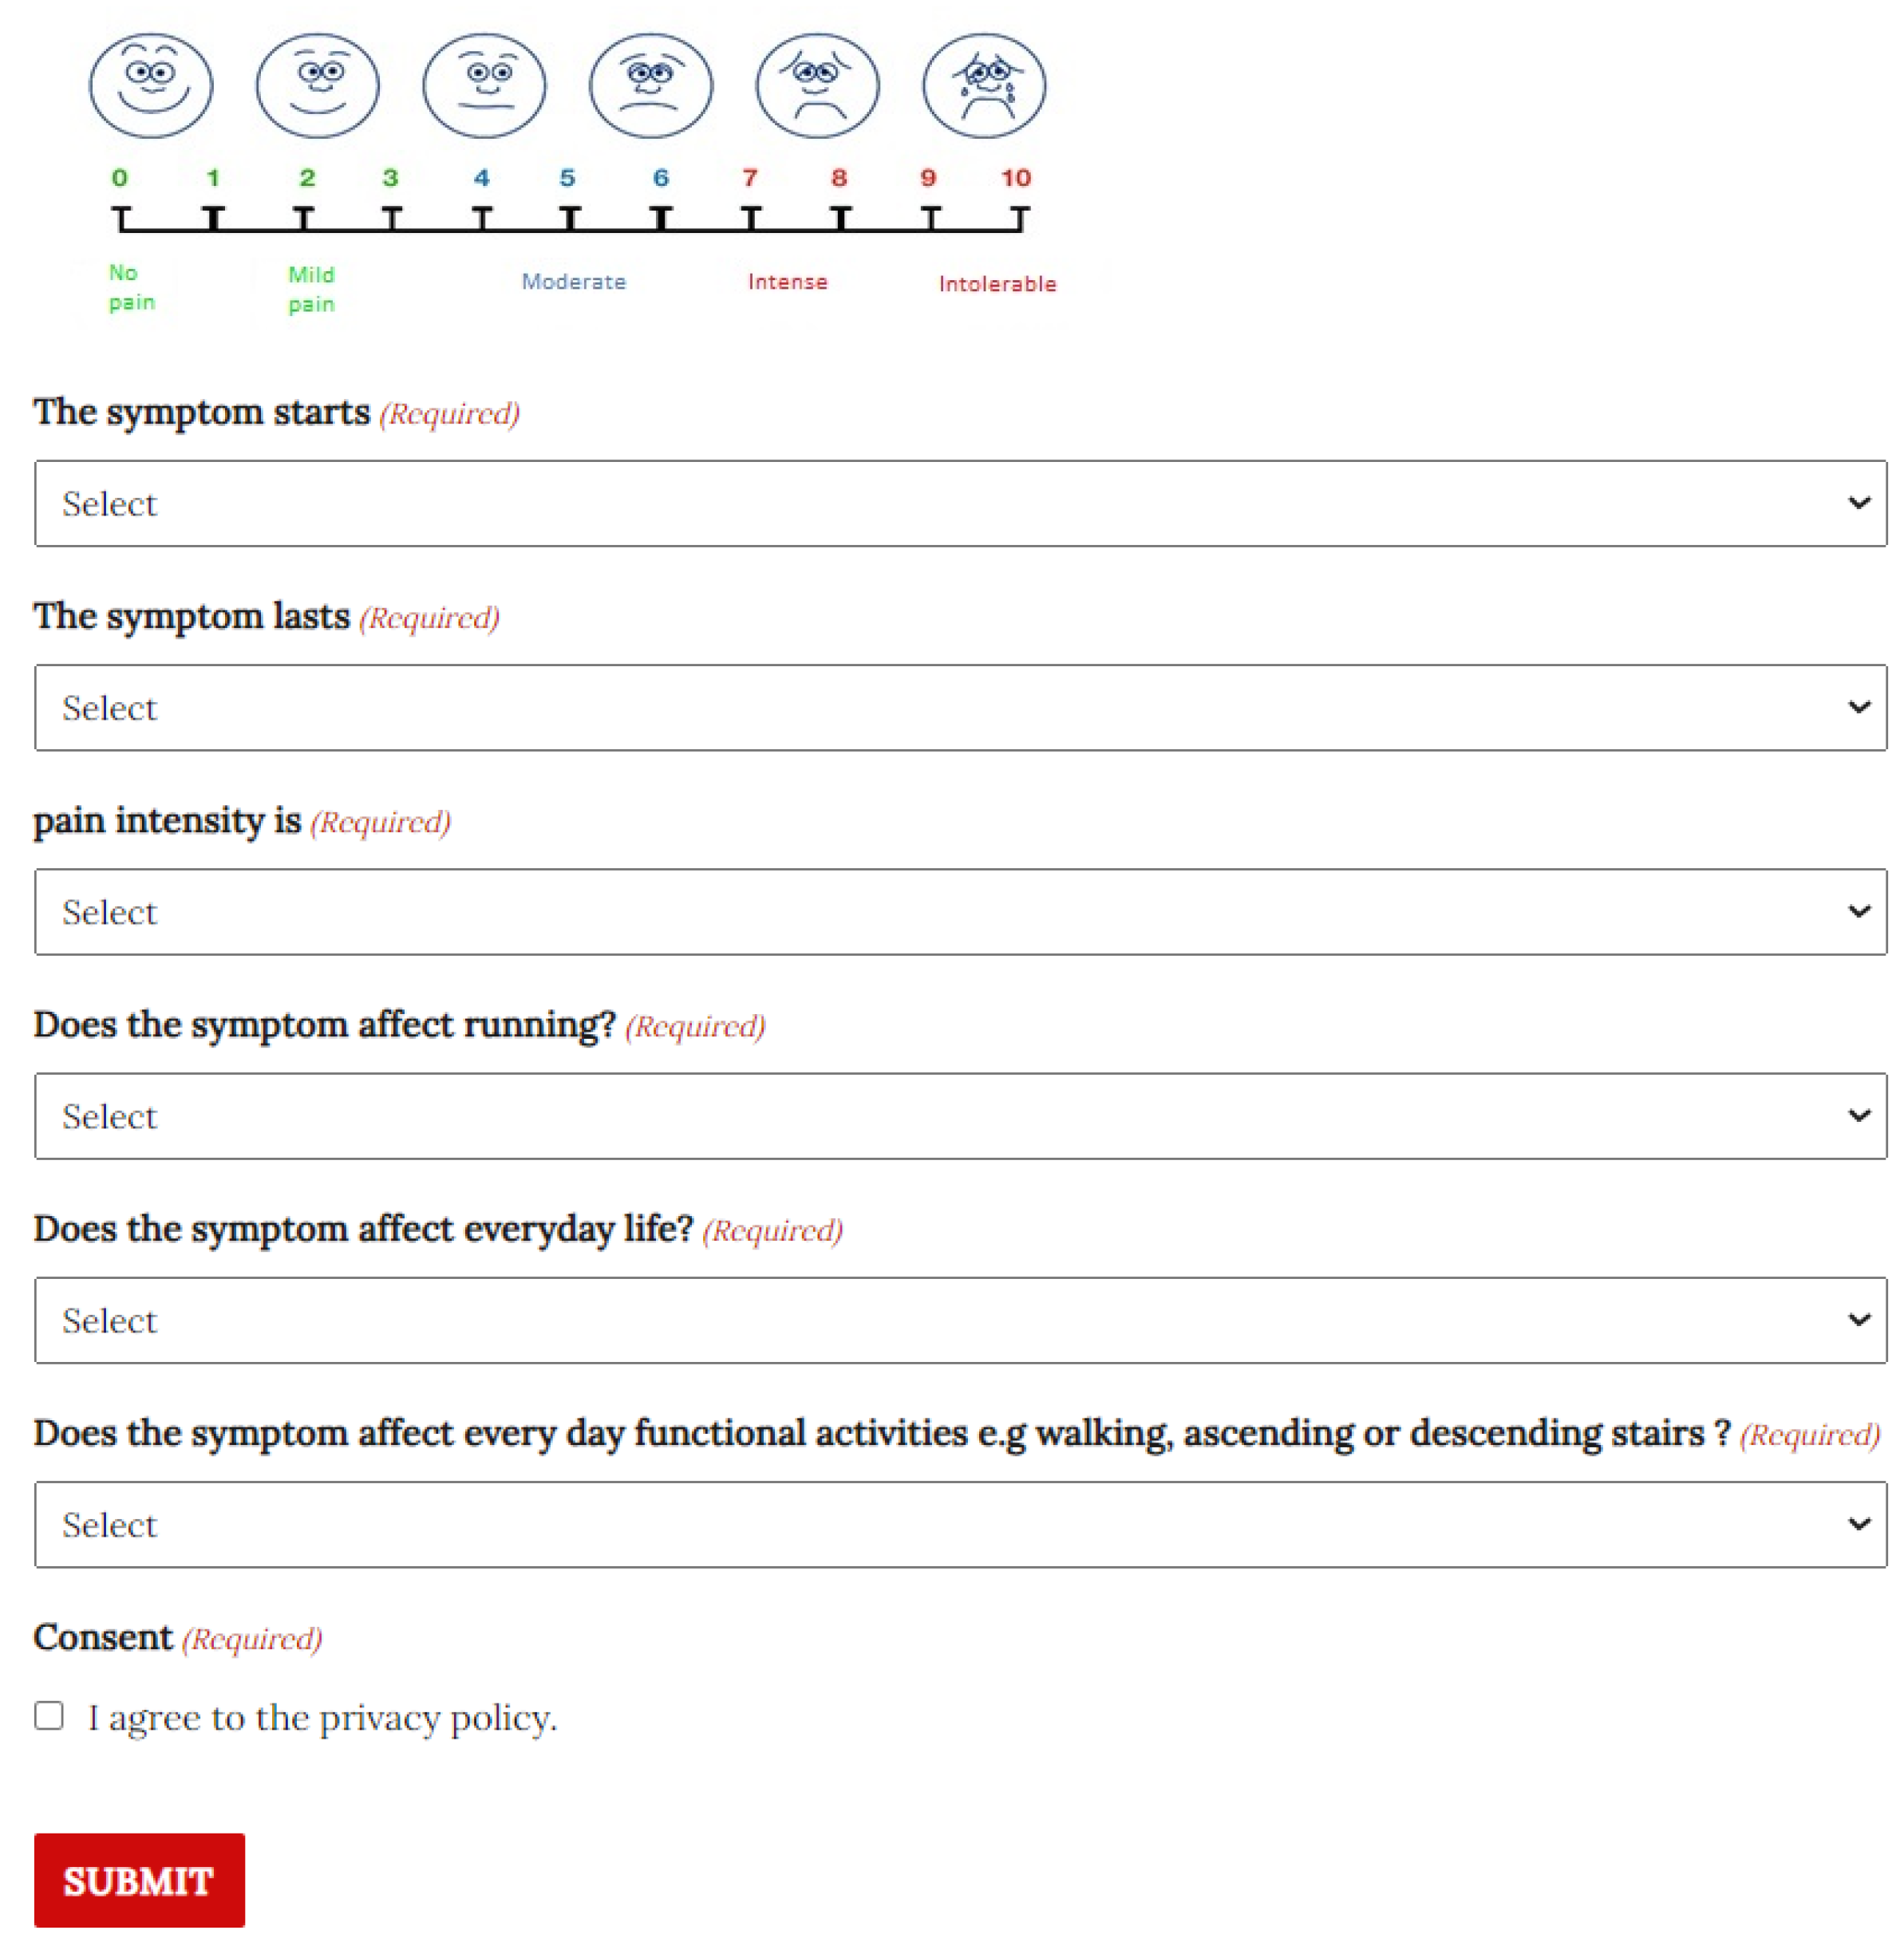
- The intensity of the pain felt by the discomfort (Pain Intensity). The possible values are on a scale of one to ten:
- (a)
- 0–3—No pain or slight pain.
- (b)
- 4–6—Moderate pain.
- (c)
- 7–8—Intense pain.
- (d)
- 9–10—Insufferable pain.
- The occasion on which the discomfort occurs (Irritability—WHEN). The possible choices are:
- (a)
- When the recreational runner starts running.
- (b)
- When the recreational runner stops running.
- (c)
- During running.
- The duration of the discomfort (Irritability—DURATION). The possible choices are:
- (a)
- The discomfort does not stop until the next training session.
- (b)
- The discomfort lasts for one or two hours after the running session but stops until the next session.
- (c)
- The discomfort lasts while running but stops later on.
- The intensity of the discomfort (Irritability—INTENSITY). The possible choices are:
- (a)
- Increases by three degrees (according to the Pain Intensity Scale).
- (b)
- Increases one or two degrees.
- (c)
- Remains constant.
- The effect the discomfort has on running (Severity—RUNNING). The possible choices are:
- (a)
- No significant effect.
- (b)
- Affects the running distance or the rhythm of running.
- (c)
- Halts the running session.
- The effect the discomfort has on everyday life (Severity—LIFE). It is a yes-or-no question.
- The effect the discomfort has on everyday functional activities (Severity—MOBILITY). It is a yes-or-no question.
- Reduce the training load by 30%; complete musculoskeletal functional release exercises, stretching, strengthening exercises, and functional exercises.
- Reduce the training load by 50%; complete musculoskeletal functional release exercises, stretching, strengthening exercises, and functional exercises.
- Cessation of training for one week followed by musculoskeletal functional release exercises, stretching, and strengthening exercises.
- Cessation of training for two weeks followed by musculoskeletal functional release exercises and stretching exercises.
- Cessation of training for three weeks followed by musculoskeletal functional release exercises and stretching exercises.
- Seek medical advice and cease training for at least three weeks, followed by musculoskeletal functional release exercises and stretching exercises.
- PAIN—Involves question (8), and its values are based on the scale value of the Pain Intensity.
- IRRITABILITY—Involves questions (9), (10), and (11), and its values are low, moderate, and high.
- SEVERITY—Involves questions (12), (13), and (14), and its values are low, moderate, and high.
3.2. Data Pre-Processing
4. Methodology
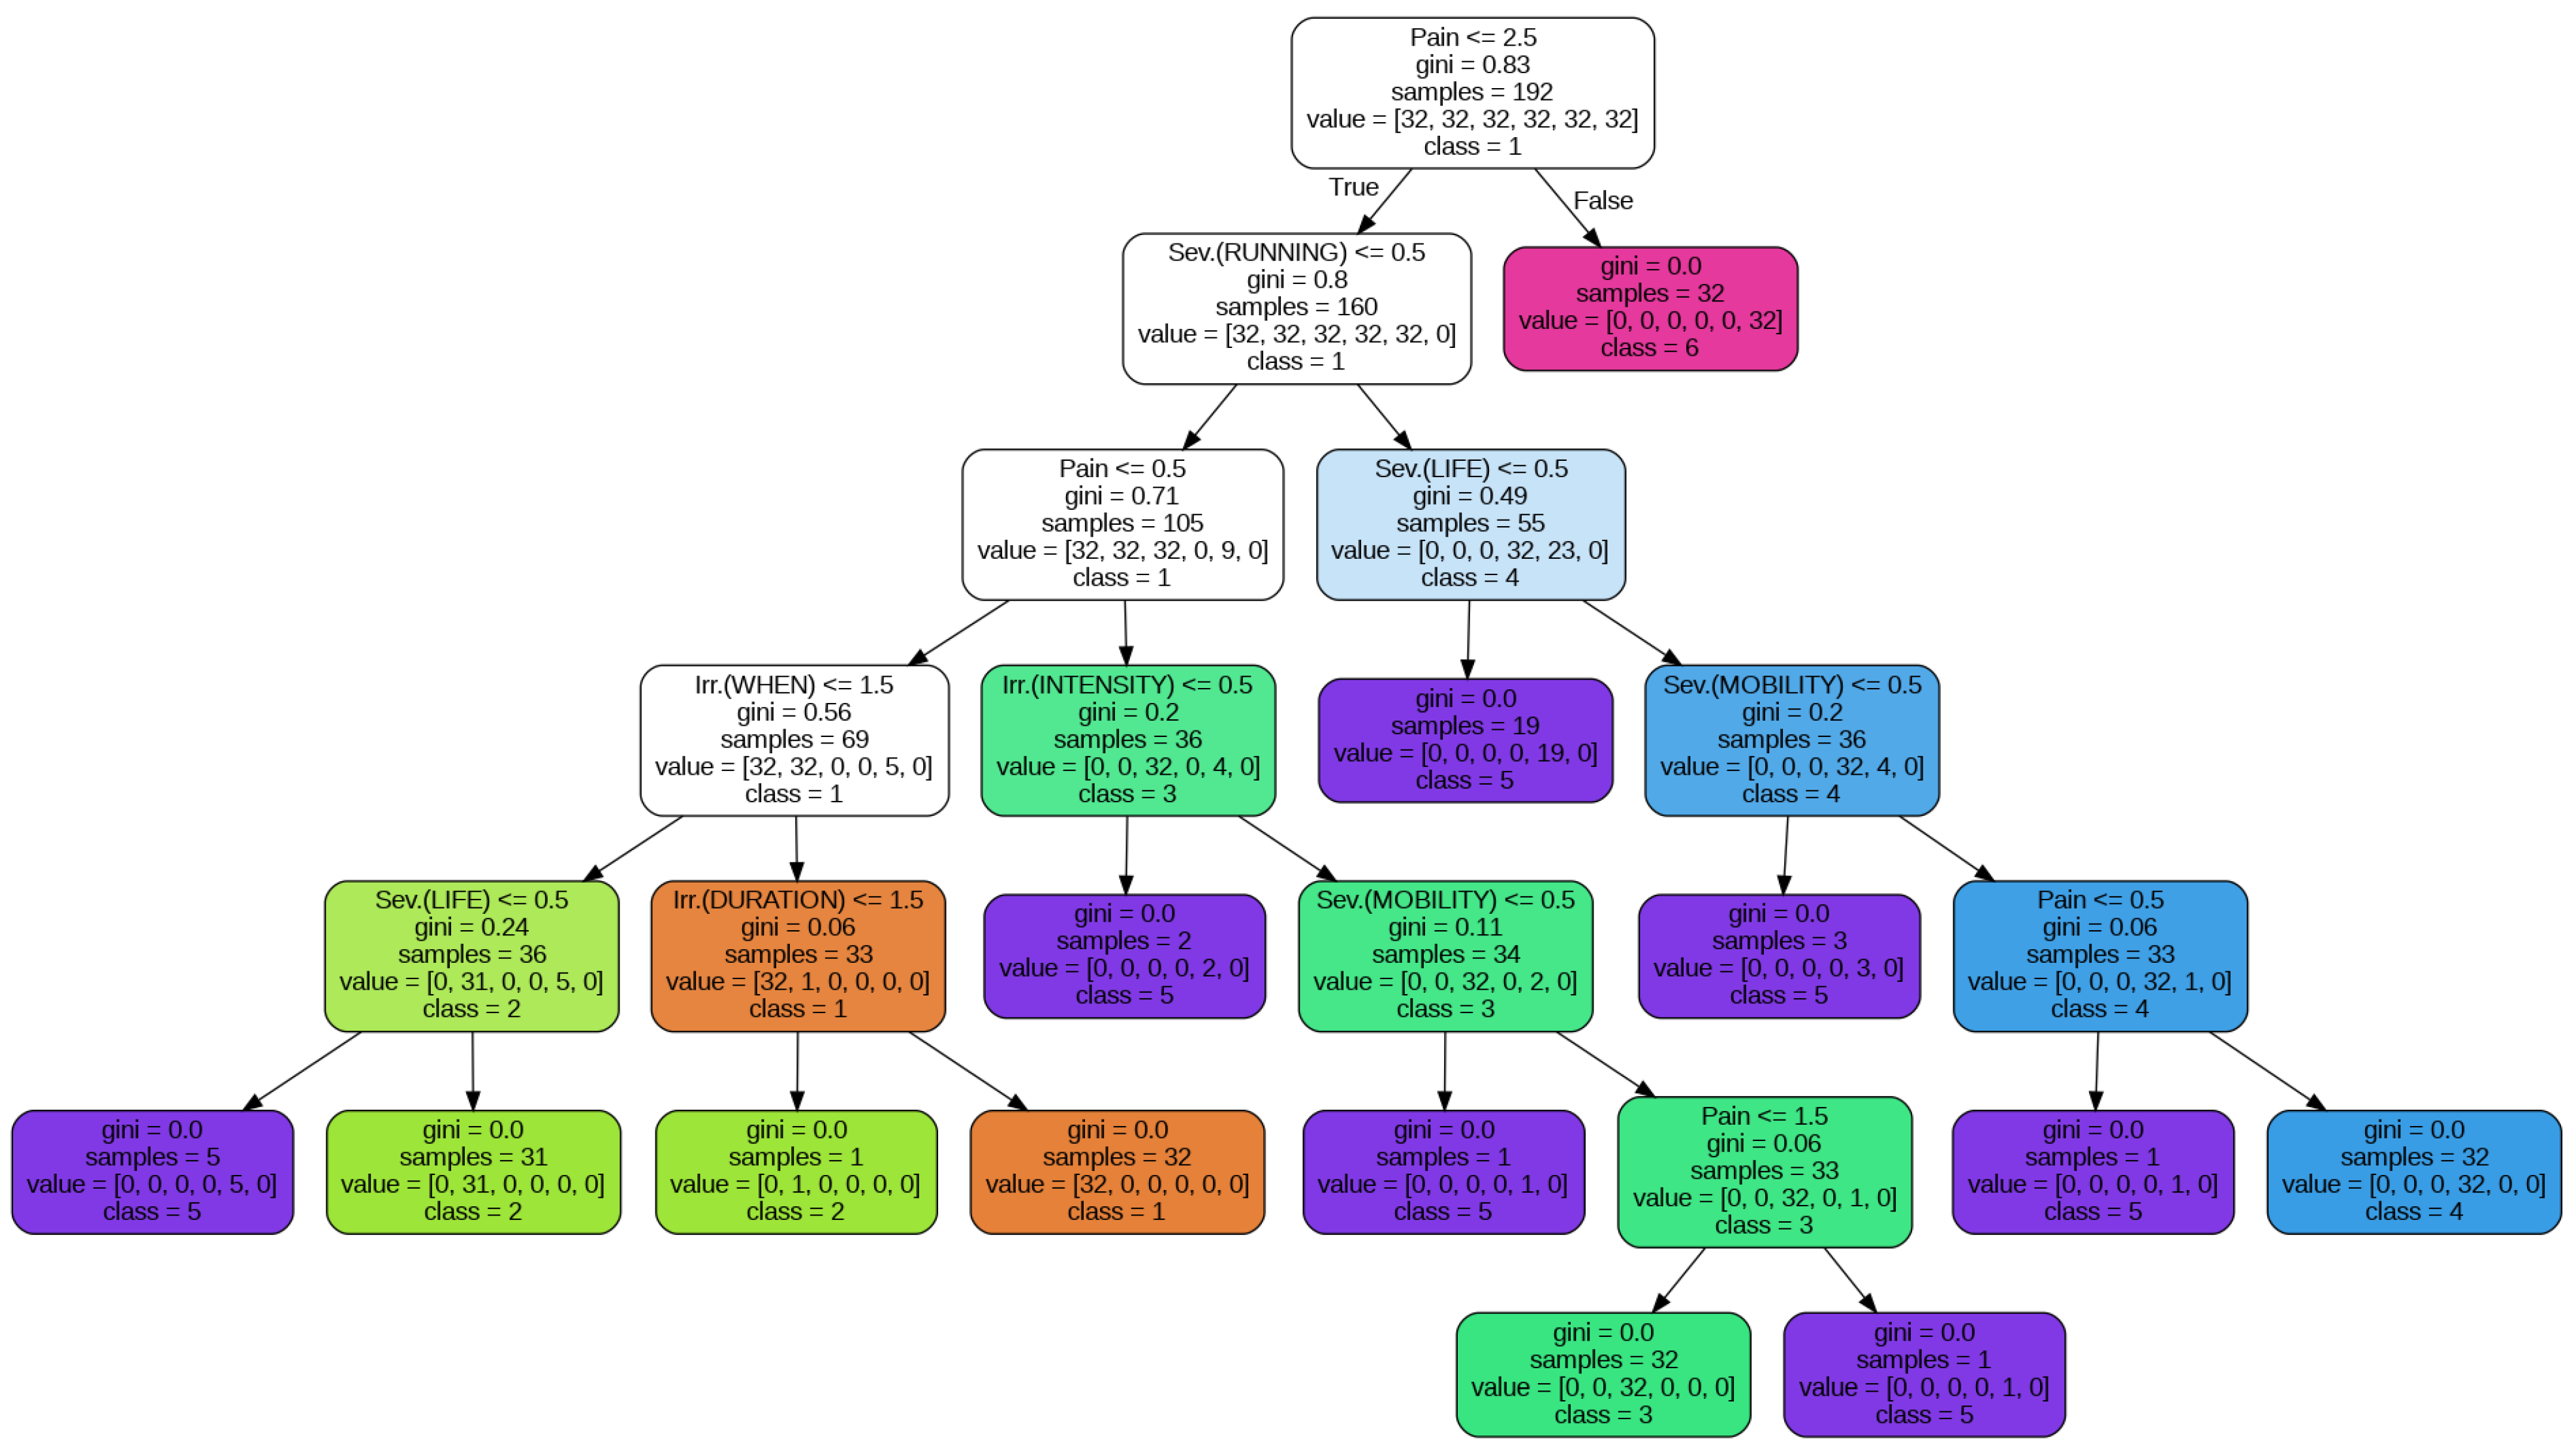
- Decision Trees—A decision tree [27] is a common data mining algorithm that breaks down difficult decisions into a succession of simpler options in order to show a decision-making process visually. The “root” represents the initial choice or query, and the “branches” indicate other potential outcomes or directions. The decision tree resembles an inverted tree structure. A decision or characteristic is assessed at each branch, which leads to other branches until a conclusion or result is obtained in the end.
- Pain Intensity
- Irritability—WHEN
- Irritability—DURATION
- Irritability—INTENSITY
- Severity—RUNNING
- Severity—LIFE
- Severity—MOBILITY
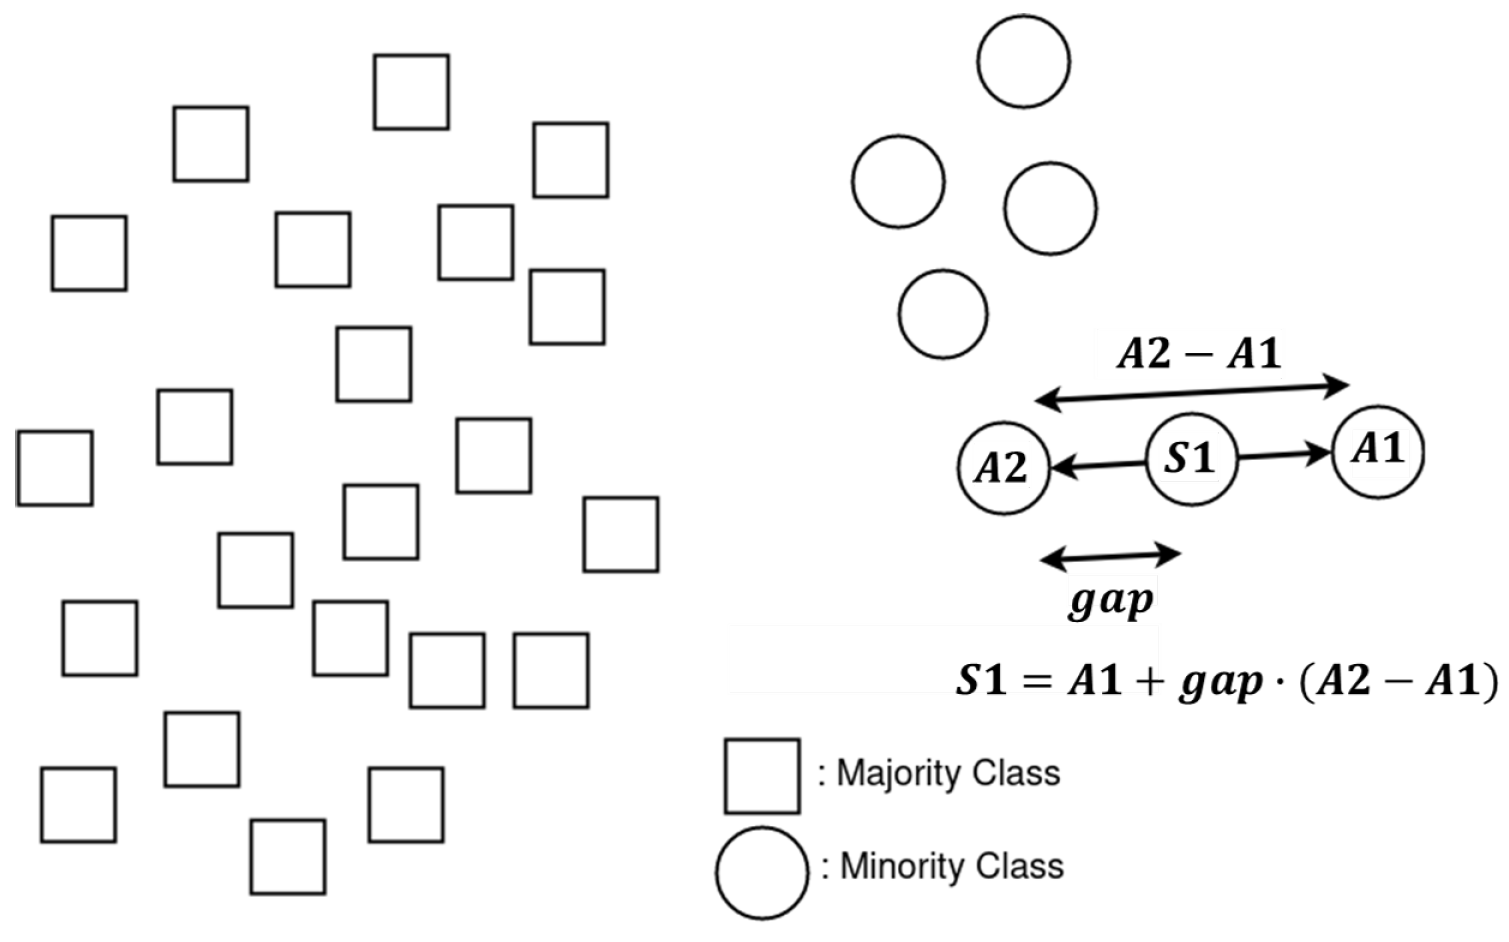
4.1. SMOTE
4.2. Decision Tree Classifier
- Data from the original dataset.
- Data subjected to resampling through the utilization of SMOTE and its extensions, with the aim of equalizing the distribution among categories.
4.3. Random Forests
4.4. Naive Bayes Classifier
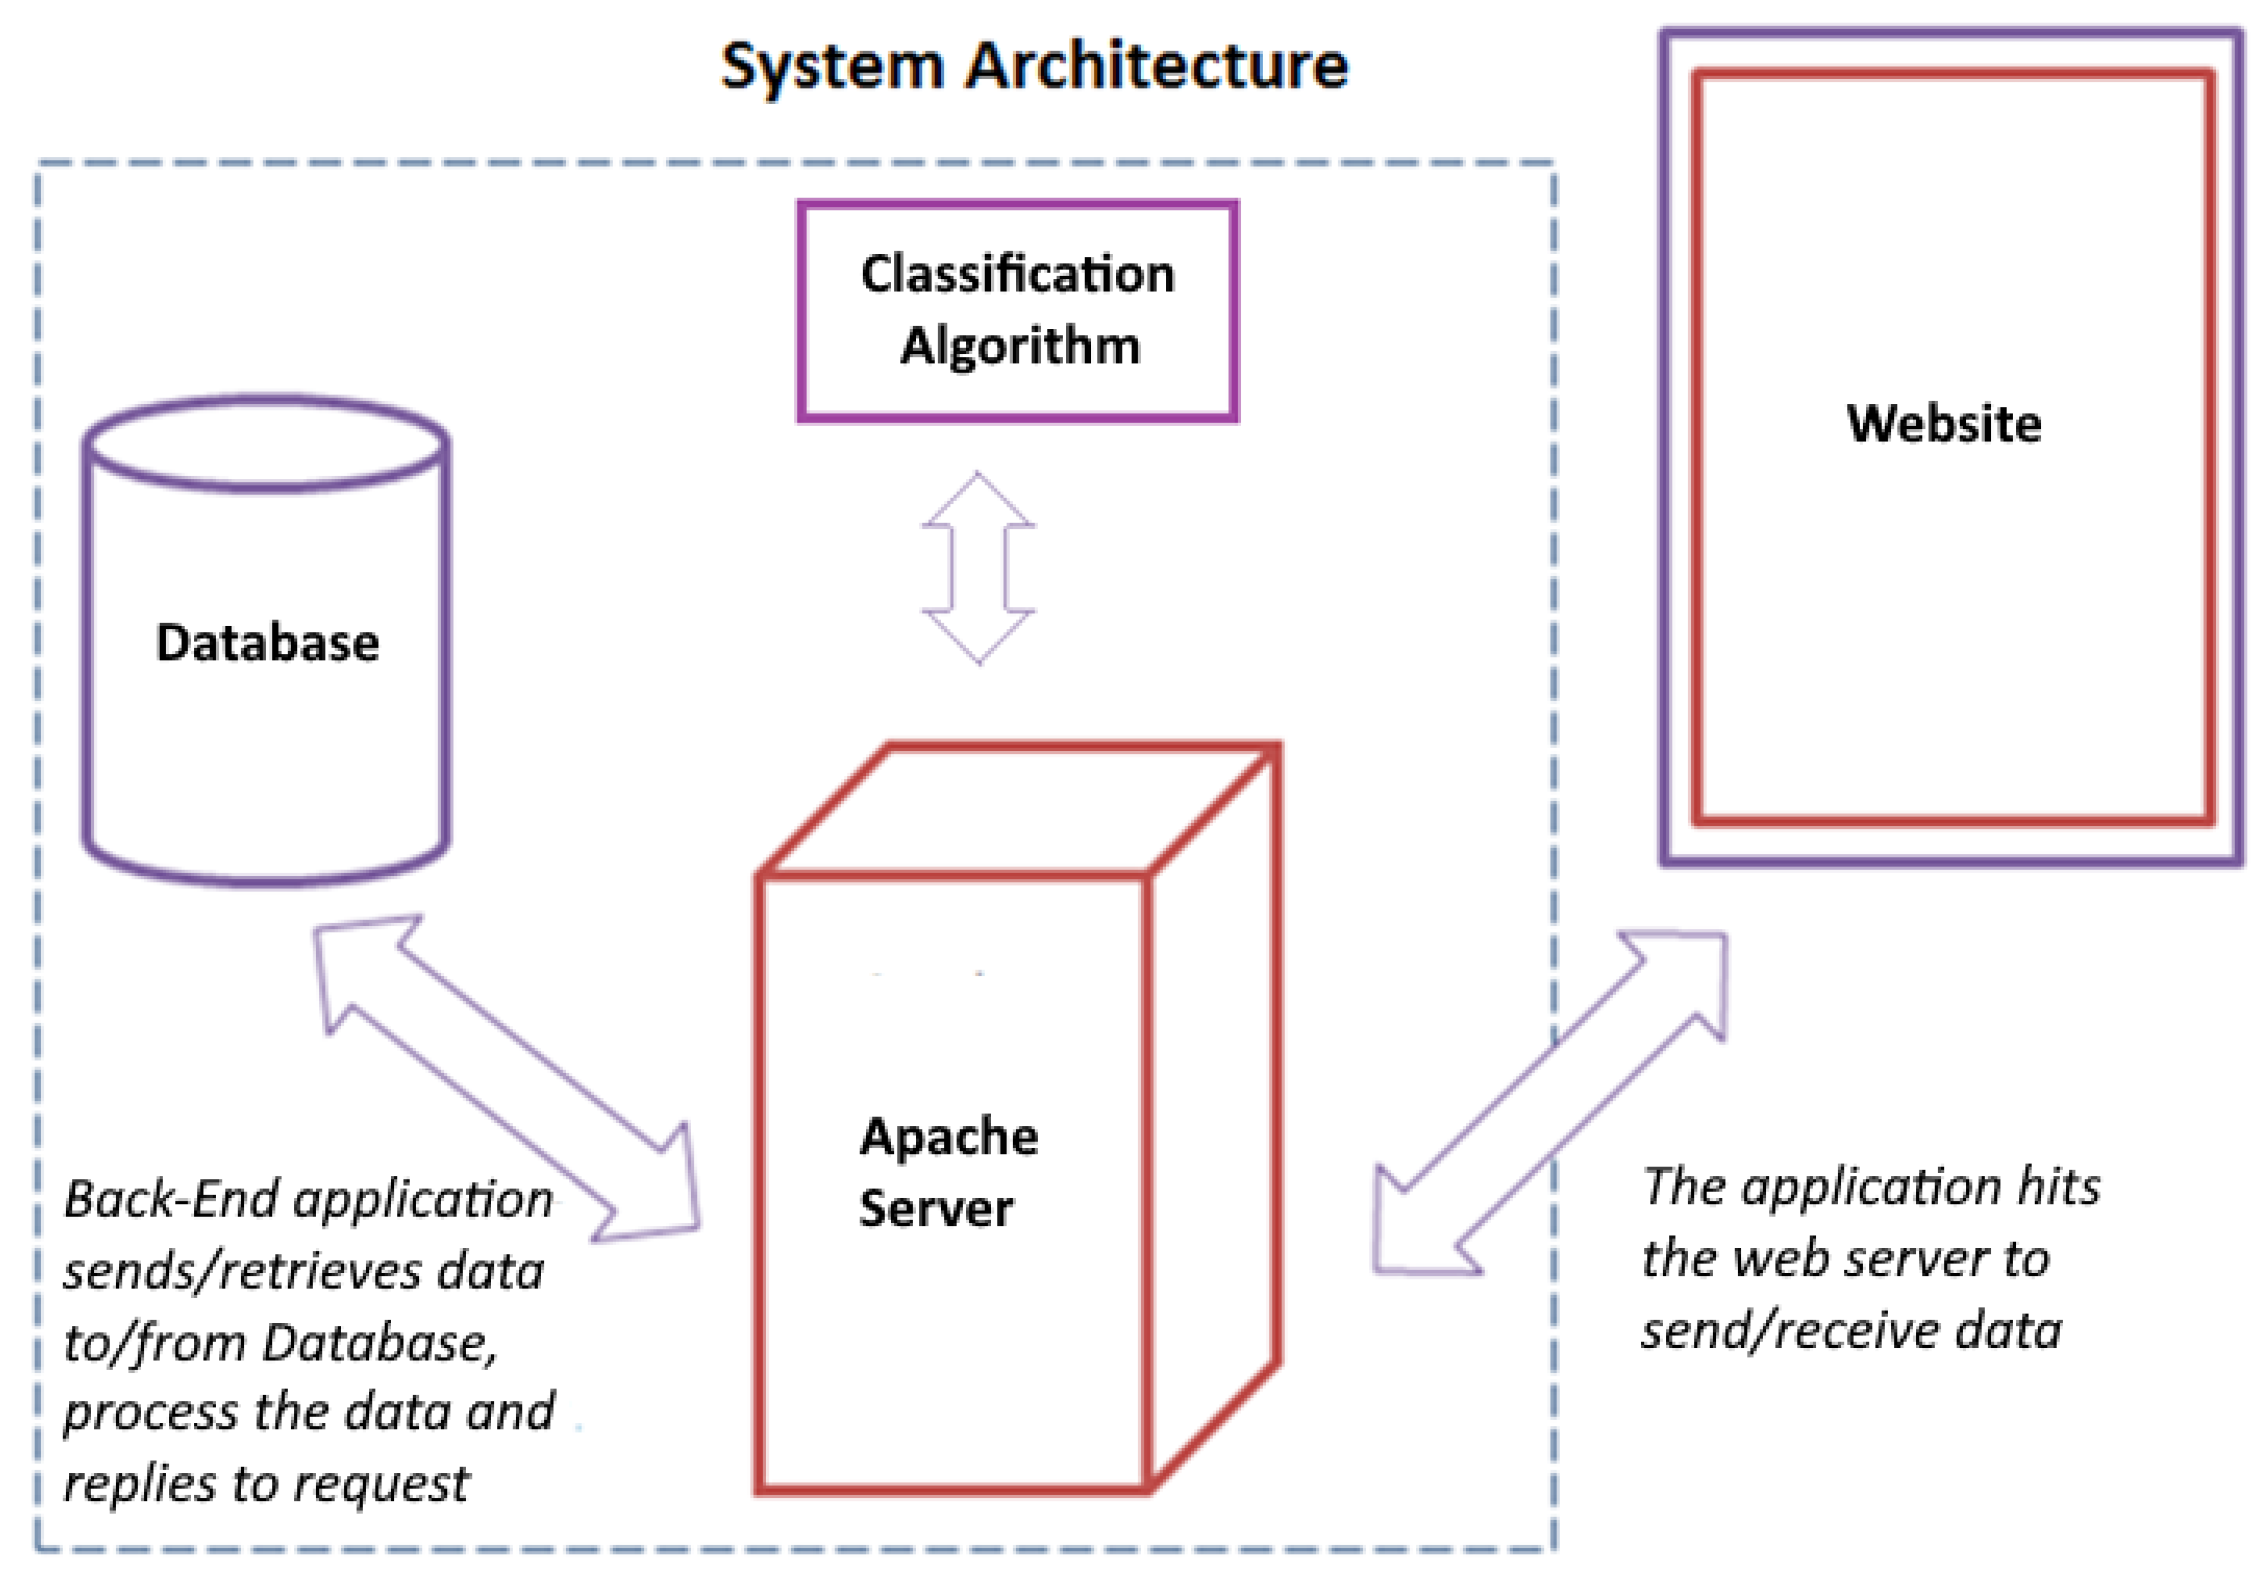
5. The Intelligent System
6. Conclusions
Author Contributions
Funding
Institutional Review Board Statement
Informed Consent Statement
Data Availability Statement
Conflicts of Interest
References
- Scheerder, J.; Breedveld, K. Running across Europe: The Rise and Size of One of the Largest Sport Markets; Palgrave Macmillan: Hampshire, UK, 2015. [Google Scholar]
- Cook, S.; Shaw, J.; Simpson, P. Jography: Exploring meanings, experiences and spatialities of recreational road-running. Mobilities 2016, 11, 744–769. [Google Scholar] [CrossRef]
- Hespanhol, L.C., Jr.; Pillay, J.D.; van Mechelen, W.; Verhagen, E. Meta-analyses of the effects of habitual running on indices of health in physically inactive adults. Sports Med. 2015, 45, 1455–1468. [Google Scholar]
- Videbæk, S.; Bueno, A.M.; Nielsen, R.O.; Rasmussen, S. Incidence of running-related injuries per 1000 h of running in different types of runners: A systematic review and meta-analysis. Sports Med. 2015, 45, 1017–1026. [Google Scholar]
- Mayne, R.S.; Bleakley, C.M.; Matthews, M. Use of monitoring technology and injury incidence among recreational runners: A cross-sectional study. BMC Sports Sci. Med. Rehabil. 2021, 13, 116. [Google Scholar]
- Higgs, J.; Jones, M.A. Clinical decision making and multiple problem spaces. Clin. Reason. Health Prof. 2008, 3, 3–17. [Google Scholar]
- Petersen, E.J.; Thurmond, S.M.; Jensen, G.M. Severity, irritability, nature, stage, and stability (SINSS): A clinical perspective. J. Man. Manip. Ther. 2021, 29, 297–309. [Google Scholar]
- Gummesson, C.; Sundén, A.; Fex, A. Clinical reasoning as a conceptual framework for interprofessional learning: A literature review and a case study. Phys. Ther. Rev. 2018, 23, 29–34. [Google Scholar] [CrossRef]
- Atkinson, H.L.; Nixon-Cave, K. A tool for clinical reasoning and reflection using the international classification of functioning, disability and health (ICF) framework and patient management model. Phys. Ther. 2011, 91, 416–430. [Google Scholar] [CrossRef]
- Nimkar, S. Promoting individual health using information technology: Trends in the US health system. Health Educ. J. 2016, 75, 744–752. [Google Scholar]
- Safe Run. Available online: https://saferun.eu/ (accessed on 13 September 2023).
- Witten, I.H.; Frank, E.; Hall, M.A. Data Mining: Practical Machine Learning Tools and Techniques, 4th ed.; Morgan Kaufmann Publishers: Burlington, MA, USA, 2016. [Google Scholar]
- Smart, K.; Doody, C. The clinical reasoning of pain by experienced musculoskeletal physiotherapists. Man. Ther. 2007, 12, 40–49. [Google Scholar]
- Baker, S.E.; Painter, E.E.; Morgan, B.C.; Kaus, A.L.; Petersen, E.J.; Allen, C.S.; Deyle, G.D.; Jensen, G.M. Systematic clinical reasoning in physical therapy (SCRIPT): Tool for the purposeful practice of clinical reasoning in orthopedic manual physical therapy. Phys. Ther. 2017, 97, 61–70. [Google Scholar] [CrossRef]
- Barakatt, E.T.; Romano, P.S.; Riddle, D.L.; Beckett, L.A. The reliability of Maitland’s irritability judgments in patients with low back pain. J. Man. Manip. Ther. 2009, 17, 135–140. [Google Scholar] [CrossRef]
- Kareha, S.M.; McClure, P.W.; Fernandez-Fernandez, A. Reliability and concurrent validity of shoulder tissue irritability classification. Phys. Ther. 2021, 101, pzab022. [Google Scholar] [CrossRef]
- Spanjersberg, W.R.; Bergs, E.A.; Mushkudiani, N.; Klimek, M.; Schipper, I.B. Protocol compliance and time management in blunt trauma resuscitation. Emerg. Med. J. 2009, 26, 23–27. [Google Scholar] [CrossRef]
- Baur, D.; Gehlen, T.; Scherer, J.; Back, D.A.; Tsitsilonis, S.; Kabir, K.; Osterhoff, G. Decision support by machine learning systems for acute management of severely injured patients: A systematic review. Front. Surg. 2022, 9, 924810. [Google Scholar] [CrossRef] [PubMed]
- Wilkinson, S.G.; Chevan, J.; Vreeman, D. Establishing the centrality of health informatics in physical therapist education: If not now, when? J. Phys. Ther. Educ. 2010, 24, 10–15. [Google Scholar] [CrossRef]
- Daley, K.N.; Krushel, D.; Chevan, J. The physical therapist informatician as an enabler of capacity in a data-driven environment: An administrative case report. Physiother. Theory Pract. 2020, 36, 1153–1163. [Google Scholar] [CrossRef]
- Lopes, L.C.; de Fátima F Barbosa, S. Clinical decision support system for evaluation of patients with musculoskeletal disorders. In MEDINFO 2019: Health and Wellbeing e-Networks for All; IOS Press: Amsterdam, The Netherlands, 2019; pp. 1633–1634. [Google Scholar]
- Qin, Z.; Armijo-Olivo, S.; Woodhouse, L.J.; Gross, D.P. An investigation of the validity of the Work Assessment Triage Tool clinical decision support tool for selecting optimal rehabilitation interventions for workers with musculoskeletal injuries. Clin. Rehabil. 2016, 30, 277–287. [Google Scholar] [CrossRef] [PubMed]
- Farzandipour, M.; Nabovati, E.; Saeedi, S.; Fakharian, E. Fuzzy decision support systems to diagnose musculoskeletal disorders: A systematic literature review. Comput. Methods Programs Biomed. 2018, 163, 101–109. [Google Scholar] [CrossRef] [PubMed]
- Halson, S.L. Monitoring Training Load to Understand Fatigue in Athletes. Sports Med. 2014, 44, 139–147. [Google Scholar] [CrossRef]
- Peterson, K.D.; Evans, L.C. Decision Support System for Mitigating Athletic Injuries. Int. J. Comput. Sci. Sport 2019, 18, 45–63. [Google Scholar] [CrossRef]
- Ghahramani, Z. Learning dynamic Bayesian networks. In Adaptive Processing of Sequences and Data Structures; Giles, C., Gori, M., Eds.; Springer: Berlin/Heidelberg, Germany, 1998; pp. 168–197. [Google Scholar]
- Tan, P.N.; Steinbach, M.; Karpatne, A.; Kumar, V. Introduction to Data Mining, 2nd ed.; Pearson: London, UK, 2018. [Google Scholar]
- Kuhn, M.; Johnson, K. Applied Predictive Modeling; Springer: Berlin/Heidelberg, Germany, 2013. [Google Scholar]
- Karvelis, P.; Kolios, S.; Georgoulas, G.; Stylios, C. Ensemble learning for forecasting main meteorological parameters. In Proceedings of the 2017 IEEE International Conference on Systems, Man, and Cybernetics (SMC), Banff, AB, Canada, 5–8 October 2017; pp. 3711–3714. [Google Scholar] [CrossRef]
- Georgoulas, G.; Kolios, S.; Karvelis, P.; Stylios, C. Examining nominal and ordinal classifiers for forecasting wind speed. In Proceedings of the 2016 IEEE 8th International Conference on Intelligent Systems (IS), Sofia, Bulgaria, 4–6 September 2016; pp. 504–509. [Google Scholar] [CrossRef]
- Chawla, N.V.; Bowyer, K.W.; Hall, L.O.; Kegelmeyer, W.P. SMOTE: Synthetic minority over-sampling technique. J. Artif. Intell. Res. 2002, 16, 321–357. [Google Scholar] [CrossRef]
- Georgoulas, G.; Karvelis, P.; Spilka, J.; Chudáček, V.; Stylios, C.D.; Lhotská, L. Investigating pH based evaluation of fetal heart rate (FHR) recordings. Health Technol. 2017, 7, 241–254. [Google Scholar] [CrossRef] [PubMed]
- Cost, S.; Salzberg, S. A weighted nearest neighbor algorithm for learning with symbolic features. Mach. Learn. 1993, 10, 57–78. [Google Scholar] [CrossRef]
- Breiman, L.; Friedman, J.H.; Olshen, R.A.; Stone, C.J. Classification and Regression Trees; Chapman and Hall/CRC: Boca Raton, FL, USA, 1984. [Google Scholar]
- Bass, L.; Clements, P.; Kazman, R. Software Architecture in Practice, 2nd ed.; Addison-Wesley: Boston, MA, USA, 2012. [Google Scholar]


| Category | Count | Percent (%) |
|---|---|---|
| 1 | 6 | 6.5 |
| 2 | 18 | 19.4 |
| 3 | 12 | 12.9 |
| 4 | 6 | 6.5 |
| 5 | 45 | 48.4 |
| 6 | 6 | 6.5 |
| Category | Precision | Recall | F1 Score | Support |
|---|---|---|---|---|
| 1 | 1.00 | 1.00 | 1.00 | 2 |
| 2 | 0.71 | 1.00 | 0.83 | 5 |
| 3 | 0.80 | 1.00 | 0.89 | 4 |
| 4 | 1.00 | 0.50 | 0.67 | 2 |
| 5 | 0.91 | 0.77 | 0.83 | 13 |
| 6 | 1.00 | 1.00 | 1.00 | 2 |
| Metric | ||||
| Accuracy | 0.86 | 28 | ||
| Macro Avg. | 0.90 | 0.88 | 0.87 | 28 |
| Weighted Avg. | 0.88 | 0.86 | 0.85 | 28 |
| Category | Precision | Recall | F1 Score | Support |
|---|---|---|---|---|
| 1 | 1.00 | 1.00 | 1.00 | 2 |
| 2 | 0.83 | 1.00 | 0.91 | 5 |
| 3 | 0.80 | 1.00 | 0.89 | 4 |
| 4 | 1.00 | 0.50 | 0.67 | 2 |
| 5 | 0.92 | 0.85 | 0.88 | 13 |
| 6 | 1.00 | 1.00 | 1.00 | 2 |
| Metric | ||||
| Accuracy | 0.89 | 28 | ||
| Macro Avg. | 0.93 | 0.89 | 0.89 | 28 |
| Weighted Avg. | 0.90 | 0.89 | 0.89 | 28 |
| Category | Precision | Recall | F1 Score | Support |
|---|---|---|---|---|
| 1 | 1.00 | 1.00 | 1.00 | 2 |
| 2 | 1.00 | 1.00 | 1.00 | 5 |
| 3 | 1.00 | 1.00 | 1.00 | 4 |
| 4 | 1.00 | 0.50 | 0.67 | 2 |
| 5 | 0.93 | 1.00 | 0.96 | 13 |
| 6 | 1.00 | 1.00 | 1.00 | 2 |
| Metric | ||||
| Accuracy | 0.96 | 28 | ||
| Macro Avg. | 0.99 | 0.92 | 0.94 | 28 |
| Weighted Avg. | 0.97 | 0.96 | 0.96 | 28 |
Disclaimer/Publisher’s Note: The statements, opinions and data contained in all publications are solely those of the individual author(s) and contributor(s) and not of MDPI and/or the editor(s). MDPI and/or the editor(s) disclaim responsibility for any injury to people or property resulting from any ideas, methods, instructions or products referred to in the content. |
© 2023 by the authors. Licensee MDPI, Basel, Switzerland. This article is an open access article distributed under the terms and conditions of the Creative Commons Attribution (CC BY) license (https://creativecommons.org/licenses/by/4.0/).
Share and Cite
Tzelepis, T.; Matlis, G.; Dimokas, N.; Karvelis, P.; Malliou, P.; Beneka, A. An Intelligent Injury Rehabilitation Guidance System for Recreational Runners Using Data Mining Algorithms. Algorithms 2023, 16, 523. https://doi.org/10.3390/a16110523
Tzelepis T, Matlis G, Dimokas N, Karvelis P, Malliou P, Beneka A. An Intelligent Injury Rehabilitation Guidance System for Recreational Runners Using Data Mining Algorithms. Algorithms. 2023; 16(11):523. https://doi.org/10.3390/a16110523
Chicago/Turabian StyleTzelepis, Theodoros, George Matlis, Nikos Dimokas, Petros Karvelis, Paraskevi Malliou, and Anastasia Beneka. 2023. "An Intelligent Injury Rehabilitation Guidance System for Recreational Runners Using Data Mining Algorithms" Algorithms 16, no. 11: 523. https://doi.org/10.3390/a16110523
APA StyleTzelepis, T., Matlis, G., Dimokas, N., Karvelis, P., Malliou, P., & Beneka, A. (2023). An Intelligent Injury Rehabilitation Guidance System for Recreational Runners Using Data Mining Algorithms. Algorithms, 16(11), 523. https://doi.org/10.3390/a16110523