1. Introduction
Recommendation systems have become the heart of internet-based companies such as Google, YouTube, Facebook, Netflix, LinkedIn, and Amazon. Recommendation systems provide suggestions for items that can be of use to a user. These suggestions are aimed at supporting users in various decision-making processes, such as what items to buy, what music to listen to, or what news to read [
1,
2,
3]. Pattern mining consists of discovering interesting, useful, and unexpected patterns in databases through tasks such as association rule mining, frequent pattern mining, and sequential pattern mining [
4]. These data mining tasks are generally used by recommendation systems to generate a meaningful representation and learning of historical user purchase data. This work focuses on systems that mine sequential patterns of customer purchase history for purpose of making recommendations in the e-commerce application domain. Different types of recommendation systems accept different input data through explicit rating feedback (e.g.,
Table 1) and implicit derived feedback. Explicit feedback can be in the form of collecting ratings of products or text comments by users through registration forms/asking explicitly for interests and preferences, where users select numeric values from a specific evaluation system (e.g., a five-star rating system) to specify their likes and dislikes with respect to different items. Implicit feedback includes behaviors such as purchase history, browsing history, search patterns, time spent on specific pages, links followed by a user, button clicks, and user data from social network platforms. For example, the simple act of a user buying or browsing an item can be viewed as an endorsement of that item. Such forms of feedback are commonly used by online merchants such as Amazon.com [
1]. A sample user–item rating matrix consisting of input data instance of a movie recommendation site (
Table 1) is an example of explicit feedback information. Each cell in
Table 1 is the rating value (preference) of a user for a movie on a 5-point scale (i.e., from 1 to 5), and the preferences marked with a question mark ‘?’ are the missing or unknown values that need to be predicted.
Consider a user’s click and purchase behavior data, as shown in
Table 2; this sample user’s click and purchase behavior indicates that the customer ended up purchasing few items from the list of clicked items.
Now, an implicit user’s transaction (binary) user–item purchase matrix (
Table 3) is created by analyzing the list of items purchased by the user; a value of 1 is assigned for the purchased items, while 0 represents non-purchased items by the same user. Analyzing users’ implicit preferences (i.e., the behavior pattern data) has been used widely and has proven to be useful in practice for constructing input user–item matrix when explicit rating information on items is not available or needs to be made more informative by integrating more learned historical customer purchase behavior.
Sequential pattern mining (SPM) discovers interesting subsequences as patterns (sequential patterns) in a sequence database that can be used later by end users or management to find associations between different items or events in their data for purposes such as marketing campaigns, business reorganization, prediction, and planning in the domain of E-commerce. A sequence database stores a number of records, where all records are sequences {
} that are arranged with respect to time [
4]. A sequence database can be represented as a tuple <SID, sequence–item sets>, where SID represents the sequence identifier and sequence–item sets specify the sets of items (purchased, watched, etc.) enclosed in parenthesis () in the time order (such as every day, week, month) they are purchased by the SID. An example sequence database is retail customer transactions or purchase sequences in a grocery store, showing the collection of store items purchased every week for each customer for one month. An example of historical daily purchase data for a grocery store is shown in
Table 4. It contains CustomerID, PurchasedItems for the set of purchased items by customers, and Timestamp for the time of purchase.
A sequential database can be constructed from such historical purchase data by considering a period of time (day, week, and month). In this case, the purchase sequential database from historical purchase data (
Table 4) is presented in
Table 5, where SID (01) contains the sequence < (Bread, Milk), (Bread, Milk, Sugar), (Milk), (Tea, Sugar)>. This means that customer (01) first purchased Bread and Milk together, then purchased Bread, Milk and Sugar together in the second purchase, Milk in the third purchase, and finally Tea and Sugar together in the last purchase.
Sequential patterns are ordered sets of items (events) that occur with respect to time [
5]. A sequential pattern is denoted in angular brackets (
) and each itemset contains sets of items, where each itemset enclosed in parenthesis () separated by commas represents a set of items purchased at the same time in one market visit. For example, from
Table 5,
is a frequent sequential pattern if the minimum support of
is used in this database to mine frequent sequential patterns that have occurred up to this minimum support times in the sequential database. This means that most customers would first purchase Bread in one visit and purchase Sugar and Tea together in a subsequent purchase. Support of a sequential pattern in a database table is defined as the number of records the pattern occurred in divided by the total number of records in the databases. A Sequential Historical Database (SHOD) algorithm was used in the HSPRec system [
6] to generate sequential database from historical purchase database similar to
Table 4.
The problem of SPM can now be formally described as follows. For
- (i)
a set of sequential records (called sequences) representing a sequential database SDB = with sequence identifiers 1, 2, 3, …, n,
- (ii)
a minimum support threshold, called min sup , and
- (iii)
a set of k unique candidate items or events I = {i1, i2, …, ik},
SPM algorithms discover the set of all frequent subsequences S in the given sequence database SDB of items I at the given min sup
that are interesting for the user. A sequence s is said to be a frequent sequence or a sequential pattern if its support (the percentage of the total number of database records the sequence appears in) is greater than or equal to the minimum support (min sup
) [
7].
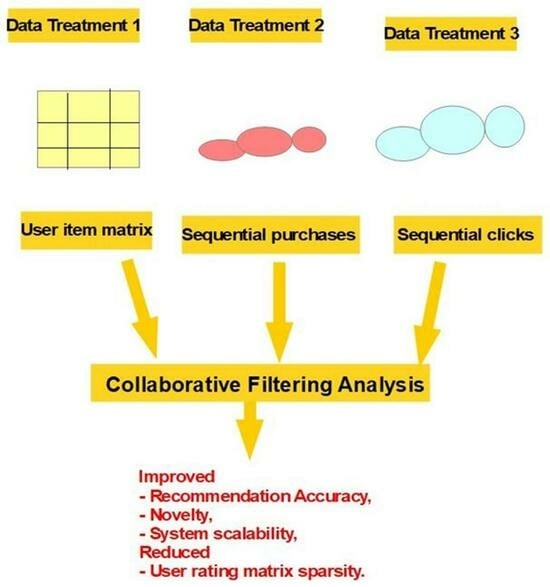
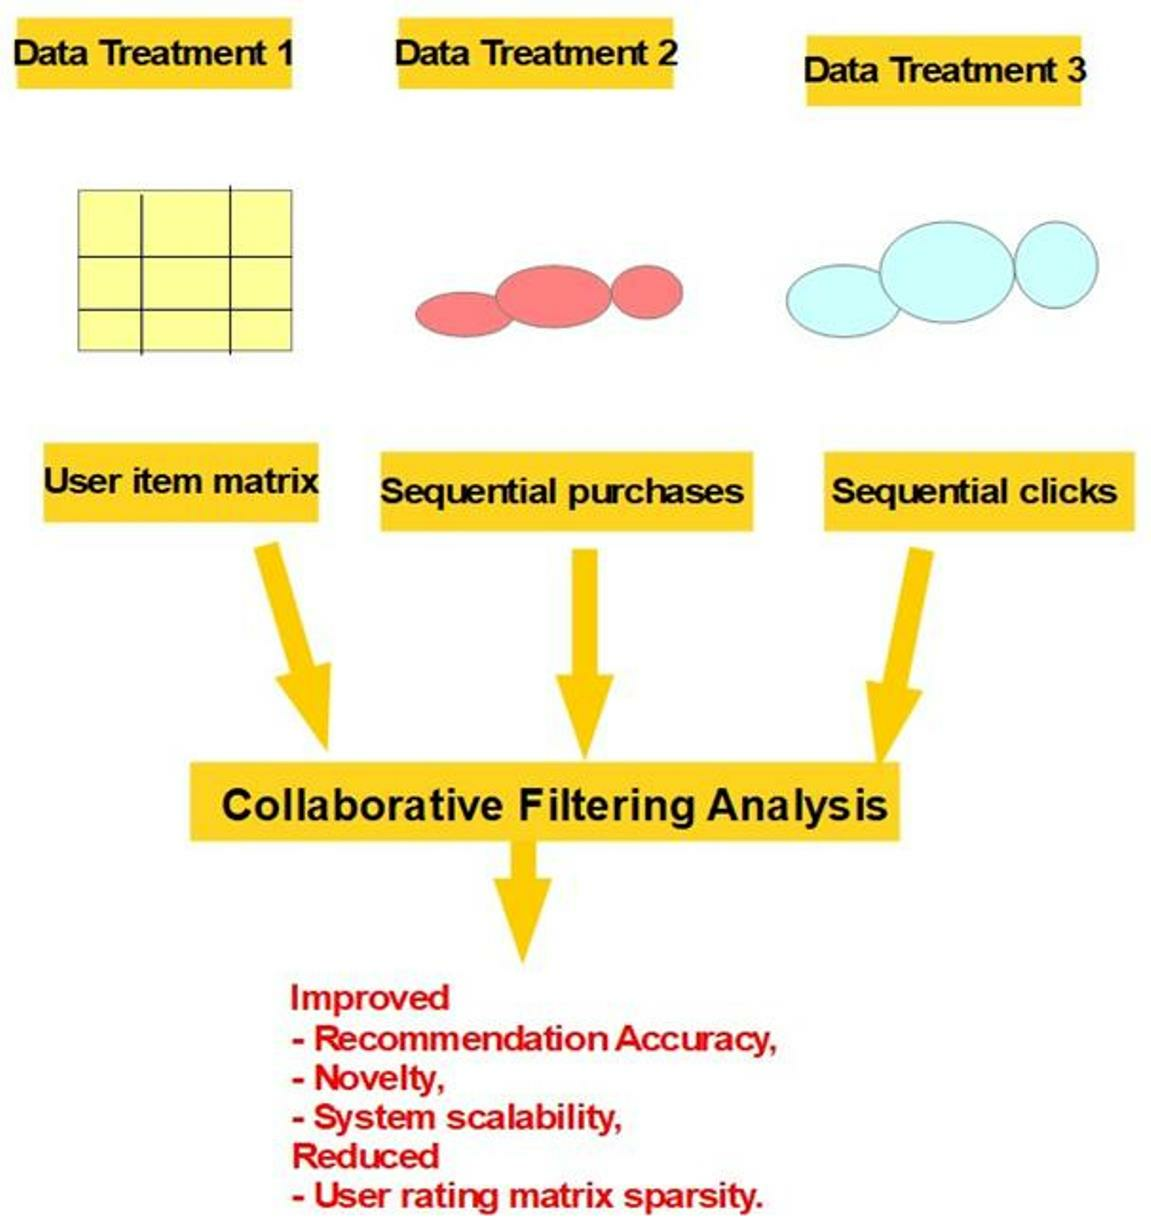
The input of an e-commerce recommendation system based on a collaborative filtering approach is usually a binary user–item rating matrix (
Table 6), only showing whether or not an item has been purchased or liked by a user previously. Thus, the user–item rating matrix can be extremely sparse and with low quality input data, i.e., less informative rating data not reflecting (1) how much a user likes a purchased item with value 1, (2) how frequently or how long ago a user purchased an item, or (3) what quantity of a product was purchased. One way to improve the input data is to integrate explicit rating with implicit rating drawn from historical purchase or click stream data, or alternatively to use learning algorithms such as sequential pattern mining (SPM) of historical purchase and click stream data to extract more informative customer purchase and click stream data behavior. This can be integrated into the user–item rating matrix, helping to reduce data sparsity and improve recommendation quality and accuracy. SPM can capture customer purchase behavior over time using mined sequential patterns; this is is crucial, as the time interval between items is useful for learning the time at what the next item might be purchased. The next purchase decision of a user is often influenced by their recent behaviors, and this approach considers the temporal preferences of users as a sequence of purchased items. An example frequent sequential pattern (FSP) that can be mined from a relevant E-Commerce purchase historical sequential database is
. This indicates that it is generally learned from the historical purchase database that whenever customers buy milk and bread together in one week, they come back in the following week to buy milk and cream together.
This sequential rule can be written as (milk, bread) → (milk, cream). With a sequential rule such as this one, several of the unknown ratings in the input user–item rating matrix in
Table 6 can be filled such that all users who have purchased the antecedent items (milk, bread) have a higher chance (say, 0.5 or a more specific determined chance value) of purchasing cream next. With this information, the ratings for users 1, 2, and 4 for cream can be changed from unknown to 0.5. In this way, a sequential pattern can be used to improve the quantity of rating values by providing possible values for missing/unrated items. A user–item purchase frequency matrix can then be constructed in which each value represents the quantity of a product purchased by a user. This purchase frequency is then normalized to a scaled value (0 to 1) representing how interested a user is in one item as compared to other items, improving the rating quality. If these historical sequential purchase patterns of a user are analyzed and integrated into the user–item matrix input, the rating quality (specifying level of interest or value for already rated items) and quantity (finding possible ratings for previously unknown ratings) can be enhanced and improved using the mined sequential patterns. Thus, the recommendation quality can be improved in terms of accuracy, scalability, and novelty.
An important task for e-commerce sites is to make predictions about what users might buy in the future based on that user’s history of shopping. This problem can be modeled using one of the most successful methods in the literature, the Collaborative Filtering (CF) technique, which makes use of explicit user rating–item matrix data from the user for the purpose of recommendation. The general technique of CF [
1] accepts as its input an incomplete user–item rating matrix with the goal of predicting the unknown rating of a target user or item. For user-based CF, ratings of like-minded users of a target user u are used to make recommendations for user u. The weighted ratings of this group of neighbors are used as the predicted rating of the targeted user u. Similarly, functions can be computed between the rows of the ratings of item–user matrix to discover similar users likely to purchase the same types of products. A major advantage of this model is its ability to capture general taste for recommendation. However, this kind of algorithm has two obvious shortcomings. First, the effectiveness of such algorithms are greatly reduced when the user’s explicit rating behavior data is sparse; second, these methods ignore the time context of user behavior i.e., how the customer’s purchase behavior may vary over time, and as such are unable to capture the sequential behavior of users. SPM techniques [
7,
8] have been used alone recently to make recommendations more effective by extracting sequential patterns of user purchase behavior, as the user’s next purchase is affected by their previous purchases and actions. This recommendation often utilizes a user’s implicit feedback data; the major advantage of this model is its ability to capture users’ sequential purchase behavior for recommendations. However, this SPM recommendation model alone cannot capture a user’s general taste. It can be seen that both of these methods (CF and SPM) have shortfalls. In fact, both sequential behavior and users’ general taste are important factors that influence user purchasing behavior, as indicated in [
9,
10,
11]. This motivates a systematic review of the importance of integrating SPM with CF for recommendation systems to improve recommendation quality through more diverse recommendations, closing the high sparsity matrix problem, and thereby making recommendations better by taking into account users’ general taste and sequential behavior.
The review of these sequential pattern-based collaborative E-commerce recommendation systems involves comparison of their features, such as their recommendation accuracy, user–rating matrix input data sparsity ratio and functionalities (e.g., ability to recommend novel and diverse products, ability to scale up to frequently changing products, and user scalability), recommendation approaches, improving on understanding of the system’s algorithms with example application of system through a clear example, and highlighting their strengths, weaknesses, and future prospects in the recommendation process. The focus of the survey research in this paper is on in-depth understanding of algorithmic methods for collaborative filtering system-based RS that enhance recommendation quality through sequential pattern mining of historical purchase and click stream data. Earlier work and surveys on collaborative fitering based techniques include [
12,
13,
14,
15,
16,
17,
18]. This work is different from existing surveys or reviews of methods for evaluating recommendation systems, such as [
19,
20], which provide a framework with no discussion of any algorithms. This survey of more traditional and more technically understandable mining based approaches is different from other related surveys or research on complex deep learning-based sequential recommendation systems [
11,
21,
22,
23,
24,
25], which do not exploit historical and click stream purchase data for tracking temporal customer purchase behavior.
1.1. Reasons for Sequential Pattern Mining in E-Commerce Recommendation
User–Item Interactions Are Sequentially Dependent: in E-commerce recommendation systems, the crucial task is to identify the next purchase items from customer purchase behaviors [
26]. This has essentially led to the development of sequential pattern-based recommendation systems. These systems suggest items that may be of interest to a user by mainly modelling the sequential dependencies over the user–item interactions in a sequence [
27], possibly through mining of sequential patterns [
6].
Improve the Quality and Quantity of Ratings: recommendation systems in E-commerce suffer from uninformative rating data, which usually only represent whether a user has purchased a product before. This user–item rating matrix is usually sparse, less informative, and leads to poor recommendations [
28]. In these systems, even active customers may have purchased only under
of the products (
of 2 million products in an E-Commerce store such as Amazon.com is 20,000), i.e., often only a few of the total number of items available in a database are rated by users [
29]. Thus, in order to capture more real-life customer purchase behavior and provide the relationship between already purchased items and recommended items, the historical sequential purchase patterns of a user can be analyzed and integrated into the user–item matrix input to enhance and improve the rating quality and quantity by providing the possible values for missing/unrated items. To demonstrate this, consider the historical purchase data in
Table 7.
Step 1: Create a user–item purchase frequency matrix (
Table 8) from the historical purchase data (
Table 7), where the values indicate the number of times an item was purchased by a user. For example, User 1 purchased butter twice, Honey once, etc.
Step 2: Now, convert the historical purchase data (
Table 7) to a sequential database (
Table 9) by considering the period of time (day, week, and month) of the purchase.
Step 3: Create frequent sequential purchase patterns from the sequential database (
Table 9) using any SPM algorithm, such as GSP [
5], and extract the possible purchase sequential rules (
Table 10) from frequent purchase sequences. Using these sequential purchase rules, the unknown ratings in the user–item purchase frequency matrix (e.g., the value of User 1 for the item Cheese in
Table 8) can be filled using a predicted value such that all users who have purchased the antecedent items such as (Milk, Butter) from Rule No. 1 of
Table 10 have a higher chance (say, 0.5 or a more specific determined chance value for the highly probable purchases determined by the SPs) of purchasing Cheese next. Hence, using Rule No. 1 it can be inferred that as User 1 purchased Milk and Butter in this transaction, there is a high chance that they would purchase Cheese in the same transaction. Hence, we assign a value of 0.5 to the user–item combination (User 1–Cheese). Similarly, (User 2–Cream) is filled using Rule No. 3 and (User 2–Milk) is filled using Rule No. 2.
Step 4: The final enriched user–item frequency matrix created with help of the sequential rules as described above is shown in
Table 11.
In this way, the historical sequential purchase patterns of a user are analyzed and integrated into the user–item matrix input to enhance and improve the rating quality and quantity.
1.2. Outline of the Paper
The rest of this article is organized as follows.
Section 2 reviews existing algorithms and presents surveys of sequential pattern-based E-commerce recommendation systems with examples.
Section 3 provides the proposed classification of techniques with comparative performance analysis of the reviewed algorithms along with discussions of the features used in the classification of the algorithms. Finally, conclusions and future work are discussed in
Section 4.
2. Existing Sequential Pattern-Based E-Commerce Recommendation Systems
The main aim of e-commerce websites is to turn their visitors into customers. As transaction data provide sets of preferred items and can be used to predict future customer preferences, researchers have applied association rule mining techniques to extract sequences in order to improve the performance of recommendation systems [
30,
31]. However, such systems incorporate customer transaction data from only a single temporal period, which omits the dynamic nature of a customer’s access sequences. Unlike association rules, sequential patterns [
8] may suggest that a user who accesses a new item in the current time period is likely to access another item in the next time period. Thus, SPM techniques have been used for extracting complex sequential patterns of user purchase behavior and if these patterns are learned and included in the user–item matrix input, the accuracy of the recommendation system is improved, as the input becomes more informative before it is fed to CF. Thus, integrating CF and SPM of historical purchase data can improve recommendation quality, reduce data sparsity, and increase the novelty of recommendations. While sequential pattern mining algorithms such as (GSP [
5], SPADE [
32], and PrefixSpan [
33]) mine frequent patterns from sequence database (e.g., of historical purchases or clicks) using a priori-like logic [
34], Collaborative Filtering algorithms [
1] follow a general four-step logic, to predict missing ratings in the input user–item rating matrix. First, the mean rating is computed for each user u. Second, the similarity between a target user v and all the other users u is computed using a similarity function such as the Pearson correlation coefficient. Third, user v’s peer group is computed for each of v’s unrated items (that is, v’s top similar users). Finally, the predicted rating of user v is computed as the weighted average of the ratings of v’s top K similar users for the unrated item.
Existing E-commerce recommendation systems that can be found in the literature which have combined CF with some form of historical purchase sequences (SPM) to recommend items to users include the following ten systems: (1) model-based approach, ChoRec05 [
35], (2) pattern segmentation framework, ChoRec09 [
36], (3) sequential pattern-based collaborative recommender system, HuaRec09) [
37], (4) segmentation-based approach, LiuRec09 [
38], (5) hybrid online product recommendation, ChoiRec12 [
39], (6) hybrid model (HM), RecSys16 [
40], (7) product recommendation system (PRS), RecSys16 [
41], (8) sequential pattern-based recommender system, SainiRec17 [
42], (9) historical purchase and click stream-based recommendation, HPCRec18 [
43], and (10) historical sequential pattern recommendation, HSPCRec19 [
6]. A brief overview of these systems is provided next. Each reviewed system has a summary of its algorithm and methodology presented first before an example application of the system’s algorithm to assist with clarity of the technique, where applicable for most systems.
2.1. Model-Based Approach: ChoRec05 [35]
Summary of ChoRecO5 [
35]: A hybrid recommendation system that combines the Self-Organizing Map (SOM) clustering technique and association rule-based sequential cluster rules was proposed for mining the changes in customer buying behavior over time in [
35]. The self organizing map (SOM) allows customer historical purchase transactions arranged in purchase time to be assigned a numbered cluster. A change in customer cluster number as a result of each transaction is used to create customer purchase sequences. Further, association rule mining is used to mine sequential patterns from the built customer sequences. The problem solved by [
35] can be phrased as follows. For a given purchase sequence of a target customer c, based on a time period l (with l for example, being a period of every month or three months), for the past l–1 periods before time T, find the product p that the target customer will most likely buy at time T. The recommendation procedure is divided into two components, a model-building phase and a recommendation phase.
An Example Application of ChoRec05 System [
35]: The problem being solved is stated as: Given the input data set as: Input: historical purchase data in E-commerce dataset including customer ID, purchased items, and duration of transaction., when the expected output data sets are: Output: recommends products to each user., apply ChoRec05 algorithm to solve this recommendation task.
This ChoRec05 [
35] algorithm will start by going through the model building phase. Model-building phase: this phase is performed once to create a reliable model from the customer transaction database, which includes transaction clustering, where the transactions are transformed into an input matrix composed of a bit vector. These time-ordered vectors for a given customer represent the purchase history of that customer; the input matrix can be thought of as the customer’s dynamic profile.
Identification of cluster sequences: the cluster sequence of a customer is learned by identifying the cluster to which each transaction of the customer belongs during each time period (e.g., in January, February, March). Using the customer transaction change cluster database (e.g.,
Table 12, called loci in [
35], association rule mining is used to predict customer movement. In
Table 12, the first row means that a customer with CID 001 purchase pattern is in Cluster 9 in January (which is time T-2), then moved to Cluster 2 in February (time T-1), and then moved to Cluster 8 in time T (March).
Extraction of sequential cluster rules: to mine customer behavior according to purchase time, the association rule
[
44] is adopted for determining the most frequent rule patterns that equal or exceed a given minimum support and minimum confidence, as shown in the sample rule in
Table 13. With association rule mining, in the first phase, frequent patterns are mined from the input database. Then, association rules are derived from these frequent patterns and only rules with confidence equal to or exceeding a set minimum confidence level are retained as being significant. The confidence of a rule is the number of times both the left and right sides of the rule (antecedent → consequent) appear in the database divided by the number of times only the left side of the rule appears in the records of the database. A sample mined rules obtained from the customer transaction loci (movement) is shown in
Table 13.
Here, the rule indicates that if the locus of a customer is , , T, then the behavior cluster for the customer at time T is , T.
Then ChoRec05 [
35] algorithm will follow up the model building phase, with the recommendation phase as discussed next. Recommendation phase: in this phase, the products that are best matched to the dynamic behaviors of the target customers are found and the relevant transactions are converted into behavior loci using the SOM clustering model, as in the previous phase. Finally, the best-matching loci stored in the association rule base are extracted and the top N items are recommended to the target customer, i.e., the most frequently purchased products from among the products in the cluster (see
Table 14). In this table, the selected cluster has four products purchased in descending order of quantity, with most purchased being brand 23 with 5, brand 21 with 4, brand 28 with 3, and brand 27 with 2.
2.2. Pattern Segmentation Framework: ChenRec09 [36]
Summary of ChenRec09 [
36] System: Chen et al. [
36] proposed a sequential pattern-based recommender system that incorporates the RFM (Recency, Frequency, and Monetary) concept. “Recency” represents the length of the time period since the last purchase, with a lower value corresponding to a higher probability of the customer making repeat purchases. “Frequency” denotes the number of purchases within a specified time period, with a higher frequency indicating stronger customer loyalty. “Monetary” means the amount of money spent in this specified time period; thus, if a customer has a higher monetary value, the company should focus more resources on retaining that customer. RFM sequential patterns are then defined and a novel algorithm, named RFM-Apriori, is used to generate all RFM sequential patterns from customer’s purchase data. The algorithm was developed by modifying the well-known a priori GSP sequential pattern mining algorithm [
5], and consists of iterative phases.
The RFM-Apriori Algorithm goes through Candidate generation phase: first, where the algorithm places all itemsets into the candidate-1 set , the set of candidate patterns with length 1, then scans the database to find the frequent (large) 1-patterns () from the candidate itemsets . An itemset is used as a unit to expand the patterns, rather than just an item, as it can reduce the number of phases needed to complete the algorithm, thereby improving efficiency. Second, supposing that the set of frequent (k−1)-patterns is already known, it is joined with itself apriori-gen join way to generate candidate RF patterns of length k, where if they have the same (k−2)-postfix. The algorithm scans the database to determine the supports of the patterns in , then finds by removing those patterns from that have support lower than the minimum support threshold. This iteration is repeated by increasing k by one until no more patterns can be generated. To count supports, an inverse candidate tree is used to store all candidate patterns in , where a leaf node corresponds to a candidate pattern. Support values can be accumulated in each leaf node using every data sequence to traverse the tree. This is an efficient method of determining whether a candidate pattern satisfies the recency constraint. This traversal procedure is a recursive program by which all subsequences in T can be matched with all candidate patterns in . If a matched subsequence can be found that satisfies both the recency and monetary constraints for a pattern (leaf node), the rfm-support and rf-support of this pattern is increased by one. If it satisfies only the recency constraint, however, only the rf-support is increased by one. Using RFM-Apriori algorithm, a pattern segmentation framework is proposed which allows for partitioning the RFM-patterns into segments relevant to the RFM criteria in order to generate valuable information on customer purchasing behavior for managerial decision-making. By partitioning the patterns into groups based on the RFM indices, a retailer can further compare, contrast, and aggregate these groups of patterns to find possible changes in purchasing patterns over time.
2.3. Sequential Pattern-Based Collaborative Recommender System: HuaRec09 [37]
Summary of HuaRec09 [
37] System: Huang et al. (2009) proposed a hybrid recommendation system that uses a sequential pattern-based collaborative recommender system to predict the customer’s time-variant purchase behavior in an E-commerce environment where the customer’s purchase patterns may change gradually. A two-stage recommendation process is developed to predict customer purchase behavior for the product categories, as well as for product items. The time window weight is introduced to provide higher importance on the sequential patterns closer to the current time period that possess a larger impact on the prediction than patterns relatively far from the current time period. Considering all the target customer’s transactional sequences in the current time period T and the previous number r periods
, the active customers most likely to purchase items in the next time period T + 1 (target prediction period) are determined. The proposed system consists of model training for the target customers and model use (implementation) for the active customers. Active customers are selected from the target customer to receive recommendations during model use. The steps in each of these modules are discussed below. Model training for the target customers goes through the four steps of:
Identifying the target customers: the target customers can be identified according to customer behavioral variables such as recency, frequency, and monetary expenditure (RFM model) [
45].
Building dynamic customer profile: dynamic customer buying behaviors can be modeled by analyzing a customer’s periodic transaction data.
Clustering the customers: the customers are clustered based on their dynamic customer profiles using a genetic algorithm-based clustering approach.
Sequential pattern mining for each cluster: a cluster’s sequential patterns represent the buying behavior of the customers in that cluster. The proposed sequential pattern-based prediction using the product categories involves generating a customer purchase sequence for each customer and discovering the sequential patterns for each cluster using an SPM algorithm such as GSP [
5] or PrefixSpan [
33].
For model use for the active customera two-stage recommendation process is followed using cluster selection for the active customer, which includes predicting the top-M product categories and recommending the top-N product items. The top-M product categories are predicted based on the value of the product Category Recommendation Score (CRS). The CRS for the predicted
is calculated as follows:
where
is the time window weight in
.Top-N product items recommendation: the possible top-N items that the active customer will probably purchase in the target period are generated by calculating the recommendation score for each item in the top-M product categories. The Item Recommendation Score (IRS) for an item among the top-M product categories is calculated as follows:
where
is the time window weight in
and
is the frequency of
bought by all customers in the same cluster in
. The purchase frequency is defined as the number of times, rather than the of quantity, of purchases during a certain period. The top-N items with larger recommendation scores, excluding items bought by the active customer before, are then recommended to the active customer.
2.4. Segmentation-Based Approach: LiuRec09 [26]
Summary of LiuRec09 System [
26]: A hybrid recommendation system which combines the segmentation-based sequential rule method with the segmentation-based KNN-CF method was proposed in [
26].
An Example Application of LiuRec09 System:
Assume E-commerce historical purchase data containing purchase items, with frequency of purchase, price, and transaction time as input.
The Segmentation-based Sequential Rule (SSR) method would go through the following steps.
Step 1: Customer clustering. Customers are clustered into distinct groups based on their RFM values (Recency, Frequency, and Monetary). The RFM patterns of each cluster are identified by assigning ↑ or ↓ according to whether the RFM value of a cluster is larger than or smaller than the overall average RFM value.
Clusters with the same pattern are combined into one cluster. For example, clusters 3, 4, and 5 in
Table 15 have the same pattern; similarly, clusters 2, 7, and 8 can be merged. Therefore, eight customer clusters can be reduced to four customer segments: loyal, potential, uncertain, and valueless, as based on their RFM patterns shown in
Table 16.
Step 2: Transaction clustering. Transactions are divided into groups (transaction clusters) based on similar product items and buying patterns. A customer’s transaction clusters are used to identify the sequence of transaction clusters over time. A sample change in customer transactions over three periods are displayed in
Table 17.
Step 3: Mining customer behavior from transaction clusters. To mine customer behavior according to purchase time, an association rule [
44] is adopted for determining the most frequent pattern with confidence. From
Table 17, a sequential rule
(0.4,1) is extracted, with support of 40 percent and confidence of 100 percent. According to this rule, if a customer’s purchase behavior in period P2 is in transaction cluster A, then their behavior in P3 will be in transaction cluster E. The other sequential rules
(0.2,1) and
(0.2,1) can be obtained similarly.
Step 4: Determine the cluster sequences of target customers and match them. The degree of matching between a target customer’s buying behavior and a sequential rule is calculated by a fitness measure.
Step 5: Recommendation. Finally, the frequency count of each item in the predicted transaction cluster is calculated and the top N items with the highest frequency counts are returned.
Segmentation-based KNN-CF method (SKCF). In this step, the Pearson’s correlation coefficient for each customer is used to measure the similarity between the target customer and other customers in the same segment, then the k most similar (highest ranked) customers are selected as the k-nearest neighbors of the target customer. The N most frequent products not yet purchased by the target customer u in period T are selected as the top-N recommendations.
Hybrid recommendation method. SSR and SKCF are combined linearly with a weighted combination, as shown below, where
and (
) are the weights of SKCF and SSR methods, respectively. The product items with the top-N values in the resulting linear combination of the two methods are selected for recommendation.
2.5. Hybrid Online Product Recommendation: ChoiRec12 [39]
Summary of ChoiRec12 [
39]: Choi, Yoo, Kim, and Suh (2012) proposed a hybrid recommendation system that uses a combination of CF and SPM. This system extracts implicit ratings based on purchase history using the number of times that user u purchased item i with respect to the total transactions, which can be used in CF even when the explicit rating is not available.
An Example Application of ChoiRec12 System [
39]: For a given a fragment of historical purchase data, such as that in
Table 18, where only the purchase dates of items by users are provided as available information, the goal is to recommend suitable items to a user T.
The general algorithm follows seven steps to recommend items to user T. Step 1: Deriving implicit ratings from user transactions. The implicit rating can be computed based on purchase history using the number of times user u purchased item i with respect to total transactions. For example, user 1 purchased item 1 one time out of three transactions. In the same way, a user–item implicit rating matrix created from the historical data can be considered, as in
Table 19.
Step 2: Calculating mean rating and user similarity based on the implicit rating. The mean rating is computed by adding all the ratings of items by users with respect to the total numbers of ratings. Thus, the mean rating for user 1 = (3 + 1 + 5)/3 = 3, user 2 = 2.5, user 3 = 2.3, user 4 = 4, and user T = 3. The similarities between users are then computed using the cosine similarity, which is provided as follows:
where (
) denotes the ratings of users T for item i; similarly,
denotes the rating of user b for item i. For example, the calculated similarities between the target user T and every other user will be CS(T,1) = 0.7071, CS(T,2) = 0.9648, CS(T,3) = 0.8944, CS(T,4) = 1, where CS(T,1) means the cosine similarity between target user T and user 1, etc.
Step 3: Finding Top k nearest neighbors of target user T. This is done by sorting the user’s similarities in descending order and then selecting the top k (where k = 2) neighbors. Thus, the sorted similarities in descending order are CS(T,4) = 1, CS(T,2) = 0.9648, CS(T,3) = 0.8944, CS(T,1) = 0.7071. In this case, the top-2 neighbors for target user T are User 4 and User 2.
Step 4: Calculating the CF-based predicted preference (CFPP). The rating information of the top k neighbors is then used to predict the CF-based predicted preference of user a on item i. For example, the CFPP of a target user T on all other items is now CFPP(T, item1) = 4.7455, CFPP(T, item2) = 3.5, CFPP(T, item3) = 3.2365, CFPP(T, item4) = 2, and CFPP(T,5) = 3.
Step 5: Deriving sequential patterns and computing purchase item-based score (SPAPP). The sequence data of each user are generated by sorting the transaction data for each according to the transaction date. Then, frequent items are found using the candidate generation () and pruning () processes until the candidate set is empty. Next, the sub-sequences of a target user purchase are matched with derived purchased items by enumerating the target user purchase item. Finally, pattern analysis is conducted based on the predicted preference (SPAPP) of user T on item i. For example, the SPAPP of the target user on item 1 is SPAPP (T,1) = 0; similarly, SPAPP (T,2) = 0, SPAPP (T,3) = 0.75 + 0.5 + 0.5 = 1.25, SPAPP (T,4) = 0.5 + 0.5 + 0.5 = 1.5, and SPAPP (T,5) = 0.5.
Step 6: Integrate CFPP and SPAPP. CFPP and SPAPP are normalized to obtain N_CFPP and N_SPAPP, respectively. The final predicted preference of the target user T on item i, FPP (T,i), is calculated as
times CFPP plus
times SPAPP, where
and
are the respective weights assigned to CF and SPA, and are set to 0.1 and 0.9. The FPP values are shown in
Table 20.
Step 7: Recommend the item having highest rank. After obtaining the FPP values of the items purchased by the neighbors of the target user, the item with the highest FPP is recommended to the target user T. In the case from
Table 20, items 3 and 4 are be recommended, as they have the highest FPP values.
2.6. Hybrid Model: HM RecSys16 [40]
Summary of HM RecSys16 System [
40]: A hybrid recommender system that combines the prefix span algorithm with traditional matrix factorization was proposed in [
40]. SPM aims to find frequent sequential patterns in sequence databases, and is applied in this hybrid model to predict customer payment behavior, contributing to the accuracy of the model. The workflow of the system consists of three phases: Behavior Prediction, CF, and Recommendation.
The BPM (Behavior Pattern Model) utilizes the prefix–span algorithm to extract the most prevailing purchasing sequences from the warehouse in real time and match the sequences with customer behavior patterns for a customer browsing or adding an item to the cart. When the recommender system’s behavior monitoring part detects the user’s potential purchasing tendencies, the system fetches the user’s historical behavior record from the sequence database and builds an item–user rating matrix like
Table 21, in which each entry contains the historical behavior of the Ith user with respect to the Jth product.
The CF method is used to find a set of customers whose purchased and rated items overlap the user’s purchased and rated items. The algorithm generates recommendations based on a few customers who are most similar to the user and generates preference tendencies of the users based on their historical purchasing record. The basic matrix factorization model is used, which factorizes the user–item matrix into two matrices, one representing features of the products and another representing the preferences of users. Multiplying the two matrices provides predictions about the user’s preferences for all products.
The
represents the rating of item i by user u; the latent factor model is then used to learn the factor vectors
and
by minimizing the regularized squared error on the set of known ratings.
Recommendation Phase: the payment behavior patterns extracted from the behavior prediction phase and the preferences collected using the CF method are combined to select target items as suggestions. In the first step, the customer’s real-time behavior sequences are generated and stored in a database called the candidate database. The candidate database is scanned at regular intervals and the sequence containing payment patterns is sent to the recommender system as a potential purchasing sequence. Second, for the potential buyers, the preference information from CF phase which represents the preference degree towards each product is generated. Because the sequential mining phase generates both the payment sequence and the category of the target item, the category-matched items in the preference vector are recommended.
2.7. Product Recommendation System: PRS RecSys16 [41]
Jamali and Navaei (2016) proposed a two-level product hybrid recommendation system which combines a C-Means clustering algorithm and Freespan algorithm. At first, the available products are clustered by using the C-Means algorithm to create groups of products with similar characteristics. Then, the second level considers the customer’s behavior and their purchase history in order to draw relationships between products using Sequential Pattern Analysis (SPA). These relationships eventually lead to appropriate recommendations for customers and increase the likelihood of selling related products in electronic transactions.
The PRS (Product Recommendation System) includes two levels of product recommendation; the first level is recommended before product purchase and the other after purchasing. PRS initially collects product data from the electronic store, separates the products according to their type, then clusters them based on their numerical attributes into three separate clusters of high, medium, and low quality using the C-means algorithm. Here, the C-Means clustering algorithm is used to separate products by their types and create groups with similar features to classify products. This algorithm generates clusters based on fuzzy logic, and does not consider sharp boundaries between the clusters, allowing each feature vector to belong to different clusters by a certain degree. The degree of membership between a feature vector and a cluster is usually considered as a function of its distance from the cluster centroid points, based on minimization of the following objective function:
where m is any real number greater than 1,
is the degree of membership of
in cluster j,
represents the i-th d-dimensional measured data,
is the d-dimensional center of the cluster, and
is any norm expressing the similarity between any measured data and the center.
Next, the PRS tries to identify the customer’s requirements and criteria using an online form that takes information about product such as type, quality, price, brand, etc. This information is used to assign an appropriate cluster to the customer. In the second level, information about the history of the customer’s shopping behavior is collected. This information is used to explore the relations between products using the Freespan algorithm of the SPA method. Freespan mines sequential patterns by partitioning the search space and projecting the sequence subdatabases recursively based on the projected itemsets [
46]. Eventually, these relations and patterns are provided as product recommendations, recommending products associated with the purchased products, making the customer aware of potentially related products, as relationships between products increase the likelihood of a customer buying those products together.
2.8. Sequential Pattern-Based Recommender System: SainiRec17 [42]
Summary of SainiRec17 System [
42]: Saini et al. (2017) tried to find the sequence of all items which were bought regularly, that is, finding the same product purchased every month as well as the different products purchased one after another in a sequence. Users buy certain products in a sequence; for example, most users buy a mobile phone and mobile phone cover in sequence. Thus, this approach tries to find such sequences in the online shopping context. The main objective is to find those sequences that are most frequent among all users, with the intra-duration being the sequence in an online product purchasing system. With the help of the SPADE [
32] algorithm, frequent sequential purchase patterns can be found; then, in the next step, a sequence mining algorithm is applied to find those sequences available in the dataset. Finally, the time elapsed between the purchase of first product and next sequential product is calculated by finding the mean and mode of the duration followed by all users. Here, the mean provides the average time gap between products, while the mode provides the duration followed by most of users.
2.9. Historical Clickstream-Based Recommendation: HPCRec18 [43]
Summary of HPCRec18 System [
43]: The novel recommendation system called Historical Purchase with Clickstream recommendation system (HPCRec) integrates purchase frequencies and consequential bond relationships between clicks and purchases. The term consequential bond was introduced in this HPCRec system, and originates from the concept that a customer who clicks on certain items in most cases ultimately purchases an item from their list of clicks. Processing this information enhances the user–item rating matrix in terms of both the quantity and quality aspects, thereby improving recommendations. The quality of ratings is improved by capturing the level of interest in a product that has been previously purchased by a user through the record of the normalized frequency of purchase using the unit vector method. The quantity of ratings is improved by the consequential bond between clicks and purchases for sessions without purchases. Finally, the ratings for all the original unknowns are predicted based on this enriched rating matrix using the CF algorithm. The HPCRec system can provide recommendations for infrequent users, and proves that the consequential bond with normalized frequencies is more effective at predicting user interest.
An Example Application of HPCRec18 System [
43]: Inputs to HPCRec system [
43] are: (1) user–item rating matrix (
Table 22) and the consequential table (
Table 23), which shows the relationship between user clicks and purchases, and (2) the user item purchase frequency matrix (
Table 24), which represents the frequency of a product purchased in the user item rating matrix. The working of the algorithm is demonstrated in the following steps.
Step 1: Normalize the purchase frequency matrix using unit vector formula. The user–item purchase frequency matrix (
Table 24) is formed from
Table 23, where the value represents the number of times a product was purchased by a user. The purchase frequency is then normalized to a scaled value (0 to 1) to form the normalized user–item purchase frequency matrix (
Table 25) using the unit vector formula shown below.
For example, if user 2 purchases (item1: 1; item2: 2; item3: 0; item4: 3), then the normalized purchase frequency of user 2 for item 2 is .
Here, LCS(x,y) is the longest common sub-sequence between sequence x and sequence y, and is computed as shown below.
if i = 0 or j = 0; but if ; but if , where is the maximum length of two sequence.
Step 2: Compute clickstream sequence similarity measurement (CSSM). For each session without a purchase in the consequential table, the clickstream sequence similarity measurement (CSSM) is computed to find similar sessions with a purchase value using the longest common sub-sequence rate (LCSR), for example,
As there is no purchase information for session 6 in the consequential table (
Table 23), the Clickstream similarity between session 6, which is <3,5,2>, and other sessions is computed, as as shown in
Table 26.
Step 3: Form a weighted transaction table (
Table 27) using the similarity as weight and purchases as transaction records.
Step 4: Call the TWFI (Transaction-based Weighted Frequent Item) function. This takes a weighted transaction table in which weights are assigned to each transaction as input and returns items with weighted support within the given threshold. For example, consider a minimum weighted support = 0.1; then, we have the frequent weighted transaction table shown in
Table 28.
Step 5: Calculate support to form a distinct item from set of all the transactions as given in
Table 29.
Step 6: Compute the average weighted support for each item using AWS as AW multiplied by support, where AW is the sum of the item weight divided by support as shown in
Table 30. For example, AWS (1) = 0.33 + 0.295 = 0.625, AWS (4) = 0.33 + 0.245 + 0.245 = 0.82.
Step 7: Normalize the weighted support using feature scaling . For the average weighted support, max = 1.79, min = 0.625, the new average weighted support for item3 is (0.845 minus 0.625) divided by (1.79 minus 0.625) = 0.189. All the weighted supports are .
Step 8: Return all the items that have a normalized weighted support greater than or equal to minimum weighted support (e.g., (2:1),(3:0.189),(4:0.167)). For each one of these items, if the user has not purchased it, add the weight to the normalized user–item matrix.
Step 9: Return to step 2 if there are more sessions without a purchase; otherwise, run the CF algorithm using the updated rating matrix to obtain predicted ratings for all of the original unknowns. This is demonstrated in
Table 31.
2.10. Historical Sequential Pattern Recommendation: HSPRec19 [6]
Summary of HSPRec19 System [
6]: This work was proposed to improve the HPCRec system, which does not integrate frequent sequential patterns to capture more real-life customer sequence patterns of purchase behavior inside consequential bond. Thus, the authors proposed an algorithm called HSPRec (Historical Sequential Pattern Recommendation System), which can explore and enrich the user–item matrix using sequential patterns of customer clicks and purchases in order to better capture customer behavior.
An Example Application of HSPRec19 System [
6]: Given the following input data of minimum support, historical user–item purchase frequency matrix, and consequential bond, the expected output is an enriched user–item matrix for CF. The application of the HSPRec19 [
6] goes through the following steps to find the required results for improved recommendation.
Consider the consequential bond of clicks and purchases (
Table 32) created from click and purchase historical data and the daily sequential database (
Table 33) created from historical transaction data by considering the period of time (day, week, and month).
Step 1: Create a user–item purchase frequency matrix (
Table 34) from
Table 32, where the number indicates the number of times an item purchased by a user. For example, user 1 purchased butter twice, honey once, etc.
Step 2: Create frequent sequential purchase patterns from daily sequential database (
Table 33) using the GSP algorithm. The possible purchase sequential rules from frequent purchase sequences are shown in
Table 35.
Step 3: Fill in the purchase information in the user–item frequency matrix using sequential purchase rules to obtain a richer matrix as in
Table 36.
Step 4: As can be seen in
Table 33, there is no purchase information for user 3. Thus, to find purchase information for user 3, the relationship between clicks and purchases is analyzed by considering their sequence and recommending items based on the click sequential rule for cases where the user clicks and then does not purchase anything.
Step 5: Compute the Click Purchase Pattern (CPS) similarity using the frequency and sequence of click and purchase patterns. If there is no purchase from among the with clicked item, use the recommended item.
Step 6: Assign a Click Purchase (CPS) similarity value to the purchase patterns present in the consequential bond.
Step 7: Assign weighted purchase patterns to the Weighted Frequent Purchase Pattern Miner (WFPP) and compute weights for the items present in the weighted purchase pattern using the equation below.
Step 8: Use the weights of the items to construct the rich user–item matrix.
Step 9: Normalize the rich user–item purchase frequency matrix (
Table 37) to obtain the normalized quantitatively rich user–item matrix (
Table 38) using the unit normalization function below.
In [
6], user-based collaborative filtering was used to compare and evaluate the performance of the ChoiRec12, HPCRec18, and HSPRec19 recommendation systems against the traditional CF algorithm in terms of the quality of ratings predictions with respect to the Mean Absolute Error (MAE) predictive accuracy metric by varying the number of users and nearest neighbors. The MAE compares the predicted ratings to actual user ratings over a test sample in a recommendation system, and is defined as the average absolute difference between predicted ratings and actual ratings. User-based collaborative filtering was used to compare and evaluate the performance of the ChoiRec12 [
39], HPCRec18 [
43], and HSPRec19 [
6] recommendation systems against the traditional CF algorithm in terms of the quality of ratings prediction with respect to the Mean Absolute Error (MAE) predictive accuracy metric by varying the number of users and nearest neighbors. MAE compares the predicted ratings to actual user ratings over a test sample in a recommendation system, and is defined as the average absolute difference between predicted ratings and actual ratings.
The performance of SP-based E-commerce recommendation systems such as ChoiRec12 [
39], HPCRec18 [
43], and HSPRec19 [
6] was evaluated in terms of the quality of recommendations generated by varying the number of users with respect to classification accuracy measures such as the precision and recall, which evaluate the frequency with which the system makes correct/incorrect decisions. Precision is the fraction of all recommended items that are relevant, while recall is the fraction of all relevant items that are recommended. The results obtained from the experimental comparative analysis of Traditional CF, ChoiRec12 [
39], HPCRec18 [
43], and HSPRec19 systems conducted by [
6] showed that the HSPRec19 system performed the best in comparison to the other recommendation systems, as it uses the SPM (GSP algorithm) to discover frequent historical sequential patterns and analyses clickstream behaviour to improve the consequential bond between clicks and purchases, thereby enhancing the user–item frequency matrix both quantitatively and qualitatively to generate a rich user–item matrix for CF. This results in better recommendations in terms of reduced data sparsity while improving recommendation accuracy, scalability, diversity, and novelty. Thus, of all the reviewed SP-based E-commerce recommendation systems, the HSPRec19 system performs the best in real-life application scenarios.


