Article

Enhancing Ultimate Bearing Capacity Prediction of Cohesionless Soils Beneath Shallow Foundations with Grey Box and Hybrid AI Models

by
Katayoon Kiany
1,
Abolfazl Baghbani
2,3,*,
Hossam Abuel-Naga
4,*,
Hasan Baghbani
5,
Mahyar Arabani
6 and
Mohammad Mahdi Shalchian
6
1
School of Design, University of Melbourne, Parkville, VIC 3052, Australia
2
School of Engineering, Deakin University, Geelong, VIC 3216, Australia
3
Future Regions Research Centre (FRRC), Federation University, Gippsland, VIC 3842, Australia
4
Department of Civil Engineering, La Trobe University, Bundoora, VIC 3086, Australia
5
School of Engineering, Ferdowsi University of Mashhad, Mashhad 9177948974, Iran
6
School of Engineering, Guilan University, Guilan 4199613776, Iran
*
Authors to whom correspondence should be addressed.
Algorithms 2023, 16(10), 456; https://doi.org/10.3390/a16100456
Submission received: 20 August 2023 / Revised: 16 September 2023 / Accepted: 22 September 2023 / Published: 25 September 2023
(This article belongs to the Special Issue Machine Learning Algorithms in Prediction Model)

Abstract

:
This study examines the potential of the soft computing technique, namely, multiple linear regression (MLR), genetic programming (GP), classification and regression trees (CART) and GA-ENN (genetic algorithm-emotional neuron network), to predict the ultimate bearing capacity (UBC) of cohesionless soils beneath shallow foundations. For the first time, two grey-box AI models, GP and CART, and one hybrid AI model, GA-ENN, were used in the literature to predict UBC. The inputs of the model are the width of footing (B), depth of footing (D), footing geometry (ratio of length to width, L/B), unit weight of sand (γd or γ′), and internal friction angle (ϕ). The results of the present model were compared with those obtained via two theoretical approaches and one AI approach reported in the literature. The statistical evaluation of results shows that the presently applied paradigm is better than the theoretical approaches and is competing well for the prediction of qu. This study shows that the developed AI models are a robust model for the qu prediction of shallow foundations on cohesionless soil. Sensitivity analysis was also carried out to determine the effect of each input parameter. The findings showed that the width and depth of the foundation and unit weight of soil (γd or γ′) played the most significant roles, while the internal friction angle and L/B showed less importance in predicting qu.

1. Introduction

In the realm of geotechnical engineering, the consideration of ultimate bearing capacity (UBC) and allowable settlement continues to be of paramount importance when designing shallow foundations [1,2,3]. These aspects are crucial factors that dictate the structural integrity and performance of any construction project. UBC, a fundamental parameter, is deeply intertwined with the shear strength characteristics of the underlying soil, and its accurate estimation is essential for ensuring the stability of foundations. Theoretical formulations proposed by eminent geotechnical scholars such as Terzaghi [4], Meyerhof [5], Hansen [6], and Vesic [7] have provided a foundation for calculating UBC. However, the application of these theories has revealed that various UBC equations exhibit significant disparities, primarily due to the inherent simplifications and assumptions employed in these approaches [8].
The pursuit of accurate UBC prediction has led to a proliferation of research studies that explore numerical and semi-empirical solutions. The works of Conte et al. [9] and Achmus and Thieken [10] stand as examples of such efforts, where researchers have sought to elucidate the complex bearing capacity phenomenon. These models are frequently evaluated through meticulously designed footing tests carried out on scale models. Yet, bridging the gap between laboratory-scale experiments and real-world, full-scale foundation scenarios remains a challenge. Scholars, cognizant of the potential scale effects, have undertaken initiatives to minimize discrepancies when extrapolating findings from controlled laboratory conditions to the complexities of real-world projects. This endeavor to account for scale effects, as seen in the works of de Beer [11] and Yamaguchi et al. [12], underscores the dedication within the geotechnical community to ensuring the accuracy and reliability of their predictions.
In a pursuit to unravel the intricate facets of bearing capacity, researchers have embarked on investigations that dissect the influence of factors such as particle size on UBC. The study carried out by Tatsuoka et al. [13] exemplifies this endeavor, as it unravels the nuances of soil behavior during model-scale footing experiments. Interestingly, the results drawn from large-scale tests conducted on compacted sand have unveiled pronounced variations in shearing strains along the slip line. These findings have challenged conventional formulas that solely rely on the concept of maximum friction angle (ϕmax) [14]. This revelation underscores the critical need for a nuanced understanding of the underlying mechanics and limitations of various theoretical equations, ultimately driving the demand for innovative approaches to enhance the accuracy of UBC predictions in real-world scenarios.
Enter artificial intelligence (AI), a groundbreaking paradigm that has reshaped various scientific disciplines. The realm of geotechnical engineering, while somewhat reserved in its adoption of AI, has begun to witness the application of AI-based techniques in addressing complex challenges. AI methods such as artificial neural networks (ANNs), fuzzy inference systems (FISs), adaptive neuro-fuzzy inference systems (ANFISs), and others have shown remarkable potential in deciphering intricate relationships within complex datasets across diverse domains such as soil dynamics [15,16,17,18,19,20], deep foundations [21,22,23,24], soil cracking [25,26,27], recycled materials [28,29,30,31,32,33,34,35,36], soil mechanics [37,38], tunnelling and rock mechanics [39,40,41] and other fields [42,43,44,45,46,47,48,49,50,51]. The beauty of these techniques lies in their capacity to capture nonlinear interactions between a myriad of variables, even when the underlying relationships are not fully understood. Recent forays into AI applications in geotechnical engineering have showcased the supremacy of AI over traditional analytical formulas when addressing UBC in shallow foundations [14,52,53,54,55,56]. This shift in approach offers a promising avenue for ushering in a new era of accurate and reliable UBC predictions.
Yet, despite the remarkable strides made by AI in various fields [57,58,59], its penetration into the geotechnical engineering sphere remains somewhat limited, as evidenced by the existing literature. This research endeavor boldly pioneers the utilization of grey box AI methodologies and a hybrid AI approach to predict UBC in the context of shallow foundations on cohesionless soils.
This ambitious research journey encompasses a comprehensive ensemble of four distinct mathematical models, each contributing a unique facet to the overarching goal. The multiple linear regression (MLR) model forms the foundation as a statistical framework, shedding light on the significance of individual parameters. Concurrently, the integration of grey box AI models such as genetic programming (GP) and classification and regression tree (CART) methods introduces a novel dimension to UBC prediction, bridging the gap between traditional analytical approaches and cutting-edge AI methodologies. Then, the Genetic Algorithm-Emotional Neural Network (GA-ENN) method, a hybrid AI approach that harnesses the strengths of genetic algorithms and neural networks, was employed. This amalgamation of diverse approaches is harnessed for the very first time to unravel the enigma of predicting the ultimate bearing capacity of cohesionless soils beneath shallow foundations.
The culmination of this research is not merely a prediction tool; it represents a paradigm shift that opens new vistas for accurate and reliable foundation design. This shift comes with a rigorous evaluation of the significance of input parameters, accompanied by a comprehensive sensitivity analysis to ensure the robustness and applicability of the predictive models in real-world scenarios. As we peer into the future, the impact of this pioneering effort is poised to extend beyond the boundaries of geotechnical engineering, ushering in a new era of precision and innovation across the construction industry.

2. Database Collection and Processing

The collected database contains a total of 97 datasets comprising results from tests on square, rectangular, and strip footings of various sizes conducted in sand beds with different unit weights (dry unit weight, γd or effective unit weight, γ′). To improve the model’s performance, the data are evenly distributed, ensuring an equal number of samples for large and small-sized footings.
Out of the 97 datasets [14,60], 47 are derived from load tests on large-scale footings from different references [14,60,61,62]. The remaining 50 datasets are from load tests on smaller-sized model footings, as reported by Gandhi [63].
For the large-scale tests conducted at the DEGEBO test area in Berlin, submerged unit weights (γd or γ′) are utilized due to the submerged conditions during testing [14,60]. The angle of shearing resistance reported by the respective authors is adopted for the analysis, despite some differences in the mobilized angle of shearing resistance at failure between axisymmetric and plain strain conditions. Nevertheless, these differences do not exceed 10% [14,60].
In the case of laboratory model tests, the internal friction angles used are obtained from direct shear tests conducted at very low normal stresses, which also includes the effect of dilation.
Regarding the determination of ultimate load, for large-scale footings, it is defined as the load corresponding to the point where the slope of the load settlement curve is at its minimum. For smaller-sized model footings, it is defined as the load corresponding to the point of break of the load settlement curve in a log–log plot. 
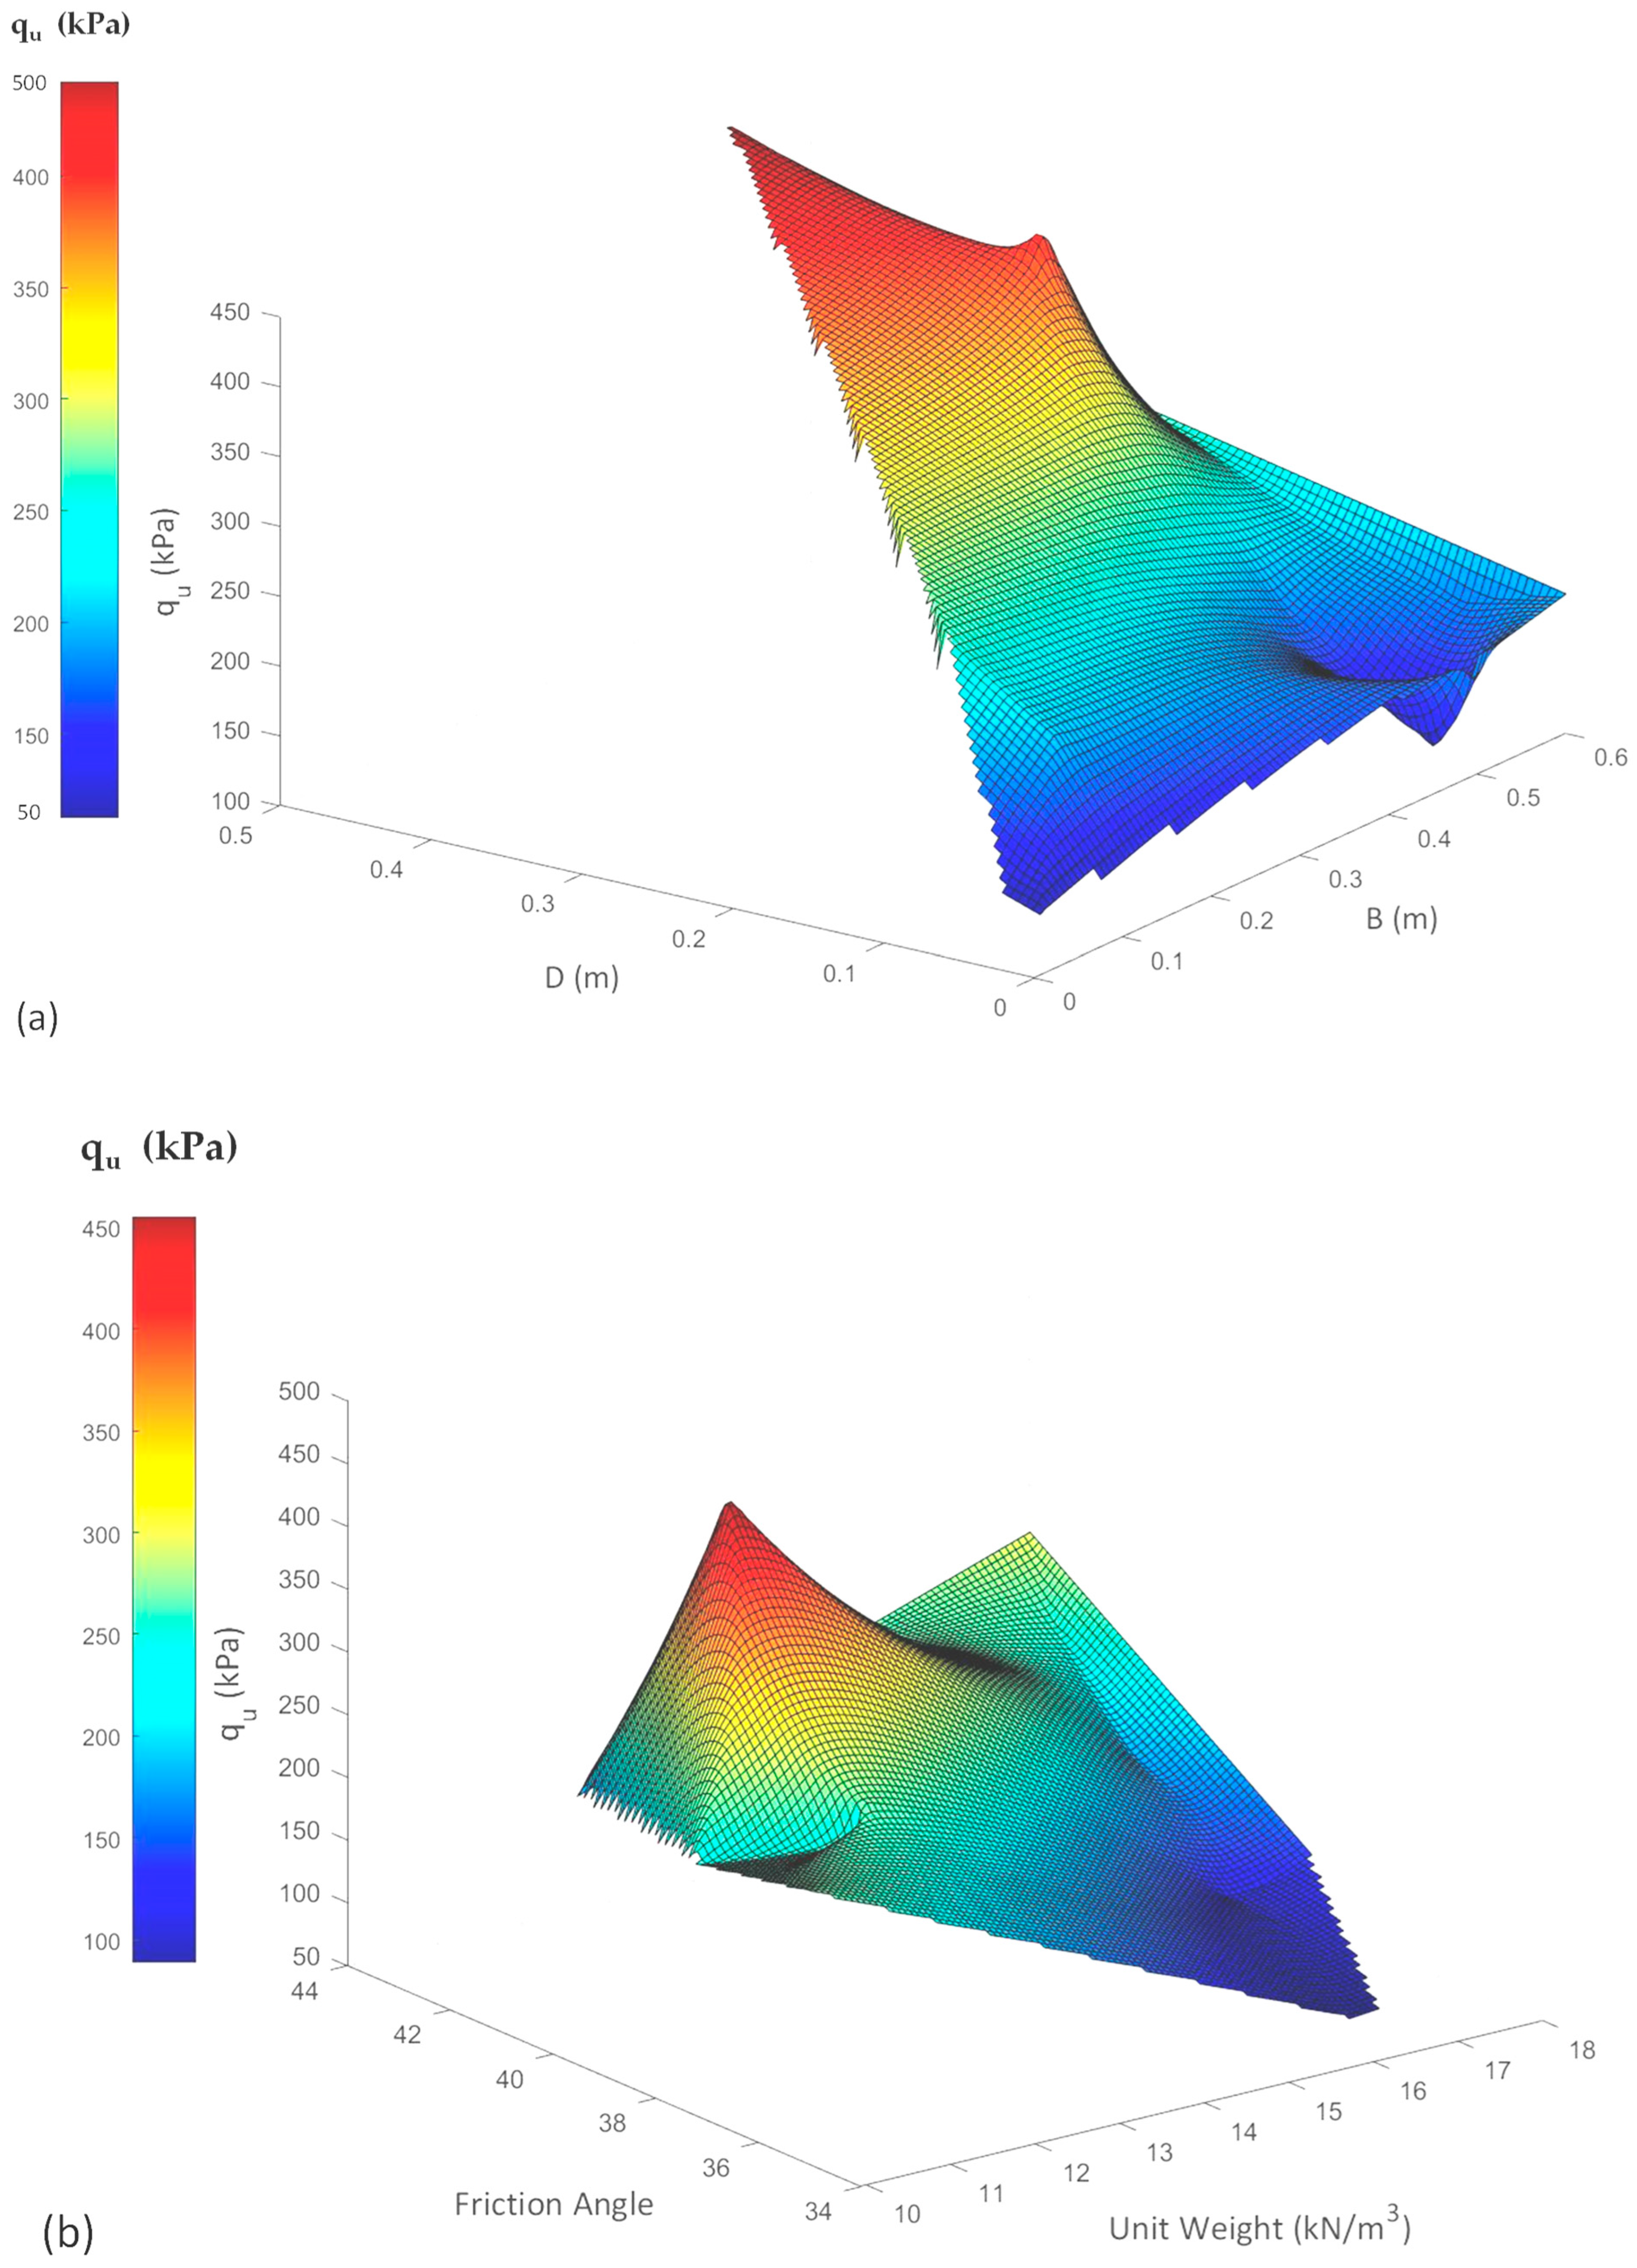
Figure 1 shows the distribution of the database.
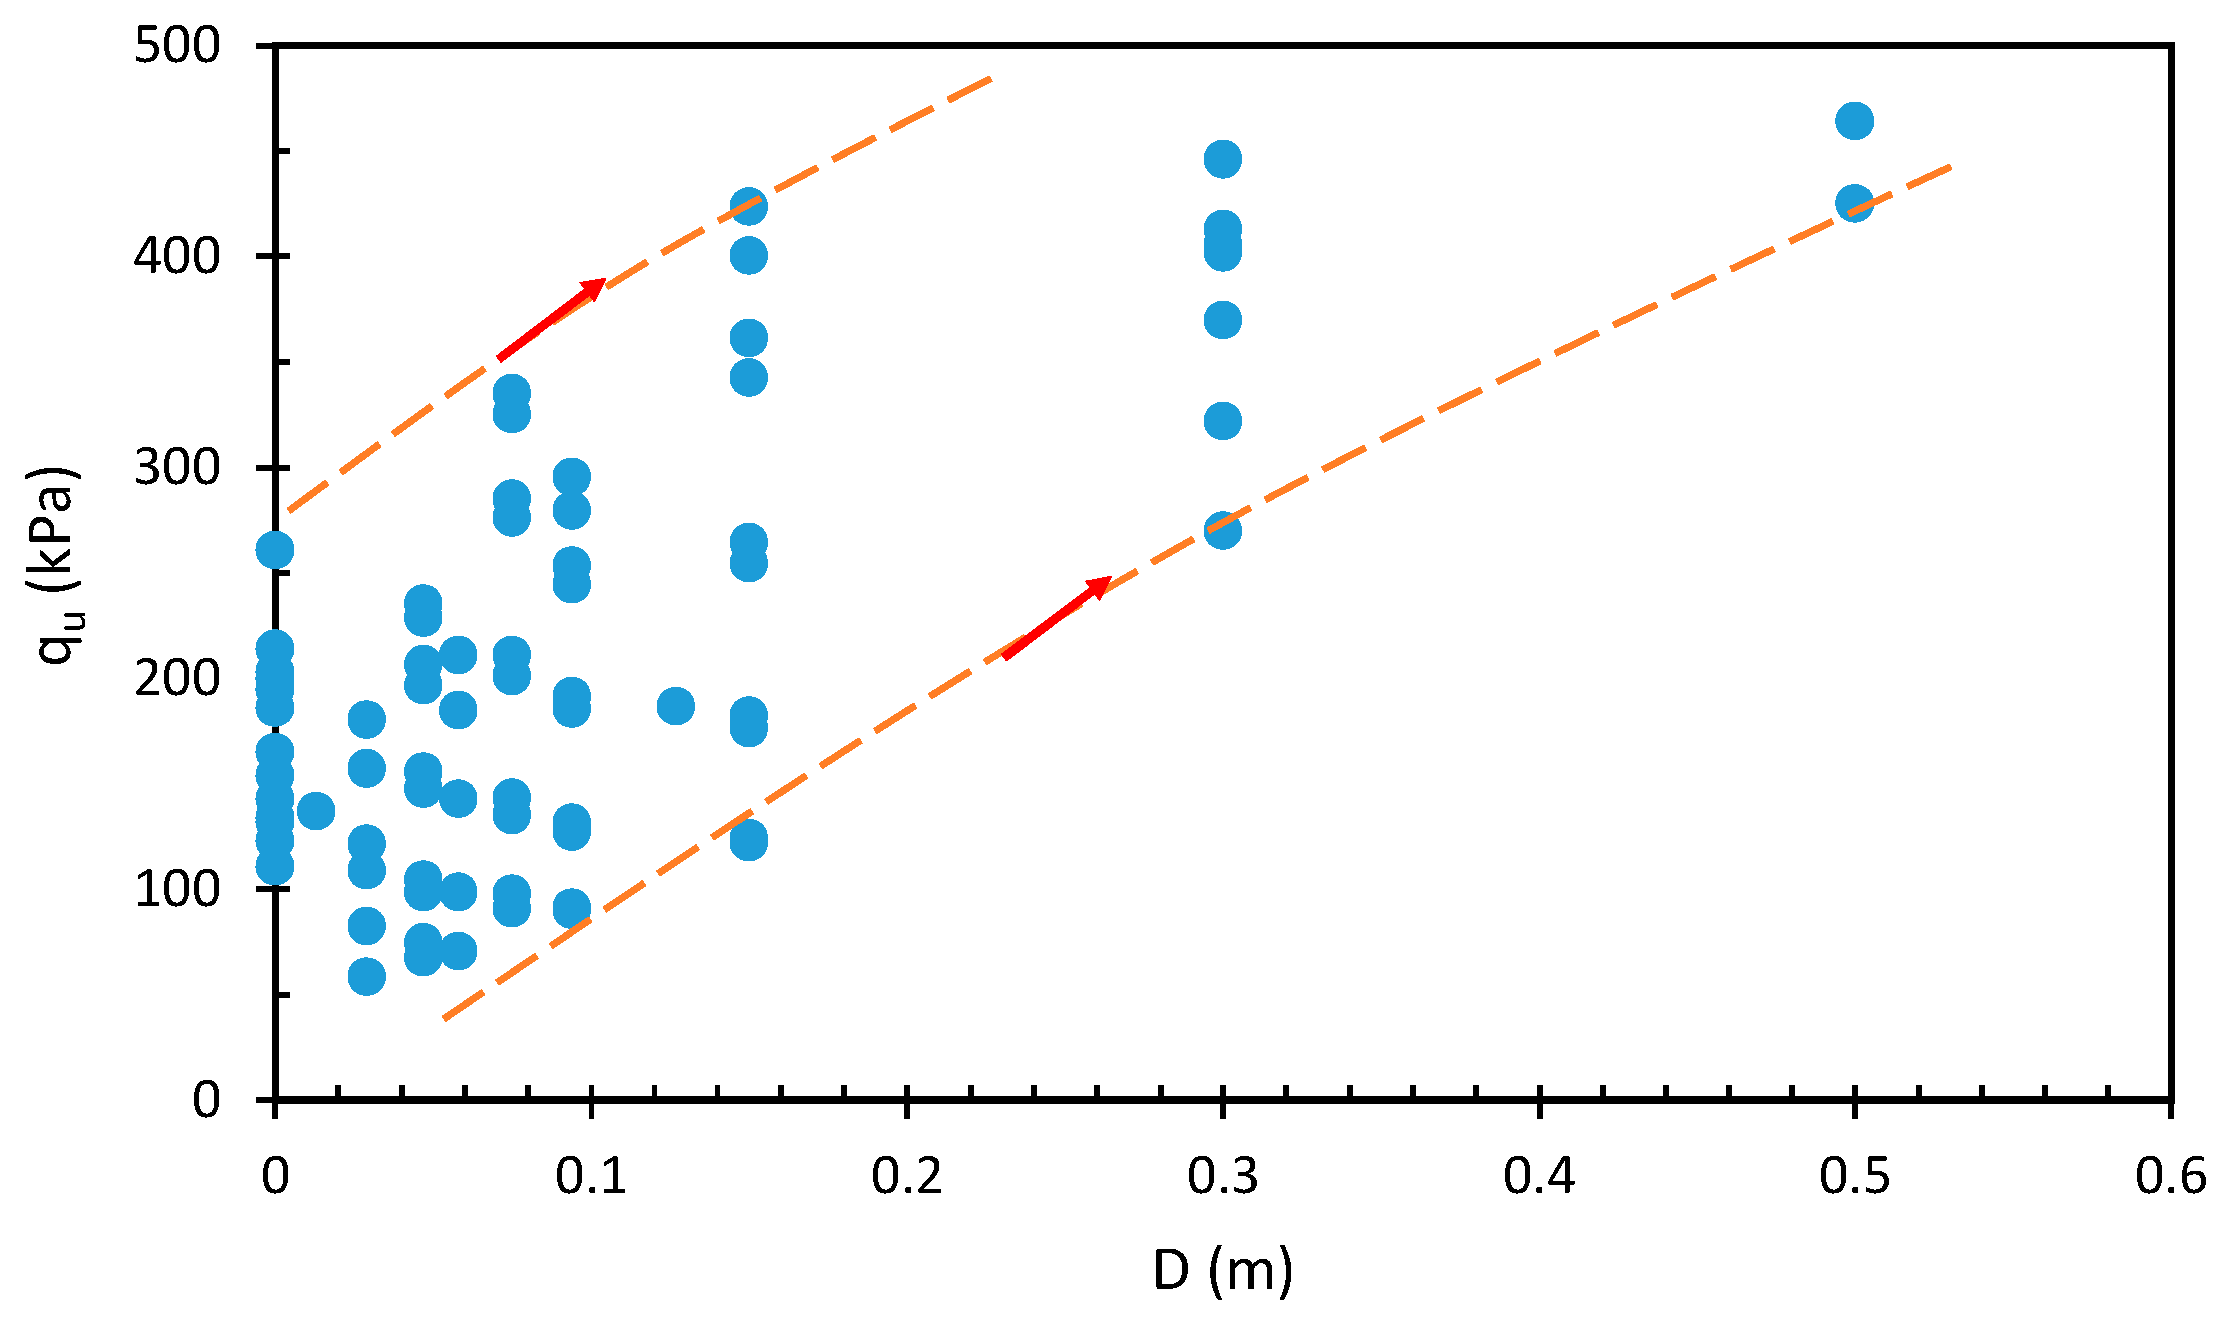
Figure 2 illustrates the influence of the foundation depth on the foundation load. From these diagrams, it can be observed that the bearing capacity of the shallow foundation increases with the increasing foundation depth.
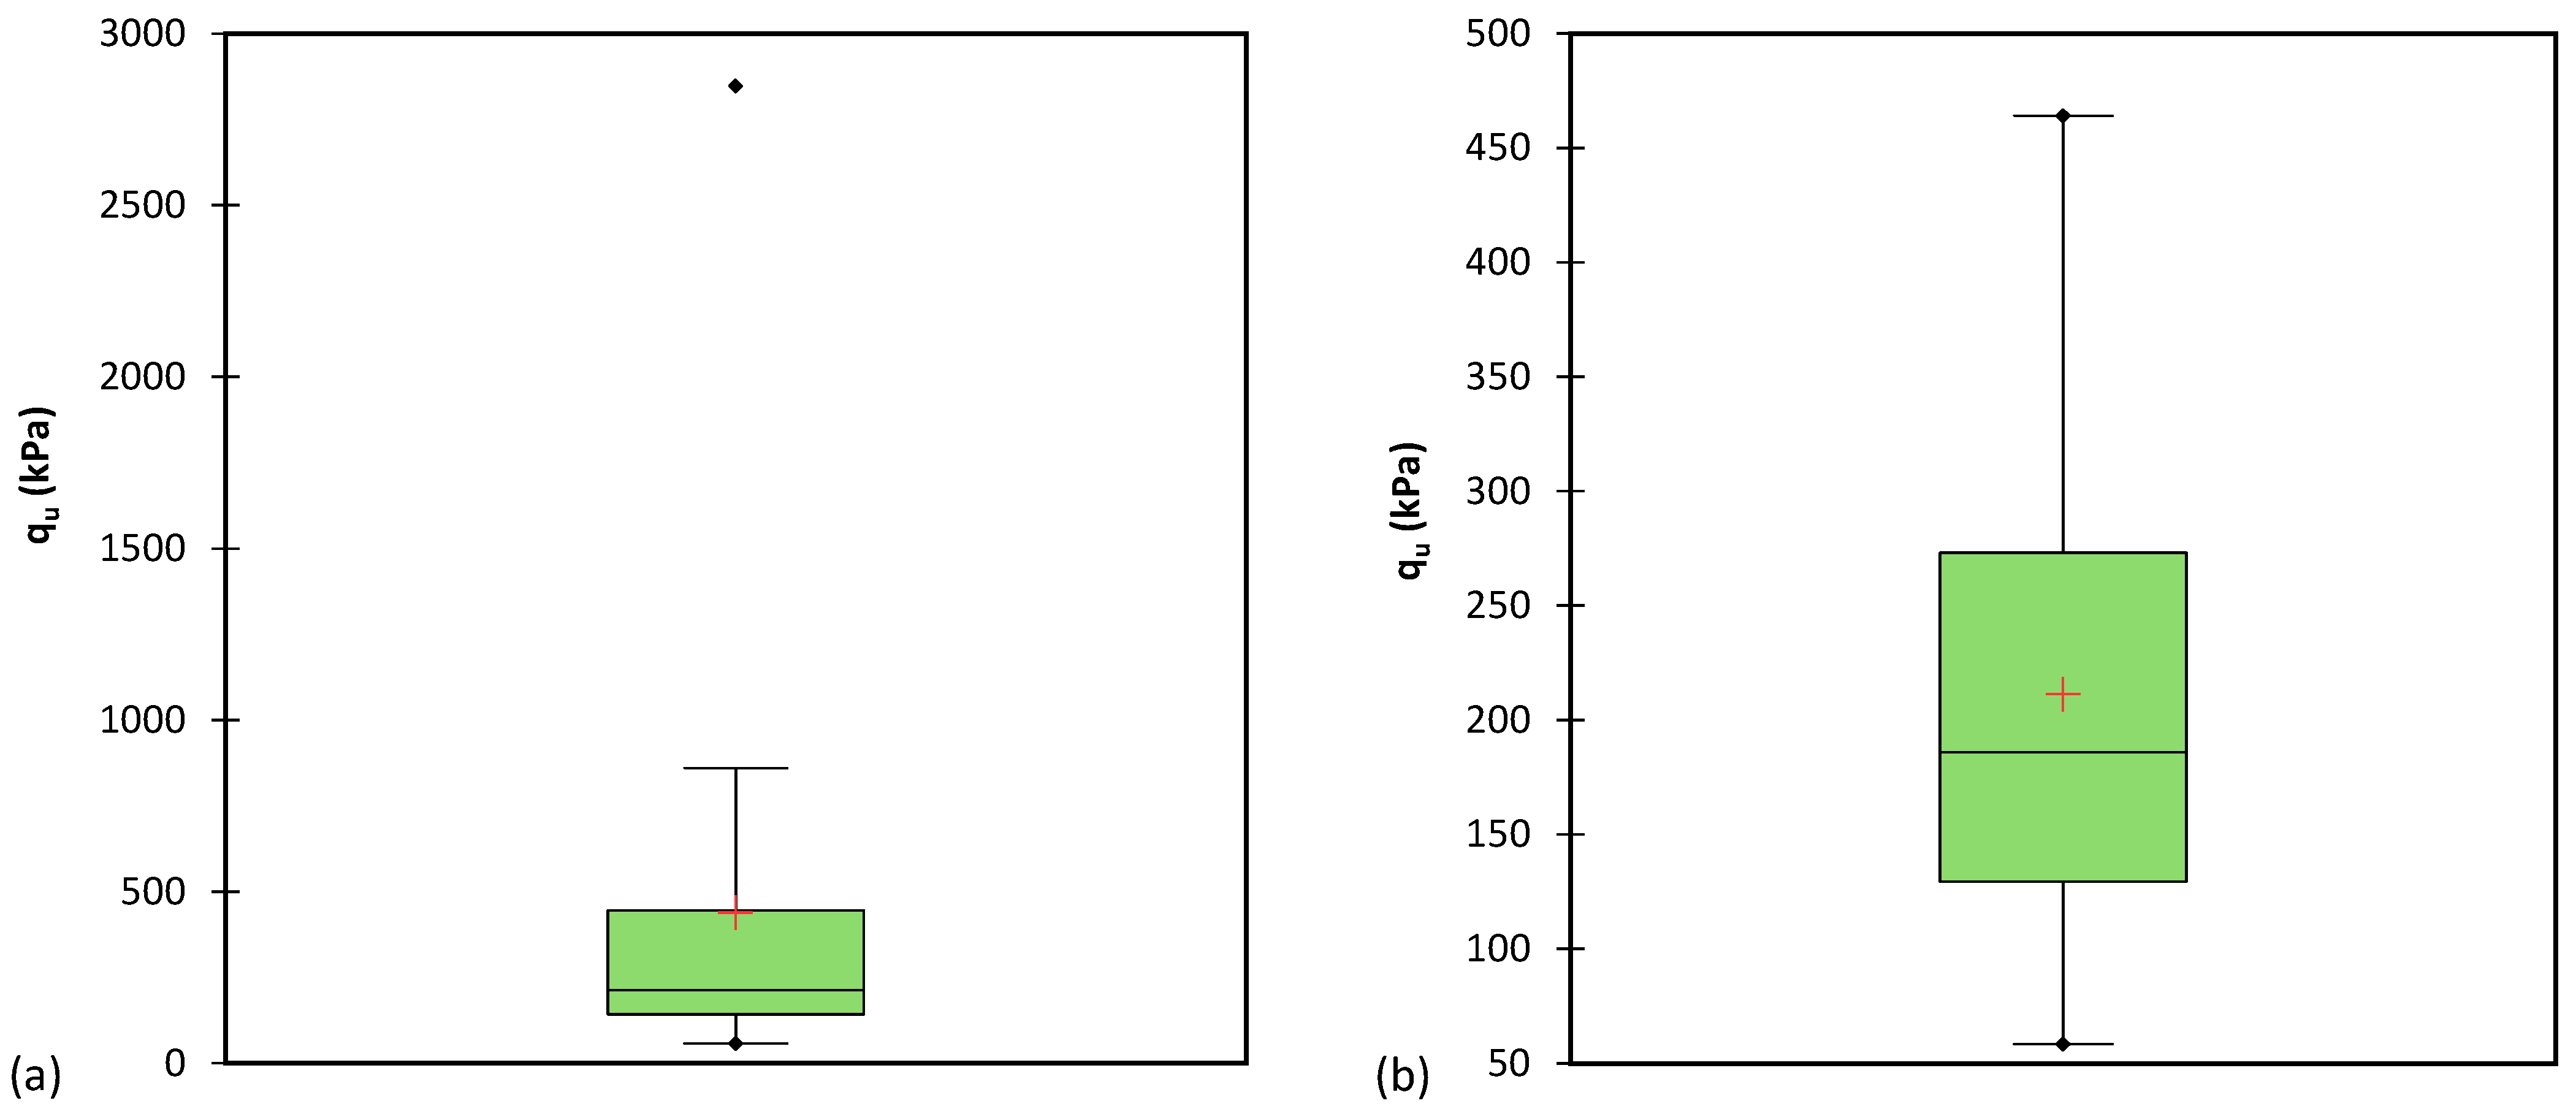
Prior to utilizing the existing database, a thorough check for inappropriate data was conducted. To accomplish this, a box plot for the output parameter was generated, and Figure 3a displays the results. Following the examination, 22 datasets were identified as inappropriate and subsequently removed from the overall database. The refined database consists of 75 suitable datasets, and their corresponding box plot is depicted in Figure 3b.
Table 1 presents the distribution of the utilized database after the exclusion of outliers. The data reveal valuable insights into the statistical characteristics of each variable. The ultimate bearing capacity of the foundation, represented by qu, varies significantly across the datasets, ranging from 58.500 kPa to 464.000 kPa, with a mean value of 211.274 kPa and a standard deviation of 108.959 kPa. On the other hand, the foundation width (B) displays a relatively tighter distribution, ranging from 0.059 m to 0.600 m, with a mean of 0.250 m and a standard deviation of 0.195 m. Similarly, the foundation depth (D) exhibits a narrow range, varying from 0.000 m to 0.500 m, with a mean value of 0.098 m and a standard deviation of 0.106 m. The aspect ratio (L/B), calculated as the ratio of foundation length to width, shows wider variability, ranging from 1.000 to 6.000, with a mean of 3.409 and a standard deviation of 2.269. The unit weight of the soil (γd or γ′) displays variations across the datasets, ranging from 9.850 kN/m3 to 17.100 kN/m3, with a mean value of 14.615 kN/m3 and a standard deviation of 2.625 kN/m3. Similarly, the internal friction angle of the soil (ϕ) exhibits moderate variability, ranging from 34.000° to 42.500°, with a mean value of 38.363° and a standard deviation of 2.691°. The information provided in 
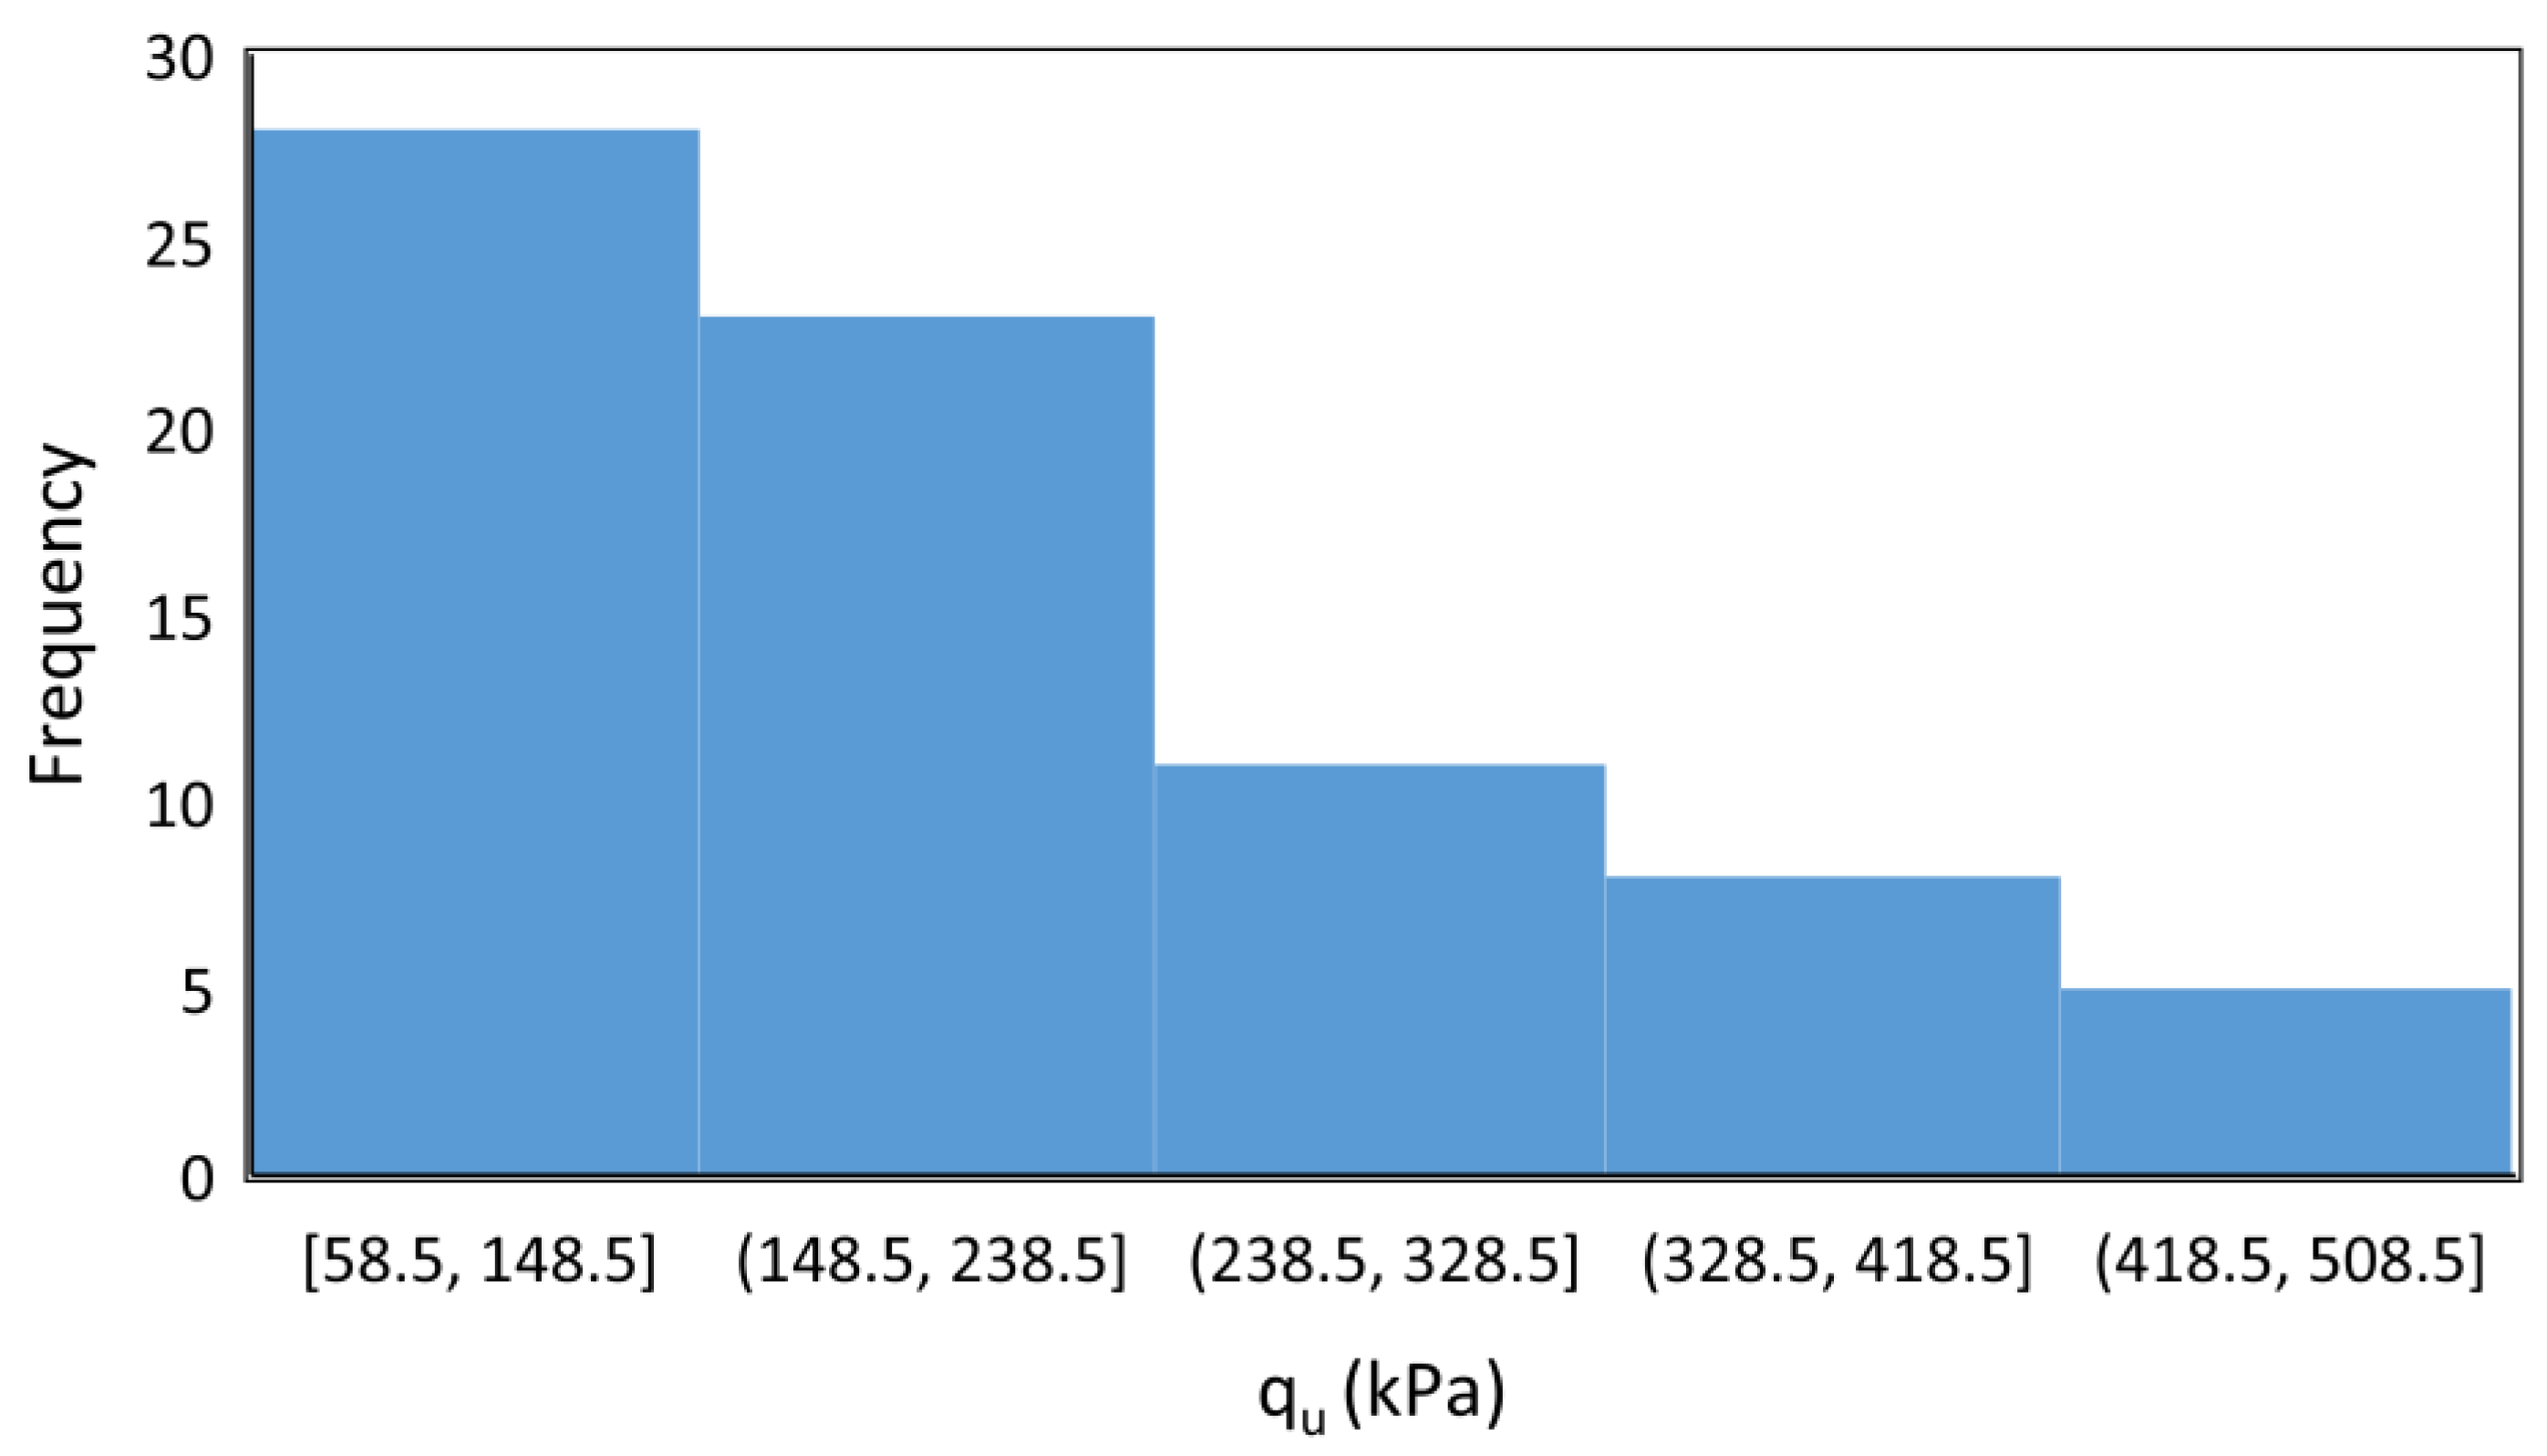
Table 1 serves as a basis for further analysis, offering crucial insights into the key factors influencing surface foundation load behavior and supporting improved foundation design and performance assessment. Width of footing (B), depth of footing (D), footing geometry (L/B), unit weight of sand (γd or γ′), and internal friction angle (ϕ). Furthermore, Figure 4 shows histograms for the output (qu).

3. Mathematical Models

3.1. Multiple Linear Regression (MLR)

MLR (multiple linear regression) is a statistical technique used to predict one output variable from multiple independent input variables. This method is an improved version of linear regression that uses a single input variable and one output variable. MLR considers linear relationships between input parameters and output parameters. The data are also normalized in this method.
The best line in MLR is obtained by selecting regression coefficients so that the model has the lowest error. Prior to AI methods, MLR was employed to check the accuracy of linear regression, which is one of the simplest regression methods.

3.2. Classification and Regression Trees (CART)

Classification and Regression Trees (CART) constitute a fundamental machine learning technique that holds its roots in the realm of decision trees. This method embodies a versatile approach capable of addressing both classification and regression tasks. The origins of CART can be attributed to its introduction by Breiman et al. [64,65] in the 1984 book titled “Classification and Regression Trees,” where they elaborated on its principles and applications. In essence, a CART algorithm partitions the feature space into a hierarchical structure of binary decisions, resulting in a tree-like structure wherein each internal node represents a feature and a threshold that conditions the data’s traversal along one of its two branches [66]. Through a recursive process, this partitioning culminates in terminal nodes, or leaves, which correspond to the predicted outcome for a given input instance. The efficacy of CART lies not only in its interpretability, owing to its intuitive representation, but also in its capacity to accommodate various data types and handle non-linear relationships between features and target variables [67,68].
The CART algorithm operates through an iterative procedure aimed at optimizing its splitting criteria, typically based on metrics such as Gini impurity for classification tasks and mean squared error for regression tasks [69]. By evaluating potential splits and selecting the one that minimizes the chosen metric’s value, the algorithm generates a hierarchy of decision rules that sequentially refine the prediction process. This process is governed by pruning strategies to mitigate overfitting and ensure generalizability. Although it is susceptible to certain limitations like instability and sensitivity to data variations, CART’s inherent adaptability and ability to handle missing values contribute to its enduring relevance and applicability in diverse domains, ranging from medical diagnosis to financial forecasting.

3.3. Genetic Programming (GP)

John Koza [70], a computer scientist and researcher at Stanford University, developed the first genetic programming system in the early 1990s. Using this system, he developed computer programs capable of solving mathematical problems and controlling robots [69]. Several genetic programming frameworks and toolkits were developed as a result of this development [71].
As a subfield of artificial intelligence and evolutionary computation, genetic programming (GP) is a method for solving complex problems using a process inspired by natural selection and genetics [72]. In this approach, potential solutions are represented as trees of operations (also known as computer programs) and then improved using genetic algorithms [73].
The GP algorithm generates an initial population of computer programs at random and evaluates their fitness in accordance with a problem-specific objective function [74]. Through genetic operators such as crossover and mutation, the best programs are selected to produce the next generation. The process continues until a satisfactory solution is found or a stopping criterion is met.
A wide range of problems can be solved using GP, including function approximation, symbolic regression, and even game play [75]. There are several strengths of GP, including its ability to find complex solutions that are difficult or impossible to discover manually, as well as its ability to handle high levels of uncertainty and noise in the data. It can, however, be computationally expensive and may have difficulty finding solutions in a reasonable amount of time for very complex problems.

3.4. Genetic Algorithm-Emotional Neural Network (GA-ENN)

The GA-ENN (Genetic Algorithm-Emotional Neural Network) method is a hybrid approach that combines Genetic Algorithms (GA) and Ensemble Neural Networks (ENN). It is primarily used for classification tasks in machine learning and data mining [76]. In the GA-ENN method, a Genetic Algorithm is employed to optimize the architecture and parameters of an Ensemble Neural Network. The Genetic Algorithm applies principles inspired by natural selection and genetic mechanisms, such as mutation, crossover, and selection, to iteratively evolve a population of potential neural network architectures [77].
Recently, Lotfi and Akbarzadeh [78] pioneered the development of a limbic-based Emotional Neural Network (ENN). This novel network architecture draws inspiration from the emotional processes in the brain and is characterized by a single-layer design. In contrast to artificial neural networks (ANNs) that imitate biological neurons, ENNs are crafted to replicate the intricate interactions among four specific neural regions within the emotional brain: the thalamus, sensory cortex, orbitofrontal cortex (OFC), and amygdala.
During each iteration of the Genetic Algorithm, a set of candidate neural network architectures is evaluated based on their fitness, which is typically defined by the classification accuracy on a validation set [79]. The fittest architectures are selected to undergo genetic operators like crossover and mutation, which create new offspring architectures with modified characteristics [80]. Once the genetic evolution process is complete, an ensemble of neural networks is constructed by training each candidate architecture on the training dataset. The ensemble combines the predictions of multiple neural networks to make the final classification decision. This aggregation of predictions from diverse models often leads to improved generalization performance and robustness.
The GA-ENN method offers several advantages. Firstly, it leverages the optimization power of Genetic Algorithms to search for optimal neural network architectures in a vast solution space. This helps to identify architectures that can capture complex patterns in the data and improve classification accuracy. Secondly, by creating an ensemble of neural networks, it reduces the risk of overfitting and enhances the model’s ability to handle noise and variability in the data.

4. Results

4.1. Database Preparation

In the database, individual variables were measured in their respective units. Data normalization is employed to decrease network error and enhance network training speed. The normalization linear function utilized in this study is presented below.
X n o r m = X X m i n X m a x X m i n
This equation has four terms, Xmax, Xmin, X and Xnorm, which are the maximum, minimum, actual and normalized values, respectively.
In all mathematical models, the training and testing databases were randomly divided. A total of 80% of the main database was used for training, while the remaining 20% was used for testing.
Evaluating statistical parameters for both databases is crucial, as it directly impacts the final model’s accuracy. Based on Table 2 and Table 3, the training and testing databases exhibited similar statistical parameters, including minimum, maximum, mean, and standard deviation values.
The performance of a network can be evaluated through a variety of parameters such as coefficient of determination (R2) and mean absolute error (MAE). Equations (2)–(7) show the definitions of Mean Absolute Error (MAE), Mean Square Error (MSE), Root Mean Square Error (RMSE), Mean Squared Logarithmic Error (MSLE), Root Mean Squared Logarithmic Error (RMSLE), and Coefficient of Determination (R2) [81].
M A E = N X m X p N
M S E = N X m X p 2 N
R M S E = N X m X p 2 N
M S L E = N log ( X m + 1 ) log X p + 1 2 N
R M S L E = N log ( X m + 1 ) log X p + 1 2 N
R 2 = i = 1 N ( X m X m ¯ ) ( X p X p ¯ ) i = 1 N ( X m X m ¯ ) 2 i = 1 n ( X p X p ¯ ) 2 2
where N is the number of datasets, Xm and Xp are actual and predicted values, and X m ¯ and X p ¯ are the average of actual and predicted values, respectively. Ideally, the model should have an R2 value of 1 and a MAE, MSE, RMSE, MSLE, RMSLE value of 0.

4.2. Data-Driven Modeling Results

4.2.1. Multiple Linear Regression (MLR)

Table 4 presents the Pearson correlation matrix, showcasing the linear relationships between input and output parameters. This table assesses linear relationships between various parameters.
The Pearson correlation matrix is a statistical instrument employed to assess the linear connection between variable pairs within a dataset. It encompasses correlation coefficients, which gauge the magnitude and orientation of the linear link between these variables. These matrix elements span from −1 to 1, furnishing valuable insights into the interrelationship among variables. When the correlation coefficient is positive, it signifies a direct positive linear association between the two variables. In other words, as one variable increases, the other also tends to increase. The closer the coefficient approaches +1, the more robust the positive relationship. Conversely, when the correlation coefficient is negative, it indicates an inverse linear relationship between the two variables. In this scenario, as one variable increases, the other typically decreases. The closer the coefficient nears −1, the more pronounced the negative relationship. When the correlation coefficient stands precisely at zero, it denotes the absence of a linear relationship between the variables. Changes in one variable do not provide predictive information about changes in the other.
The findings reveal that there are no input parameters that exhibit a strong linear relationship with the output parameter. The highest correlation value observed is 0.594.
The findings from Table 4 indicate that the MLR model is unlikely to yield strong predictions for the output parameter. However, the MLR model was thoroughly examined, and the best performing model was selected. Figure 5 illustrates the comparison between the predicted and actual values generated by the numerical model. Despite the efforts, the MLR model did not accurately predict the parameter qu, lacking sufficient precision in its predictions.
Furthermore, the results reveal that the suggested MLR model performed better in predicting lower qu values compared to higher qu values. This observation suggests that, in cases of lower qu, the relationship between inputs and output parameters tends to exhibit closer adherence to linear behavior.
Table 5 summarizes the overall performance of the best multiple linear regression (MLR) model in predicting the ultimate bearing capacity of shallow foundations for both the training and testing databases. Various performance metrics are employed to assess the accuracy and precision of the model’s predictions. In the training database, the model exhibits an average Mean Absolute Error (MAE) of 33.938 kPa, indicating the average absolute difference between the predicted and actual values. The Mean Squared Error (MSE) is 2189.854, representing the average squared difference between predictions and actual values. The Root Mean Squared Error (RMSE) is 46.796, which indicates the average magnitude of the error. The MSLE (Mean Squared Logarithmic Error) is 0.063, and the RMSLE (Root Mean Squared Logarithmic Error) is 0.252, showcasing the model’s performance in handling logarithmic differences. The R2 value, a measure of how well the model fits the data, is 0.809 for the training dataset, indicating a reasonably good fit.
Similarly, in the testing database, the model performs well with an MAE of 32.260 kPa, MSE of 2026.062, and RMSE of 45.012. The MSLE is 0.116, and RMSLE is 0.341. The R2 value for the testing database is 0.837, suggesting a good fit. Overall, the table demonstrates that the MLR model provides reasonably accurate predictions for the ultimate bearing capacity of shallow foundations in both the training and testing databases. While some discrepancies exist, the model generally performs well in capturing the relationships between the input variables and the target output. Although the linear model exhibits relative accuracy, the performance of the frame model continues to improve.

4.2.2. Genetic Programming (GP)

Upon applying Multiple Linear Regression (MLR) as the statistical model, a grey box AI model called Genetic Programming (GP) was utilized to forecast the bearing capacity of shallow foundations (qu). Through a thorough analysis of various GP models, the most optimal model was identified. As depicted in Figure 6, the outcomes of the best GP model show a favorable alignment between actual and predicted values. These results demonstrate the remarkable accuracy of the GP model in forecasting qu (bearing capacity) values.
Table 6 provides a comprehensive assessment of the best GP model’s overall performance in predicting the ultimate bearing capacity of shallow foundations. The evaluation was conducted on both the training and testing databases, employing various performance metrics. In the training database, the GP model demonstrated a reasonable performance with a Mean Absolute Error (MAE) of 19.677 kPa, indicating that, on average, the model’s predictions were within approximately 19.677 units of the actual values. The model’s predictions showed a relatively good variance from the actual values, as reflected in the Mean Squared Error (MSE) of 700.751 and the Root Mean Squared Error (RMSE) of 26.472. Additionally, the model exhibited remarkable accuracy in dealing with both small and large errors, as evidenced from the low Mean Squared Logarithmic Error (MSLE) of 0.018 and the Root Mean Squared Logarithmic Error (RMSLE) of 0.136. Moreover, the GP model displayed a strong overall fit to the training data, as indicated by the high R-squared (R2) value of 0.939, which signifies the model’s capability to explain a substantial portion of the variance in the training data.
On the testing database, the GP model demonstrated even better predictive performance, as evidenced by the reduced MAE of 16.164 kPa compared to the training database. The model’s predictions exhibited decreased variability from the actual values, with MSE and RMSE values of 313.386 and 17.703, respectively. The GP model’s adeptness in handling errors was consistent, as indicated by the low MSLE of 0.012 and RMSLE of 0.111. Furthermore, the high R2 value of 0.975 in the testing database showcases the model’s robustness in explaining the variance in unseen data, reaffirming its strong predictive ability. Overall, the results in Table 6 underscore the GP model’s efficacy in accurately estimating the ultimate bearing capacity of shallow foundations, making it a valuable tool for practical applications in foundation engineering and design.
An important distinction between genetic programming (GP) and black box models lies in the GP model’s ability as a grey box model to produce an equation as its outcome, which can be directly utilized by the reader. In this study, Equation (8) represents the GP model’s output for predicting the bearing capacity of shallow foundations (qu) values. The length of Equation (8) can be attributed to its incorporation of five distinct inputs: width of footing (B), depth of footing (D), footing geometry (L/B), unit weight of sand (γd or γ′), and internal friction angle (ϕ). Notably, conventional methods lack the capability to generate an equation like Equation (8), considering all five influential inputs. Thus, this study marks the first successful attempt to formulate an equation that predicts qu based on these five crucial inputs. It is essential to mention that the parameters in Equation (8) are normalized values, and readers should normalize their input values based on Table 1 before applying them to Equation (8) for accurate predictions.
q u = R 1 3 + R 2 B 3 × L / B 2 × B × ϕ × ϕ + L / B + D × ( R 3 + B ) + R 3 D × R 1 × D + ϕ × B × ϕ R 1 + R 2 + D R 1
where R1, R2, R3 are constant values, equal to 0.15, 0,48 and 0.50, respectively.

4.2.3. Classification and Regression Trees (CART)

After utilizing GP as a grey box AI model for predicting the bearing capacity of shallow foundations, this discussion was further extended to include another grey box AI model, namely Classification and Regression Trees (CART), to complete this group of grey box models. Following a comprehensive evaluation of multiple CART models, the most optimal model was identified. Figure 7 illustrates the results obtained from the best CART model, showcasing a remarkable agreement between the actual and predicted values. These findings highlight the CART model’s exceptional accuracy and precision in forecasting bearing capacity of shallow foundations (qu) values. The incorporation of both GP and CART models provides valuable insights into the predictive capabilities of grey box AI techniques for estimating bearing capacity, enabling more reliable and informed decision making in foundation engineering applications.
Table 7 provides a comprehensive assessment of the overall performance of the best Classification and Regression Trees (CART) model in predicting the ultimate bearing capacity of shallow foundations. The evaluation was conducted on both the training and testing datasets, utilizing various metrics to gauge the model’s predictive accuracy. In the training dataset, the CART model displayed a Mean Absolute Error (MAE) of 18.388 kPa, indicating that, on average, its predictions deviated by approximately 18.388 units from the actual values. The model achieved a high R-squared (R2) value of 0.951, signifying its ability to explain a significant portion of the variance in the training data, thereby affirming its robust fit to the dataset. Additionally, the CART model demonstrated precise handling of errors, evidenced from the low Mean Squared Logarithmic Error (MSLE) of 0.017 and the Root Mean Squared Logarithmic Error (RMSLE) of 0.129.
In the testing dataset, the CART model exhibited a slightly higher MAE of 23.583 kPa, indicating a slightly lower predictive accuracy on unseen data compared to the training dataset. Nevertheless, the model’s predictive ability extended well to the testing data, as evidenced from the high R2 value of 0.921, suggesting its effectiveness in explaining the variance in the testing dataset. Although the MSE and RMSE values of 981.006 and 31.321, respectively, were higher in the testing dataset, the model still maintained good performance, as indicated by the relatively low MSLE of 0.031 and RMSLE of 0.177. Overall, the results in Table 7 validate the reliability of the best CART model in predicting the bearing capacity of shallow foundations and underscore its potential as a valuable tool for practical applications in foundation engineering, enabling more accurate and informed decision making.
The output of the CART model is presented as a decision tree, which effectively captures and represents the data intervals described in Figure 8. This decision tree serves as a graphical representation of the model’s decision-making process. It illustrates a sequence of decisions made by the model to ultimately arrive at its prediction.
To utilize the decision tree, the estimation process commences at the initial node and follows the branches to subsequent nodes, adhering to the rules written on the leaves (see Figure 8 for reference). This sequential process continues until the final node is reached, which corresponds to the model’s ultimate prediction. The decision tree offers a straightforward and interpretable way to understand how the model analyzes the input data and makes informed predictions based on specific conditions and thresholds. It is important to notice that Figure 8 is based on the normalized values.
Table 8 and Table 9 offer a comprehensive description of the CART (Classification and Regression Trees) model, providing valuable insights into its structure and predictive capabilities. Table 8 presents an overview of the CART’s architecture, encompassing details such as the number of terminal nodes, split variables, values for each node, parent and son nodes, and the corresponding predicted values. On the other hand, Table 9 delves deeper into CART’s intricacies, presenting the specific rules and predicted values for each terminal node.
By referring to these tables, readers can gain a better understanding of the influential variables and their relationships with the target variable. The CART model assists in identifying critical decision points and the potential outcomes associated with each decision, facilitating improved model accuracy and enhanced predictions. Utilizing the insights from CART can contribute to better decision making in various domains, such as foundation engineering or other fields where predictive modeling is applicable. These tables serve as valuable references, empowering readers to explore the model’s inner workings and leverage its interpretability for informed and accurate predictions.

4.2.4. Genetic Algorithm-Emotional Neural Network GA-ENN

In the context of this research, a hybrid approach referred to as GA-ENN was employed to predict the ultimate bearing capacity of sallow foundation. Through an array of analyses, the researchers pinpointed the optimal GA-ENN model, which is presented and described in detail. Figure 9 illustrates the comparison between the predicted and real values of the ultimate bearing capacity for the shallow foundation. The findings demonstrate the high effectiveness of this hybrid approach in accurately predicting the output.
Table 10 presents a comprehensive evaluation of the overall performance of the best Genetic Algorithm-Emotional Neural Network (GA-ENN) model for predicting the ultimate bearing capacity of shallow foundations. The assessment was conducted on both the training and testing datasets, utilizing various performance metrics to gauge the model’s predictive accuracy.
In the training dataset, the GA-ENN model achieved a Mean Absolute Error (MAE) of 6.634, indicating that, on average, its predictions deviated by approximately 6.634 units from the actual values. The Mean Squared Error (MSE) and Root Mean Squared Error (RMSE) values of 72.503 and 8.515, respectively, signify that the model’s predictions displayed relatively low variance from the actual values, indicating its precision in capturing the underlying patterns in the training data. The Mean Squared Logarithmic Error (MSLE) of 0.004 and the Root Mean Squared Logarithmic Error (RMSLE) of 0.061 further confirm the model’s accurate handling of both small and large errors. Moreover, the high R-squared (R2) value of 0.994 indicates that the GA-ENN model explains an impressive 99.4% of the variance in the training data, showcasing its robust fit to the dataset.
In the testing dataset, the GA-ENN model performed exceptionally well, with a lower MAE of 6.018 compared to the training dataset, suggesting an even higher predictive accuracy on unseen data. The MSE and RMSE values of 65.397 and 8.087, respectively, reinforce the model’s efficacy in producing predictions with minimal variability in the testing data. The MSLE of 0.005 and RMSLE of 0.072 reflect the model’s consistent performance in handling errors on the testing data. Additionally, the high R2 value of 0.995 demonstrates the GA-ENN model’s robustness in explaining an impressive 99.5% of the variance in the testing data, emphasizing its ability to generalize well to new and unseen data.

5. Discussion

5.1. Comparison of Different Proposed Models

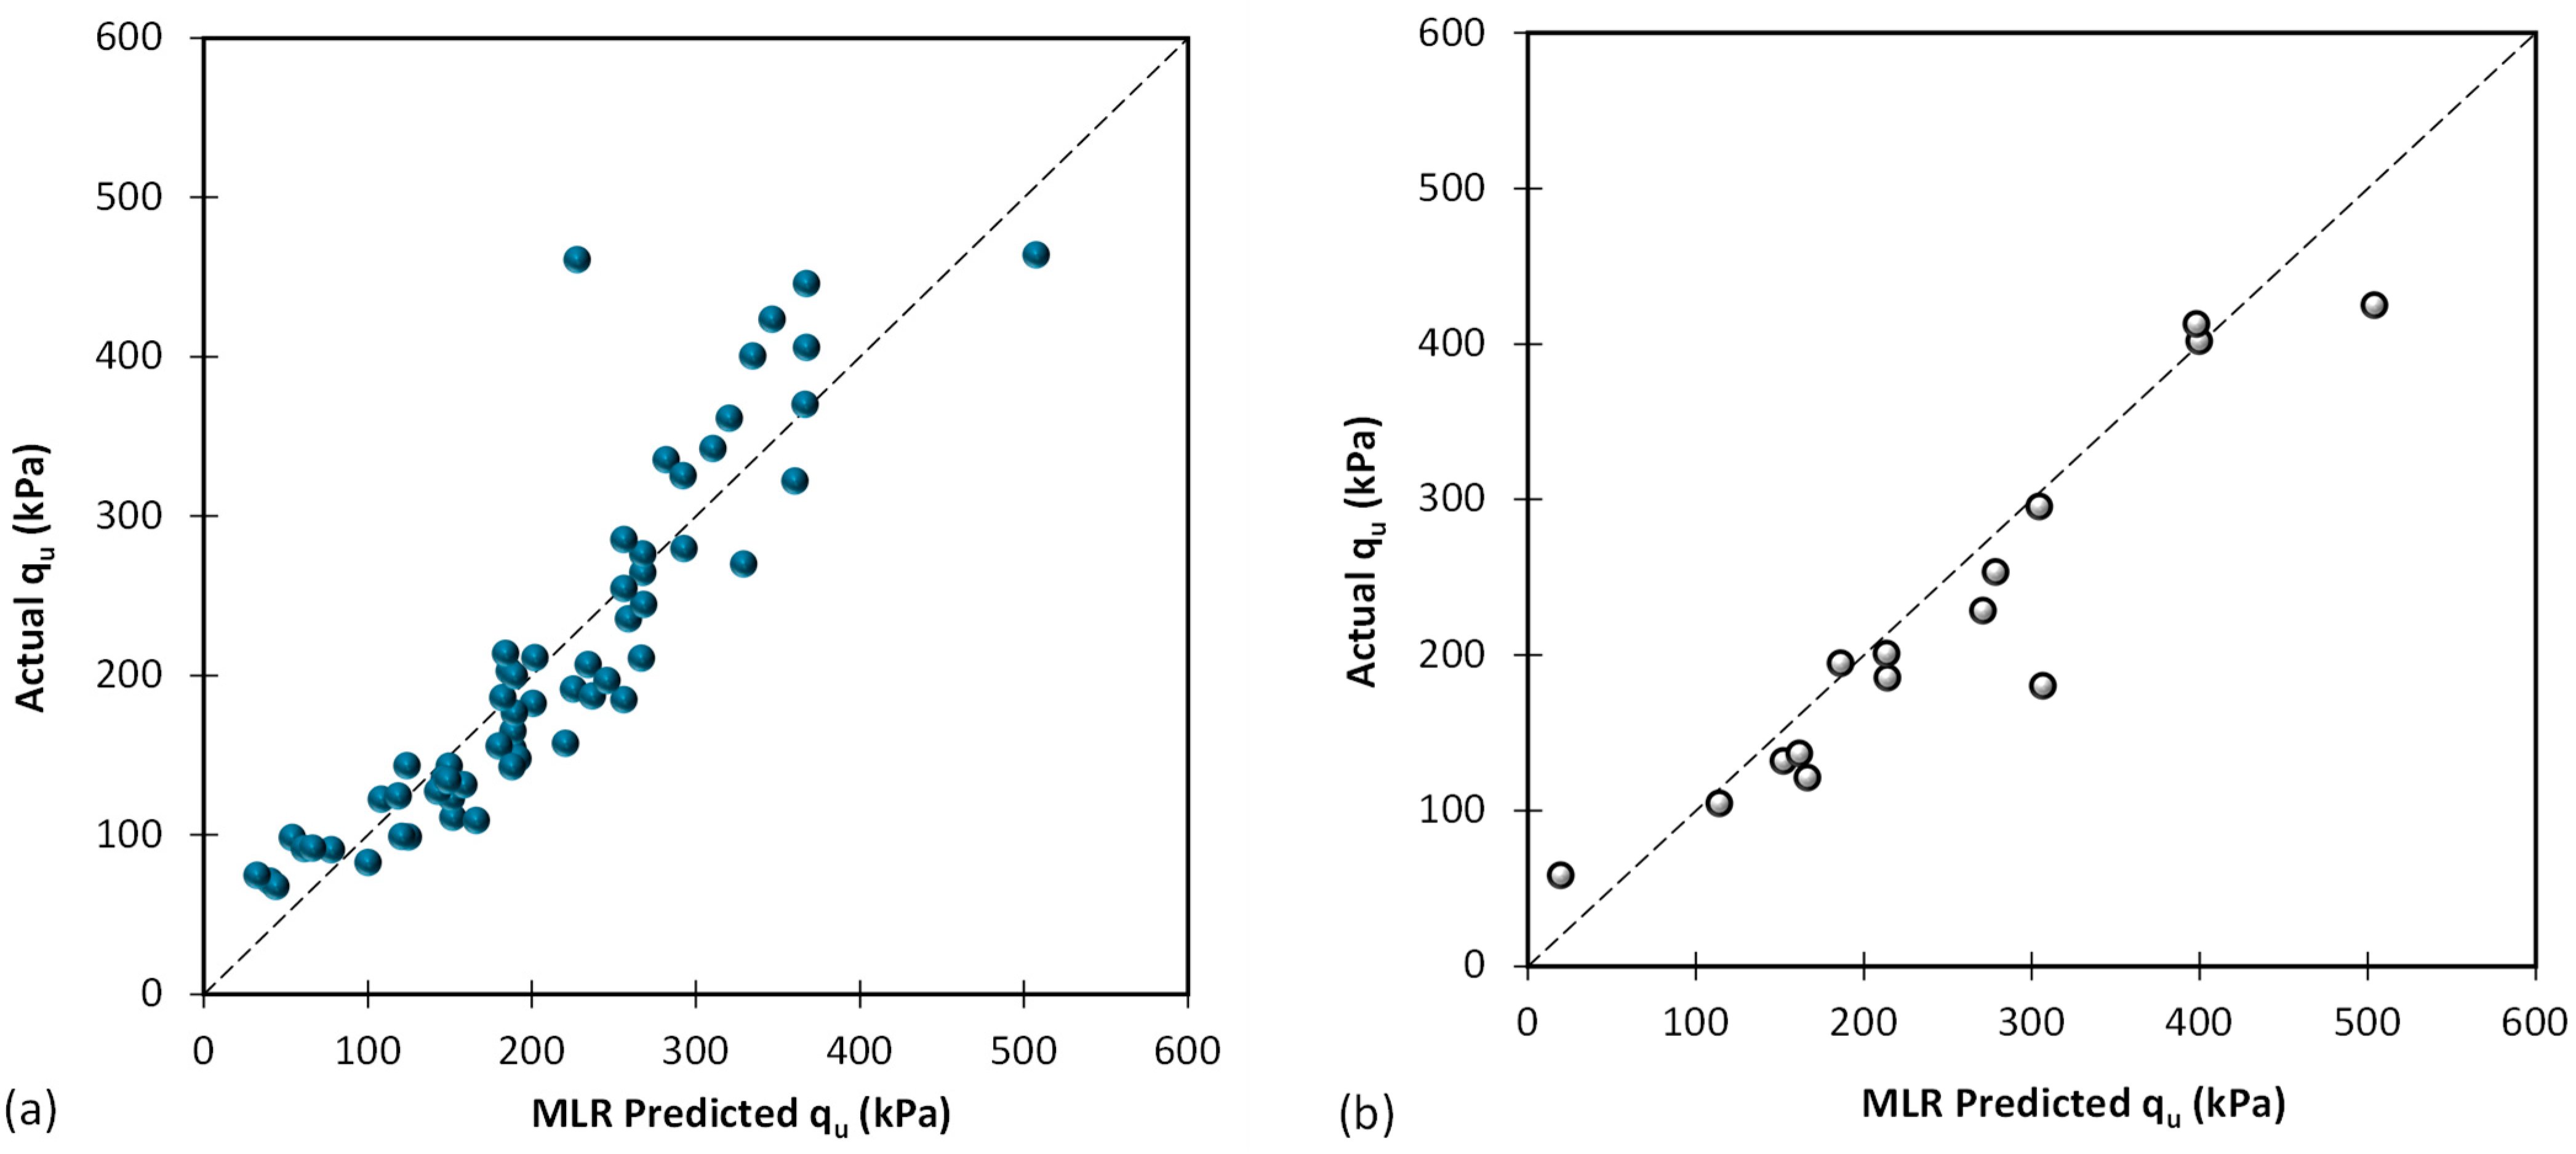
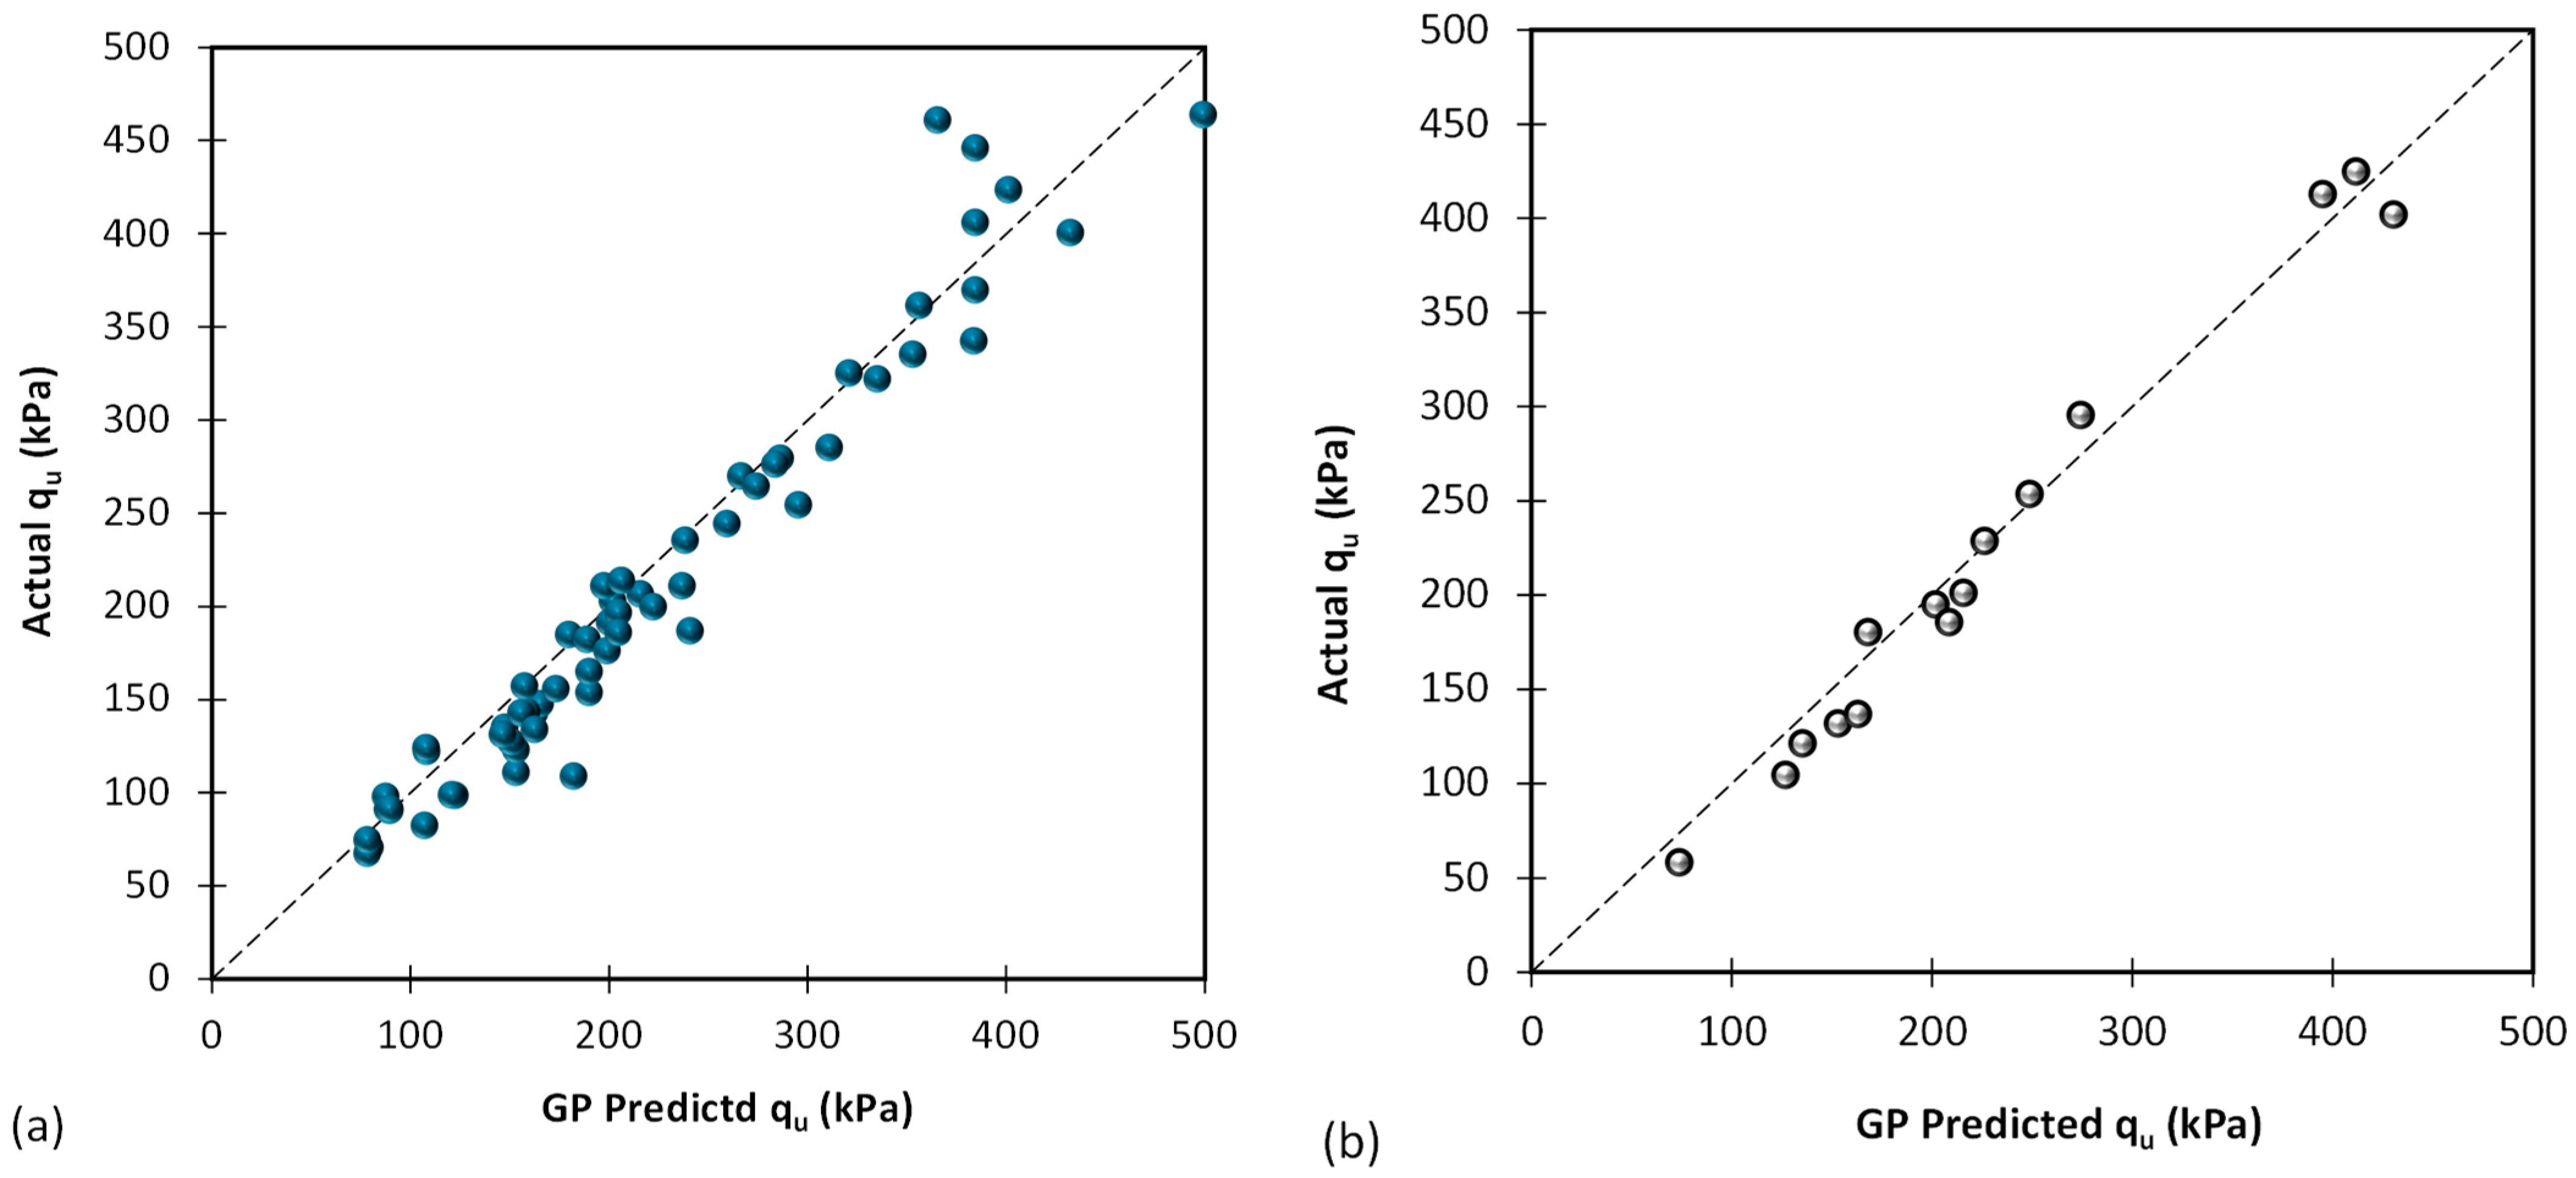
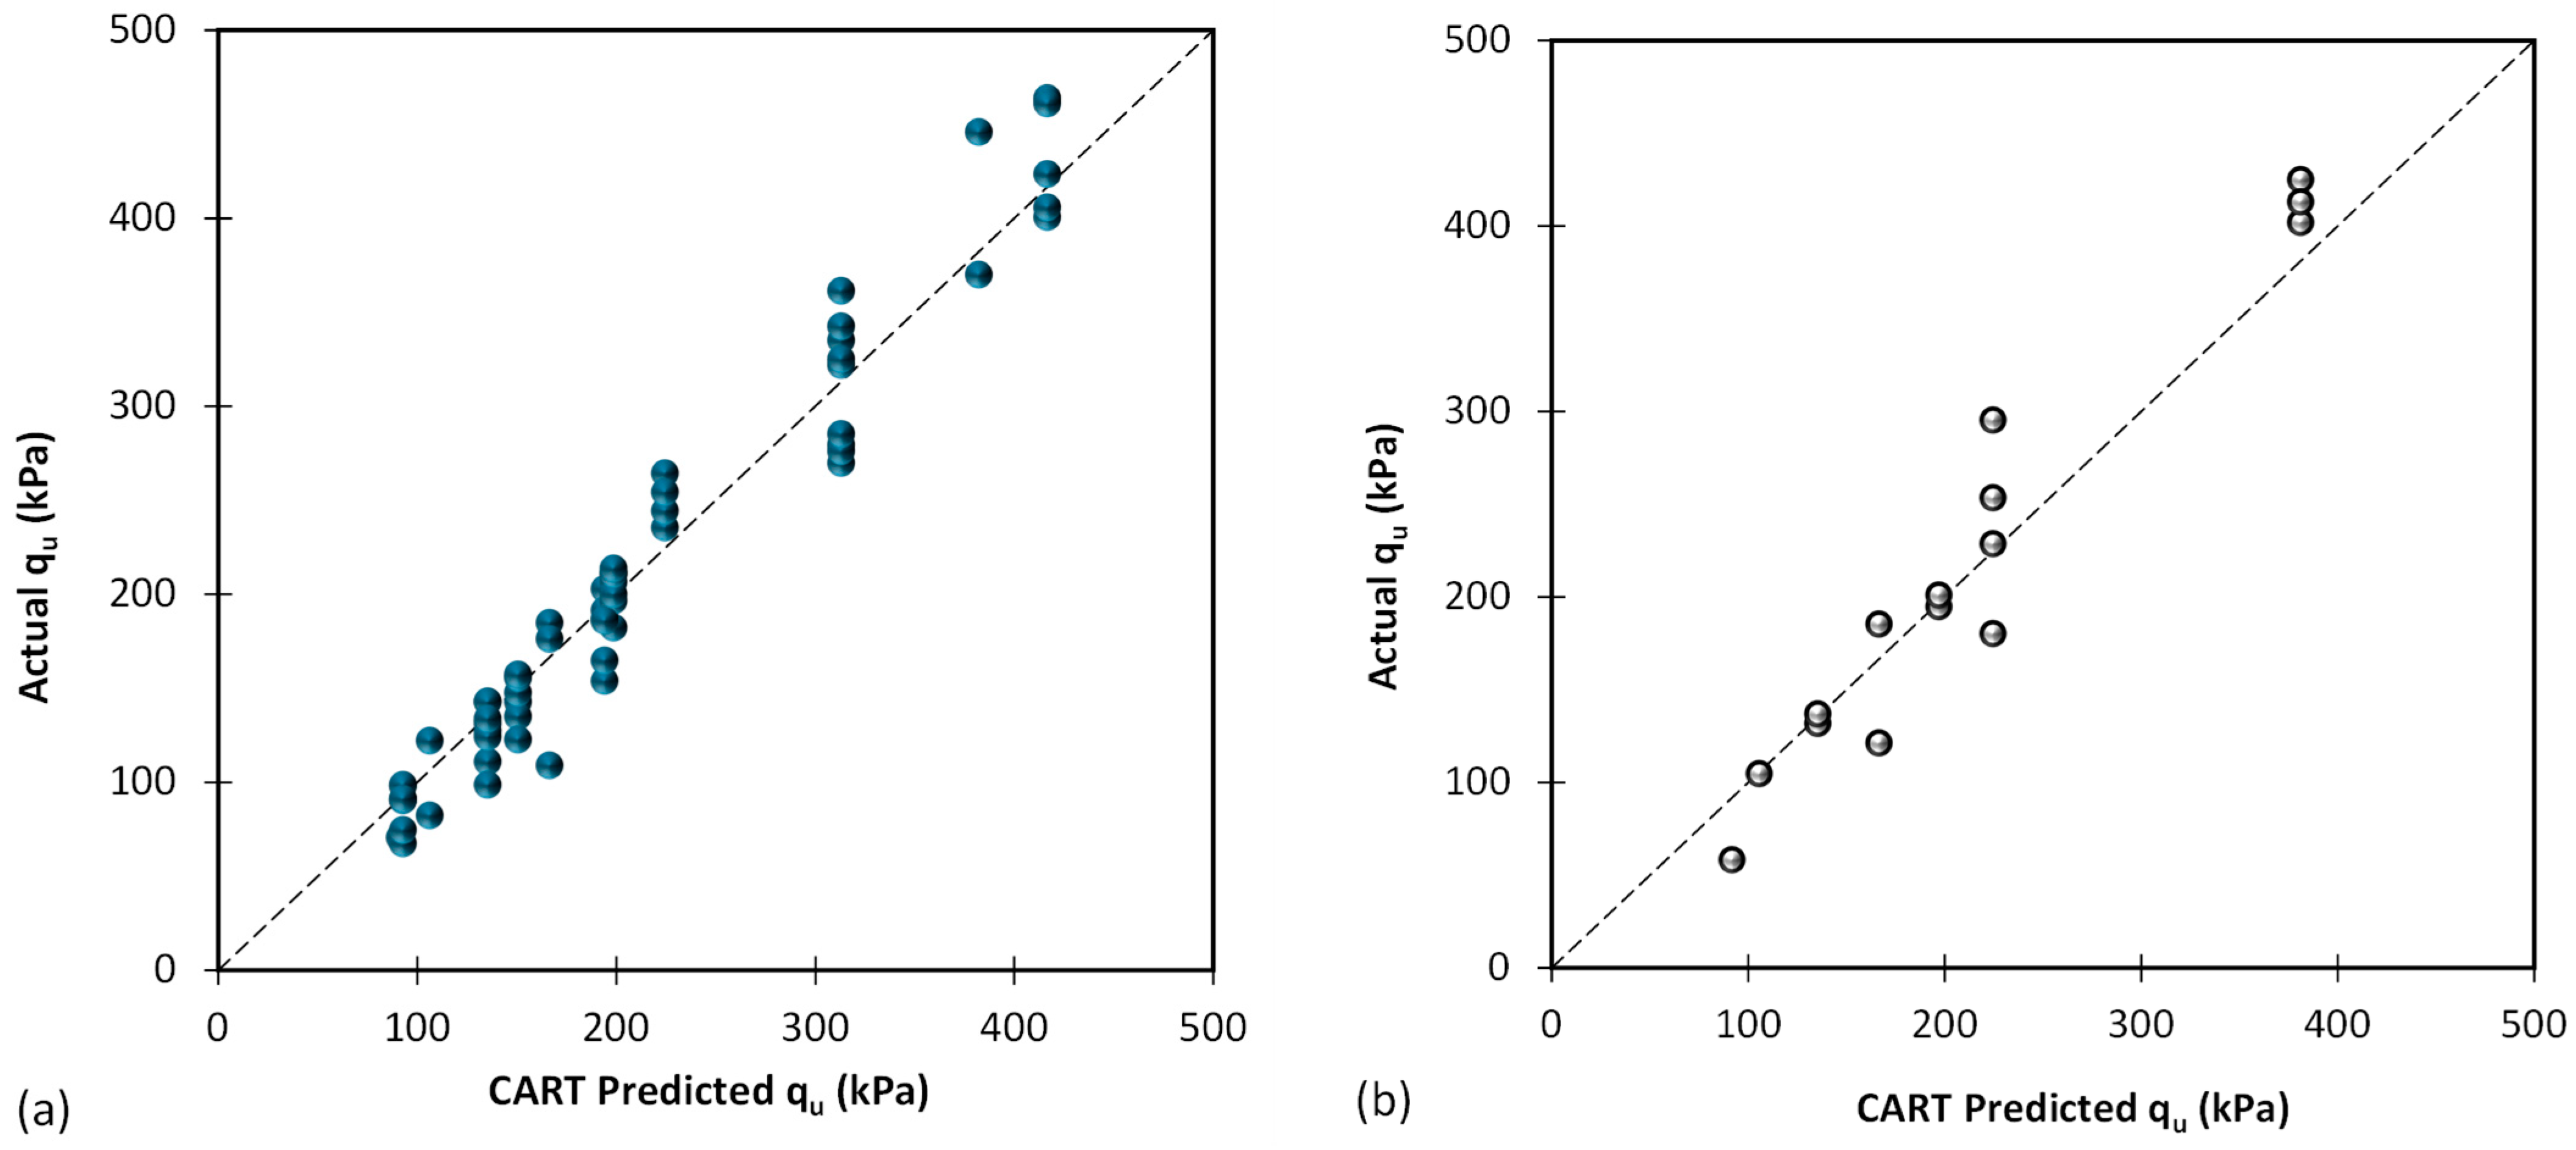
Table 11 provides a comprehensive comparison of the predictive performance of different models for estimating the ultimate bearing capacity of shallow foundations. The evaluation is conducted on both the training and testing databases, and various performance metrics are utilized to assess the accuracy and reliability of each model.
For the training database, the Mean Absolute Error (MAE) values range from 33.938 for the Multiple Linear Regression (MLR) model to an impressive 6.634 for the Genetic Algorithm-Emotional Neural Network (GA-ENN) model. This indicates that the GA-ENN model exhibits the lowest average absolute deviation between its predictions and the actual values, showcasing its superior accuracy in predicting the bearing capacity of shallow foundations during training. The Mean Squared Error (MSE) and Root Mean Squared Error (RMSE) also demonstrate the same trend, where the GA-ENN model outperforms all other models, yielding the smallest errors.
Similarly, in the testing dataset, the GA-ENN model attains the lowest MAE (6.018), MSE (65.397), and RMSE (8.087) values, indicating its remarkable predictive accuracy on unseen data. Additionally, the GA-ENN model shows the lowest Mean Squared Logarithmic Error (MSLE) and Root Mean Squared Logarithmic Error (RMSLE) values, indicating its ability to accurately predict both small and large errors on the testing data.
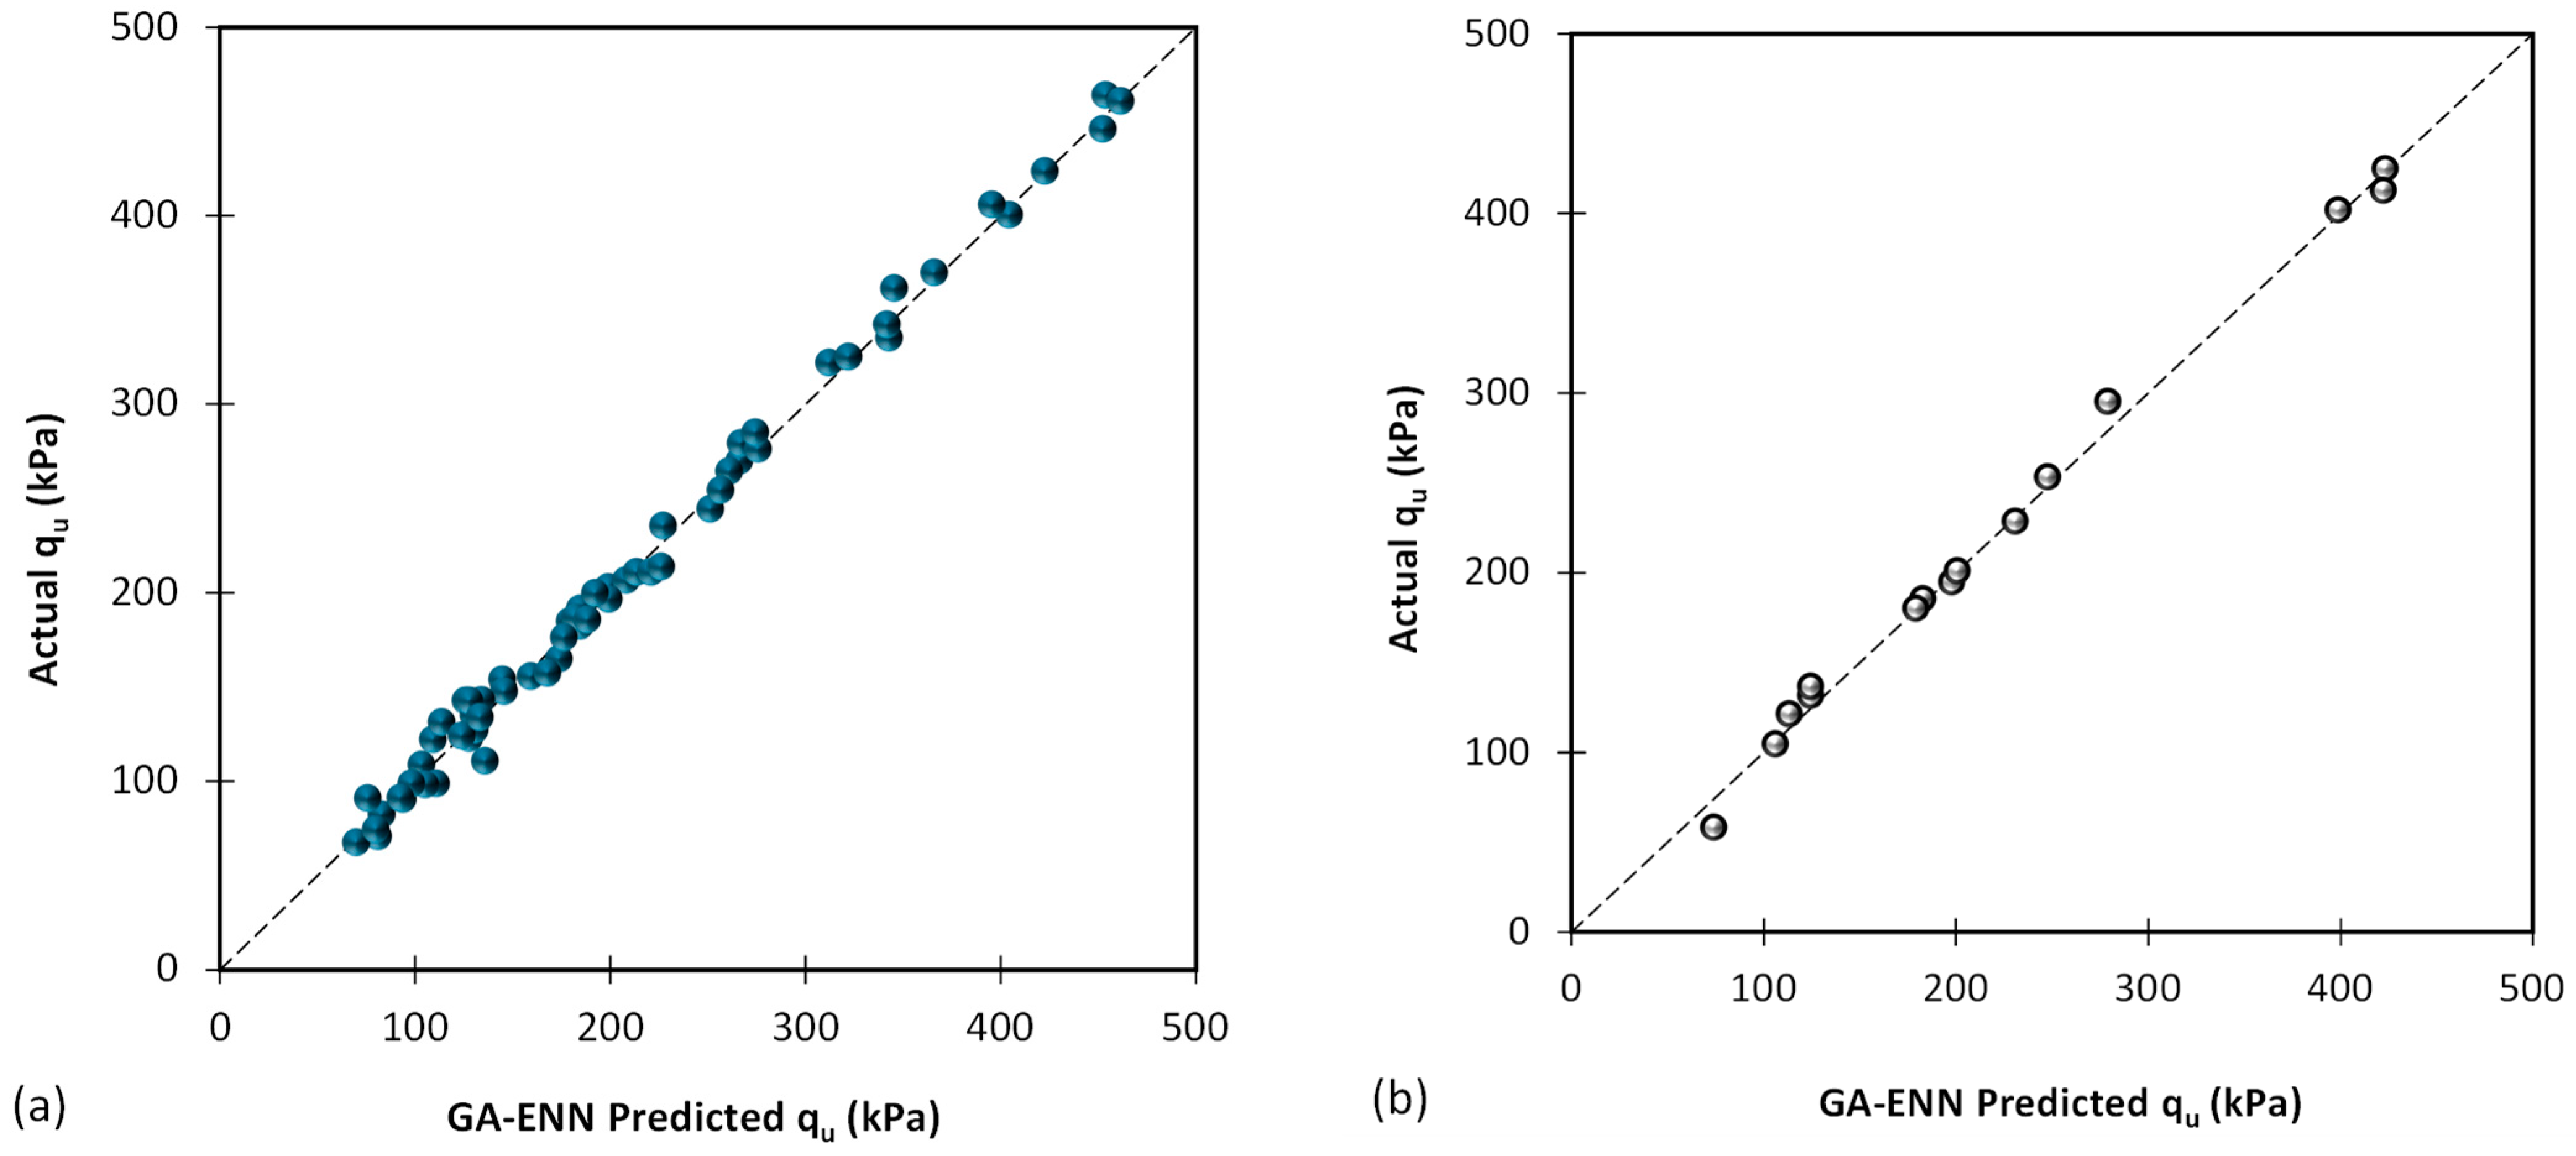
Furthermore, the coefficient of determination (R2) values for the GA-ENN model are the highest in both the training (0.994) and the testing (0.995) datasets, illustrating the model’s excellent fit to the data and its capability to explain a significant proportion of the variance in the target variable.
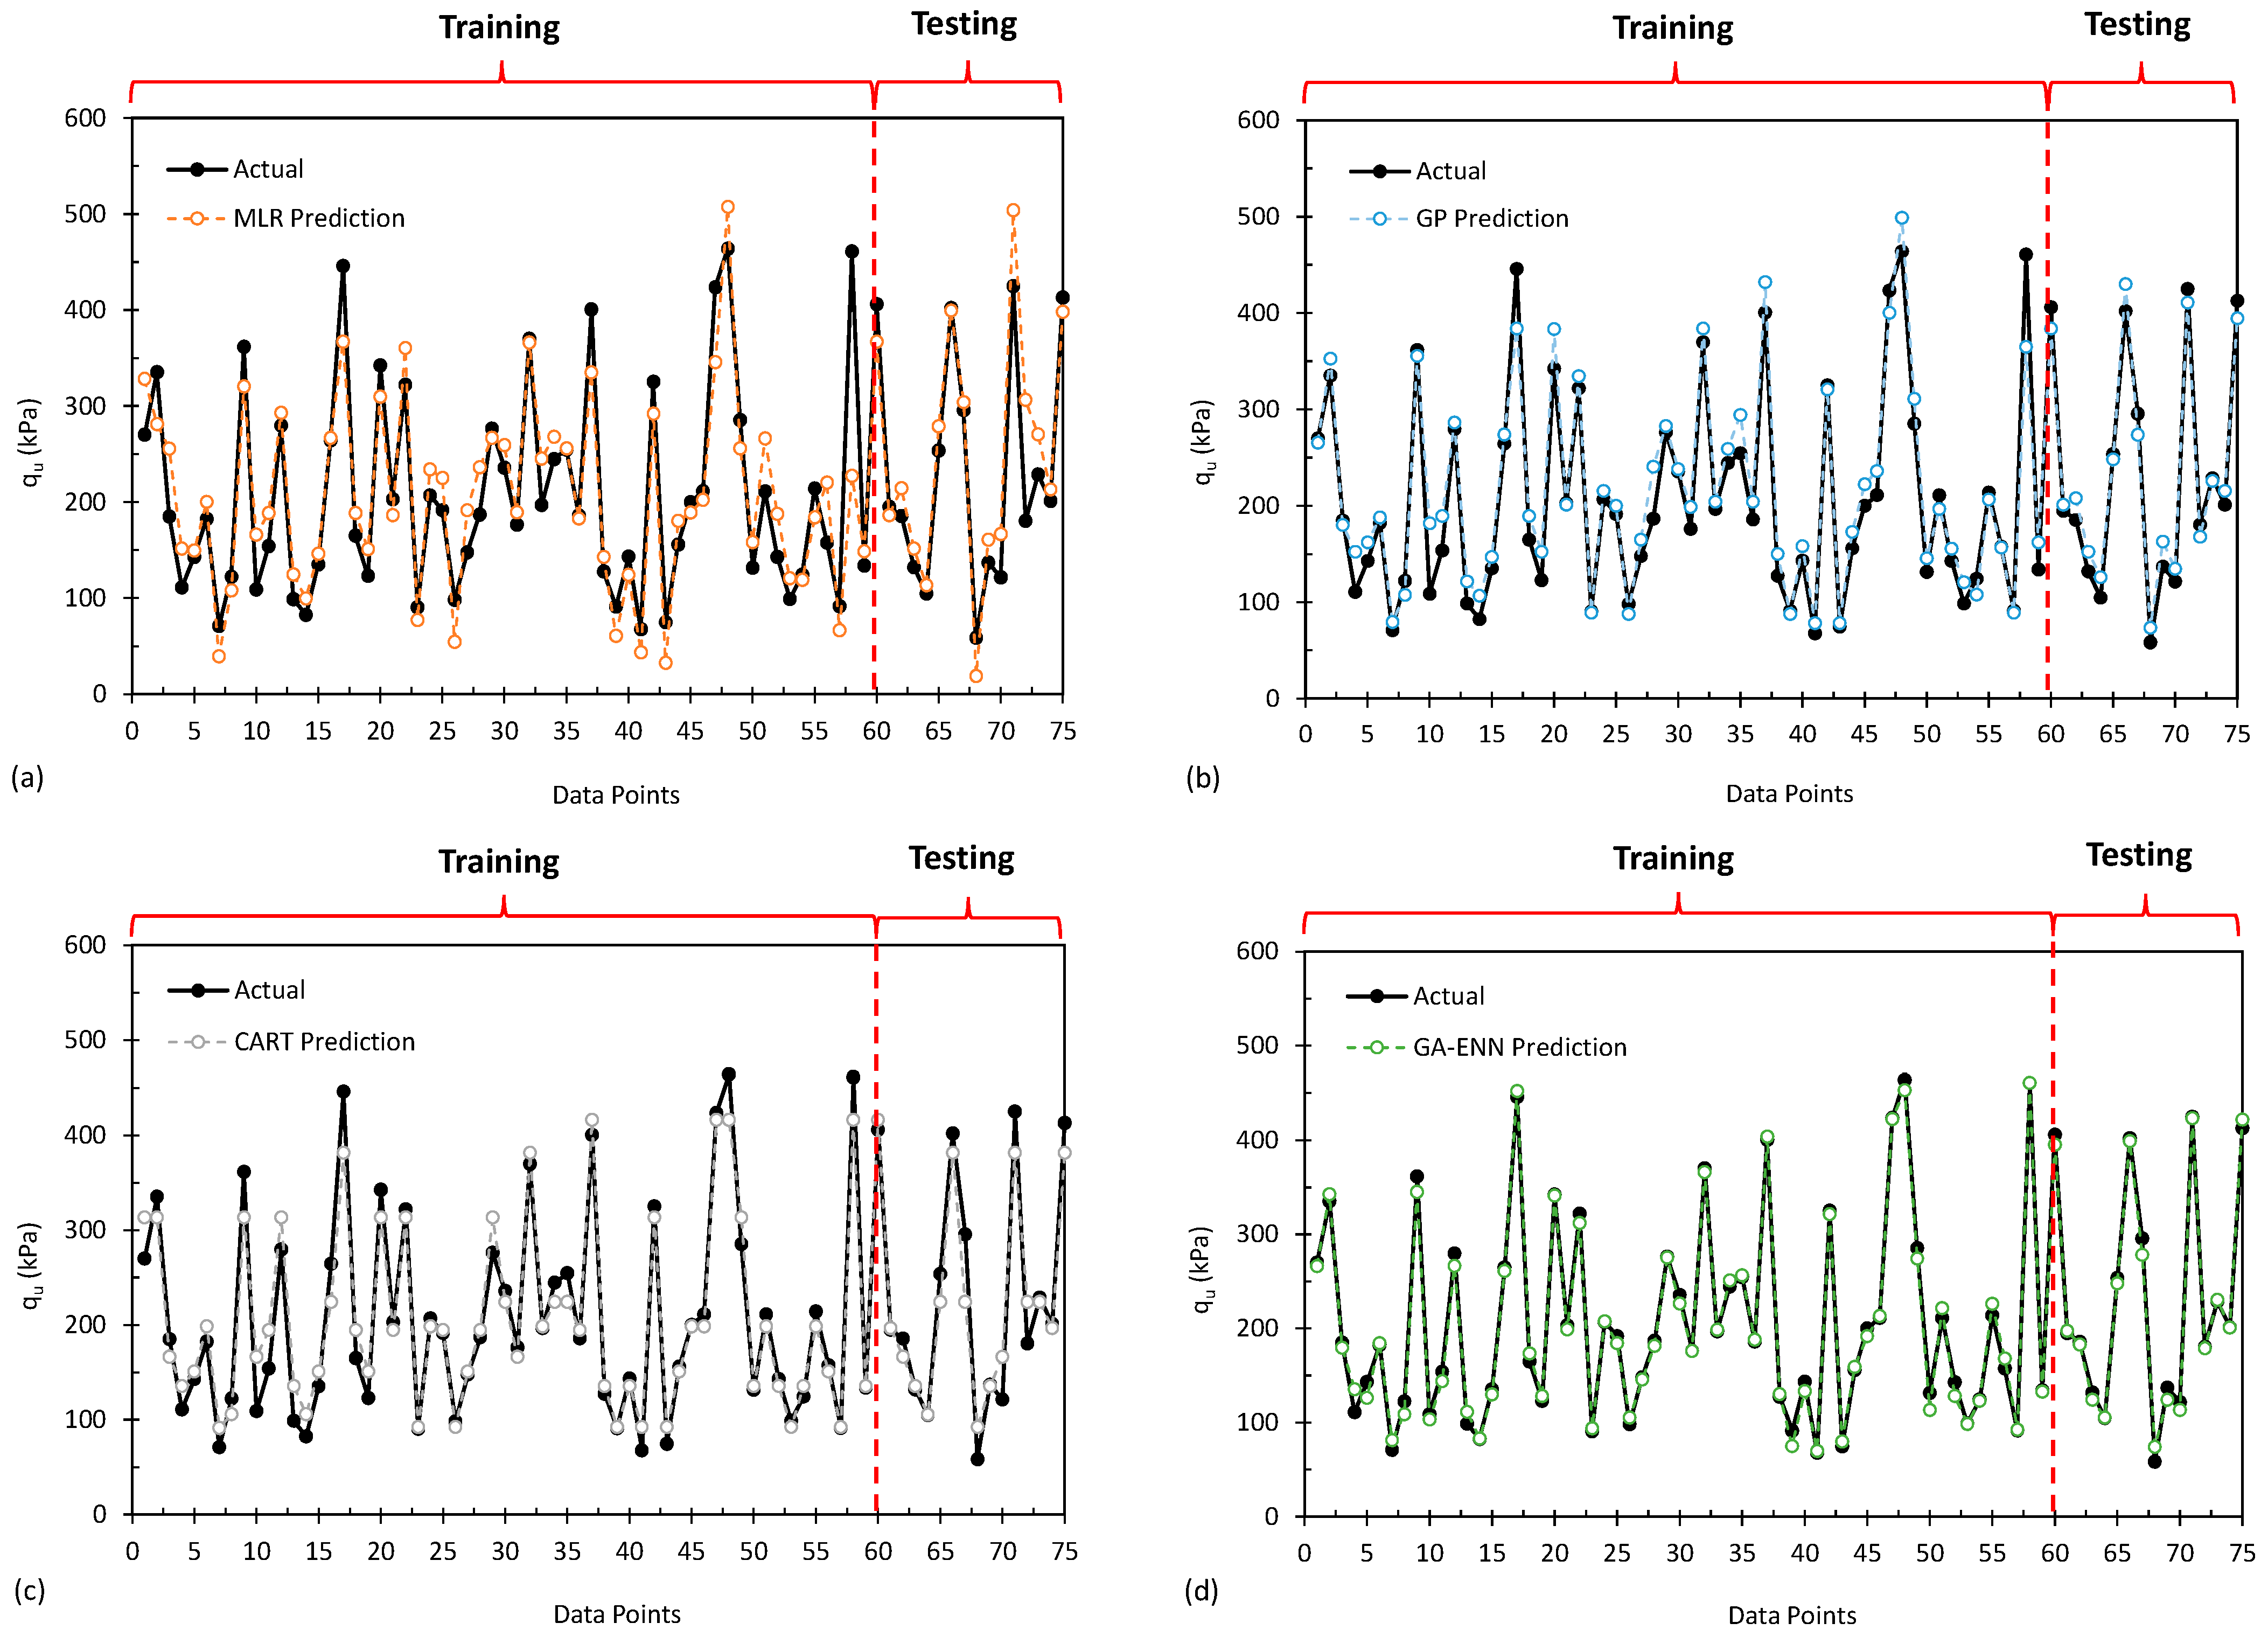
In Figure 10, the outcomes of various statistical and AI models for predicting the bearing capacity of shallow foundations are displayed. Among these models, it is evident that the Genetic Programming (GP), Classification and Regression Trees (CART), and Genetic Algorithm-Emotional Neural Network (GA-ENN) models have exhibited the most promising performance.

5.2. Comparison with Previous Studies

To delve deeper into the investigation, Table 12 displays the outcomes of this study alongside numerical models from the historical record, as well as the Gaussian Process Regression Approach introduced by Ahmad et al. [60]. To facilitate a more comprehensive comparison, an additional parameter referred to as Nash–Sutcliffe Efficiency (NSE), as defined in Equation (9), was employed alongside the R2. The findings clearly highlight the superiority of the suggested models in contrast to the pre-existing historical models.
N S E = 1 t = 1 T ( Q o t Q m t ) 2 t = 1 T ( Q o t Q ¯ o   ) 2
In the equations, T is the number of data points, and Q o t and Q m t are the actual and predicted output of ith sample of the data, respectively; Q ¯ o   is the averaged actual output of the data.

5.3. Sensitivity Analysis

In the domain of artificial intelligence methodologies, the evaluation of the importance of input parameters holds a pivotal role. This assessment follows a structured procedure: each individual input parameter is deliberately adjusted both upwards and downwards by 100%. Subsequently, the resulting discrepancies within the models are meticulously monitored. This thorough analysis functions as a mechanism for assessing the sensitivity of each model to specific parameters. Elevated error values indicate heightened model sensitivity to those distinct parameters, while lower error values suggest that the scrutinized parameter has a relatively modest impact on the overall model efficacy. This approach enables us to precisely identify the input parameters that wield substantial influence over the model’s outcomes, facilitating the refinement of the model for superior performance.
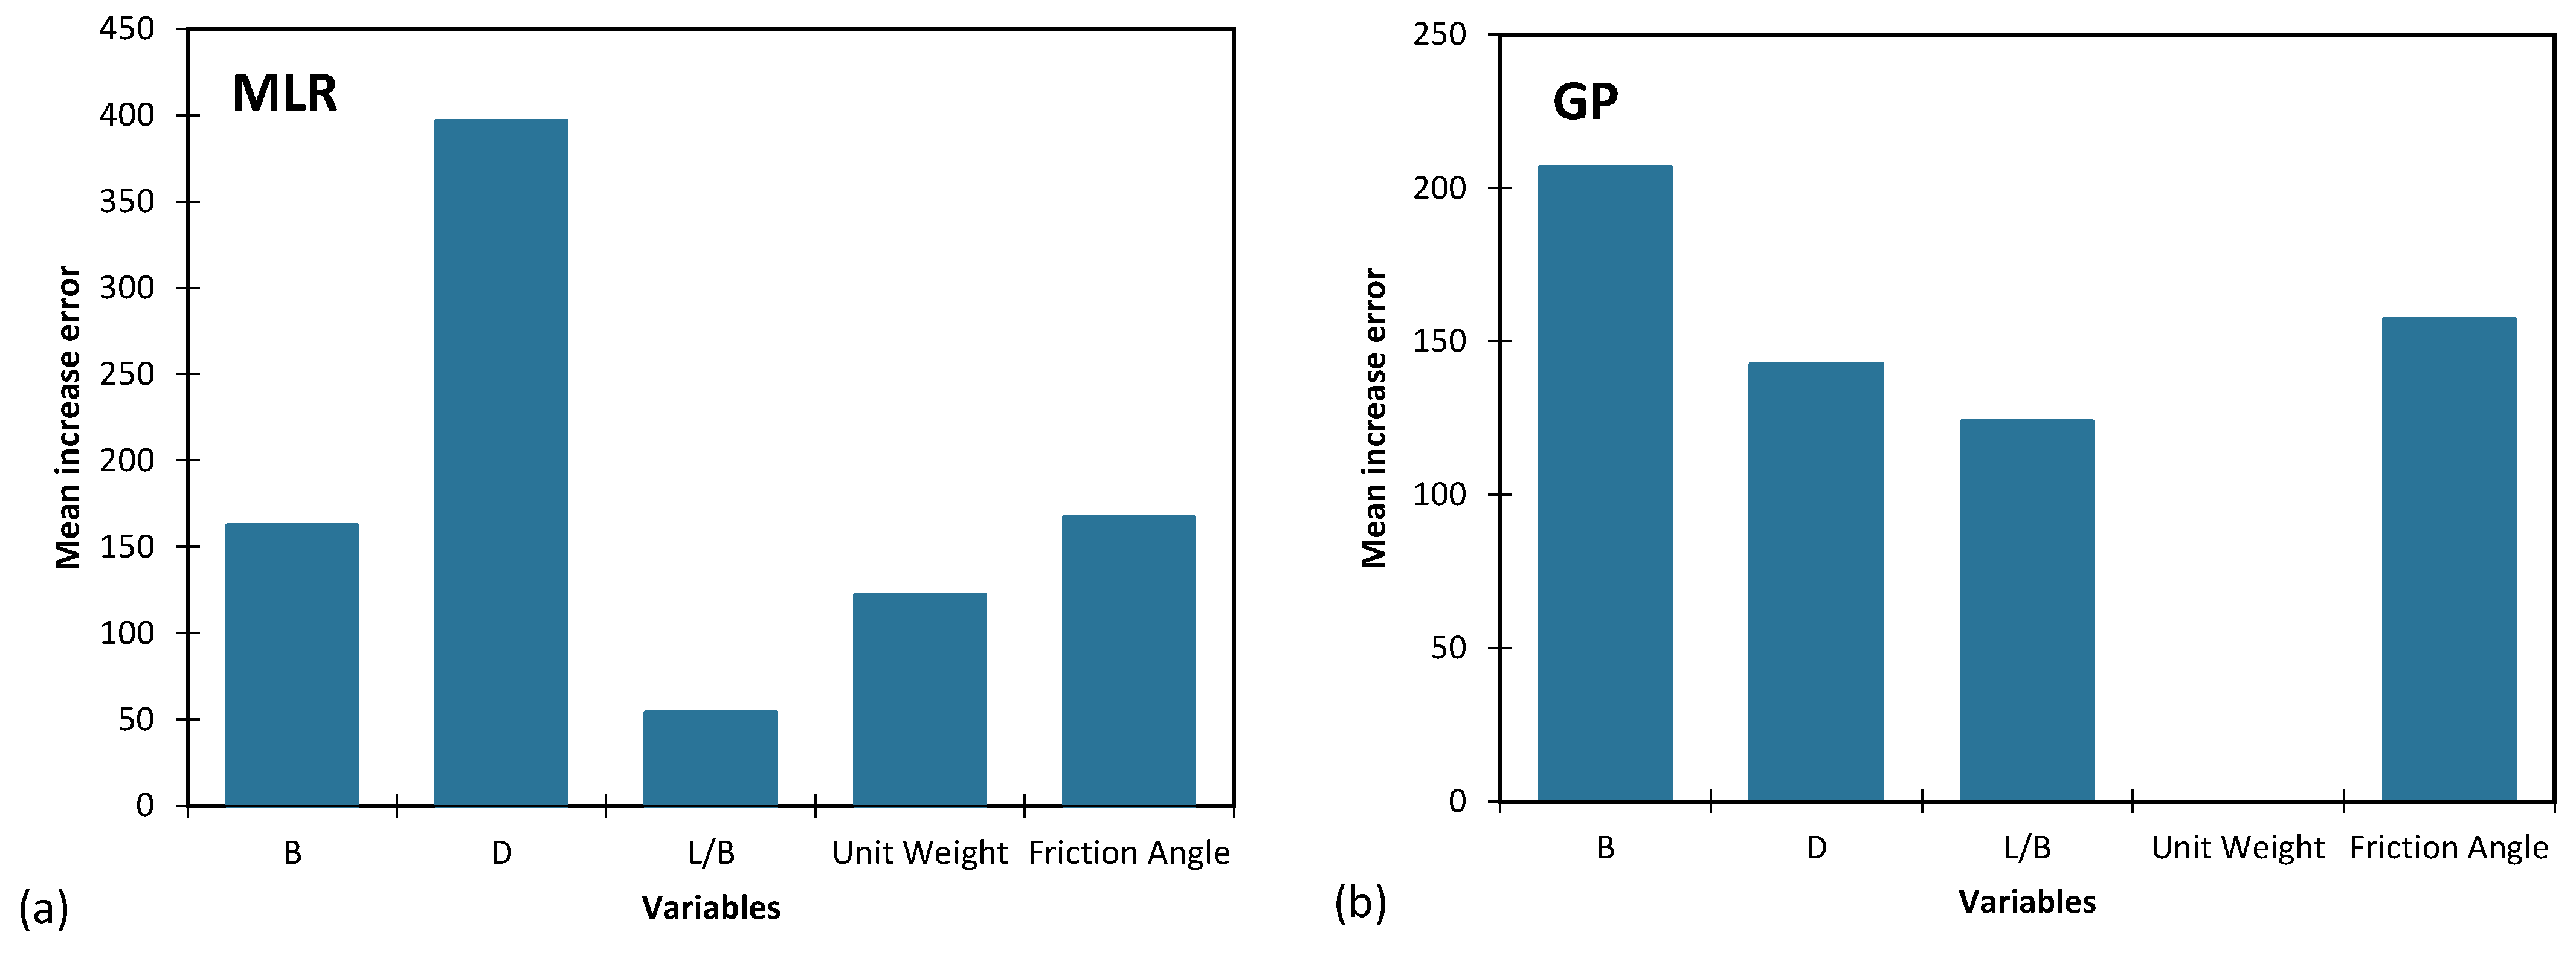
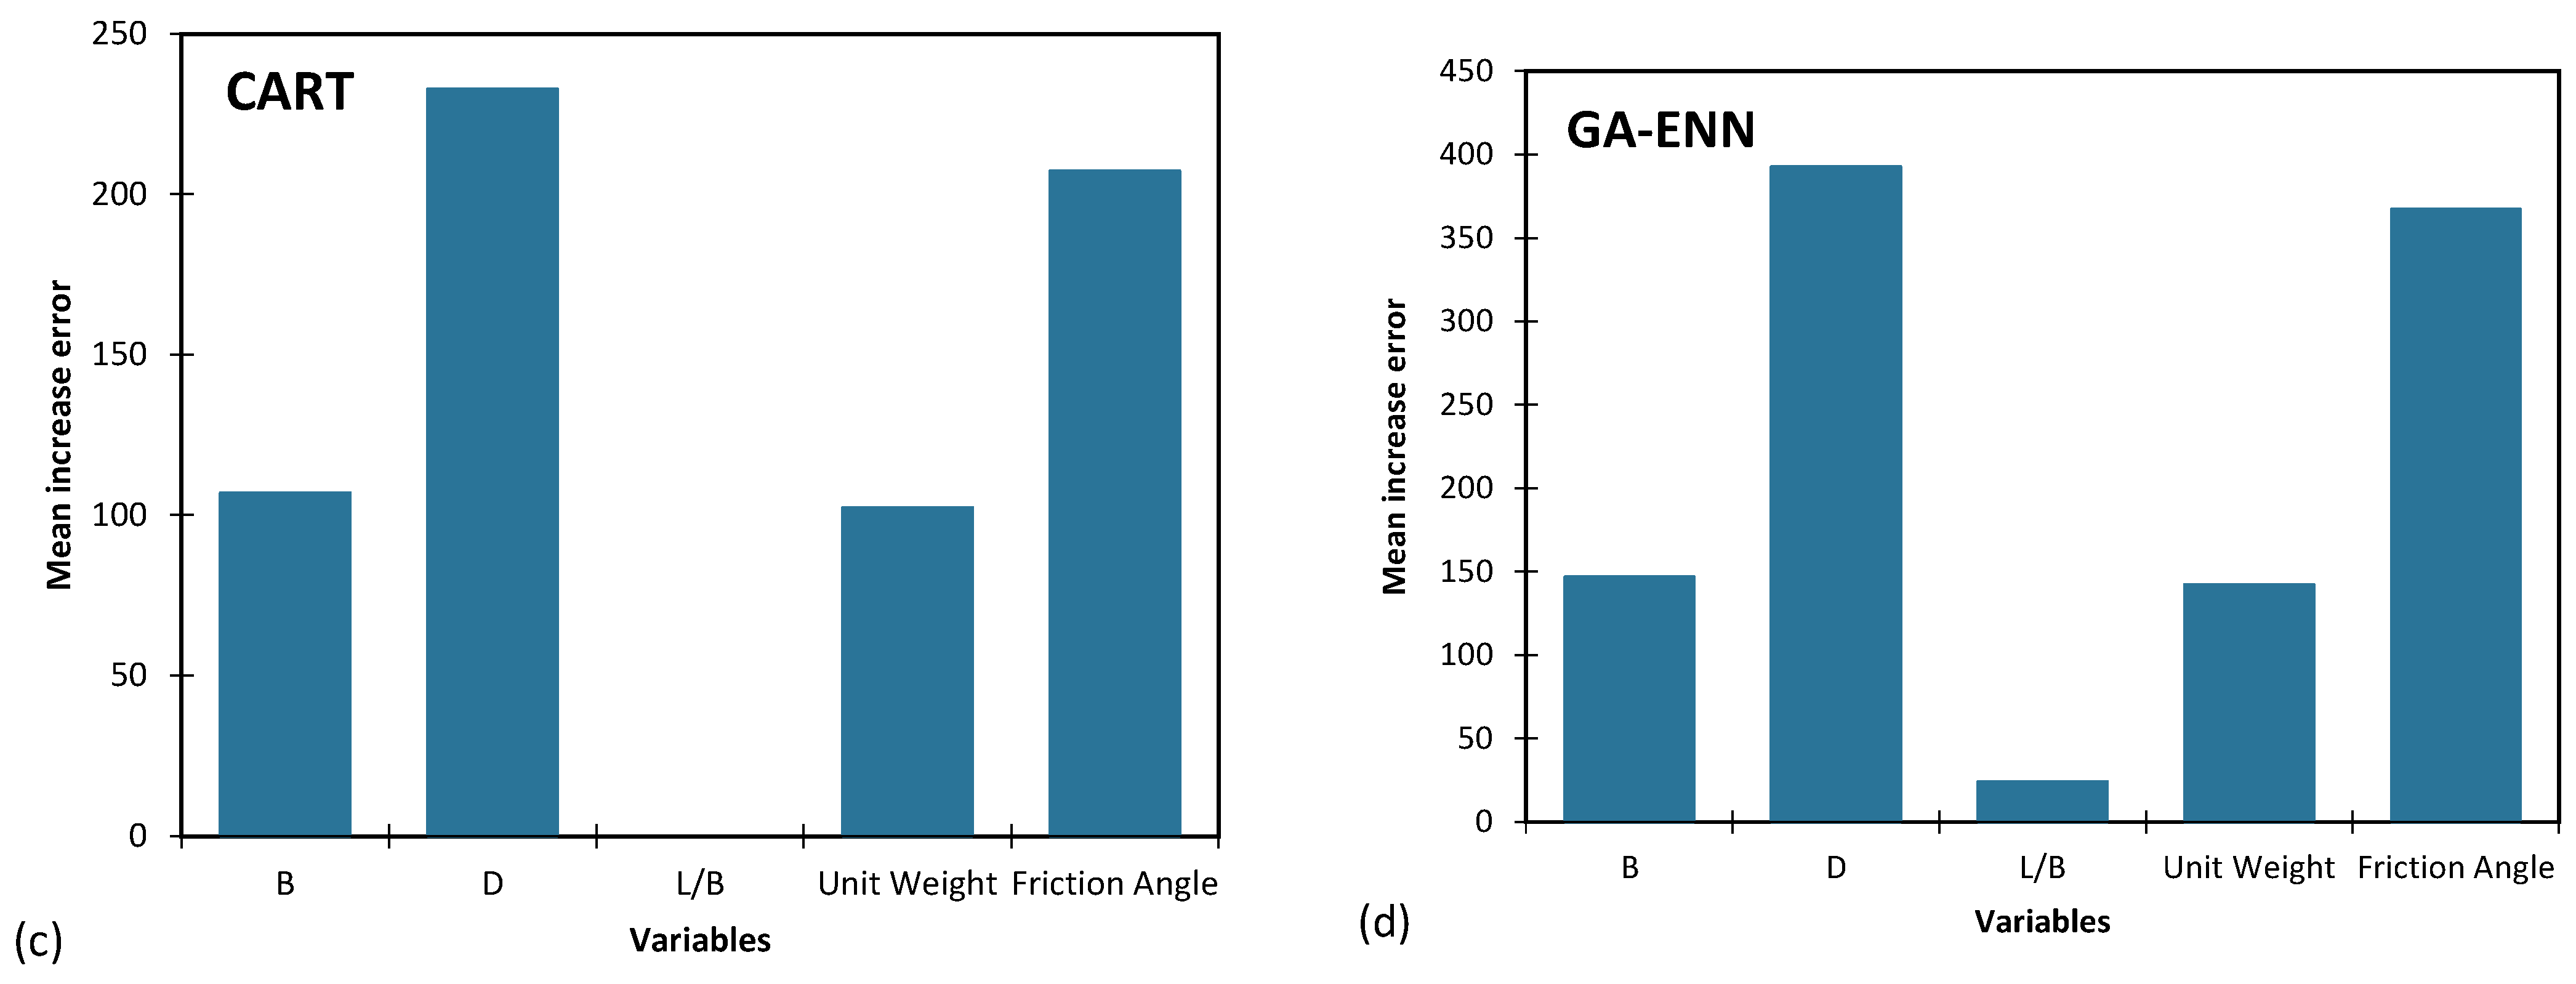
To visually illustrate this analysis of parameter significance across diverse models for predicting qu, Figure 11 is presented. These visuals provide valuable insights into the models’ responses to variations in various input parameters and aid in the identification of pivotal factors that shape the predictive proficiency of the models for each property.
Table 13 presents a hierarchy of input parameter importance across various models employed for the anticipation of qu. Within this ranking, a rank of 1 corresponds to the utmost importance, signifying the paramount parameter, while a rank of 5 designates the least significance.
Analyzing the outcomes of Table 13, it becomes evident that the parameters foundation depth, internal friction angle of soil and foundation width emerge as the most pivotal elements in predicting ultimate bearing capacity of shallow foundations (qu). These parameters are instrumental in determining the foundation’s ability to withstand load and stress distribution. Conversely, the parameters unit weight of soil (γd or γ′) and L/B exhibit minimal relevance in this predictive context. The unit weight of soil (γd or γ′) primarily influences the overall density of the foundation materials, which might not be as critical a factor in the prediction of ultimate bearing capacity as compared to parameters directly related to the geometry and material properties of the foundation. Similarly, the parameter L/B, representing the ratio of length to width, showcases minimal importance in this prediction. This could be attributed to the fact that other parameters like foundation depth, internal friction angle, and foundation width have more direct and substantial impacts on the foundation’s load-bearing capability.

5.4. Implications and Applications

This study presents significant implications for the field of geotechnical engineering by exploring the potential of soft computing techniques in predicting the ultimate bearing capacity (UBC) of shallow foundations on cohesionless soils. The inclusion of multiple linear regression (MLR), Genetic Programming (GP), Classification and Regression Trees (CART), and GA-ENN (Genetic Algorithm-Emotional Neuron Network) models in this research represents a novel approach, as they are used for the first time as grey box AI models in the literature for UBC prediction. The application of these advanced AI models expands the range of predictive tools available to engineers and practitioners, offering diverse options for accurate and reliable UBC estimation.
The use of input parameters such as the width of footing (B), depth of footing (D), footing geometry (L/B), unit weight of sand (γd or γ′), and internal friction angle (f) further enhances the versatility and practicality of the developed AI models. Engineers can leverage these models to perform UBC predictions for a wide range of shallow foundation designs on cohesionless soils, optimizing foundation designs and ensuring structural stability. The comparison of the AI models with existing theoretical approaches demonstrates their superiority in UBC prediction, underscoring their potential to outperform traditional methods. Consequently, the adoption of AI models like GP, CART, and GA-ENN can lead to more accurate and efficient foundation design practices, resulting in cost-effective and safer construction projects. Moreover, the sensitivity analysis conducted in this study empowers engineers to gain a deeper understanding of the influence of individual input parameters on UBC predictions, facilitating the identification of critical factors that impact the foundation’s load-bearing capacity. Overall, the successful integration of AI models in UBC prediction for shallow foundations on cohesionless soil contributes to the advancement of geotechnical engineering practices and promotes more reliable and informed decision making during the design and construction phases.

5.5. Geotechnical Challenges and Remediation Strategies

The prediction and assessment of the ultimate bearing capacity (UBC) for shallow foundations on cohesionless soils pose several geotechnical challenges that need to be addressed for reliable and safe foundation design. One of the primary challenges is the complex and heterogeneous nature of cohesionless soils, which can exhibit significant spatial variability in properties such as grain size distribution, void ratio, and shear strength. This variability can lead to unpredictable bearing capacity behavior, making it challenging to accurately estimate UBC using traditional methods. Moreover, the presence of soft spots, loose zones, or weak layers within the soil profile can further complicate the foundation response and load-carrying capacity. Dealing with these uncertainties and spatial variations is crucial to ensure the integrity and stability of shallow foundations.
To overcome these geotechnical challenges, the implementation of advanced soft computing techniques, such as Genetic Programming (GP), Classification and Regression Trees (CART), and Genetic Algorithm-Emotional Neuron Network (GA-ENN), as demonstrated in this study, offers promising remediation strategies. These AI models possess the capability to learn and adapt to complex patterns and non-linear relationships within the data, enabling more accurate and robust predictions of UBC for shallow foundations on cohesionless soils. By utilizing these AI models, engineers can account for the spatial variability and uncertainties in soil properties, leading to more reliable and safer foundation designs.
Another significant geotechnical challenge is the consideration of various influential parameters, such as the width of footing (B), depth of footing (D), footing geometry (L/B), unit weight of sand (γd or γ′), and internal friction angle (f), when estimating UBC. The interplay of these parameters requires a comprehensive understanding of their individual and combined effects on the foundation’s load-bearing capacity. Soft computing techniques, as used in this study, facilitate sensitivity analysis to assess the impact of each input parameter on the UBC prediction, aiding engineers in identifying critical factors and optimizing foundation design.
In addition to AI-based approaches, thorough site investigations, including detailed soil exploration and testing, play a vital role in addressing geotechnical challenges. The collection of high-quality data enables engineers to characterize the soil properties accurately and capture the spatial variations, providing a solid foundation for the AI models’ training and validation.

5.6. Limitations and Future Research

Despite the promising results and contributions of this study in predicting the ultimate bearing capacity (UBC) of shallow foundations on cohesionless soils using advanced soft computing techniques, there are certain limitations that should be acknowledged. One limitation is the reliance on historical data for model development and validation. The accuracy and performance of the AI models heavily depend on the quality and representativeness of the available data. Therefore, future research should focus on expanding the dataset and including data from a broader range of soil conditions and foundation geometries to enhance the models’ generalization and applicability to diverse engineering scenarios.
Another limitation lies in the assumption of certain soil behaviors and conditions. The AI models developed in this study may not capture certain complex geotechnical phenomena, such as soil liquefaction or soil–structure interaction effects, which can significantly influence the bearing capacity of shallow foundations. Incorporating additional factors and advanced modeling techniques to address these complexities can further improve the accuracy and reliability of UBC predictions in more challenging geotechnical conditions.
Furthermore, the present study only considers cohesionless soils, while, in practice, engineers encounter various types of soils with different characteristics. Extending the AI models to account for cohesive soils and investigating their performance in mixed soil conditions can enrich the predictive capabilities of the models and enable a more comprehensive assessment of foundation bearing capacity.
Additionally, it is essential to recognize that the predictive accuracy of the AI models is subject to the quality and availability of input parameters. In practice, obtaining precise measurements of certain parameters, such as internal friction angle, might be challenging due to site-specific constraints. Integrating advanced geophysical and non-destructive testing techniques to estimate soil properties can contribute to more accurate and reliable data inputs for the AI models.
Moreover, while the sensitivity analysis conducted in this study provides valuable insights into the influence of individual input parameters, exploring the effects of other potential factors, such as groundwater table variations, temperature, and time-dependent soil behavior, can further enhance the models’ predictive capabilities and broaden their applications.

6. Conclusions

This study investigated the use of advanced soft computing techniques, including Multiple Linear Regression (MLR), Genetic Programming (GP), Classification and Regression Trees (CART), and Genetic Algorithm-Emotional Neuron Network (GA-ENN), to predict the ultimate bearing capacity (UBC) of shallow foundations on cohesionless soils. The following is a brief summary of the results:
-
These AI models, utilizing input parameters such as footing width (B), footing depth (D), footing geometry (L/B), unit weight of sand (γd or γ′), and internal friction angle (ϕ), outperformed traditional theoretical approaches in predictive performance.
-
The Genetic Algorithm-Emotional Neural Network (GA-ENN) model consistently demonstrated superior predictive accuracy, evidenced by its lowest Mean Absolute Error (MAE), Mean Squared Error (MSE), and Root Mean Squared Error (RMSE) values in both the training and the testing datasets.
-
The GA-ENN model also consistently achieved the highest coefficient of determination (R2) values, indicating exceptional fit and a strong ability to explain variance in the target variable.
-
Compared to historical models, including R2 and Nash–Sutcliffe Efficiency (NSE) values, the GA-ENN model consistently outperformed these benchmarks.
-
Sensitivity analysis highlighted the significance of foundation depth, internal friction angle of soil, and foundation width as key determinants in predicting the ultimate bearing capacity of shallow foundations.
-
The successful application of these AI models offers a substantial advancement in geotechnical engineering practices, providing engineers and practitioners with powerful tools for more reliable and informed foundation design. These models can handle complex spatial variability and uncertainties in soil properties, allowing engineers to optimize shallow foundation designs for safety, stability, and cost-effectiveness.

Author Contributions

Conceptualization, K.K. and A.B.; methodology, K.K. and A.B.; software, K.K. and A.B.; validation, K.K. and A.B.; formal analysis, K.K. and A.B.; investigation, K.K. and A.B.; resources, K.K.; data curation, A.B.; writing—original draft preparation, H.A.-N., H.B., M.A. and M.M.S.; writing—review and editing, H.A.-N., H.B., M.A. and M.M.S.; visualization, H.B. and A.B.; supervision, H.A.-N. and M.A; project administration, M.M.S.; funding acquisition, A.B. and H.A.-N. All authors have read and agreed to the published version of the manuscript.

Funding

This research received no external funding.

Data Availability Statement

The data that support the findings of this study are available on request from the corresponding author.

Acknowledgments

This research is supported by an Australian Government Research Training Program (RTP) Scholarship for the second author (A.B.).

Conflicts of Interest

The authors declare no conflict of interest.

References

  1. Panigrahi, B.; Pradhan, P.K. Improvement of bearing capacity of soil by using natural geotextile. Int. J. Geo-Eng. 2019, 10, 9. [Google Scholar] [CrossRef]
  2. Tezcan, S.S.; Keceli, A.; Ozdemir, Z. Allowable bearing capacity of shallow foundations based on shear wave velocity. Geotech. Geol. Eng. 2006, 24, 203–218. [Google Scholar] [CrossRef]
  3. Bhardwaj, A.; Sharma, R.K. Experimental and Numerical Investigations on the Bearing Capacity of Footings on the Layered Soil. Int. J. Geosynth. Ground Eng. 2023, 9, 35. [Google Scholar] [CrossRef]
  4. Terzaghi, K.; Peck, R.B. Soil Mechanics. Engineering Practice; John Wiley and Sons: Hoboken, NJ, USA, 1948. [Google Scholar]
  5. Meyerhof, G.G. Some recent research on the bearing capacity of foundations. Can. Geotech. J. 1963, 1, 16–26. [Google Scholar] [CrossRef]
  6. Hansen, B.; Christensen, N.H.; Karafiath, L.L. Discussion of “Theoretical Bearing Capacity of Very Shallow Footings”. J. Soil Mech. Found. Div. 1969, 95, 1568–1573. [Google Scholar] [CrossRef]
  7. Vesic, A.S. Bearing capacity of shallow foundations. In Foundation Engineering Handbook; Reinhold: Oxnard, CA, USA, 1975. [Google Scholar]
  8. Das, B.M.; Sivakugan, N. Principles of Foundation Engineering; Cengage Learning: Boston, MA, USA, 2018. [Google Scholar]
  9. Conte, E.; Pugliese, L.; Troncone, A.; Vena, M. A simple approach for evaluating the bearing capacity of piles subjected to inclined loads. Int. J. Geomech. 2021, 21, 04021224. [Google Scholar] [CrossRef]
  10. Achmus, M.; Thieken, K. On the behavior of piles in non-cohesive soil under combined horizontal and vertical loading. Acta Geotech. 2010, 5, 199–210. [Google Scholar] [CrossRef]
  11. De Beer, E.E. The scale effect on the phenomenon of progressive rupture in cohesionless soils. In Proceedings of the 6th International Conference on Soil Mechanics and Foundation Engineering, Montreal, QC, Canada, 8–15 September 1965. [Google Scholar]
  12. Yamaguchi, M. On the scale effect of footings in dense sand. In Proceedings of the 9th International Conference on Soil Mechanics and Foundation Engineering, Tokyo, Japan, 10–15 July 1977; pp. 795–798. [Google Scholar]
  13. Tatsuoka, F. Progressive failure and particle size effect in bearing capacity of a footing on sand. ASCE Geotech. Spec. Publ. 1991, 27, 788–802. [Google Scholar]
  14. Padmini, D.; Ilamparuthi, K.; Sudheer, K.P. Ultimate bearing capacity prediction of shallow foundations on cohesionless soils using neurofuzzy models. Comput. Geotech. 2008, 35, 33–46. [Google Scholar] [CrossRef]
  15. Hurtado, J.E.; Londono, J.M.; Meza, M.A. On the applicability of neural networks for soil dynamic amplification analysis. Soil Dyn. Earthq. Eng. 2001, 21, 579–591. [Google Scholar] [CrossRef]
  16. Garcıa, S.R.; Romo, M.P.; Figueroa-Nazuno, J. Soil dynamic properties determination: A neurofuzzy system approach. Control. Intell. Syst. 2006, 34, 1–11. [Google Scholar] [CrossRef]
  17. Baghbani, A.; Costa, S.; Faradonbeh, R.S.; Soltani, A.; Baghbani, H. Modeling the effects of particle shape on damping ratio of dry sand by simple shear testing and artificial intelligence. Appl. Sci. 2023, 13, 4363. [Google Scholar] [CrossRef]
  18. Pasdarpour, M.; Ghazavi, M.; Teshnehlab, M.; Sadrnejad, S.A. Optimal design of soil dynamic compaction using genetic algorithm and fuzzy system. Soil Dyn. Earthq. Eng. 2009, 29, 1103–1112. [Google Scholar] [CrossRef]
  19. Tsiaousi, D.; Travasarou, T.; Drosos, V.; Ugalde, J.; Chacko, J. Machine learning applications for site characterization based on CPT data. In Geotechnical Earthquake Engineering and Soil Dynamics V; ASCE: Reston, VA, USA, 2018; pp. 461–472. [Google Scholar]
  20. Baghbani, A.; Costa, S.; Lu, Y.; Soltani, A.; Abuel-Naga, H.; Samui, P. Effects of particle shape on shear modulus of sand using dynamic simple shear testing. Arab. J. Geosci. 2023, 16, 422. [Google Scholar] [CrossRef]
  21. Sejnowski, T.J. The unreasonable effectiveness of deep learning in artificial intelligence. Proc. Natl. Acad. Sci. USA 2020, 117, 30033–30038. [Google Scholar] [CrossRef] [PubMed]
  22. Zhou, Y.; Li, S.; Zhou, C.; Luo, H. Intelligent approach based on random forest for safety risk prediction of deep foundation pit in subway stations. J. Comput. Civ. Eng. 2019, 33, 05018004. [Google Scholar] [CrossRef]
  23. Dimiduk, D.M.; Holm, E.A.; Niezgoda, S.R. Perspectives on the impact of machine learning, deep learning, and artificial intelligence on materials, processes, and structures engineering. Integr. Mater. Manuf. Innov. 2018, 7, 157–172. [Google Scholar] [CrossRef]
  24. Hong, C.; Zhang, J.; Chen, W. An Integrated Intelligent Approach for Monitoring and Management of a Deep Foundation Pit in a Subway Station. Sensors 2022, 22, 8737. [Google Scholar] [CrossRef]
  25. Xu, J.J.; Zhang, H.; Tang, C.S.; Cheng, Q.; Tian, B.G.; Liu, B.; Shi, B. Automatic soil crack recognition under uneven illumination condition with the application of artificial intelligence. Eng. Geol. 2022, 296, 106495. [Google Scholar] [CrossRef]
  26. Baghbani, A.; Costa, S.; Choudhury, T. Developing mathematical models for predicting cracks and shrinkage intensity factor during clay soil desiccation. 2023. Available online: https://papers.ssrn.com/sol3/papers.cfm?abstract_id=4408164 (accessed on 30 March 2023).
  27. Gopal, P.; Ratnam, R.; Farooq, M.; Garg, A.; Gogoi, N. Influence of Biochar obtained from invasive weed on infiltration rate and cracking of soils: An integrated experimental and artificial intelligence approach. In Proceedings of the 8th International Congress on Environmental Geotechnics Volume 1: Towards a Sustainable Geoenvironment 8th; Springer: Berlin/Heidelberg, Germany, 2019; pp. 351–358. [Google Scholar]
  28. Lu, Y.; Xu, C.; Baghbani, A. Initial state of excavated soil and rock (ESR) to influence the stabilisation with cement. Constr. Build. Mater. 2023, 400, 132879. [Google Scholar] [CrossRef]
  29. Daghistani, F.; Baghbani, A.; Abuel Naga, H.; Faradonbeh, R.S. Internal Friction Angle of Cohesionless Binary Mixture Sand–Granular Rubber Using Experimental Study and Machine Learning. Geosciences 2023, 13, 197. [Google Scholar] [CrossRef]
  30. Baghbani, A.; Nguyen, M.D.; Alnedawi, A.; Milne, N.; Baumgartl, T.; Abuel-Naga, H. Improving soil stability with alum sludge: An AI-enabled approach for accurate prediction of California Bearing Ratio. Appl. Sci. 2023, 13, 4934. [Google Scholar] [CrossRef]
  31. Nguyen, M.D.; Baghbani, A.; Alnedawi, A.; Ullah, S.; Kafle, B.; Thomas, M.; Moon, E.M.; Milne, N.A. Investigation on the suitability of aluminium-based water treatment sludge as a sustainable soil replacement for road construction. Transp. Eng. 2023, 12, 100175. [Google Scholar] [CrossRef]
  32. Nguyen, T.D.; Cherif, R.; Mahieux, P.Y.; Lux, J.; Aït-Mokhtar, A.; Bastidas-Arteaga, E. Artificial intelligence algorithms for prediction and sensitivity analysis of mechanical properties of recycled aggregate concrete: A review. J. Build. Eng. 2023, 66, 105929. [Google Scholar] [CrossRef]
  33. Sadati, S.; Wunsch II, D.C.; Khayat, K.H. Artificial intelligence to investigate modulus of elasticity of recycled aggregate concrete. ACI Mater. J. 2019, 116, 51–62. [Google Scholar] [CrossRef]
  34. Duan, J.; Asteris, P.G.; Nguyen, H.; Bui, X.N.; Moayedi, H. A novel artificial intelligence technique to predict compressive strength of recycled aggregate concrete using ICA-XGBoost model. Eng. Comput. 2021, 37, 3329–3346. [Google Scholar] [CrossRef]
  35. Polo-Mendoza, R.; Martinez-Arguelles, G.; Peñabaena-Niebles, R. Environmental optimization of warm mix asphalt (WMA) design with recycled concrete aggregates (RCA) inclusion through artificial intelligence (AI) techniques. Results Eng. 2023, 17, 100984. [Google Scholar] [CrossRef]
  36. Daghistani, F.; Baghbani, A.; Abuel-Naga, H. Shear strength characteristics of binary mixture sand-carpet fibre using experimental study and machine learning. Int. J. Geotech. Eng. 2023, 1–15. [Google Scholar]
  37. Baghbani, A.; Abuel-Naga, H.; Shirkavand, D. Accurately Predicting Quartz Sand Thermal Conductivity Using Machine Learning and Grey-Box AI Models. Geotechnics 2023, 3, 638–660. [Google Scholar] [CrossRef]
  38. Johari, A.; Habibagahi, G.; Ghahramani, A. Prediction of SWCC using artificial intelligent systems: A comparative study. Scientia Iranica 2011, 18, 1002–1008. [Google Scholar] [CrossRef]
  39. Lawal, A.I.; Kwon, S. Application of artificial intelligence to rock mechanics: An overview. J. Rock Mech. Geotech. Eng. 2021, 13, 248–266. [Google Scholar] [CrossRef]
  40. Lai, J.; Qiu, J.; Feng, Z.; Chen, J.; Fan, H. Prediction of soil deformation in tunnelling using artificial neural networks. Comput. Intell. Neurosci. 2016, 33. [Google Scholar] [CrossRef]
  41. Sheil, B.B.; Suryasentana, S.K.; Mooney, M.A.; Zhu, H. Machine learning to inform tunnelling operations: Recent advances and future trends. Proc. Inst. Civ. Eng.-Smart Infrastruct. Constr. 2020, 173, 74–95. [Google Scholar]
  42. Ahmad, M.; Tang, X.W.; Qiu, J.N.; Ahmad, F. Evaluation of liquefaction-induced lateral displacement using Bayesian belief networks. Front. Struct. Civ. Eng. 2021, 15, 80–98. [Google Scholar] [CrossRef]
  43. Ali Khan, M.; Zafar, A.; Akbar, A.; Javed, M.F.; Mosavi, A. Application of Gene Expression Programming (GEP) for the Prediction of Compressive Strength of Geopolymer Concrete. Materials 2021, 14, 1106. [Google Scholar] [CrossRef] [PubMed]
  44. Ahmad, M.; Hu, J.L.; Ahmad, F.; Tang, X.W.; Amjad, M.; Iqbal, M.J.; Asim, M.; Farooq, A. Supervised learning methods for modeling concrete compressive strength prediction at high temperature. Materials 2021, 14, 1983. [Google Scholar] [CrossRef] [PubMed]
  45. Ahmad, M.; Tang, X.W.; Qiu, J.N.; Gu, W.J.; Ahmad, F. A hybrid approach for evaluating CPT-based seismic soil liquefaction potential using Bayesian belief networks. J. Cent. South Univ 2020, 27, 500–516. [Google Scholar]
  46. Pirhadi, N.; Tang, X.; Yang, Q.; Kang, F. A new equation to evaluate liquefaction triggering using the response surface method and parametric sensitivity analysis. Sustainability 2018, 11, 112. [Google Scholar] [CrossRef]
  47. Ahmad, M.; Tang, X.; Ahmad, F. Evaluation of liquefaction-induced settlement using random forest and REP tree models: Taking pohang earthquake as a case of illustration. In Natural Hazards-Impacts, Adjustments and Resilience; Intech Open: London, UK, 2020. [Google Scholar]
  48. Ahmad, M.; Al-Shayea, N.A.; Tang, X.W.; Jamal, A.M.; Al-Ahmadi, H.; Ahmad, F. Predicting the pillar stability of underground mines with random trees and C4. 5 decision trees. Appl. Sci. 2020, 10, 6486. [Google Scholar] [CrossRef]
  49. Ahmad, M.; Tang, X.W.; Qiu, J.N.; Ahmad, F.; Gu, W.J. A step forward towards a comprehensive framework for assessing liquefaction land damage vulnerability: Exploration from historical data. Front. Struct. Civ. Eng. 2020, 14, 1476–1491. [Google Scholar] [CrossRef]
  50. Zhou, J.; Li, E.; Wang, M.; Chen, X.; Shi, X.; Jiang, L. Feasibility of stochastic gradient boosting approach for evaluating seismic liquefaction potential based on SPT and CPT case histories. J. Perform. Constr. Facil. 2019, 33, 04019024. [Google Scholar] [CrossRef]
  51. Hamdia, K.M.; Arafa, M.; Alqedra, M. Structural damage assessment criteria for reinforced concrete buildings by using a Fuzzy Analytic Hierarchy process. Undergr. Space 2018, 3, 243–249. [Google Scholar] [CrossRef]
  52. Kalinli, A.; Acar, M.C.; Gündüz, Z. New approaches to determine the ultimate bearing capacity of shallow foundations based on artificial neural networks and ant colony optimization. Eng. Geol. 2011, 117, 29–38. [Google Scholar] [CrossRef]
  53. Samui, P. Application of statistical learning algorithms to ultimate bearing capacity of shallow foundation on cohesionless soil. Int. J. Numer. Anal. Methods Geomech. 2012, 36, 100–110. [Google Scholar] [CrossRef]
  54. Shahnazari, H.; Tutunchian, M.A. Prediction of ultimate bearing capacity of shallow foundations on cohesionless soils: An evolutionary approach. KSCE J. Civ. Eng. 2012, 16, 950–957. [Google Scholar] [CrossRef]
  55. Tsai, H.C.; Tyan, Y.Y.; Wu, Y.W.; Lin, Y.H. Determining ultimate bearing capacity of shallow foundations using a genetic programming system. Neural Comput. Appl. 2013, 23, 2073–2084. [Google Scholar] [CrossRef]
  56. Kohestani, V.R.; Vosoghi, M.; Hassanlourad, M.; Fallahnia, M. Bearing capacity of shallow foundations on cohesionless soils: A random forest based approach. Civ. Eng. Infrastruct. J. 2017, 50, 35–49. [Google Scholar]
  57. Hewing, L.; Kabzan, J.; Zeilinger, M.N. Cautious model predictive control using gaussian process regression. IEEE Trans. Control Syst. Technol. 2019, 28, 2736–2743. [Google Scholar] [CrossRef]
  58. Sun, A.Y.; Wang, D.; Xu, X. Monthly streamflow forecasting using Gaussian process regression. J. Hydrol. 2014, 511, 72–81. [Google Scholar] [CrossRef]
  59. Roushangar, K.; Shahnazi, S. Prediction of sediment transport rates in gravel-bed rivers using Gaussian process regression. J. Hydroinform. 2020, 22, 249–262. [Google Scholar] [CrossRef]
  60. Ahmad, M.; Ahmad, F.; Wróblewski, P.; Al-Mansob, R.A.; Olczak, P.; Kamiński, P.; Safdar, M.; Rai, P. Prediction of ultimate bearing capacity of shallow foundations on cohesionless soils: A gaussian process regression approach. Appl. Sci. 2021, 11, 10317. [Google Scholar] [CrossRef]
  61. Muhs, H.; Weiß, K. Inclined load tests on shallow strip footings. In Proceedings of the 8th International Conference on Soil Mechanism and Foundation Engineering, Moscow, Russia, 2–3 August 1973; Volume 2, pp. 173–179. [Google Scholar]
  62. Briaud, J.L.; Gibbens, R. Behavior of five large spread footings in sand. J. Geotech. Geoenviron. Eng. 1999, 125, 787–796. [Google Scholar] [CrossRef]
  63. Gandhi, G.N. Study of Bearing Capacity Factors Developed from Laboratory Experiments on Shallow Footings Founded on Cohesionless Soil; Rajiv Gandhi Proudyogiki Vishwavidyalaya: Bhopal, India, 2001. [Google Scholar]
  64. Breiman, L.; Friedman, J.H.; Olshen, R.A.; Stone, C.G. Classification and Regression Trees; Wadsworth International Group: London, UK, 1984. [Google Scholar]
  65. Breiman, L. Classification and Regression Trees; Routledge: Oxford, UK, 2017. [Google Scholar]
  66. Safavian, S.R.; Landgrebe, D. A survey of decision tree classifier methodology. IEEE Trans. Syst. Man Cybern. 1991, 21, 660–674. [Google Scholar] [CrossRef]
  67. Crawford, S.L. Extensions to the CART algorithm. Int. J. Man-Mach. Stud. 1989, 31, 197–217. [Google Scholar] [CrossRef]
  68. Huysmans, J.; Dejaeger, K.; Mues, C.; Vanthienen, J.; Baesens, B. An empirical evaluation of the comprehensibility of decision table, tree and rule based predictive models. Decis. Support Syst. 2011, 51, 141–154. [Google Scholar] [CrossRef]
  69. Zacharis, N.Z. Classification and regression trees (CART) for predictive modeling in blended learning. Int. J. Intell. Syst. Appl. 2018, 3, 1–9. [Google Scholar] [CrossRef]
  70. Koza, J.R. Genetic Programming: A Paradigm for Genetically Breeding Populations of Computer Programs to Solve Problems; Stanford University Department of Computer Science: Stanford, CA, USA, 1990; Volume 34. [Google Scholar]
  71. Mayer, M.J.; Szilágyi, A.; Gróf, G. Environmental and economic multi-objective optimization of a household level hybrid renewable energy system by genetic algorithm. Appl. Energy 2020, 269, 115058. [Google Scholar] [CrossRef]
  72. Yar, M.H.; Rahmati, V.; Oskouei, H.R.D. A survey on evolutionary computation: Methods and their applications in engineering. Mod. Apply Sci. 2016, 10, 131139. [Google Scholar] [CrossRef]
  73. Katoch, S.; Chauhan, S.S.; Kumar, V. A review on genetic algorithm: Past, present, and future. Multimedia tools and applications 2021, 80, 8091–8126. [Google Scholar] [CrossRef]
  74. Dain, R.A. Developing mobile robot wall-following algorithms using genetic programming. Appl. Intell. 1998, 8, 33–41. [Google Scholar] [CrossRef]
  75. Zojaji, Z.; Ebadzadeh, M.M.; Nasiri, H. Semantic schema based genetic programming for symbolic regression. Appl. Soft Comput. 2022, 122, 108825. [Google Scholar] [CrossRef]
  76. Jalali, S.M.J.; Khosravi, A.; Alizadehsani, R.; Salaken, S.M.; Kebria, P.M.; Puri, R.; Nahavandi, S. Parsimonious evolutionary-based model development for detecting artery disease. In Proceedings of the IEEE International Conference on Industrial Technology (ICIT), Melbourne, Australia, 13–15 February 2019; pp. 800–805. [Google Scholar]
  77. Sivanandam, S.N.; Deepa, S.N.; Sivanandam, S.N.; Deepa, S.N. Genetic Algorithms; Springer: Berlin/Heidelberg, Germany, 2008; pp. 15–37. [Google Scholar]
  78. Lotfi, E.; Akbarzadeh-T., M.R. Practical emotional neural networks. Neural Netw. 2014, 59, 61–72. [Google Scholar] [CrossRef] [PubMed]
  79. Loussaief, S.; Abdelkrim, A. Convolutional neural network hyper-parameters optimization based on genetic algorithms. Int. J. Adv. Comput. Sci. Appl. 2018, 9, 252–266. [Google Scholar] [CrossRef]
  80. Bhandare, A.; Kaur, D. Designing convolutional neural network architecture using genetic algorithms. Int. J. Adv. Netw. Monit. Control 2021, 6, 26–35. [Google Scholar] [CrossRef]
  81. Baghbani, A.; Soltani, A.; Kiany, K.; Daghistani, F. Predicting the Strength Performance of Hydrated-Lime Activated Rice Husk Ash-Treated Soil Using Two Grey-Box Machine Learning Models. Geotechnics 2023, 3, 894–920. [Google Scholar] [CrossRef]
Figure 1. Distribution of collected datasets and effect of (a) dimension of foundation and (b) soil properties on qu.
Algorithms 16 00456 g001
Figure 2. Effect of foundation depth on the bearing capacity of the shallow foundation in the collected datasets.
Algorithms 16 00456 g002
Figure 3. Process of removing outliers using plotting boxplots for (a) initial database and (b) final database.
Algorithms 16 00456 g003
Figure 4. Histogram of output in used database.
Algorithms 16 00456 g004
Figure 5. Results of proposed MLR based on (a) training database and (b) testing database.
Algorithms 16 00456 g005
Figure 6. Results of proposed GP based on (a) training database and (b) testing database.
Algorithms 16 00456 g006
Figure 7. Results of proposed CART based on (a) training database and (b) testing database.
Algorithms 16 00456 g007
Figure 8. The proposed tree for prediction of qu.
Algorithms 16 00456 g008
Figure 9. Results of proposed GA-ENN based on (a) training database and (b) testing database.
Algorithms 16 00456 g009
Figure 10. Results of different developed models of (a) MLR, (b) GP, (c) CART and (d) GA-ENN, for different data points.
Algorithms 16 00456 g010
Figure 11. Importance of input parameters in (a) MLR, (b) GP, (c) CART, (d) GA-ENN.
Algorithms 16 00456 g011aAlgorithms 16 00456 g011b
Table 1. Statistical information of used database after removing outliers.
VariableDatasetsMinimumMaximumMeanStd. Deviation
Footing Bearing Capacity, qu (kPa)7558.500464.000211.274108.959
Footing Width, B (m)750.0590.6000.2500.195
Footing Depth, D (m)750.0000.5000.0980.106
Footing Geometry, L/B751.0006.0003.4092.269
Sand Unit Weight, γd or γ′ (kN/m3)759.85017.10014.6152.625
Internal Friction Angle, ϕ7534.00042.50038.3632.691
Table 2. Distribution of training database.
VariableDatasetsMinimumMaximumMeanStd. Deviation
OutputFooting Bearing Capacity, qu (kPa)6067.700464.000208.524108.113
InputsFooting Width, B (m)600.0590.6000.2490.193
Footing Depth, D (m)600.0000.5000.0950.096
Footing Geometry, L/B601.0006.0003.4502.294
Sand Unit Weight, γd or γ′ (kN/m3)609.85017.10014.7742.553
Sand Internal Friction Angle, ϕ6034.00042.50038.2432.738
Table 3. Distribution of testing database.
VariableDatasetsMinimumMaximumMeanStd. Deviation
OutputFooting Bearing Capacity, qu (kPa)1558.500425.000222.273115.466
InputsFooting Width, B (m)150.0590.5200.2550.212
Footing Depth, D (m)150.0000.5000.1100.143
Footing Geometry, L/B151.0006.0003.2472.235
Sand Unit Weight, γd or γ′ (kN/m3)1510.20017.10013.9802.898
Internal Friction Angle, ϕ1534.00042.50038.8402.528
Table 4. Pearson matrix for input and output parameters (darkness level represents the degree of strength in the linear relationship).
BDL/Bγϕqu
Footing Width, B10.149−0.346−0.906−0.1830.269
Footing Depth, D0.1491−0.132−0.081−0.1110.594
Footing Geometry, L/B−0.346−0.13210.3880.202−0.105
Sand Unit Weight, γd or γ′−0.906−0.0810.38810.384−0.103
Internal Friction Angle, ϕ−0.183−0.1110.2020.38410.532
Footing Bearing Capacity, qu0.2690.594−0.105−0.1030.5321
Table 5. Overall performance of the best MLR model to predict the ultimate bearing capacity of shallow foundations for both training and testing databases.
MetricTraining DatabaseTesting Database
MAE33.93832.260
MSE2189.8542026.062
RMSE46.79645.012
MSLE0.0630.116
RMSLE0.2520.341
R20.8090.837
Table 6. Overall performance of the best GP model to predict the ultimate bearing capacity of shallow foundations for both training and testing databases.
MetricTraining DatabaseTesting Database
MAE19.67716.164
MSE700.751313.386
RMSE26.47217.703
MSLE0.0180.012
RMSLE0.1360.111
R20.9390.975
Table 7. Overall performance of the best CART model to predict the ultimate bearing capacity of shallow foundations for both training and testing databases.
MetricTraining DatasetTesting Dataset
MAE18.38823.583
MSE568.105981.006
RMSE23.83531.321
MSLE0.0170.031
RMSLE0.1290.177
R20.9510.921
Table 8. The best developed CART model.
NodesObjectsSplit VariableValuesParent NodeSonsPredicted Values
160 2; 30.37
244D≤0.2814; 50.28
316D>0.2816; 70.62
431ϕ≤0.6828; 90.19
513ϕ>0.68210; 110.5
66γd or γ′≤0.543 0.79
710γd or γ′>0.54314; 150.51
820ϕ≤0.39416; 170.13
911ϕ>0.39418; 190.3
107B≤0.125 0.4
116B>0.125 0.62
146γd or γ′≤0.947 0.32
154γd or γ′>0.947 0.8
167ϕ≤0.188 0.06
1713ϕ>0.18834; 350.16
184B≤0.129 0.25
197B>0.129 0.33
348D≤0.131768; 690.13
355D>0.1317 0.21
684D≤0.0334 0.17
694D>0.0334 0.1
Table 9. Additional information for the best CART model.
Nodesqu (Pred)Rules
60.79If D > 0.28 and γd or γ′ <= 0.54 then q u = 0.8 in 10% of cases
100.40If D <= 0.28 and ϕ > 0.68 and B <= 0.12 then q u = 0.4 in 11.7% of cases
110.62If D <= 0.28 and ϕ > 0.68 and B > 0.12 then q u = 0.6 in 10% of cases
140.32If D > 0.28 and γd or γ′ > 0.54 and γd or γ′ <= 0.94 then q u = 0.3 in 10% of cases
150.80If D > 0.28 and γd or γ′ > 0.54 and γd or γ′ > 0.94 then q u = 0.8 in 6.7% of cases
160.06If D <= 0.28 and ϕ <= 0.68 and ϕ <= 0.39 and X5 <= 0.18 then q u = 0.1 in 11.7% of cases
180.25If D <= 0.28 and ϕ <= 0.68 and ϕ > 0.39 and B <= 0.12 then q u = 0.2 in 6.7% of cases
190.33If D <= 0.28 and ϕ <= 0.68 and ϕ > 0.39 and B > 0.12 then q u = 0.3 in 11.7% of cases
350.21If D <= 0.28 and ϕ <= 0.68 and ϕ <= 0.39 and ϕ > 0.18 and D > 0.13 then q u = 0.2 in 8.3% of cases
680.17If D <= 0.28 and ϕ <= 0.68 and ϕ <= 0.39 and ϕ > 0.18 and D <= 0.13 and D <= 0.03 then q u = 0.2 in 6.7% of cases
690.10If D <= 0.28 and ϕ <= 0.68 and ϕ <= 0.39 and ϕ > 0.18 and D <= 0.13 and D > 0.03 then q u = 0.1 in 6.7% of cases
Table 10. Overall performance of the best GA-ENN model to predict the ultimate bearing capacity of shallow foundations for both training and testing databases.
MetricTraining DatabaseTesting Database
MAE6.6346.018
MSE72.50365.397
RMSE8.5158.087
MSLE0.0040.005
RMSLE0.0610.072
R20.9940.995
Table 11. Results of all models predict ultimate bearing capacity of shallow foundations for both training and testing databases.
Performance MetricsTraining Testing
MLRGPCARTGA-ENNMLRGPCARTGA-ENN
MAE33.93819.67718.3886.63432.26016.16423.5836.018
MSE2189.854700.751568.10572.5032026.062313.386981.00665.397
RMSE46.79626.47223.8358.51545.01217.70331.3218.087
MSLE0.0630.0180.0170.0040.1160.0120.0310.005
RMSLE0.2520.1360.1290.0610.3410.1110.1770.072
R20.8090.9390.9510.9940.8370.9750.9210.995
Table 12. Comparison of the results of this study with literature models.
MetricsVesic [4]Hansen [3]Gaussian Process Regression Approach [60]This Study (Best Grey-Box Method), GPThis Study (Hybrid Method), GA-ENN
R20.9020.8940.9400.9750.995
NSE0.8150.7270.8420.9750.995
Table 13. Ranking results of variable importance for the proposed mathematical models to predict qu.
ModelInput Parameters
BDL/BUnit Weight (γd or γ’)Friction Angle
MLR31542
GP13452
CART31542
GA-ENN31542
Total Score10619178
Ranking31542
Disclaimer/Publisher’s Note: The statements, opinions and data contained in all publications are solely those of the individual author(s) and contributor(s) and not of MDPI and/or the editor(s). MDPI and/or the editor(s) disclaim responsibility for any injury to people or property resulting from any ideas, methods, instructions or products referred to in the content.

