Article

Optimal Reactive Power Compensation via D-STATCOMs in Electrical Distribution Systems by Applying the Generalized Normal Distribution Optimizer

by
Laura Patricia García-Pineda
1 and
Oscar Danilo Montoya
1,2,*
1
Grupo de Compatibilidad e Interferencia Electromagnética (GCEM), Facultad de Ingeniería, Universidad Distrital Francisco José de Caldas, Bogotá 110231, Colombia
2
Laboratorio Inteligente de Energía, Facultad de Ingeniería, Universidad Tecnológica de Bolívar, Cartagena 131001, Colombia
*
Author to whom correspondence should be addressed.
Algorithms 2023, 16(1), 29; https://doi.org/10.3390/a16010029
Submission received: 10 November 2022 / Revised: 22 December 2022 / Accepted: 29 December 2022 / Published: 3 January 2023

Abstract

:
This research deals with the problem regarding the optimal siting and sizing of distribution static compensators (D-STATCOMs) via the application of a master–slave optimization technique. The master stage determines the nodes where the D-STATCOMs must be located and their nominal rates by applying the generalized normal distribution optimizer (GNDO) with a discrete–continuous codification. In the slave stage, the successive approximations power flow method is implemented in order to establish the technical feasibility of the solution provided by the master stage, i.e., voltage regulation and device capabilities, among other features. The main goal of the proposed master–slave optimizer is to minimize the expected annual operating costs of the distribution grid, which includes the energy loss and investment costs of the D-STATCOMs. With the purpose of improving the effectiveness of reactive power compensation during the daily operation of the distribution grid, an optimal reactive power flow (ORPF) approach is used that considers the nodes where D-STATCOMs are located as inputs in order to obtain their daily expected dynamical behavior with regard to reactive power injection to obtain additional net profits. The GNDO approach and the power flow method are implemented in the MATLAB programming environment, and the ORPF approach is implemented in the GAMS software using a test feeder comprising 33 nodes with both radial and meshed configurations. A complete comparative analysis with the Salp Swarm Algorithm is presented in order to demonstrate the effectiveness of the proposed two-stage optimization approach in the fixed operation scenario regarding the final objective function values. In addition, different tests considering the possibility of hourly power injection using D-STATCOMs through the ORPF solution demonstrate that additional gains can be obtained in the expected annual operative costs of the grid.

1. Introduction

Medium- and low-voltage distribution networks have undergone important changes in their physical and computational structures that have transformed these passive grids into to active distribution networks [1,2]. These changes have been provoked by new regulations regarding the integration of renewable energy resources that have focused on the decabornization of the world’s energy matrix [3,4,5]. The main goal of electricity distribution networks is to transport electricity to end-users with the necessary standards of efficiency, quality, and reliability. This requires minimizing energy losses and improving transport processes in order to achieve more efficient and competitive networks [6].
To improve the efficiency of electrical distribution networks with regard to reducing power losses, reactive power compensation is one of the most widely recognized methods, given its contribution in this regard and other benefits such as power factor correction, increased transport capacity, improved operation of network lines and devices, voltage stability, and improved voltage profiles. All of these depend on different operating constraints [7], as it is of great importance to reduce losses and minimize investment costs for current distribution systems.
One of the best options for energy loss reduction is distributed generation (DG). The authors of [8] presented a decision-making analysis aimed at determining the optimal location and sizes for DG in radial distribution networks, considering the improvement of the voltage profiles and the minimization of the total grid’s active and reactive power losses. However, DG may have very high initial installation costs, especially when compared to strategies such as grid reconfiguration and shunt reactive power compensation with capacitors [9]. Capacitive compensation can yield the benefits of loss reduction, power factor correction, and voltage profile improvement to the fullest if the location and size are efficiently determined. However, capacitor banks typically inject reactive power in fixed steps [10], which reduces the positive effect of reactive power injection on reducing energy losses, mainly when daily demand profiles with high variations are considered in the grid operation environment.
In order to improve the advantages of using reactive power to minimize total grid power losses, it is possible to use distribution static compensators (D-STATCOMs). These are regulation devices based on a power electronics voltage source converter that add flexibility to the power distribution network. In comparison with a variable-step capacitor bank, a D-STATCOM is a more flexible device, as it injects the exact amount of reactive power in accordance with the network requirements. This is by means of efficient control techniques [11]. It is important to mention that D-STATCOMs can inject and absorb reactive power with very fast dynamic responses through the injection of phase-shifted current to the system at the common coupling point, which aids in power factor correction and harmonic filtering, among other benefits [12]. D-STATCOMs can be located in any of the nodes of the distribution system, so it is important to determine their optimal siting and sizing using efficient optimization techniques for the reduction of energy losses and the minimization of operating costs.
In the specialized literature, there are multiple reports regarding the optimal location and sizing of D-STATCOMs in distribution networks. Some of these approaches are discussed in this document. The authors of [12] presented a complete way to determine the optimal location and size of D-STATCOMs via analytical and heuristic optimization methods. In addition, they presented the typical objective functions of the specialized literature to improve network performance, i.e., voltage stability and power losses indicators. The work by [13] proposed a multi-objective particle swarm optimizer to place and size D-STATCOMs while considering simultaneous power grid reconfiguration. As objective functions, the minimization of active power losses, the voltage stability index, and the load capacity factor of the distribution lines were considered. The main feature of this approach is that the optimization process was carried out only under maximum load conditions, which is not considered a suitable scenario given the potential oversizing of the compensating devices, since the consumption of active and reactive power are variable inputs.
The authors of [14] proposed a multi-objective fuzzy approach based on ant colony optimization in order to solve the simultaneous and proximate reconfigurations (sizing and placement) of PV sources and D-STATCOMs in distribution systems. The objective was to minimize network losses and to improve voltage profiles and feeder load balancing operation characteristics. This methodology was validated in the IEEE 33-bus grid with excellent numerical results. The authors of [15] presented a heuristic method based on voltage and power loss indexes in order to locate and size D-STATCOMs in radial electrical distribution networks. Numerical validation of this heuristic approach was performed on the IEEE 33-bus test feeder. However, the authors only considered maximum load conditions.
Table 1 summarizes the different algorithms used in the literature to solve the problem concerning the placement and sizing of D-STATCOMs in distribution networks.
The main features of the optimization methods in Table 1 are the following: (i) the most common function is the minimization of energy losses, and (ii) the studied problems show two tendencies: the first is related to metaheuristics, and the second offers convex formulations or approaches that combine convex and combinatorial methods.
Based on the aforementioned literature review, the problem of reactive power compensation in power systems is still an area of interest for both academia and the industry. Therefore, this research article proposes the following contributions:
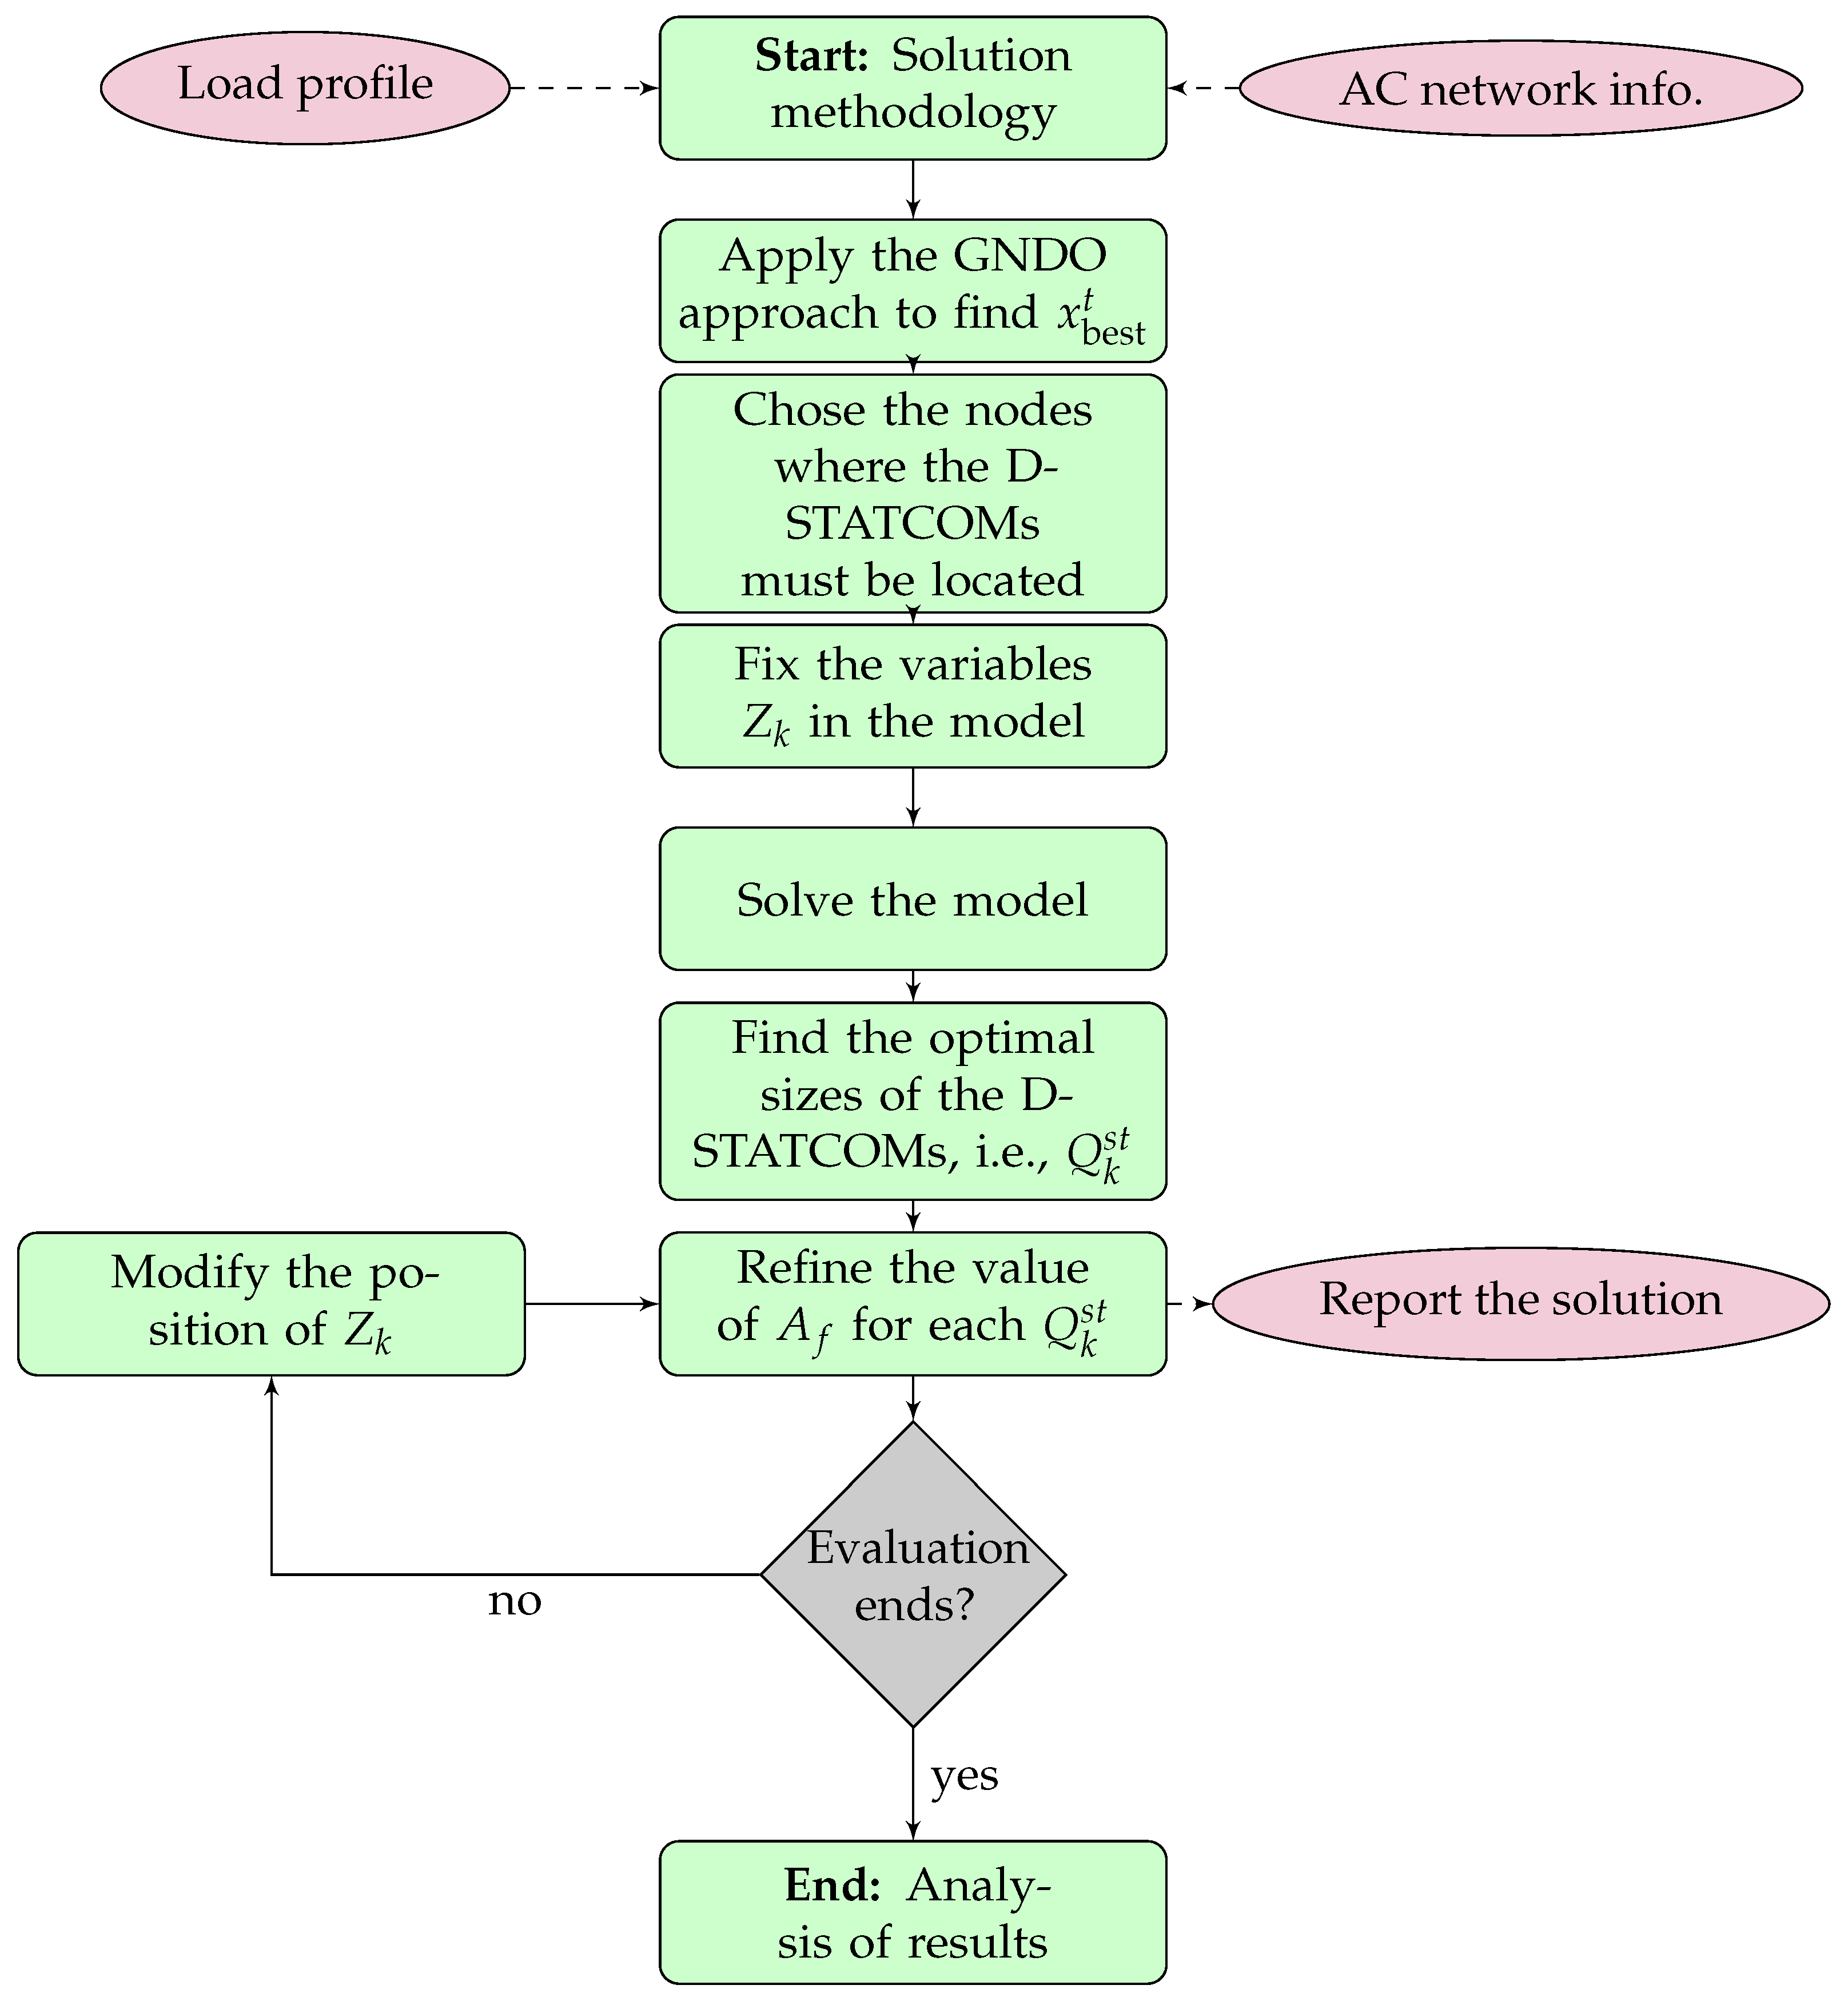
  • We provide a new solution method based on application of the generalized normal distribution optimizer (GNDO) for locating and sizing D-STATCOMs in distribution networks with radial and meshed topologies while using a discrete–continuous codification.
  • We combine the GNDO approach with an efficient power flow multi-period approach that allows solving of the technical constraints of the optimization problem, i.e., power balance, voltage regulation, and device capabilities, among others.
  • We improve the final solution obtained with the proposed master–slave optimizer by using the set of nodes where the D-STATCOMs must be located as inputs for the optimal reactive power flow (ORPF) problem, aiming to further minimize the final expected annual operating costs of the distribution grid.
Note that the selection of the GNDO as a solution technique to address the optimal location and sizing problem for D-STATCOMs in distribution networks is based on three facts:
  • The GNDO is a metaheuristic method inspired by the classical theory of normal probability distributions. It considers an initial population that evolves throughout the iterative process, considering the means and the standard deviation as advance parameters.
  • The computational implementation of the GNDO is simple and requires only a few mathematical programming skills to adapt it to any optimization problem that includes binary and continuous variables.
  • Multiple reports in the specialized literature have confirmed that the GNDO approach is efficient at solving complex optimization problems such as the placement location of renewable energy resources in AC and DC networks [24,25] and parameter extraction for photovoltaic models [26], among other optimization problems.
Note that the proposed solution methodology addressed in this research to locate, size, and operate D-STATCOMs in electrical distribution networks is different from recently published literature reports, since the GNDO approach allows reaching better objective function values with respect to the literature in the case of fixed reactive power injection, and also, with the improvement stage based on the ORPF solution, we find additional profits for the utility company that have not been previously presented by solution methodologies based on combinatorial optimizers available in the current literature. It is important to mention that this work focuses on the optimal design and operation of D-STATCOMS in distribution networks under normal operating conditions and upon the basis of the demand curves provided by utilities. However, as future research, an interesting development could consider the probabilistic nature of the loads and new paradigms regarding the transformation of energy consumption habits with the massive integration of electric vehicles into medium- and low-voltage distribution networks [27].
The remainder of this work has the following structure presented: Section 2 presents the mathematical formulation of the D-STATCOM optimal integration problem in power distribution systems via mixed-integer nonlinear programming models. Section 3 presents the proposed solution method, which is based on the GNDO and the successive approximations power flow approach, with the aim of determining the nodes where the D-STATCOMs must be located as well as their sizes. These nodes are also used as inputs for the ORPF formulation to reach additional reductions in the objective function value. 
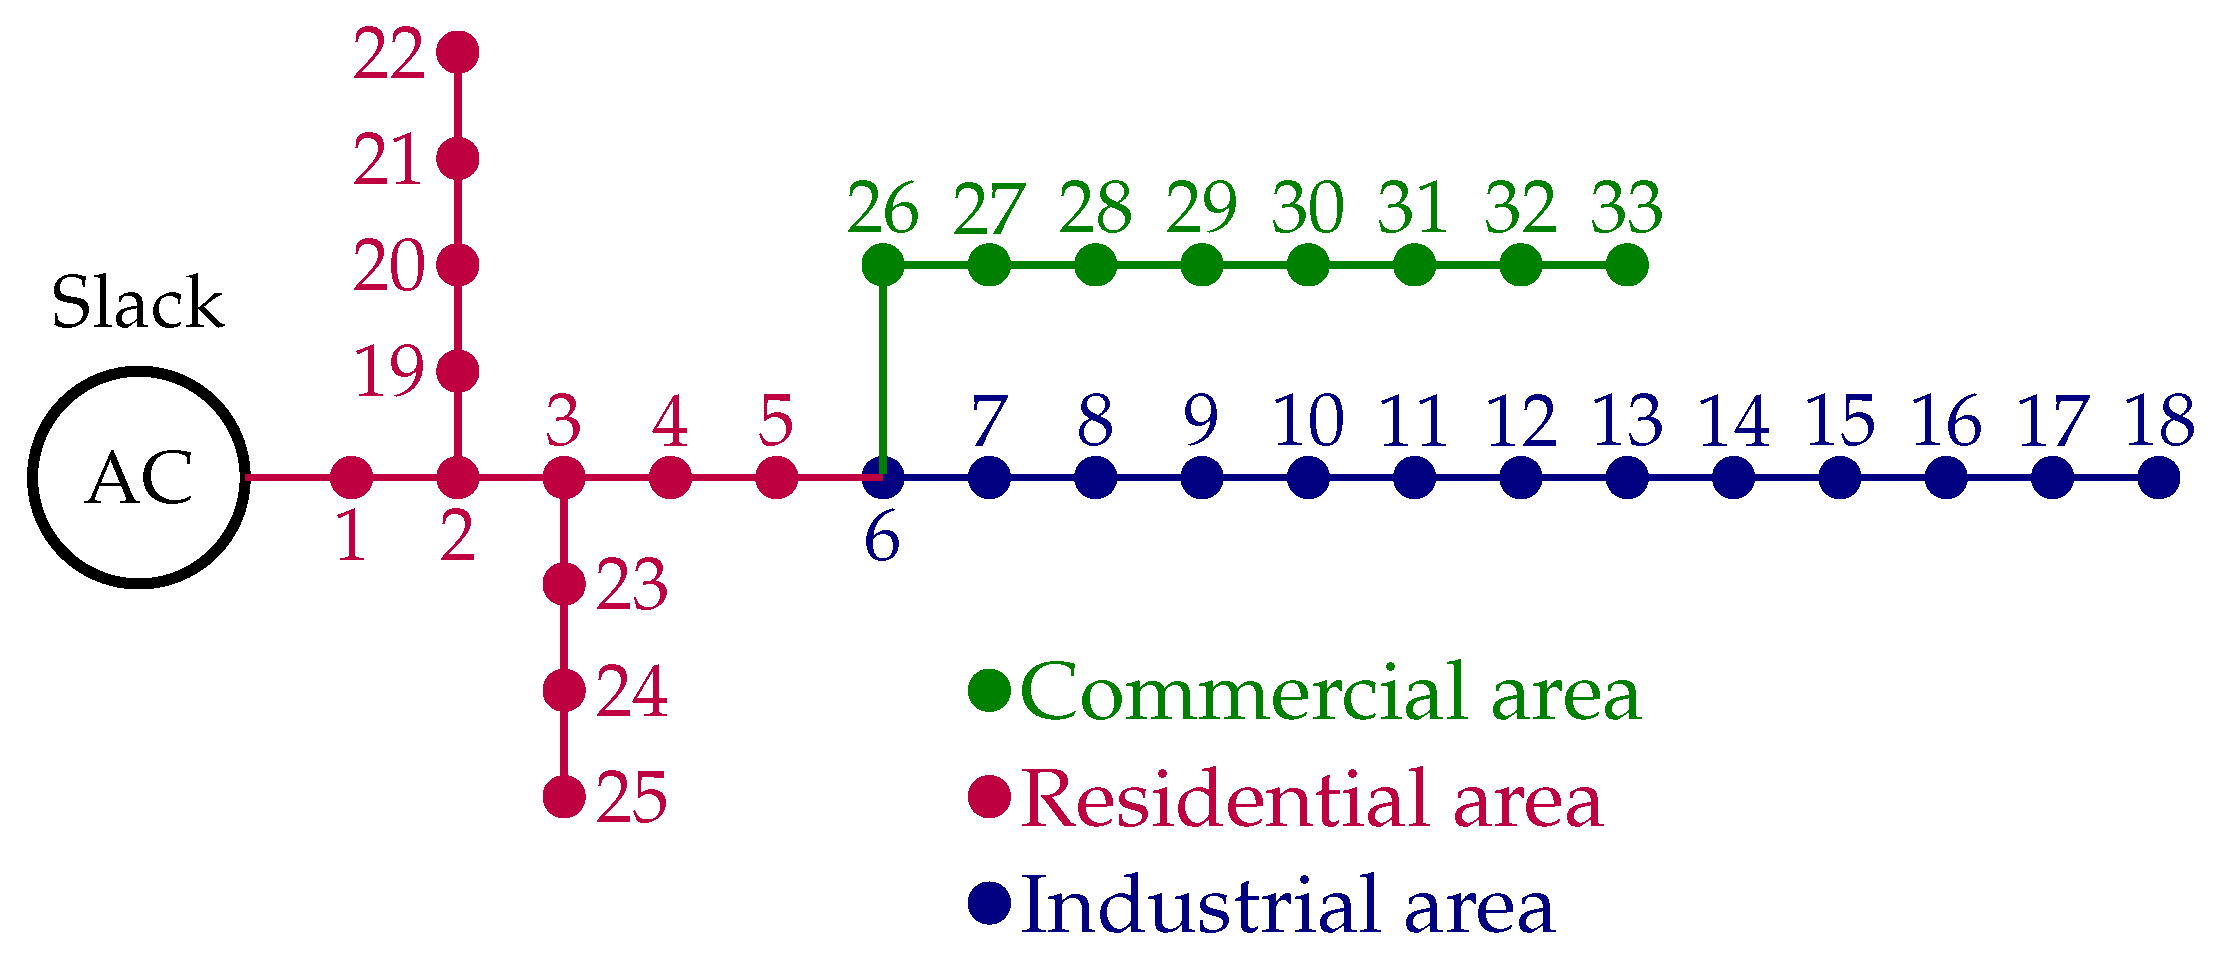
Section 4 outlines the main characteristics of the test system, which is a 33-node IEEE system that includes demand scenarios for residential, industrial, and commercial users. Section 5 presents the results of the simulation as well as its analysis and discussion. Finally, Section 6 describes the main conclusions derived from this study.

2. Mathematical Formulation

This section formulates the problem regarding the optimal location and size of D-STATCOMs in electrical distribution networks as a general mixed-integer nonlinear programming (MINLP) model. The continuous variables of the model denote the voltages, angles, and active and reactive power variables, while the discrete variables correspond to the possibility of integrating D-STATCOMs in all the nodes of the distribution network. In addition, these equations take a nonlinear form due to the products between them and the trigonometric functions in the power balance equations. The complete MINLP model of the studied problem is presented below.

2.1. Objective Function Structure

The problem under study is addressed in this research from an economic perspective. The main idea of installing these devices is to minimize the expected operating cost of the network, which is mainly associated with the energy loss costs for a one-year period of operation ( f 1 ), to which the annualized investments in D-STATCOMs ( f 2 ) are added.
f 1 = C k W h T h H k N m N Y k m V k h V m h cos δ k h δ m h θ k m Δ h ,
f 2 = T k 1 k 2 k N α Q k s t 2 + β Q k s t + γ Q k s t ,
where for f 1 and f 2 , C k W h corresponds to the average cost of energy in k W / h ; T represents a constant associated with the number of days in a regular year (length of the period of study); Y k m defines the magnitude of the admittance matrix that relates k node to m node, which also has an associated angle θ k m ; V k h and V m h are the voltages that relate nodes k and m in period of time h with voltage angles defined as δ k h and δ m h , respectively; Δ h is a period of time assigned as 1 h ; H and N refer to the set of time periods and nodes in the network, respectively; k 1 and k 2 are two positive parameters that denote the annualization costs of the D-STATCOMs (i.e., k 1 represents the annual investment required by the D-STATCOM, and k 2 refers to the useful life of the device); and the parameters α , β , and γ are positive scalars that represent the installation costs of the D-STATCOMs with nominal power and generation capacity Q k s t .
It is worth mentioning that Equation (1) is the most typical representation of power and energy losses in distribution networks, and it can be expressed as the difference between the energy input (energy injected by power sources) and energy output (energy consumed by constant power loads) [23]. However, this is typically represented by the product between voltages and trigonometric functions of their angles, as this allows evidencing the effect of the power balance constraints (which are presented later in this document) regarding variations in active or reactive power injection. In the case of the quantification of the investment costs of D-STATCOMs, as defined by Equation (2), this function was adapted from [19], where the authors presented different cubic functions to represent the costs of variable reactive power compensators based on power electronics for power system applications.
The objective function corresponding to the object of minimization is defined in this research as the sum of the components f 1 and f 2 , as presented in Equation (3) for the variable A f .
min A f = f 1 + f 2 ,
where A f is denoted as the objective function value to be minimized.
Remark 1. 
The structure of the objective function (3) is nonlinear and non-convex due to the following facts: (i) the component f 1 is defined as a product between the continuous variables (voltages) and the trigonometric function of the voltage angles, and (ii) the component f 2 is a cubic function defined with the expected sizes of the D-STATCOMs, which makes the final function value A f a complex nonlinear objective function that requires advanced optimization techniques in order to obtain a solution.
In this research, to solve the complex objective function regarding the installation and sizing of D-STATCOMs in distribution grids with radial or meshed structures, the GNDO approach is combined with the successive approximations power flow method. In addition, an improving stage based on the ORPF problem is implemented in order to obtain additional reductions in the final A f by fixing the location of the D-STATCOMs determined via the GNDO approach.

2.2. Set of Constraints

To establish the location and size of D-STATCOMs in radial and meshed distribution networks, it is necessary to observe several constraints regarding the physical operation of the distribution network. Some of these have to do with active and reactive power balance, voltage grid regulation characteristics, and the sizes of the reactive power compensation devices. These constraints are listed below and defined for k N and h H .
P k h g P k h d = m N Y k m V k h V m h cos δ k h δ m h θ k m ,
Q k h g Q k h d + Q k s t = m N Y k m V k h V m h sin δ k h δ m h θ k m ,
V min V k , h V max ,
Z k Q min s t Q k s t Z k Q max s t ,
k N Z k N A s t ,
where Q k s t is the reactive injection generated by the D-STATCOM at node k; the variables P k h g and Q k h g are the active and reactive power injection in power sources connected to k in the period h; the parameters Q k h d and P k h d are the dynamical loads associated with node k at time h, which are defined as a function of the residential, industrial, and commercial users connected to the distribution grid; Z k is a binary variable (i.e., it takes values of 0 or 1) that indicates the connection or not of a D-STATCOM at node k; and N A s t corresponds to the maximum number of D-STATCOMs that can be installed in the distribution network.
Constraints (4)–(7) can be interpreted as follows. Equations (4) and (5) defines the power balance constraints at each node of the network for each period. These are known as the power flow constraints [28]. Inequality constraint (6) refers to the voltage regulation imposed by the regulatory entities for the adequate operation of the distribution network [29]. Inequality constraint (7) concerns the upper and lower bounds assigned for the D-STATCOMs that are to be installed in the distribution network. Finally, inequality constraint (8) is associated with the maximum number of D-STATCOMs that can be placed in the distribution grid.

3. Proposed Solution Method

To solve the complex MINLP formulation in Equations (1)–(8), this research presents a two-stage optimization model. In the first stage, a master–slave optimization algorithm based on the GNDO approach and the successive approximations power flow method is implemented in order to determine the nodes where the D-STATCOMs must be placed as well as their initial sizing. In the second stage, an approach of improvement is implemented, which involves solving the ORPF problem by fixing the nodes where the D-STATCOMs must be located and recalculating their sizes. Each of the previous stages and algorithms are presented in this section.

3.1. Master–Slave Optimization Algorithm

This subsection discusses the master–slave approach, which comprises the GNDO and the successive approximations power flow method.

Slave Stage: Successive Approximations Power Flow Method

This power flow method is a well-known approach that reformulates Equations (4) and (5) using a complex equivalent in order to find a solution for radial and meshed distribution networks. This method was initially proposed by [30], who were inspired by the classical Gauss–Seidel power flow approach. The general iterative power flow formula for the successive approximations power flow method is defined in Equation (9). Note that the dimensions of vectors and matrices for the successive approximations power flow method and a numerical example can be consulted in [31].
V d h m + 1 = Y d d 1 diag 1 V d h m , S s t h S d h Y d s V s h , h H
where V d h is the vector containing all the voltage demand variables for the period of time h; V s h is the vector that contains the slack voltage output in the period of time h; Y d d represents a square matrix containing the admittance relation of the demand nodes; Y d s is a rectangular matrix that associates the demand nodes with the slack source regarding their admittance interconnections; S s t h is a vector that contains all the reactive power injections provided by the D-STATCOMs in the nodes where they are connected (note that the reactive power injection is zero at nodes where there are no D-STATCOMs); and S d h is a complex vector comprising the constant power consumption of the distribution network per period of time h. Note that m represents the iteration counter, and the recursive power flow formula in Equation (9) converges if the following criterion is met:
max V d h m + 1 V d h m ϵ .
It is worth mentioning that in Equation (10), the stopping criterion has to be reached before the maximum number of iterations. Here, ϵ is the assigned tolerance.
Remark 2. 
The main advantage of using the successive approximations power flow method to deal with the power flow problem in radial and meshed distribution grids is that it ensures convergence to the solution if the grid is connected (there are no isolated areas) and is operating far from the voltage collapse point. Its convergence can be demonstrated by applying the Banach fixed-point theorem [30].
Once the recursive power flow formula (9) has converged to the power flow solution, the power generation in the slack source can be calculated as presented in Equation (11).
S s h * = diag V s h * Y s s V s h + Y s d V d h h H .
With this solution, it is possible to evaluate the expected annual energy loss cost of the distribution grid ( f 1 ), as stated in the objective function. In addition, the constraint regarding voltage regulation is checked, (i.e., see inequality constraint (6)). If it is fulfilled, then a zero value is added to the objective function; if not, then a penalization regarding the amplitude of the voltage deviation with respect to its upper and lower bounds is added to the objective function value. Note that adding penalty factors to the objective function is a typical approach employed to find feasible solutions while exploring and exploiting the solution space. More details about penalty factors in metaheuristics can be consulted in [32].

3.2. Master Stage: GNDO

The GNDO approach is a recently developed metaheuristic optimization approach based on the behavior of the Gaussian distribution that can model multiple physical and natural phenomena with a high level of precision [26]. This metaheuristic optimization method is part of the mathematics-inspired approaches, and it uses two main parameters to explore and exploit the solution space: the mean value ( μ ) and the standard deviations ( δ ). In addition, the GNDO approach considers two main steps during this process: local and global searching, which are discussed below.

3.2.1. Local Exploration

Local exploration is a common search technique in metaheuristic-based optimization methods, the main idea of which is to explore in the vicinity of a current solution (i.e., minimum variations) in order to find a better one. In other words, it is an exploitation stage. The rule defined in the GNDO for this exploration is defined below:
v i t = μ i + δ i η , i = 1 , 2 , , N i ,
where v i t corresponds to the trailing vector associated with the current solution i at iteration t; μ i denotes the generalized mean location of the individual solution i during iteration t; δ i corresponds to the generalized standard deviation of this solution; and η is a penalty factor. It is worth mentioning that N i is a constant parameter related to the number of individuals that make up the algorithm population.
For the optimal location and sizing problem regarding D-STATCOMs in radial and meshed distribution networks, the proposed codification is a discrete–continuous representation, where the integer part defines the nodes where the compensators must be installed, and the continuous part of the codification corresponds to their optimal sizes. Equation (13) presents the proposed codification.
x i t = 15 , k , , 28 | 1.3566 , Q k s t , , 2.0101
Remark 3. 
It is important to observe that with the codification presented in Equation (13), the objective function component related to the D-STATCOM investment costs ( f 2 ) is completely known.
To determine the value of the parameters μ i , δ i , and η defined in Equation (12), the following set of equations is used:
μ i = 1 3 x i t + x best t + M ,
δ i = 1 3 x i t μ 2 + x best t μ 2 + M μ 2 1 2 ,
η = log λ 1 1 2 cos 2 π λ 2 if a b log λ 1 1 2 cos 2 π λ 2 + π if a > b
In Equations (14)–(16), it can be noted that:
  • The parameters a, b, λ 1 , and λ 2 are values generated with a uniform distribution in the interval 0 1 ;
  • x best t represents the best current solution reached as of iteration t;
  • M is a vector that represents the average (mean value) associated with all the individuals in the current population.
To calculate the vector M, Equation (17) is used.
M = 1 N i i = 1 N i x i t .

3.2.2. Global Exploration

Global exploration is an intrinsic characteristic of combinatorial optimization methods, where the main idea is to explore the solution space in search of promissory solution regions that may contain the global optimum of the studied problem [24]. The global exploration stage, as proposed by the authors of [26], is defined in Equation (18).
v i t = x i t + β × | λ 3 | × v 1 + 1 β × | λ 4 | × v 2 ,
where β × | λ 3 | × v 1 is a component associated with information regarding the local exploration, and 1 β × | λ 4 | × v 2 is a component related to the global exploration stage. Note that λ 3 and λ 4 denote random numbers generated with a normal distribution, and β is an adjusting parameter contained in the interval 0 1 , which is randomly obtained using a uniform distribution. In addition, v 1 and v 2 are also two trail vectors obtained with the following rules:
v 1 = x i t x j t if A f x i t < A f x j t x j t x i t otherwise
v 2 = x k t x k t if A f x k t < A f x m t x m t x k t otherwise
Note that subscripts j, k, and m correspond to integer numbers between 1 and N i that are associated with three different individuals contained in the population x t . These subscripts are different from each other as well as from the current individual i.
Prior to deciding which v i t will be part of the next population of individuals, it is mandatory to check its feasibility regarding the upper and lower limits of the decision variables, i.e.,
v i , l t = v i , l t if x l min v i , l t x l max v i , l t = x l min + λ 5 x l max x l min otherwise
where x j min and x j max are the lower and upper admissible bounds of variable j, respectively. Note that due to the integer nature of the variables regarding the nodes where the D-STATCOMs must be located, the first N A s t position of each solution vector is rounded to the nearest integer value. Finally, to select the solution that will be part of the next generation of individuals, the following selection rule is applied:
x i t + 1 = v i t if A f v i t < A f x i t x i t otherwise

3.2.3. Implementation of the GNDO Approach

As explained by Equations (9)–(22), to illustrate the application of the GNDO approach to the problem regarding the optimal placement and sizing of D-STATCOMs in electrical distribution grids, Algorithm 1 is used.
Algorithm 1: General application of the GNDO approach to select nodes and define sizes for D-STATCOMs in distribution networks.
Algorithms 16 00029 i001
Note that Algorithm 1 uses all of the formulas involved in the GNDO approach (9)–(22) in order to explore and exploit the solution space by dividing the search into local and global explorations.

3.3. Optimal Reactive Power Flow Solution

This improvement stage deals with defining the optimal sizes of the D-STATCOMs in the case of daily operation, i.e., considering variable reactive power injection throughout the operation scenario. To this effect, the first N A s t positions of the final best solution x best t , i.e., the nodes where the D-STATCOMs must be located, are fixed in the optimization model (1)–(8), which transforms the exact MINLP model into an NLP one known as the optimal reactive power flow problem [33].
To summarize the proposed improvement, a flow diagram is presented in Figure 1.
Remark 4. 
Note that the solution of the NLP problem in Figure 1 is independent of the optimization tool. However, this research resorts to the GAMS software, as it has been used in multiple literature reports with excellent numerical performance for power system optimization with low computational effort [34].

4. Test System Characterization

To demonstrate the efficiency and robustness of the proposed optimization, the IEEE 33-bus grid with radial and meshed configurations was employed [22]. The electrical configuration of this distribution grid is depicted in Figure 2. Note that this electrical system operates at substation terminals with a nominal voltage of 12.66 kV. In addition, the parametric information regarding the peak load consumption and distribution lines is presented in Table 2.
To consider the effect of load classification in the IEEE 33-bus grid for optimally locating and sizing the D-STATCOMs, the electrical curves of residential, industrial, and commercial users are shown in Table 3.
To calculate the objective function value regarding component f 2 (see Equation (2)), all the parameters listed in Table 4 are used [19,35]. Note that the evaluation of this objective function considers that the variable Q k s t is defined in Mvar.
In this research, the concept of a benchmark case is assigned to the scenario where the distribution system is operated without considering shunt compensation, i.e., it is the simulation scenario where the total active and reactive power consumptions are always supplied by the generation source, which, in the case of distribution networks, is the substation bus when there is no penetration of distributed energy resources. In the case of the IEEE 33-bus grid with a radial connection, the benchmark case is calculated with the parameters in Table 4, which corresponds only to an f 1 value of about USD 130 , 613.90 per year of operation, with f 2 being equal to zero since no D-STATCOMs are considered.

5. Results and Discussion

To validate the proposed solution methodology, the solution of the optimization model for locating and sizing D-STATCOMs in electrical distribution via the AESDC was implemented in MATLAB version R2021b on a computer with an Intel Core i7-10750H @2.6 GHz and 16.0 GB of DDR4 RAM at 2300 MHz on a 64-bit version of Microsoft Windows 10 Home. The validation of the proposed master–slave optimization model in conjunction with the improvement stage was carried out while considering the following facts:
  • Two configurations are considered for the IEEE 33-bus grid: a radial configuration with the original structure presented in Figure 2 and a meshed configuration with three tie-lines added to the radial topology, as proposed in [22].
  • The GNDO approach, combined with the successive approximations power flow method, is used to obtain the initial nodal locations and sizes for the D-STATCOMs with fixed reactive power injection. Thus, the location of these devices is fixed in the exact MINLP model while aiming for additional gains for operating these reactive power compensators with variable reactive power throughout the day.
  • For comparison, the MINLP model’s exact solutions obtained with the BONMIN and COUENNE solvers and the recently developed Salp Swarm Algorithm (SSA) [22] are considered in order to confirm the effectiveness and robustness of the proposed optimization approach.
Note that in order to ensure the effectiveness of the proposed master–slave optimization regarding the solution quality, 100 consecutive evaluations of the complete solution methodology were considered, with 1000 iterations for each of them. With these values, a statistical study of the GNDO performance was conducted considering mean, maximum, minimum, and standard deviation parameters. It is worth mentioning that in order to to make fair comparisons with the SSA approach presented by the authors of [22] as well as the implementation of the exact model in GAMS software with the BONMIN and COUNNE solvers, all results were obtained with our own implementations that were conducted during this research.
It is worth mentioning that in order to ensure that all the numerical validations presented in this paper were correct, the following validation procedure was followed.
  • The solution of the multi-period optimal power flow problem for the benchmark case was implemented in MATLAB with our own scripts. However, to ensure the effectiveness of this approach, a comparative analysis with the DIgSILENT software was performed.
  • The convergence analysis of the power flow problem for the proposed successive approximations power flow method was proven by the authors of [30], which implies that under the studied conditions this method always converges to the power flow solution.
  • The solution of the MINLP model with he GNDO approach combined with the successive approximations method was also validated via GAMS and DIgSILENT.

5.1. Radial Configuration Results

Table 5 shows the comparison between the SSA approach, the BONMIN and COUENNE solvers, and to the proposed GNDO approach that considers fixed reactive power injection throughout the day for the IEEE 33-bus system with a radial configuration.
The numerical results presented in Table 5 allow stating that:
  • The GAMS solvers (COUENNE and BONMIN) are stuck in locally optimal solutions, with reductions of 11.22 and 16.12%, respectively, with respect to the benchmark case. This can be attributed to the fact that the MINLP structure of the model (1)–(8) causes exact solution methods based on Branch and Bound and combined with interior point methods to get stuck in local solutions without the ability to escape from them because of the non-convexity of the solution space.
  • The proposed GNDO approach improved the best solution reported in the literature, which was obtained with the SSA approach, i.e., by about USD 33.42 per year of operation. This improvement was reached since the GNDO detected that node 14 is a better location for one of the D-STATCOMs, instead of node 13 as per the SSA approach.
  • The total installed reactive power obtained with the GNDO approach was 869.84 kvar, while the solution found with the SSA approach installed 891.99 kvar. This implies that the proposed GNDO approach improved the objective function value by selecting a better set of nodes to place the D-STATCOMs, with the main advantage being that less investment is required for these devices.
To demonstrate that the hourly variation of the reactive power injection with D-STATCOMs in distribution networks allows additional gains in the expected annual grid operating costs, Table 6 compares fixed and variable reactive power injection by fixing the nodes reached by the GNDO approach in the exact MINLP model (1)–(8) using the BONMIN solver as a solution method.
The results in Table 6 show that an additional reduction of USD 1665.25 is obtained when variable reactive power injection is implemented with D-STATCOMs. That is to say, this is in comparison with the fixed injection scenario. This additional profit is reached when the total installed capabilities of the D-STATCOMs increase to 1034.67 kvar, which in turn implies an increase of 164.83 kvar with respect to the fixed injection scenario. With this additional reactive power, the D-STATCOMS have more flexibility to generate variable reactive power, i.e., they gain the ability to follow the demand behavior in order to inject only the needed reactive power for each hour as a function of the total grid requirements.

5.2. Meshed Configuration Results

Table 7 presents the comparison between the SSA approach, the BONMIN and COUENNE solvers, and the proposed GNDO approach that considers fixed reactive power injection throughout the day for the IEEE 33-node grid with a meshed grid topology.
The numerical results shown in Table 7 imply that:
  • Once again, the COUENNE and BONMIN solvers got stuck in locally optimal solutions, which is attributed to the nonlinear non-convex nature of the exact MINLP model. The COUENNE solver only reached a reduction of 4.21 % with respect to the benchmark case, while the BONMIN solver yielded a better local solution, with a reduction of 6.61 % with respect to the benchmark.
  • The proposed GNDO approach found a solution with an expected reduction in the annual operative costs of about 10.45%, i.e., 0.04% better than the solution reported by the SSA approach. However, the main characteristic of both solutions is that these located the D-STATCOMs in the same set of nodes (14, 30, and 32). However, their sizes differ, which explains the difference in the final objective function value.
  • The total installed size of the D-STATCOMs with the GNDO is 731.83 kvar, whereas the SSA installed 742.90 kvar, which implies that with a better definition of the D-STATCOM sizes it is also possible to reach better final objective function values. Nevertheless, the main characteristic of this behavior is that based on its probability functions, the GNDO explored and exploited the solution space with better sensitivity than the SSA approach.
To confirm that the variable reactive power injections play an important role in reducing the expected annual operating costs of the network with respect to the fixed injection case, the results presented in Table 8 are employed.
The results in Table 8 show that the scenario with variable reactive power injection finds additional improvements regarding the final objective function value, i.e., approximately USD 136.89 per year of operation when compared with the fixed reactive power injection case. This result confirms that the main advantage of using D-STATCOMs is that variable reactive power is injected as a function of the network requirements, which justifies the distribution of static compensators instead of capacitor banks in order to support reactive power in distribution grids with variable demand behavior.

5.3. Additional Results

With the purpose of demonstrating the effectiveness and robustness of the GNDO approach in conjunction with the successive approximations power flow method, after 100 consecutive evaluations for the radial and meshed grid structures, the results in Table 9 show the statistical analysis for both simulation cases.
The results in Table 9 show that:
  • The difference between the minimum and maximum values reached in the radial configuration was about USD 8776.59, which implies that in the worst simulation case, the expected reductions with respect to the benchmark case would be 10.43%. When compared to the results shown in Table 5, this is better than both GAMS solutions. Even if the maximum result (worst result of the GNDO method) for the radial simulation case is a local solution, it has better characteristics than the local optimal solutions found with the MINLP BONMIN and COUENNE solvers in GAMS.
  • As for the meshed configuration, the difference between the maximum and minimum objective function values was USD 2397.22, i.e., the worst solution reached by the GNDO approach reduces the expected annual operating costs by about 7.69%. This result confirms that for the meshed configuration case, the worst solution of the GNDO approach is also better than both solutions found with the GAMS software and with the BONMIN and COUENNE solvers.
  • The mean values for the radial and meshed configurations are very close to the minimum values, i.e., most of the solutions are closer to each other in a closed ball with a radius equivalent to the standard deviation. These results confirm the effectiveness of the GNDO approach at solving the complex optimization problem involving the optimal location and size of D-STATCOMs in distribution grids via combinatorial optimization, with the main advantage that less than 43 s is required to reach a solution in both simulation cases.

6. Conclusions and Future Work

The optimal reactive power compensation problem via D-STATCOM location and sizing was studied in this research through the application of master–slave optimization methodology that solves its exact MINLP formulation. In the master stage, the GNDO approach was implemented using a discrete codification that decided the nodes where the D-STATCOMs were to be located in conjunction with their optimal sizes. In the slave stage, a power flow method (the successive approximations approach) was used to define the expected energy loss costs for a daily operation horizon. An improvement stage was implemented in the exact MINLP model that involved fixing the location of the D-STATCOMs provided by the master–slave optimizer in order to obtain an NLP model that could vary the reactive power injection on an hourly basis in order to obtain additional profits for the distribution company.
The numerical simulations run in the IEEE 33-bus system with radial and meshed configurations while including residential, industrial, and commercial users demonstrated that:
  • In the radial configuration scenario, the proposed GNDO approach reached a lower minimum objective function value than the SSA approach. In addition, the improvement stage allowed for an additional reduction of USD 1665.25 regarding the fixed injection case, which confirms that the variable reactive power scenario via the daily control of the D-STATCOMs allows the distribution company to obtain additional profits in the total annual expected operating costs of the network.
  • In the meshed configuration, the proposed GNDO approach found the same nodal location for the D-STATCOMs as the SSA methodology. However, the sizing was better, which allowed for a better final objective function value. In the variable reactive power scenario, an additional profit of USD 186.39 with respect to the fixed injection scenario was also reached, thus confirming that controlling the reactive power injection as a function of the system’s requirements is the better option to operate D-STATCOMs based on utilities.
  • The expected annual operative gains for the meshed topology are considerably lower than those of the radial grid, i.e., USD 9080.32 for the meshed cased vs. USD 22,397.96 for the radial case. This is an expected result since in meshed configurations the energy losses are lower when compared to radial configurations, which is attributed to better flow distribution and voltage profiles.
  • Regarding the processing times, the proposed GNDO approach found the solution for the MINLP model in less than one minute for both topologies, which confirms the effectiveness and robustness of the master–slave optimization methodology to deal with complex electrical engineering problems involving solution spaces with infinite dimensions and complex nonlinear, non-convex constraints.
In future work, the following studies can be conducted: (i) combining the D-STATCOMs with renewable generators in radial and meshed distribution grids by defining their sizes and locations in order to reduce the grid investments and the operating and maintaining costs; and (ii) a comparative study between different reactive power compensators such as D-STATCOMs, Thyristor-controlled series compensators (TCSCs), and Static VAR Compensators (SVCs), as well as their impact on the expected annual grid operating costs.

Author Contributions

Conceptualization, methodology, software, and writing (review and editing): L.P.G.-P. and O.D.M. All authors have read and agreed to the published version of the manuscript.

Funding

This research received no external funding.

Institutional Review Board Statement

Not applicable.

Informed Consent Statement

Not applicable.

Data Availability Statement

Not applicable.

Acknowledgments

This work is derived from the undergraduate project Compensación óptima de potencia reactiva con D-STATCOMs en sistemas de distribución empleando el algoritmo de distribución normal generalizada, submitted by Laura Patricia Garcá Pineda to the Electrical Engineering Program of the Department of Engineering of Universidad Distrital Francisco José de Caldas as a partial requirement for obtaining a Bachelor’s degree in Electrical Engineering.

Conflicts of Interest

The authors declare no conflict of interest.

References

  1. Siano, P.; Rigatos, G.; Piccolo, A. Active Distribution Networks and Smart Grids: Optimal Allocation of Wind Turbines by Using Hybrid GA and Multi-Period OPF. In Atlantis Computational Intelligence Systems; Atlantis Press: Amsterdam, The Netherlands, 2012; pp. 579–599. [Google Scholar] [CrossRef]
  2. Lakshmi, S.; Ganguly, S. Transition of Power Distribution System Planning from Passive to Active Networks: A State-of-the-Art Review and a New Proposal. In Sustainable Energy Technology and Policies; Springer: Singapore, 2017; pp. 87–117. [Google Scholar] [CrossRef]
  3. Goldemberg, J.; Prado, L.T. The “decarbonization” of the world’s energy matrix. Energy Policy 2010, 38, 3274–3276. [Google Scholar] [CrossRef]
  4. León-Vargas, F.; García-Jaramillo, M.; Krejci, E. Pre-feasibility of wind and solar systems for residential self-sufficiency in four urban locations of Colombia: Implication of new incentives included in Law 1715. Renew. Energy 2019, 130, 1082–1091. [Google Scholar] [CrossRef]
  5. López, A.R.; Krumm, A.; Schattenhofer, L.; Burandt, T.; Montoya, F.C.; Oberländer, N.; Oei, P.Y. Solar PV generation in Colombia—A qualitative and quantitative approach to analyze the potential of solar energy market. Renew. Energy 2020, 148, 1266–1279. [Google Scholar] [CrossRef]
  6. Krishna, T.M.; Ramana, N.; Kamakshaiah, S. A novel algorithm for the loss estimation and minimization of radial distribution system with distributed generation. In Proceedings of the 2013 International Conference on Energy Efficient Technologies for Sustainability, Nagercoil, India, 10–12 April 2013; pp. 1289–1293. [Google Scholar]
  7. Nasir, M.; Shahrin, N.; Bohari, Z.; Sulaima, M.; Hassan, M. A Distribution Network Reconfiguration based on PSO: Considering DGs sizing and allocation evaluation for voltage profile improvement. In Proceedings of the 2014 IEEE Student Conference on Research and Development, Penang, Malaysia, 16–17 December 2014; pp. 1–6. [Google Scholar]
  8. Vita, V. Development of a Decision-Making Algorithm for the Optimum Size and Placement of Distributed Generation Units in Distribution Networks. Energies 2017, 10, 1433. [Google Scholar] [CrossRef] [Green Version]
  9. Verma, H.K.; Singh, P. Optimal reconfiguration of distribution network using modified culture algorithm. J. Inst. Eng. Ser. B 2018, 99, 613–622. [Google Scholar] [CrossRef]
  10. Sultana, S.; Roy, P.K. Optimal capacitor placement in radial distribution systems using teaching learning based optimization. Int. J. Electr. Power Energy Syst. 2014, 54, 387–398. [Google Scholar] [CrossRef]
  11. Kerrouche, K.D.E.; Lodhi, E.; Kerrouche, M.B.; Wang, L.; Zhu, F.; Xiong, G. Modeling and design of the improved D-STATCOM control for power distribution grid. SN Appl. Sci. 2020, 2, 1519. [Google Scholar] [CrossRef]
  12. Sirjani, R.; Jordehi, A.R. Optimal placement and sizing of distribution static compensator (D-STATCOM) in electric distribution networks: A review. Renew. Sustain. Energy Rev. 2017, 77, 688–694. [Google Scholar] [CrossRef]
  13. Rezaeian Marjani, S.; Talavat, V.; Galvani, S. Optimal allocation of D-STATCOM and reconfiguration in radial distribution network using MOPSO algorithm in TOPSIS framework. Int. Trans. Electr. Energy Syst. 2019, 29, e2723. [Google Scholar] [CrossRef]
  14. Tolabi, H.B.; Ali, M.H.; Rizwan, M. Simultaneous reconfiguration, optimal placement of DSTATCOM, and photovoltaic array in a distribution system based on fuzzy-ACO approach. IEEE Trans. Sustain. Energy 2014, 6, 210–218. [Google Scholar] [CrossRef]
  15. Gupta, A.R.; Kumar, A. Energy savings using D-STATCOM placement in radial distribution system. Procedia Comput. Sci. 2015, 70, 558–564. [Google Scholar] [CrossRef] [Green Version]
  16. Jazebi, S.; Hosseinian, S.H.; Vahidi, B. DSTATCOM allocation in distribution networks considering reconfiguration using differential evolution algorithm. Energy Convers. Manag. 2011, 52, 2777–2783. [Google Scholar] [CrossRef]
  17. Devi, S.; Geethanjali, M. Optimal location and sizing of distribution static synchronous series compensator using particle swarm optimization. Int. J. Electr. Power Energy Syst. 2014, 62, 646–653. [Google Scholar] [CrossRef]
  18. Gupta, A.R.; Kumar, A. Optimal placement of D-STATCOM in distribution network using new sensitivity index with probabilistic load models. In Proceedings of the 2015 2nd International Conference on Recent Advances in Engineering & Computational Sciences (RAECS), Chandigarh, India, 21–22 December 2015; pp. 1–6. [Google Scholar]
  19. Sharma, A.K.; Saxena, A.; Tiwari, R. Optimal Placement of SVC Incorporating Installation Cost. Int. J. Hybrid Inf. Technol. 2016, 9, 289–302. [Google Scholar] [CrossRef]
  20. Sirjani, R. Optimal placement and sizing of PV-STATCOM in power systems using empirical data and adaptive particle swarm optimization. Sustainability 2018, 10, 727. [Google Scholar] [CrossRef] [Green Version]
  21. Tuzikova, V.; Tlusty, J.; Muller, Z. A novel power losses reduction method based on a particle swarm optimization algorithm using STATCOM. Energies 2018, 11, 2851. [Google Scholar] [CrossRef] [Green Version]
  22. Mora-Burbano, J.A.; Fonseca-Díaz, C.D.; Montoya, O.D. Application of the SSA for Optimal Reactive Power Compensation in Radial and Meshed Distribution Using D-STATCOMs. Algorithms 2022, 15, 345. [Google Scholar] [CrossRef]
  23. Garrido, V.M.; Montoya, O.D.; Medina-Quesada, Á.; Hernández, J.C. Optimal Reactive Power Compensation in Distribution Networks with Radial and Meshed Structures Using D-STATCOMs: A Mixed-Integer Convex Approach. Sensors 2022, 22, 8676. [Google Scholar] [CrossRef]
  24. Zhang, Y. An improved generalized normal distribution optimization and its applications in numerical problems and engineering design problems. Artif. Intell. Rev. 2022. [Google Scholar] [CrossRef]
  25. Abdel-Basset, M.; Mohamed, R.; Abouhawwash, M.; Chang, V.; Askar, S. A Local Search-Based Generalized Normal Distribution Algorithm for Permutation Flow Shop Scheduling. Appl. Sci. 2021, 11, 4837. [Google Scholar] [CrossRef]
  26. Zhang, Y.; Jin, Z.; Mirjalili, S. Generalized normal distribution optimization and its applications in parameter extraction of photovoltaic models. Energy Convers. Manag. 2020, 224, 113301. [Google Scholar] [CrossRef]
  27. Lazarou, S.; Vita, V.; Christodoulou, C.; Ekonomou, L. Calculating Operational Patterns for Electric Vehicle Charging on a Real Distribution Network Based on Renewables’ Production. Energies 2018, 11, 2400. [Google Scholar] [CrossRef] [Green Version]
  28. Marini, A.; Mortazavi, S.; Piegari, L.; Ghazizadeh, M.S. An efficient graph-based power flow algorithm for electrical distribution systems with a comprehensive modeling of distributed generations. Electr. Power Syst. Res. 2019, 170, 229–243. [Google Scholar] [CrossRef]
  29. Kaur, S.; Kumbhar, G.; Sharma, J. A MINLP technique for optimal placement of multiple DG units in distribution systems. Int. J. Electr. Power Energy Syst. 2014, 63, 609–617. [Google Scholar] [CrossRef]
  30. Montoya, O.D.; Gil-González, W. On the numerical analysis based on successive approximations for power flow problems in AC distribution systems. Electr. Power Syst. Res. 2020, 187, 106454. [Google Scholar] [CrossRef]
  31. Herrera-Briñez, M.C.; Montoya, O.D.; Alvarado-Barrios, L.; Chamorro, H.R. The Equivalence between Successive Approximations and Matricial Load Flow Formulations. Appl. Sci. 2021, 11, 2905. [Google Scholar] [CrossRef]
  32. Liang, Y.C.; Juarez, J.R.C. A normalization method for solving the combined economic and emission dispatch problem with meta-heuristic algorithms. Int. J. Electr. Power Energy Syst. 2014, 54, 163–186. [Google Scholar] [CrossRef]
  33. Ara, A.L.; Kazemi, A.; Gahramani, S.; Behshad, M. Optimal reactive power flow using multi-objective mathematical programming. Sci. Iran. 2012, 19, 1829–1836. [Google Scholar] [CrossRef]
  34. Soroudi, A. Power System Optimization Modeling in GAMS; Springer International Publishing: Berlin/Heidelberg, Germany, 2017. [Google Scholar] [CrossRef]
  35. Saravan, M.; Slochanal, S.; Venkatesh, P.; Abraham, P. Application of PSO technique for optimal location of FACTS devices considering system loadability and cost of installation. In Proceedings of the 2005 International Power Engineering Conference, Singapore, 29 November–2 December 2005. [Google Scholar] [CrossRef]
Figure 1. General flow diagram of the proposed solution methodology.
Algorithms 16 00029 g001
Figure 2. Nodal connections between nodes in the IEEE 33-bus grid with load classifications.
Algorithms 16 00029 g002
Table 1. Main literature reports regarding the optimal placement and sizing of D-STATCOMs in distribution grids.
Solution MethodObjective FunctionRef.Year
Evolutionary programmingPower loss minimization and voltage profile improvement[16]2011
Particle swarm optimizationPower loss minimization and voltage profile improvement[17]2014
Sensitivity indexPower loss minimization and voltage profile improvement[18]2015
Gravitational search algorithmPower loss minimization, voltage profile improvement, and investment cost minimization[19]2016
Adaptive particle swarm optimizationEnergy loss and investment cost minimization[20]2018
Particle swarm optimizationEnergy loss minimization[21]2018
Salp swarm algorithmEnergy loss and investment cost minimization[22]2022
Two-stage convex optimization modelEnergy loss and investment cost minimization[23]2022
Table 2. Load and distribution line parameters of the IEEE 33-bus grid.
Node iNode j R ij ( Ω ) X ij ( Ω ) P j (kW) Q j (kvar)Node iNode j R ij ( Ω ) X ij ( Ω ) P j (kW) Q j (kvar)
120.09220.04771006017180.73200.57409040
230.49300.251190402190.16400.15659040
340.36600.18641208019201.50421.35549040
450.38110.1941603020210.40950.47849040
560.81900.7070602021220.70890.93739040
670.18720.61882001003230.45120.30839050
781.71141.235120010023240.89800.7091420200
891.03000.7400602024250.89600.7011420200
9101.04000.740060206260.20300.10346025
10110.19660.0650453026270.28420.14476025
11120.37440.1238603527281.05900.93376020
12131.46801.1550603528290.80420.700612070
13140.54160.71291208029300.50750.2585200600
14150.59100.5260601030310.97440.963015070
15160.74630.5450602031320.31050.3619210100
16171.28901.7210602032330.34100.53026040
Table 3. Expected percentages of consumption for residential, industrial, and commercial users.
HourInd. (pu)Res. (pu)Com. (pu)
10.560.690.20
20.540.650.19
30.520.620.18
40.500.560.18
50.550.580.20
60.580.610.22
70.680.640.25
80.800.760.40
90.900.900.65
100.980.950.86
1110.980.90
120.9410.92
130.950.990.89
140.960.990.92
150.910.94
160.830.960.96
170.780.961
180.720.940.88
190.710.930.76
200.700.920.73
210.690.910.65
220.670.880.5
230.650.840.28
240.600.720.22
Table 4. Parametric information to evaluate the objective function regarding the investment costs of the D-STATCOMs.
Par.ValueUnitPar.ValueUnit
C kWh 0.1390USD*kWhT365Days
Δ h 0.50h α 0.30USD/MVAr 3
β −305.10USD*MVAr 2 γ 127,380USD/MVAr
k 1 6/21901/Days k 2 10Years
Table 5. Optimal solutions obtained by the studied optimization methods for a radial grid configuration.
MethodNodesSizes (Mvar)Annual Costs (USD/year)Red. (%)
Ben. Case130,613.900.00
COUENNE 5 6 11 0.0000 0.53600 0.27466 115,960,9911.22
BONMIN 8 25 30 0.29796 0.09204 0.51265 109,560.8516.12
SSA 13 25 30 0.25851 0.10547 0.52801 108,249.3617.12
GNDO 14 25 30 0.23083 0.09996 0.53905 108,215.9417.15
Table 6. Additional improvements reached when variable reactive power is used for daily compensation with D-STATCOMs for the radial grid configuration.
MethodNodesSizes (Mvar)Annual Costs (USD/year)Red. (%)
Ben. Case130,613.900.00
GNDO (Fixed) 14 25 30 0.23083 0.09996 0.53905 108,215.9417.15
GNDO (Variable) 14 25 30 0.24092 0.10118 0.69257 106,550.6918.42
Table 7. Optimal solutions reached by the comparison and proposed optimization methods with fixed reactive power injection in a meshed grid configuration.
MethodNodesSizes (Mvar)Annual Costs (USD/year)Red. (%)
Ben. Case86,914.740.00
COUENNE 5 6 11 0.0000 0.32577 0.23872 83,254.954.21
BONMIN 15 16 17 0.11818 0.00391 0.34700 81,171.766.61
SSA 14 30 32 0.14620 0.39440 0.20230 77,870.1710.41
GNDO 14 30 32 0.11554 0.46482 0.15147 77,834.4210.45
Table 8. Additional improvements reached when variable reactive power is used for daily compensation with D-STATCOMs for the meshed grid configuration.
MethodNodesSizes (Mvar)Annual Costs (USD/year)Red. (%)
Ben. Case86,914.740.00
GNDO (Fixed) 14 30 32 0.11554 0.46482 0.15147 77,834.4210.45
GNDO (Variable) 14 30 32 0.11578 0.49915 0.17417 77.697.5310.60
Table 9. Statistical analysis for the radial and meshed configurations of the IEEE 33-bus grid.
CaseMin. (USD/year)Max. (USD/year)Mean (USD/year)Std. Dev. (USD/year)Time (s)
Radial108,215.94116,992.53109,373.202053.0442.70
Meshed77,834.4280,231.6478,256.17597.0142.94
Disclaimer/Publisher’s Note: The statements, opinions and data contained in all publications are solely those of the individual author(s) and contributor(s) and not of MDPI and/or the editor(s). MDPI and/or the editor(s) disclaim responsibility for any injury to people or property resulting from any ideas, methods, instructions or products referred to in the content.

