Review

Polymer Models of Chromatin Imaging Data in Single Cells

1
Berlin Institute for Medical Systems Biology, Max-Delbrück Centre (MDC) for Molecular Medicine, 10115 Berlin, Germany
2
Dipartimento di Fisica, Università di Napoli Federico II, and INFN Napoli, Complesso Universitario di Monte Sant’Angelo, 80126 Naples, Italy
3
Berlin Institute of Health (BIH), MDC-Berlin, 10178 Berlin, Germany
*
Author to whom correspondence should be addressed.
Algorithms 2022, 15(9), 330; https://doi.org/10.3390/a15090330
Submission received: 27 August 2022 / Revised: 13 September 2022 / Accepted: 14 September 2022 / Published: 16 September 2022
(This article belongs to the Special Issue Algorithms for Biomedical Image Analysis and Processing)

Abstract

:
Recent super-resolution imaging technologies enable tracing chromatin conformation with nanometer-scale precision at the single-cell level. They revealed, for example, that human chromosomes fold into a complex three-dimensional structure within the cell nucleus that is essential to establish biological activities, such as the regulation of the genes. Yet, to decode from imaging data the molecular mechanisms that shape the structure of the genome, quantitative methods are required. In this review, we consider models of polymer physics of chromosome folding that we benchmark against multiplexed FISH data available in human loci in IMR90 fibroblast cells. By combining polymer theory, numerical simulations and machine learning strategies, the predictions of the models are validated at the single-cell level, showing that chromosome structure is controlled by the interplay of distinct physical processes, such as active loop-extrusion and thermodynamic phase-separation.

1. Introduction

Mammalian genomes are folded into a complex three-dimensional (3D) architecture in the cell nucleus, including a large-scale structure of chromosomal interactions [1,2,3,4] that involves, for instance, DNA loops [5], topologically associated domains (TADs) [6,7] and higher-order contacts, such as meta-TADs [8] and A/B compartments [9]. Such a nested 3D organization serves important functional roles, as genes and their distal regulators form specific physical contacts to control transcriptional regulation [1,2]. Indeed, for example, disruption of TADs due to genomic structural rearrangements, such as deletions or inversions, has been linked to ectopic gene-regulator contacts, resulting in gene misexpression and disease [10,11,12,13].
In the last decade, powerful technologies based on super-resolution microscopy approaches enabled to probe the 3D conformation of the genome with nanometer-scale precision in single nuclei [14,15,16,17]. Those techniques revealed, for instance, that TADs exist at the single-cell level, they broadly vary from cell to cell and correspond to spatially segregated globular 3D conformations, confining, e.g., the activity of the regulators to their proper target genes [15].
Those recent experiments triggered questions on the nature of chromatin contacts and their origin: what are the mechanisms that shape genome 3D structure? What methods can be developed to identify them? In this review, we discuss the application of models from polymer physics to understand the machinery that establish chromosome architecture in the nucleus of the cells. In particular, we focus on two recently proposed models of folding that rely on two different physical processes, respectively, loop-extrusion and polymer phase-separation. In the first process, spatial proximity between distal DNA sites is achieved by molecular motors that stochastically bind to DNA and extrude a polymer loop in an out-of-equilibrium, active (e.g., ATP-dependent) physical process [18,19,20,21,22,23,24], and in the second, distal genomic sites are tethered together by interactions mediated, e.g., by diffusing cognate molecular particles, such as transcription factors, or by direct interactions produced, for example, by DNA-bound histone molecules [12,25,26,27,28,29,30,31,32,33,34,35,36,37,38,39,40]. By taking as a case study a 2 Mb wide chromatin region in human IMR90 cells where super-resolution multiplexed FISH data are available [15], we combine those distinct physical mechanisms into polymer models that we investigate by massive computer simulations (see Methods). We show that both loop-extrusion and phase-separation significantly recapitulate microscopy data, hinting that both processes can reliably coexist to determine the structure of chromosomes at the single-cell level [28].

2. Methods

In the studied models, chromatin is represented as a polymer chain of non-overlapping beads, subject to standard physical potentials derived from classical studies of polymer simulations [41,42]. Specifically, adjacent beads along the polymer are tethered by an elastic FENE potential and their overlap is prevented by a repulsive Weeks–Chandler–Anderson (WCA) potential. In the loop-extrusion (LE) model, the extruding motors are modelled as harmonic springs that can extrude loops by a translocation along the polymer chain, i.e., at each simulation step the spring is updated from the bead pair (i,j) to (i − 1,j + 1). As broadly reported in the literature [18,19,20,21,22,23], those springs cannot pass through each other, their number is fixed and they halt translocation when they collide with another extruding motor or anchor sites with opposite orientation, or they stochastically unbind from the polymer. A typical parameter choice in the simulations is to set the LE spring energy constant equal to 10 kBT (kB is the Boltzmann constant and T the temperature) and its rest length to 1.1σ (σ is the bead diameter) [18,19,37]. Additionally, to unveil the roles of the LE ingredients beyond its minimal implementation, we examined a more refined version where LE boundaries are chosen to best reproduce population-averaged contact data and the model anchor sites are present with a specific, finite probability in a single-polymer molecule to model cell-to-cell variation [28,37]. The average domain structure of the model is thus reproduced from bulk data, but the ensemble of its single-molecule structures is validated against independent single-cell microscopy conformations (see below). Another key parameter controlling LE dynamics is the extruder processivity, i.e., the ratio between the extrusion velocity and the unbinding rate from the chain, whose values can range, e.g., from 80 kb up to 750 kb [19,23,37].
In the class of phase-separation based models, we focused on the strings and binders (SBS) model [30,39], in which a chromosome region is modeled as a self-avoiding polymer chain where different specific types of binding sites are located for diffusing cognate molecular particles (called binders). Binders and polymer sites are subject to a Brownian motion regulated by the Langevin equation with standard parameters (i.e., friction coefficient ζ = 0.5 [41]). The binders, via specific attractive interactions represented by a truncated Lennard–Jones potential [34], can bridge their cognate sites on the chain, hence guiding a micro-phase-separation of the polymer into different globules. As the number of the binders (or their energy affinity) increases above a given threshold, the system undergoes a thermodynamic phase-transition from a coil (i.e., randomly folded) to a phase-separated globule state where the polymer self-assembles into distinct, spatially segregated globules via a phase-separation mechanism [39]. Critical binder concentrations, for weak biochemical affinities, fall in the fractions of μmol/L range [39], which is consistent with typical transcription factor concentrations. The genomic locations of the binding sites of the SBS model are inferred by a machine learning procedure based on the PRISMR algorithm [12]. In brief, PRISMR is a recursive Monte Carlo procedure that identifies the minimal set of binding sites to best match input bulk (e.g., ensemble-averaged Hi-C or microscopy) data, as fully detailed in [12,29,39]. Finally, we also discuss a model where the LE and SBS models are combined and act simultaneously in a single-polymer molecule (hereafter indicated as the LE+SBS model).
To generate a statistical ensemble of in silico single-molecule conformations, each model is investigated by massive molecular dynamics simulations until stationarity is fully reached (typically up to 108 MD time iteration steps [43]); Langevin dynamics is integrated via the Velocity–Verlet algorithm by using the free available LAMMPS [44] and HOOMD [45] software. All the scripts required to perform the simulations of the models are available at https://github.com/ehsanirani/PhaseSeparation-LoopExtrusion-MD (accessed on 1 August 2022) [28].

3. Results

In this section, we benchmark our polymer models against single-cell super-resolution microscopy data [15] available at 30 kb resolution in a 2 Mb wide genomic region (Chr21: 28–30 Mb) in human IMR90 cells. We show that the different models capture the complex pattern of chromatin contacts at the cell population-averaged level, as well as the observed 3D conformations of the imaged chromatin region in single DNA molecules [28].

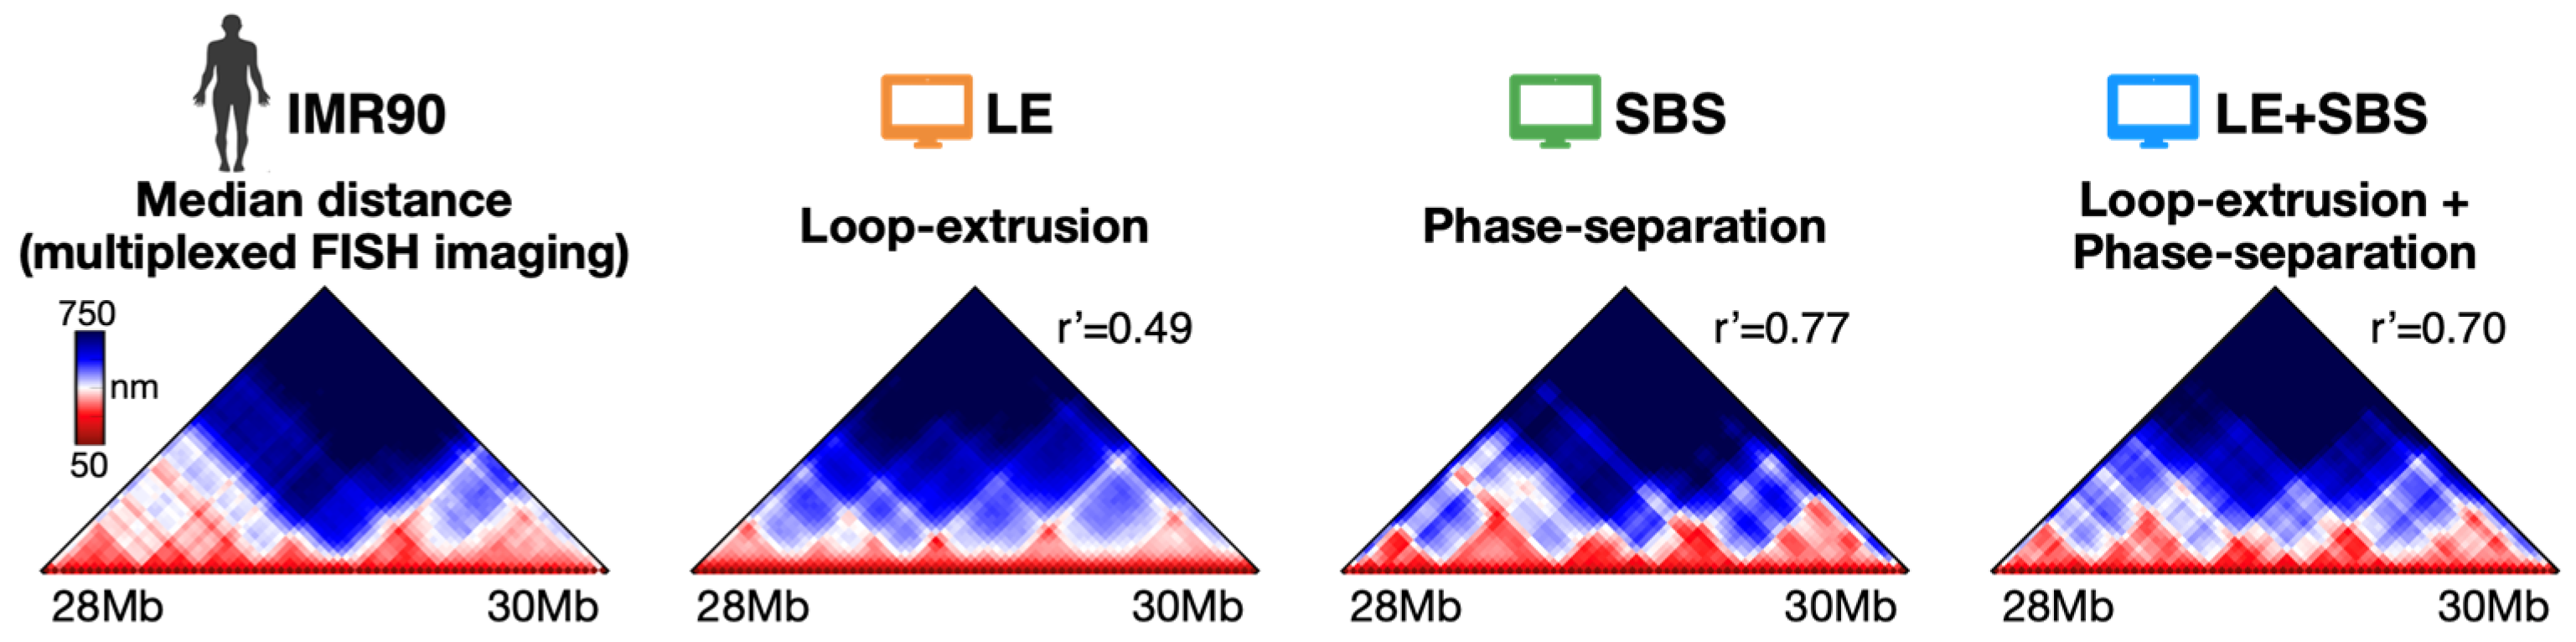
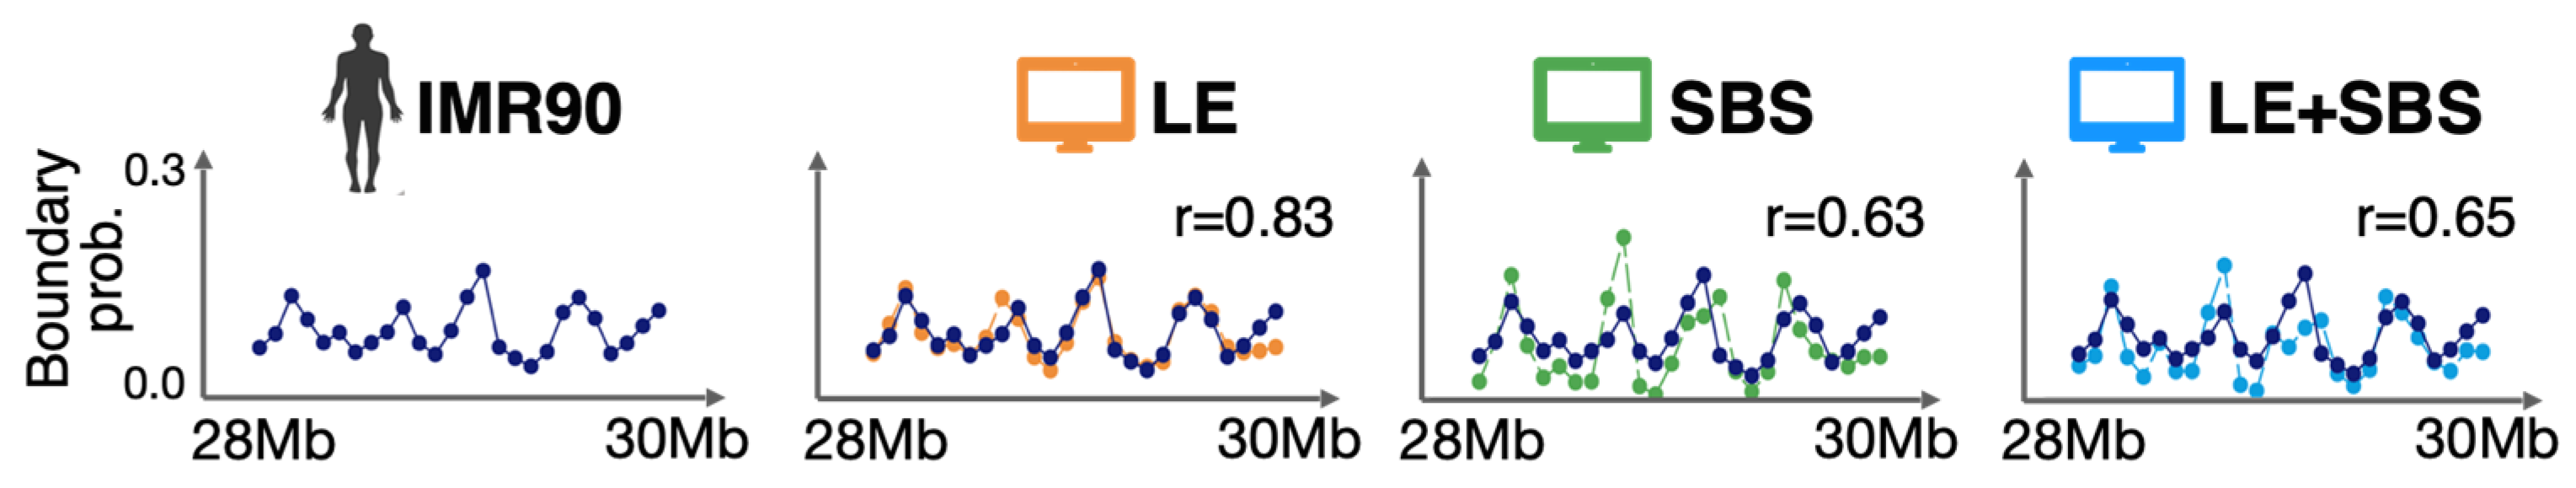
3.1. The Models Recapitulate Ensemble-Averaged Microscopy Data

In a first validation of the models, we computed their median distance matrix that we compared against the corresponding map from multiplexed FISH data [15] (Figure 1).
The median distance map is the ensemble median of the single-molecule distance maps, which, by definition, are symmetric square matrices reporting the Euclidean distances between all pairs of polymer sites. Those matrices are visually represented as a 2D heatmap with a color bar scheme to highlight contacting regions that are closer in 3D space (e.g., TADs or loops, colored in red in Figure 1) or those that have no significant interactions (blue regions in Figure 1). To efficiently compute the distance matrices, we used built-in functions within the Python SciPy package [28]. To reduce the noise within imaging data, we applied a Gaussian filter on single-cell distance maps (standard deviation of the Gaussian kernel = 1) and excluded single-cell conformations whose 3D coordinates have >80% missing values. To quantitatively estimate the similarity between microscopy and model distance matrices, we used the genomic distance-corrected Pearson correlation coefficient, r′, which corrects the usual Pearson coefficient for genomic distance effects [12]. In brief, r′ is the Pearson coefficient computed on distance matrices where each entry is subtracted by the mean value of its diagonal. We found that the different models recapitulate the complex TAD patterns observed in microscopy data, as well as specific pointwise interactions, as highlighted by the high r’ correlation values: r′ = 0.49, r′ = 0.77 and r′ = 0.70, respectively, for LE, SBS and LE+SBS [28]. To substantiate the statistical significance of the r’ correlations of the models, we considered as null control model a self-avoiding chain with the same number of beads as the imaged conformations and found that it returns a significantly lower correlation value (r′ = 0.11, which is, respectively, four and seven times lower than the values found for LE and SBS/LE+SBS). That indicates that both active processes, like loop-extrusion, and passive mechanisms, e.g., thermodynamic polymer phase-separation, are consistent with the average structure of the considered IMR90 genomic region measured by bulk imaging data.
Next, we checked whether our models also explain local properties of chromatin structure. To this aim, we computed the boundary probability genomic function, i.e., the probability for each genomic position across the studied IMR90 locus to appear as boundary of a single-cell TAD domain [15] (Figure 2).
The boundary function has local peaks corresponding to the main TAD boundaries visible in the median distance map of the IMR90 locus and, interestingly, this function is non-zero across the entire imaged region, indicating a substantial cell-to-cell variability in the genomic position of TAD boundaries. We found that the different models return boundary probabilities with profiles consistent with imaging data, as quantified by the high Pearson correlations between models and experiment: r = 0.83, r = 0.63 and r = 0.65, respectively, for LE, SBS and LE + SBS [28].
Taken together, these analyses show that both loop-extrusion and phase-separation processes can quantitatively explain chromatin structure at the cell population-averaged level. In particular, loop-extrusion (LE) is the best to capture the boundary probability function, while phase-separation based models (SBS and LE + SBS) return overall higher correlation values with ensemble-averaged distance data.

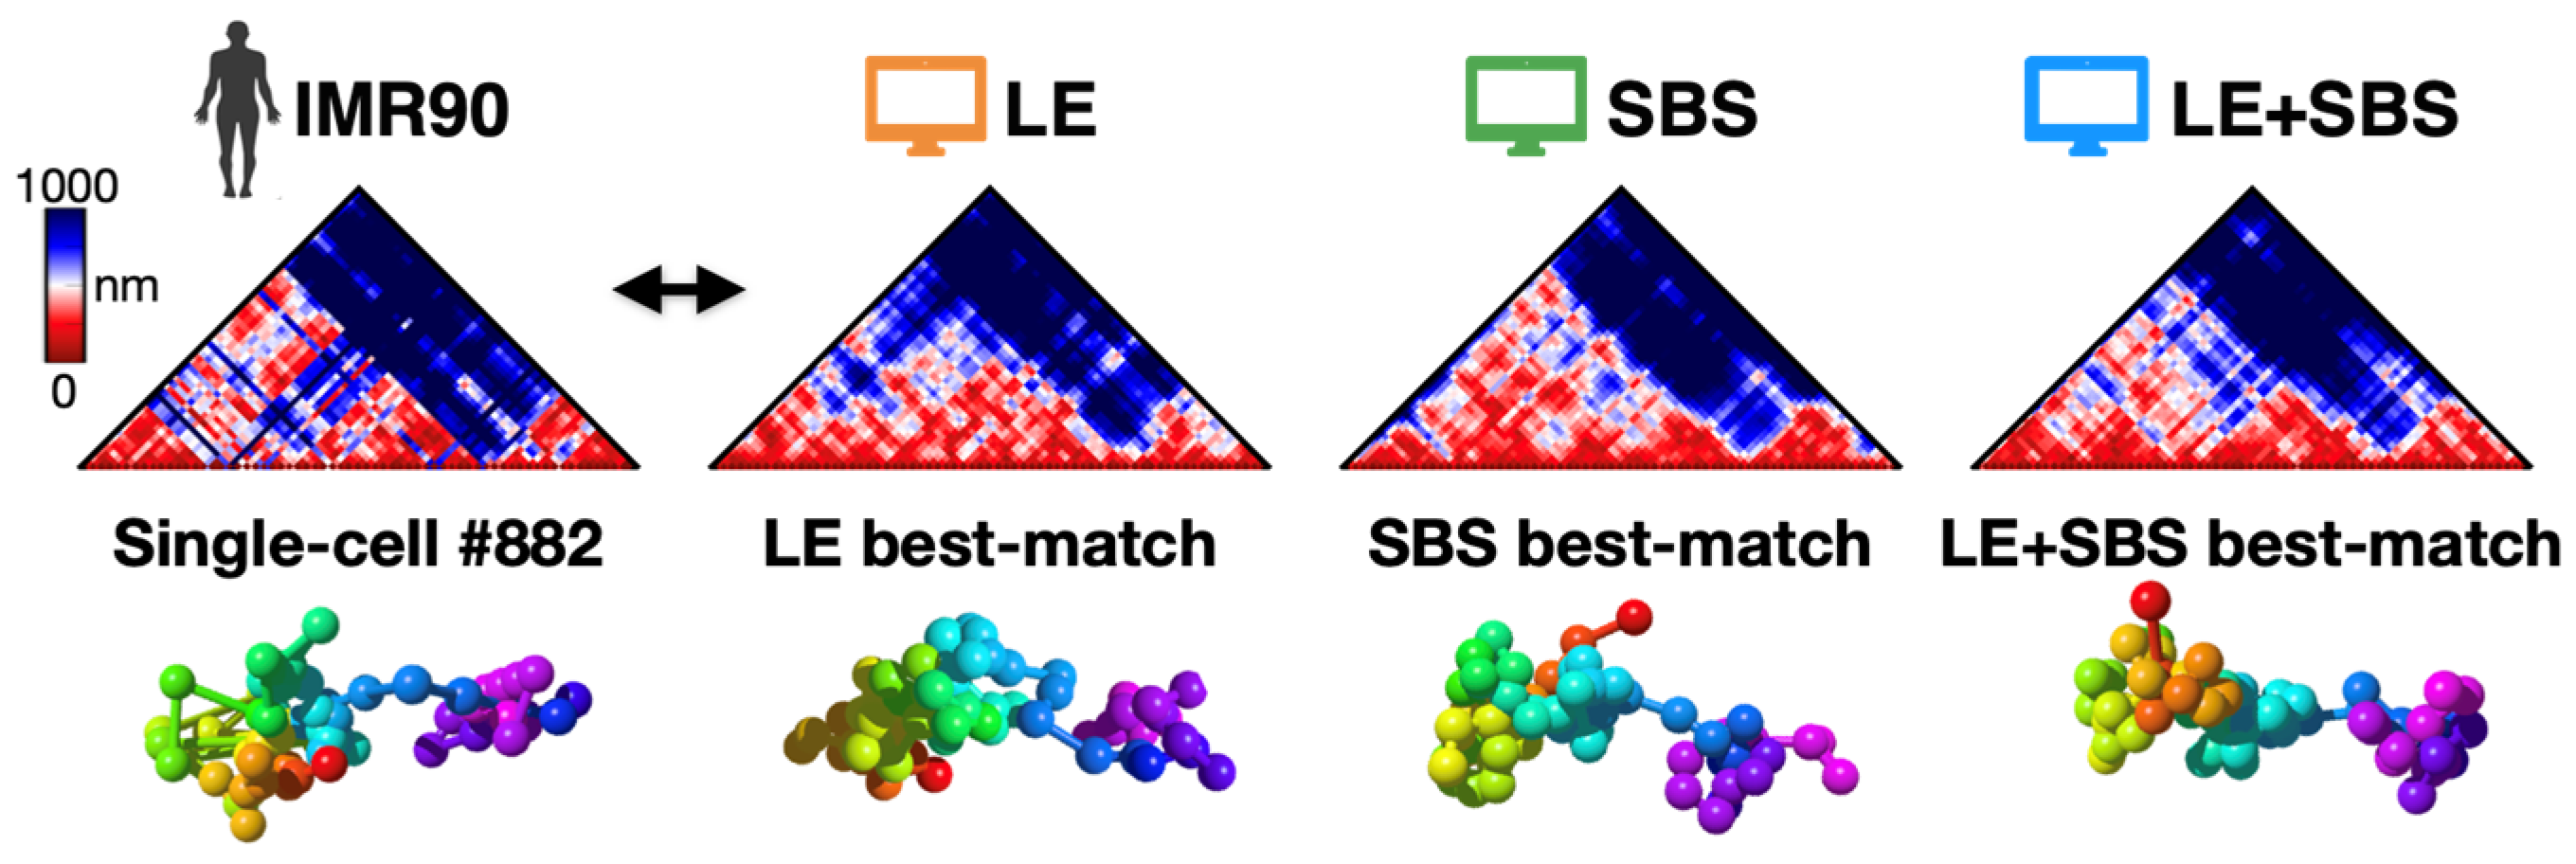
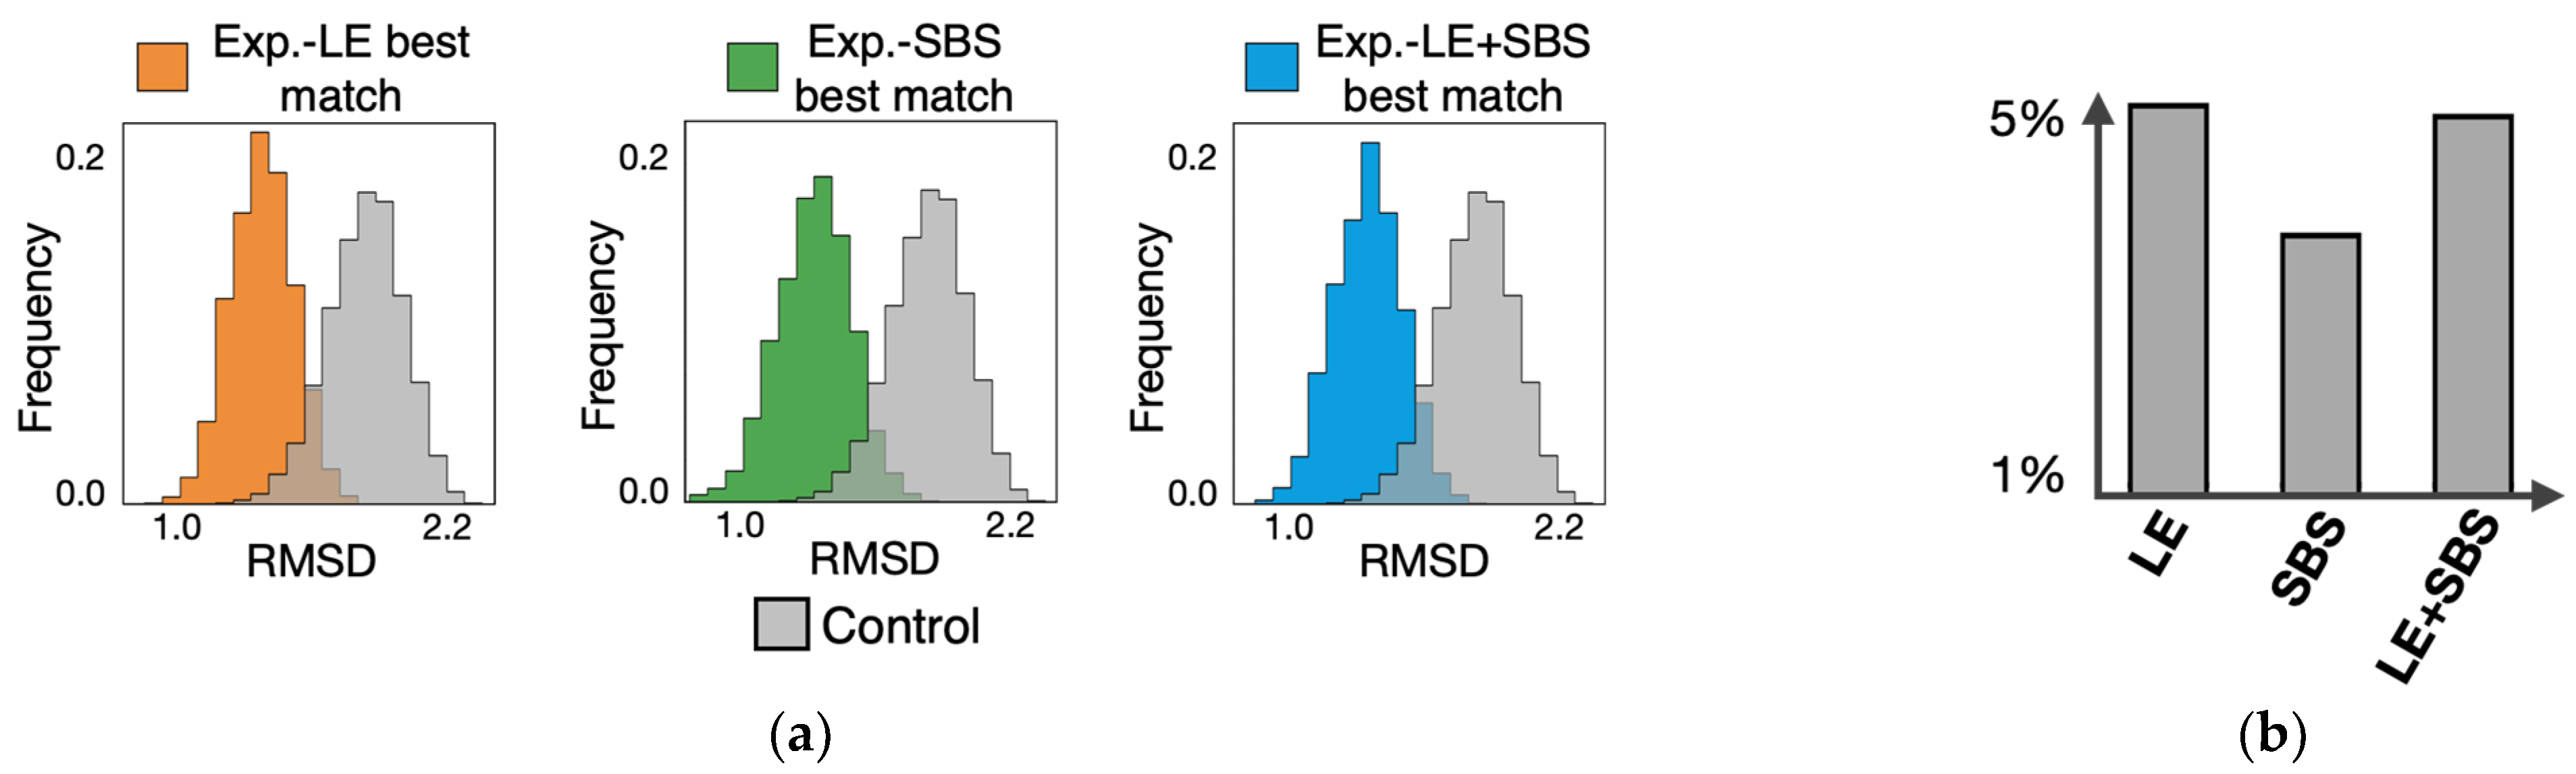
3.2. All-against-All Comparison between Single-Molecule Imaged and Model-Derived 3D Structures

As a further step, we aimed to investigate the structural predictions of our polymer models at the single-molecule level. In particular, to assess whether our models do provide a bona-fide representation of the imaged chromatin structures, we used a computational method based on the root-mean-square deviation (RMSD) criterion [39,46]. In brief, the algorithm performs a roto-translational alignment of two conformations (e.g., experimental and model derived) by minimizing the RMSD of their particle positions; in this way, each experimental 3D structure from imaging is univocally associated to a corresponding best-matching conformation of the models by searching for the minimum RMSD of their coordinates. To fairly compare model and imaged 3D conformations, a z-score is performed on both sets of coordinates. To efficiently run the RMSD comparison, we used the MDAnalysis Python library, which employs the fast quaternion-based characteristic polynomial (QCP) algorithm to calculate the least RMSD between two structures [47]. In Figure 3 we report an example of best-matching conformations identified by the RMSD method: in this case, for instance, the single-cell imaged distance map is characterized by two main TAD-like structures, corresponding to distinct globules in 3D space, which are consistently recapitulated by the different models (Figure 3).
To check the statistical significance of the RMSD analysis, we considered as control the RMSD distribution between random pairs of imaged conformations (Figure 4). For each type of model, we found that the experiment-model best-match distribution is statistically distinguishable from the control (Figure 4a, two-sided Mann–Whitney test p-value = 0), with less than 5% of the entries of the former distribution that fall above the first decile of control (Figure 4b) [28]. Overall, the all-against-all RMSD analysis show that both loop-extrusion and phase-separation single-molecule conformations significantly represent the ensemble of single-cell imaged 3D structures of the studied IMR90 cell region.

4. Discussion

In this work, we discussed the application of polymer physics models to investigate the mechanisms that establish the complex 3D structure of the genome as observed by recent single-cell imaging data [15]. We focused on two main, distinct physical processes that are supported by growing experimental evidence, i.e., loop-extrusion and phase-separation. In the first mechanism, an active motor (e.g., Cohesin or Condensin) extrudes DNA loops between specific anchor sites (envisaged as CTCF binding sites with opposite orientation) in an out-of-equilibrium process; in the second, chromatin contacts between distal genomic sites are established by diffusing molecular agents (such as transcription factors) or direct DNA interactions that, sustained by the thermal bath, spontaneously bridge their cognate sites.
By using as benchmark super-resolution microscopy data available for a 2 Mb wide chromosome region in human fibroblast cells, we showed that both mechanisms can quantitatively recapitulate single-cell imaged conformations, indicating that they can coexist in shaping chromosome folding [28]. By allowing a deeper understanding of the mechanisms driving the organization of the genome, models from polymer physics can be used for real-world applications in real experimental contexts [48]. For example, validated polymer models can be efficiently employed to impute missing values or reduce noise effects in large imaging datasets. Additionally, and importantly, they can be employed to predict in silico the structural effects of disease-associated mutations, linked, for instance, to congenital disorders [11,12] or cancer [13,49].
Overall, those studies show that novel data from microscopy can be complemented with quantitative models from physics to understand the mechanisms and function of genome structure, paving the way for important and useful applications, such as the prediction of genomic perturbations on chromosome 3D architecture.

Author Contributions

Conceptualization, M.C., A.M.C., A.A., S.B., A.E., M.N., T.M. and F.V.; writing—original draft preparation, M.C.; writing—review and editing, M.C. and M.N. All authors have read and agreed to the published version of the manuscript.

Funding

This research received no external funding.

Data Availability Statement

Data is contained within the article.

Conflicts of Interest

The authors declare no conflict of interest.

References

  1. Dixon, J.R.; Gorkin, D.U.; Ren, B. Chromatin Domains: The Unit of Chromosome Organization. Mol. Cell 2016, 62, 668–680. [Google Scholar] [CrossRef] [PubMed]
  2. Dekker, J.; Mirny, L. The 3D Genome as Moderator of Chromosomal Communication. Cell 2016, 164, 1110–1121. [Google Scholar] [CrossRef] [PubMed]
  3. Bickmore, W.A.; van Steensel, B. Genome Architecture: Domain Organization of Interphase Chromosomes. Cell 2013, 152, 1270–1284. [Google Scholar] [CrossRef]
  4. Finn, E.H.; Misteli, T. Molecular Basis and Biological Function of Variability in Spatial Genome Organization. Science 2019, 365, eaaw9498. [Google Scholar] [CrossRef] [PubMed]
  5. Rao, S.S.P.; Huntley, M.H.; Durand, N.C.; Stamenova, E.K.; Bochkov, I.D.; Robinson, J.T.; Sanborn, A.L.; Machol, I.; Omer, A.D.; Lander, E.S.; et al. A 3D Map of the Human Genome at Kilobase Resolution Reveals Principles of Chromatin Looping. Cell 2014, 159, 1665–1680. [Google Scholar] [CrossRef] [PubMed]
  6. Dixon, J.R.; Selvaraj, S.; Yue, F.; Kim, A.; Li, Y.; Shen, Y.; Hu, M.; Liu, J.S.; Ren, B. Topological Domains in Mammalian Genomes Identified by Analysis of Chromatin Interactions. Nature 2012, 485, 376–380. [Google Scholar] [CrossRef]
  7. Nora, E.P.; Lajoie, B.R.; Schulz, E.G.; Giorgetti, L.; Okamoto, I.; Servant, N.; Piolot, T.; Van Berkum, N.L.; Meisig, J.; Sedat, J.; et al. Spatial Partitioning of the Regulatory Landscape of the X-Inactivation Centre. Nature 2012, 485, 381–385. [Google Scholar] [CrossRef]
  8. Fraser, J.; Ferrai, C.; Chiariello, A.M.; Schueler, M.; Rito, T.; Laudanno, G.; Barbieri, M.; Moore, B.L.; Kraemer, D.C.; Aitken, S.; et al. Hierarchical Folding and Reorganization of Chromosomes Are Linked to Transcriptional Changes in Cellular Differentiation. Mol. Syst. Biol. 2015, 11, 852. [Google Scholar] [CrossRef]
  9. Lieberman-Aiden, E.; Van Berkum, N.L.; Williams, L.; Imakaev, M.; Ragoczy, T.; Telling, A.; Amit, I.; Lajoie, B.R.; Sabo, P.J.; Dorschner, M.O.; et al. Comprehensive Mapping of Long-Range Interactions Reveals Folding Principles of the Human Genome. Science 2009, 326, 289–293. [Google Scholar] [CrossRef]
  10. Lupiáñez, D.G.; Kraft, K.; Heinrich, V.; Krawitz, P.; Brancati, F.; Klopocki, E.; Horn, D.; Kayserili, H.; Opitz, J.M.; Laxova, R.; et al. Disruptions of Topological Chromatin Domains Cause Pathogenic Rewiring of Gene-Enhancer Interactions. Cell 2015, 161, 1012–1025. [Google Scholar] [CrossRef] [Green Version]
  11. Spielmann, M.; Lupiáñez, D.G.; Mundlos, S. Structural Variation in the 3D Genome. Nat. Rev. Genet. 2018, 19, 453–467. [Google Scholar] [CrossRef] [PubMed]
  12. Bianco, S.; Lupiáñez, D.G.; Chiariello, A.M.; Annunziatella, C.; Kraft, K.; Schöpflin, R.; Wittler, L.; Andrey, G.; Vingron, M.; Pombo, A.; et al. Polymer Physics Predicts the Effects of Structural Variants on Chromatin Architecture. Nat. Genet. 2018, 50, 662–667. [Google Scholar] [CrossRef] [PubMed]
  13. Valton, A.-L.; Dekker, J. TAD Disruption as Oncogenic Driver. Curr. Opin. Genet. Dev. 2016, 36, 34–40. [Google Scholar] [CrossRef] [PubMed]
  14. Huang, B.; Wang, W.; Bates, M.; Zhuang, X. Three-Dimensional Super-Resolution Imaging by Stochastic Optical Reconstruction Microscopy. Science 2008, 319, 810–813. [Google Scholar] [CrossRef] [PubMed]
  15. Bintu, B.; Mateo, L.J.; Su, J.-H.; Sinnott-Armstrong, N.A.; Parker, M.; Kinrot, S.; Yamaya, K.; Boettiger, A.N.; Zhuang, X. Super-Resolution Chromatin Tracing Reveals Domains and Cooperative Interactions in Single Cells. Science 2018, 362, eaau1783. [Google Scholar] [CrossRef]
  16. Boettiger, A.N.; Bintu, B.; Moffitt, J.R.; Wang, S.; Beliveau, B.J.; Fudenberg, G.; Imakaev, M.; Mirny, L.A.; Wu, C.T.; Zhuang, X. Super-Resolution Imaging Reveals Distinct Chromatin Folding for Different Epigenetic States. Nature 2016, 529, 418–422. [Google Scholar] [CrossRef]
  17. Finn, E.H.; Pegoraro, G.; Brandão, H.B.; Valton, A.L.; Oomen, M.E.; Dekker, J.; Mirny, L.; Misteli, T. Extensive Heterogeneity and Intrinsic Variation in Spatial Genome Organization. Cell 2019, 176, P1502–P1515. [Google Scholar] [CrossRef]
  18. Sanborn, A.L.; Rao, S.S.P.; Huang, S.C.; Durand, N.C.; Huntley, M.H.; Jewett, A.I.; Bochkov, I.D.; Chinnappan, D.; Cutkosky, A.; Li, J.; et al. Chromatin Extrusion Explains Key Features of Loop and Domain Formation in Wild-Type and Engineered Genomes. Proc. Natl. Acad. Sci. USA 2015, 112, E6456. [Google Scholar] [CrossRef]
  19. Fudenberg, G.; Imakaev, M.; Lu, C.; Goloborodko, A.; Abdennur, N.; Mirny, L.A. Formation of Chromosomal Domains by Loop Extrusion. Cell Rep. 2016, 15, 2038–2049. [Google Scholar] [CrossRef]
  20. Racko, D.; Benedetti, F.; Dorier, J.; Stasiak, A. Transcription-Induced Supercoiling as the Driving Force of Chromatin Loop Extrusion during Formation of TADs in Interphase Chromosomes. Nucleic Acids Res. 2018, 46, 1648–1660. [Google Scholar] [CrossRef] [Green Version]
  21. Brackley, C.A.; Johnson, J.; Michieletto, D.; Morozov, A.N.; Nicodemi, M.; Cook, P.R.; Marenduzzo, D. Nonequilibrium Chromosome Looping via Molecular Slip Links. Phys. Rev. Lett. 2017, 119, 138101. [Google Scholar] [CrossRef] [PubMed]
  22. Banigan, E.J.; Mirny, L.A. Loop Extrusion: Theory Meets Single-Molecule Experiments. Curr. Opin. Cell Biol. 2020, 64, 124–138. [Google Scholar] [CrossRef] [PubMed]
  23. Goloborodko, A.; Marko, J.F.; Mirny, L.A. Chromosome Compaction by Active Loop Extrusion. Biophys. J. 2016, 110, 2162–2168. [Google Scholar] [CrossRef]
  24. Goloborodko, A.; Imakaev, M.V.; Marko, J.F.; Mirny, L. Compaction and Segregation of Sister Chromatids via Active Loop Extrusion. eLife 2016, 5, e14864. [Google Scholar] [CrossRef]
  25. Jost, D.; Carrivain, P.; Cavalli, G.; Vaillant, C. Modeling Epigenome Folding: Formation and Dynamics of Topologically Associated Chromatin Domains. Nucleic Acids Res. 2014, 42, 9553–9561. [Google Scholar] [CrossRef] [PubMed]
  26. Conte, M.; Fiorillo, L.; Annunziatella, C.; Esposito, A.; Musella, F.; Abraham, A.; Bianco, S.; Chiariello, A.M. Dynamic and Equilibrium Properties of Finite-Size Polymer Models of Chromosome Folding. Phys. Rev. E 2021, 104, 054402. [Google Scholar] [CrossRef]
  27. Nuebler, J.; Fudenberg, G.; Imakaev, M.; Abdennur, N.; Mirny, L.A. Chromatin Organization by an Interplay of Loop Extrusion and Compartmental Segregation. Proc. Natl. Acad. Sci. USA 2018, 115, E6697–E6706. [Google Scholar] [CrossRef] [PubMed]
  28. Conte, M.; Irani, E.; Chiariello, A.M.; Abraham, A.; Bianco, S.; Esposito, A.; Nicodemi, M. Loop-Extrusion and Polymer Phase-Separation Can Co-Exist at the Single-Molecule Level to Shape Chromatin Folding. Nat. Commun. 2022, 13, 4070. [Google Scholar] [CrossRef]
  29. Esposito, A.; Bianco, S.; Chiariello, A.M.; Abraham, A.; Fiorillo, L.; Conte, M.; Campanile, R.; Nicodemi, M. Polymer Physics Reveals a Combinatorial Code Linking 3D Chromatin Architecture to 1D Chromatin States. Cell Rep. 2022, 38, 110601. [Google Scholar] [CrossRef]
  30. Barbieri, M.; Chotalia, M.; Fraser, J.; Lavitas, L.-M.; Dostie, J.; Pombo, A.; Nicodemi, M. Complexity of Chromatin Folding Is Captured by the Strings and Binders Switch Model. Proc. Natl. Acad. Sci. USA 2012, 109, 16173–16178. [Google Scholar] [CrossRef] [Green Version]
  31. Di Pierro, M.; Zhang, B.; Aiden, E.L.; Wolynes, P.G.; Onuchic, J.N. Transferable Model for Chromosome Architecture. Proc. Natl. Acad. Sci. USA 2016, 113, 12168–12173. [Google Scholar] [CrossRef]
  32. Plewczynski, D.; Kadlof, M. Computational Modelling of Three-Dimensional Genome Structure. Methods 2020, 181–182, 1–4. [Google Scholar] [CrossRef] [PubMed]
  33. Zhang, B.; Wolynes, P.G. Topology, Structures, and Energy Landscapes of Human Chromosomes. Proc. Natl. Acad. Sci. USA 2015, 112, 6062–6067. [Google Scholar] [CrossRef] [PubMed]
  34. Chiariello, A.M.; Annunziatella, C.; Bianco, S.; Esposito, A.; Nicodemi, M. Polymer Physics of Chromosome Large-Scale 3D Organisation. Sci. Rep. 2016, 6, 29775. [Google Scholar] [CrossRef] [PubMed]
  35. Brackley, C.A.; Brown, J.M.; Waithe, D.; Babbs, C.; Davies, J.; Hughes, J.R.; Buckle, V.J.; Marenduzzo, D. Predicting the Three-Dimensional Folding of Cis-Regulatory Regions in Mammalian Genomes Using Bioinformatic Data and Polymer Models. Genome Biol. 2016, 17, 59. [Google Scholar] [CrossRef]
  36. Di Stefano, M.; Paulsen, J.; Lien, T.G.; Hovig, E.; Micheletti, C. Hi-C-Constrained Physical Models of Human Chromosomes Recover Functionally-Related Properties of Genome Organization. Sci. Rep. 2016, 6, 35985. [Google Scholar] [CrossRef]
  37. Buckle, A.; Brackley, C.A.; Boyle, S.; Marenduzzo, D.; Gilbert, N. Polymer Simulations of Heteromorphic Chromatin Predict the 3D Folding of Complex Genomic Loci. Mol. Cell 2018, 72, 786–797.e11. [Google Scholar] [CrossRef]
  38. Shi, G.; Liu, L.; Hyeon, C.; Thirumalai, D. Interphase Human Chromosome Exhibits out of Equilibrium Glassy Dynamics. Nat. Commun. 2018, 9, 3161. [Google Scholar] [CrossRef]
  39. Conte, M.; Fiorillo, L.; Bianco, S.; Chiariello, A.M.; Esposito, A.; Nicodemi, M. Polymer Physics Indicates Chromatin Folding Variability across Single-Cells Results from State Degeneracy in Phase Separation. Nat. Commun. 2020, 11, 3289. [Google Scholar] [CrossRef]
  40. Bohn, M.; Heermann, D.W. Diffusion-Driven Looping Provides a Consistent Provides a Consistent Framework for Chromatin Organization. PLoS ONE 2010, 5, e12218. [Google Scholar] [CrossRef]
  41. Kremer, K.; Grest, G.S. Dynamics of Entangled Linear Polymer Melts: A Molecular-Dynamics Simulation. J. Chem. Phys. 1990, 92, 5057–5086. [Google Scholar] [CrossRef]
  42. Rosa, A.; Everaers, R. Structure and Dynamics of Interphase Chromosomes. PLoS Comput. Biol. 2008, 4, e1000153. [Google Scholar] [CrossRef] [PubMed]
  43. Conte, M.; Esposito, A.; Fiorillo, L.; Campanile, R.; Annunziatella, C.; Corrado, A.; Chiariello, M.G.; Bianco, S.; Chiariello, A.M. Efficient Computational Implementation of Polymer Physics Models to Explore Chromatin Structure. Int. J. Parallel, Emergent Distrib. Syst. 2019, 37, 91–102. [Google Scholar] [CrossRef]
  44. Plimpton, S. Fast Parallel Algorithms for Short-Range Molecular Dynamics. J. Comput. Phys. 1995, 117, 1–19. [Google Scholar] [CrossRef]
  45. Anderson, J.A.; Glaser, J.; Glotzer, S.C. HOOMD-Blue: A Python Package for High-Performance Molecular Dynamics and Hard Particle Monte Carlo Simulations. Comput. Mater. Sci. 2020, 173, 109363. [Google Scholar] [CrossRef]
  46. Stevens, T.J.; Lando, D.; Basu, S.; Atkinson, L.P.; Cao, Y.; Lee, S.F.; Leeb, M.; Wohlfahrt, K.J.; Boucher, W.; O’Shaughnessy-Kirwan, A.; et al. 3D Structures of Individual Mammalian Genomes Studied by Single-Cell Hi-C. Nature 2017, 544, 59–64. [Google Scholar] [CrossRef]
  47. Theobald, D.L. Rapid Calculation of RMSDs Using a Quaternion-Based Characteristic Polynomial. Acta Crystallogr. Sect. A Found. Crystallogr. 2005, 61, 478–480. [Google Scholar] [CrossRef]
  48. Fiorillo, L.; Musella, F.; Conte, M.; Kempfer, R.; Chiariello, A.M.; Bianco, S.; Kukalev, A.; Irastorza-Azcarate, I.; Esposito, A.; Abraham, A.; et al. Comparison of the Hi-C, GAM and SPRITE Methods Using Polymer Models of Chromatin. Nat. Methods 2021, 18, 482–490. [Google Scholar] [CrossRef]
  49. Weischenfeldt, J.; Dubash, T.; Drainas, A.P.; Mardin, B.R.; Chen, Y.; Stütz, A.M.; Waszak, S.M.; Bosco, G.; Halvorsen, A.R.; Raeder, B.; et al. Pan-Cancer Analysis of Somatic Copy-Number Alterations Implicates IRS4 and IGF2 in Enhancer Hijacking. Nat. Genet. 2017, 49, 65–74. [Google Scholar] [CrossRef] [Green Version]
Figure 1. The median spatial distance matrix of the IMR90 locus (Chr21: 28–30 Mb) from multiplexed FISH microscopy [15] is compared against the corresponding in silico matrices of the considered polymer models [28]. Both loop-extrusion (LE) and phase-separation based models (SBS and LE + SBS) well recapitulate the complex experimental pattern of contacts. Adapted from [28].
Algorithms 15 00330 g001
Figure 2. The genomic boundary probability function of the IMR90 locus is consistently recapitulated by the different models. Adapted from [28].
Algorithms 15 00330 g002
Figure 3. Example of experiment-model best-matching 3D structures, along with their corresponding single-molecule distance maps, as identified by the RMSD method. Adapted from [28].
Algorithms 15 00330 g003
Figure 4. Statistical significance of the RMSD analysis: (a) the RMSD distribution of the experiment-model best-matches (for each type of model) is statistically distinguishable from a control made of random pairs of imaged conformations; (b) less than 5% of the entries of the experiment-model best-match distributions are within the first 10% of the control. Adapted from [28].
Algorithms 15 00330 g004
Publisher’s Note: MDPI stays neutral with regard to jurisdictional claims in published maps and institutional affiliations.

