Article

MedicalSeg: A Medical GUI Application for Image Segmentation Management

1
Pediatric Computational Imaging Research Group, Hospital Sant Joan de Déu, 08950 Esplugues de Llobregat, Catalonia, Spain
2
Research Centre for Biomedical Engineering (CREB), Barcelona East School of Engineering, Universitat Politècnica de Catalunya, 08034 Barcelona, Catalonia, Spain
3
Imatge Diagnòstica i Terapèutica, Institut de Recerca Sant Joan de Déu, 08950 Esplugues de Llobregat, Catalonia, Spain
4
Servei de Diagnòstic per la Imatge, Hospital Sant Joan de Déu, 08950 Esplugues de Llobregat, Catalonia, Spain
5
ImViA Laboratory, Université de Bourgogne Franche-Comté, 64 Rue de Sully, 21000 Dijon, France
6
Escuela de Ingenieria y Ciencias, Tecnológico de Monterrey, Guadalajara 45138, Mexico
*
Author to whom correspondence should be addressed.
Algorithms 2022, 15(6), 200; https://doi.org/10.3390/a15060200
Submission received: 30 March 2022 / Revised: 23 May 2022 / Accepted: 5 June 2022 / Published: 8 June 2022
(This article belongs to the Special Issue 1st Online Conference on Algorithms (IOCA2021))

Abstract

:
In the field of medical imaging, the division of an image into meaningful structures using image segmentation is an essential step for pre-processing analysis. Many studies have been carried out to solve the general problem of the evaluation of image segmentation results. One of the main focuses in the computer vision field is based on artificial intelligence algorithms for segmentation and classification, including machine learning and deep learning approaches. The main drawback of supervised segmentation approaches is that a large dataset of ground truth validated by medical experts is required. In this sense, many research groups have developed their segmentation approaches according to their specific needs. However, a generalised application aimed at visualizing, assessing and comparing the results of different methods facilitating the generation of a ground-truth repository is not found in recent literature. In this paper, a new graphical user interface application (MedicalSeg) for the management of medical imaging based on pre-processing and segmentation is presented. The objective is twofold, first to create a test platform for comparing segmentation approaches, and secondly to generate segmented images to create ground truths that can then be used for future purposes as artificial intelligence tools. An experimental demonstration and performance analysis discussion are presented in this paper.

1. Introduction

In the most recent decades, one of the most common purposes in medical imaging field is focused on image segmentation to obtain regions of interest (ROI) through a semi-automatic or automatic process [1]. Segmentation is one of the most important and popular tasks in medical image analysis, which plays a critical role in disease diagnosis, surgical planning, and prognosis evaluation. In fact, it is an essential step in computer-aided diagnosis systems in different applications [2]. Image segmentation is considered one of the main pre-processing steps in many applications, because a segmented section is necessary in many instances to analyse and extract certain features for post-processing purposes. New advances in medical imaging modalities, such as X-ray, magnetic resonance imaging (MRI), ultrasound (US), computed tomography (CT), or nuclear medicine request the implementation and validation of novel segmentation algorithms [3]. According to different image modality, the main objective is to develop applications for different aspects, such as edge detection, location of organs, segmentation of anatomical regions, or lesion detection.
The challenge is how to extract global features of the image to distinguish ROI from the background. The main limitation is that there is no algorithm that is suitable for all the cases. Moreover, it could be a tedious and inefficient procedure applied for large image database. In this sense, there have been various approaches proposed to the task of segmenting ROIs in medical images using traditional segmentation algorithms. A comprehensive review of the top methods in 10 3D medical image segmentation challenges during 2020 was studied, covering a variety of tasks and datasets [4]. Challenges provide an open and fair platform for various research groups to test and validate their segmentation methods on common datasets acquired from the clinical environment.
Nowadays, one of the main focuses in the computer vision (CV) field is based on artificial intelligence (AI) algorithms for segmentation and classification in image domain such as machine learning (ML) and deep learning (DL) [5]. ML forgoes the traditional programming paradigm where problem analysis is replaced by a training framework, where the system is fed a large number of training patterns (sets of inputs for which the desired outputs are known) which it learns and uses to predict new patterns [6]. Additionally, DL is a subset of machine learning, based largely on Artificial Neural Networks (ANNs), a computing paradigm inspired by the functioning of the human brain. The main benefit of DL approach is that the architecture learns both the feature extraction and the classification, thus releasing the need of tailored features defined by an expert. The advent of DL may open a new paradigm to do something with traditional techniques to overcome the many challenges DL brings (e.g., computing power, time, accuracy, characteristics, and quantity of inputs, among others). Certainly, they need a lot of domain expertise, human intervention only capable of what they are designed for, and comparison with the traditional segmentation algorithms, such as thresholding, edge detection, clustering, region growing, or active contour models, provide more promising solutions [3]. However, in both cases, the solving of all CV problems and the usability of traditional algorithms still have a relevant importance. In addition, the development of supervised AI algorithms requires a large amount of ground truth databases validated by radiologists and medical experts to ensure an efficient solution. In order to obtain these data, robust applications are required to generate this step to be used in following purposes.
Moreover, many repositories including medical applications have been published [7]. The challenge is to develop applications for different biomedical segmentation purposes and image modalities. For example, medical applications related to cardiac [8], dermatology [9], chest X-ray [10], mammography [11], cervix [12], pancreas [13], liver CT [14], ultrasound nerve [15], lung diseases [16], or brain MR [17] providing open-source codes. The most commonly architecture was inspired by convolutional networks for biomedical image segmentation [18].
As mentioned, the segmentation techniques available are multiple and diverse, and it is often difficult to know a priori which will be the best for the medical study of a particular type of ROI. That is why researchers are often forced to try several of these techniques until they find the one that provides best performance in a specific problem. In addition, some techniques have parameters that need to be adjusted in order to obtain the best result in a given image. All this often means that this pre-processing of the images ends up being laborious and time consuming, when in reality the important part for the study is the post-processing where a perfect segmentation of the region of interest is important for their research purposes.
The objective is twofold, firstly to create a test platform for comparing segmentation tools, and secondly to generate segmented images but create ground truths that can then be used for future purposes as artificial intelligence tools. This novel tool has been developed with the main purpose of providing the community with a graphical user interface (GUI) interface that can be used to manage a big amount of images using a GUI and allows to generate a ground truth data for AI purposes. For this reason, a new application (MedicalSeg) based on different segmentation approaches is presented in this work using directly Digital Imaging and Communications in Medicine (DICOM) images [19], and also standard image formats (jpeg, png, etc.).
Moreover, MedicalSeg includes a set of pre-processing tools and segmentation algorithms that can be easily and quickly applied to different types of medical images. Furthermore, an automatic system saving all the results in a defined structure is also implemented to facilitate the users and generate a dataset for post-processing purposes. Finally, facilities to execute this application using different modalities are available. In this paper, a related works, methodology, a case of use of this application and a discussion section with conclusions are presented.

2. Materials and Digital Repository

In this section, materials and experimental data used for demonstration of the usability of MedicalSeg tool is described (Section 2.1). Five medical databases (Figure 1) have been used: full-digital mammography database (Section 2.1.1); MRI prostate database (Section 2.1.3); Magnetic Resonance Angiography (MRA) vascular brain database (Section 2.1.2; ultrasound database (Section 2.1.5); and digital retinal database (Section 2.1.4). On the other hand, the design of the GUI interface (Section 3.1), the segmentation algorithms implemented in MedicalSeg (Section 3.2) and the image processing tools are described in Section 3.3.

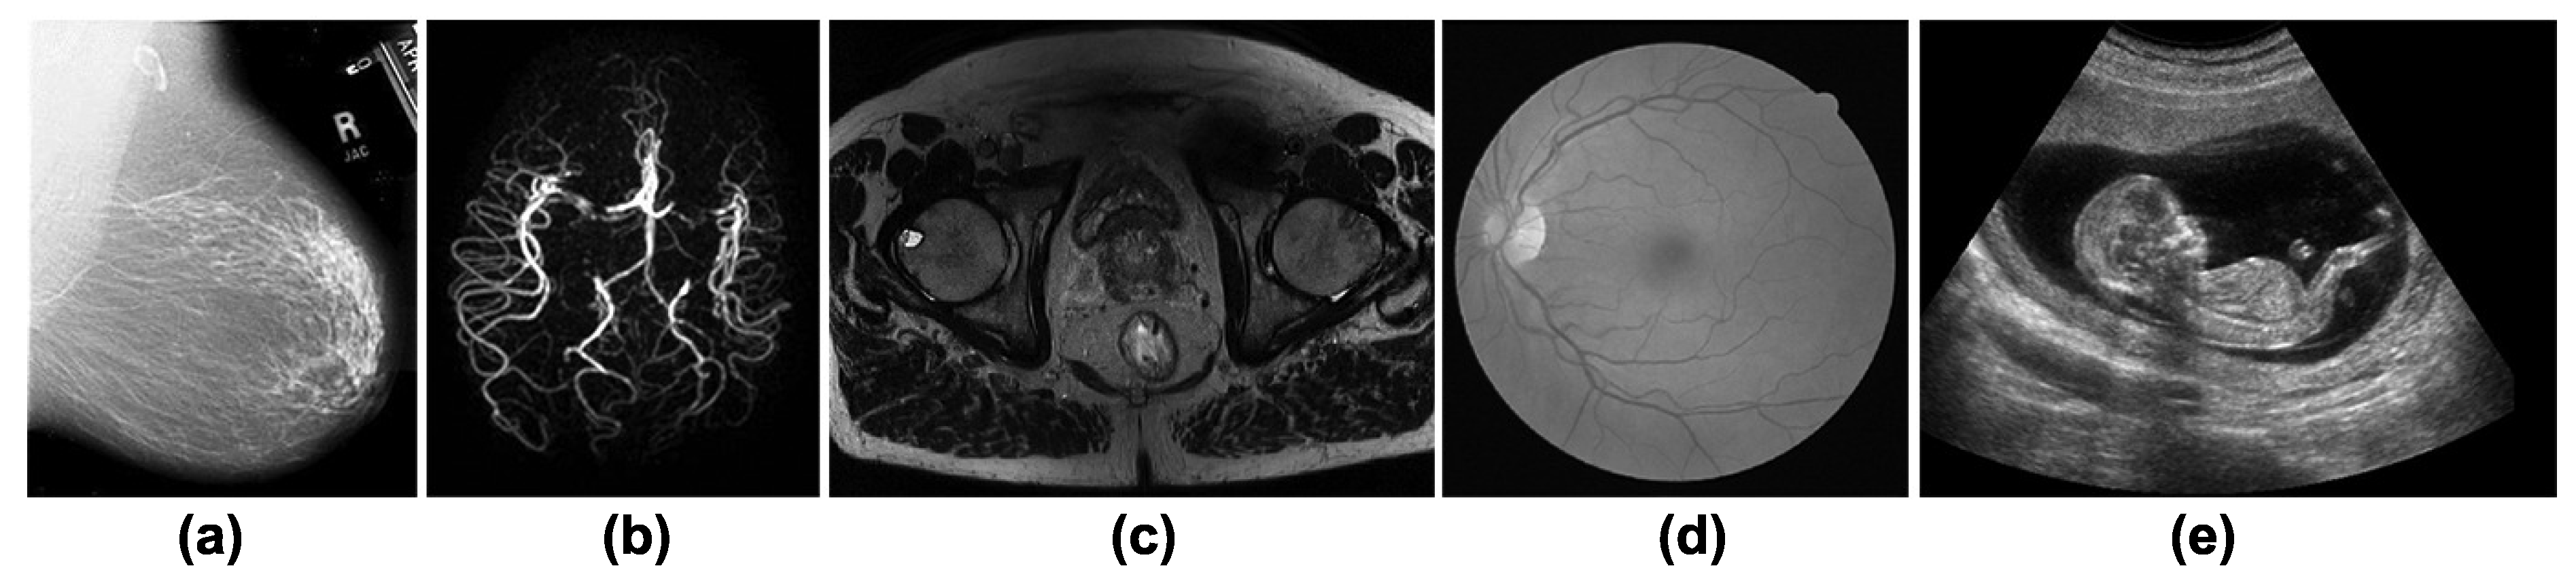
2.1. Medical Digital Databases

2.1.1. Full-Digital Mammography Database

The Mammographic Image Analysis Society Digital Mammogram Database (MIAS) used in previous works [20] is composed by a set of 322 Mediolateral Oblique (MLO) digitized mammograms corresponding to left and right breast of 161 women (Figure 1a). The films were extracted from the UK National Breast Screening Programme, and digitised to 50 micron pixel edge with Joyce–Loebl scanner, a device with linear response in the optical density range 0–3.2. Each pixel was described as a 8-bit word.

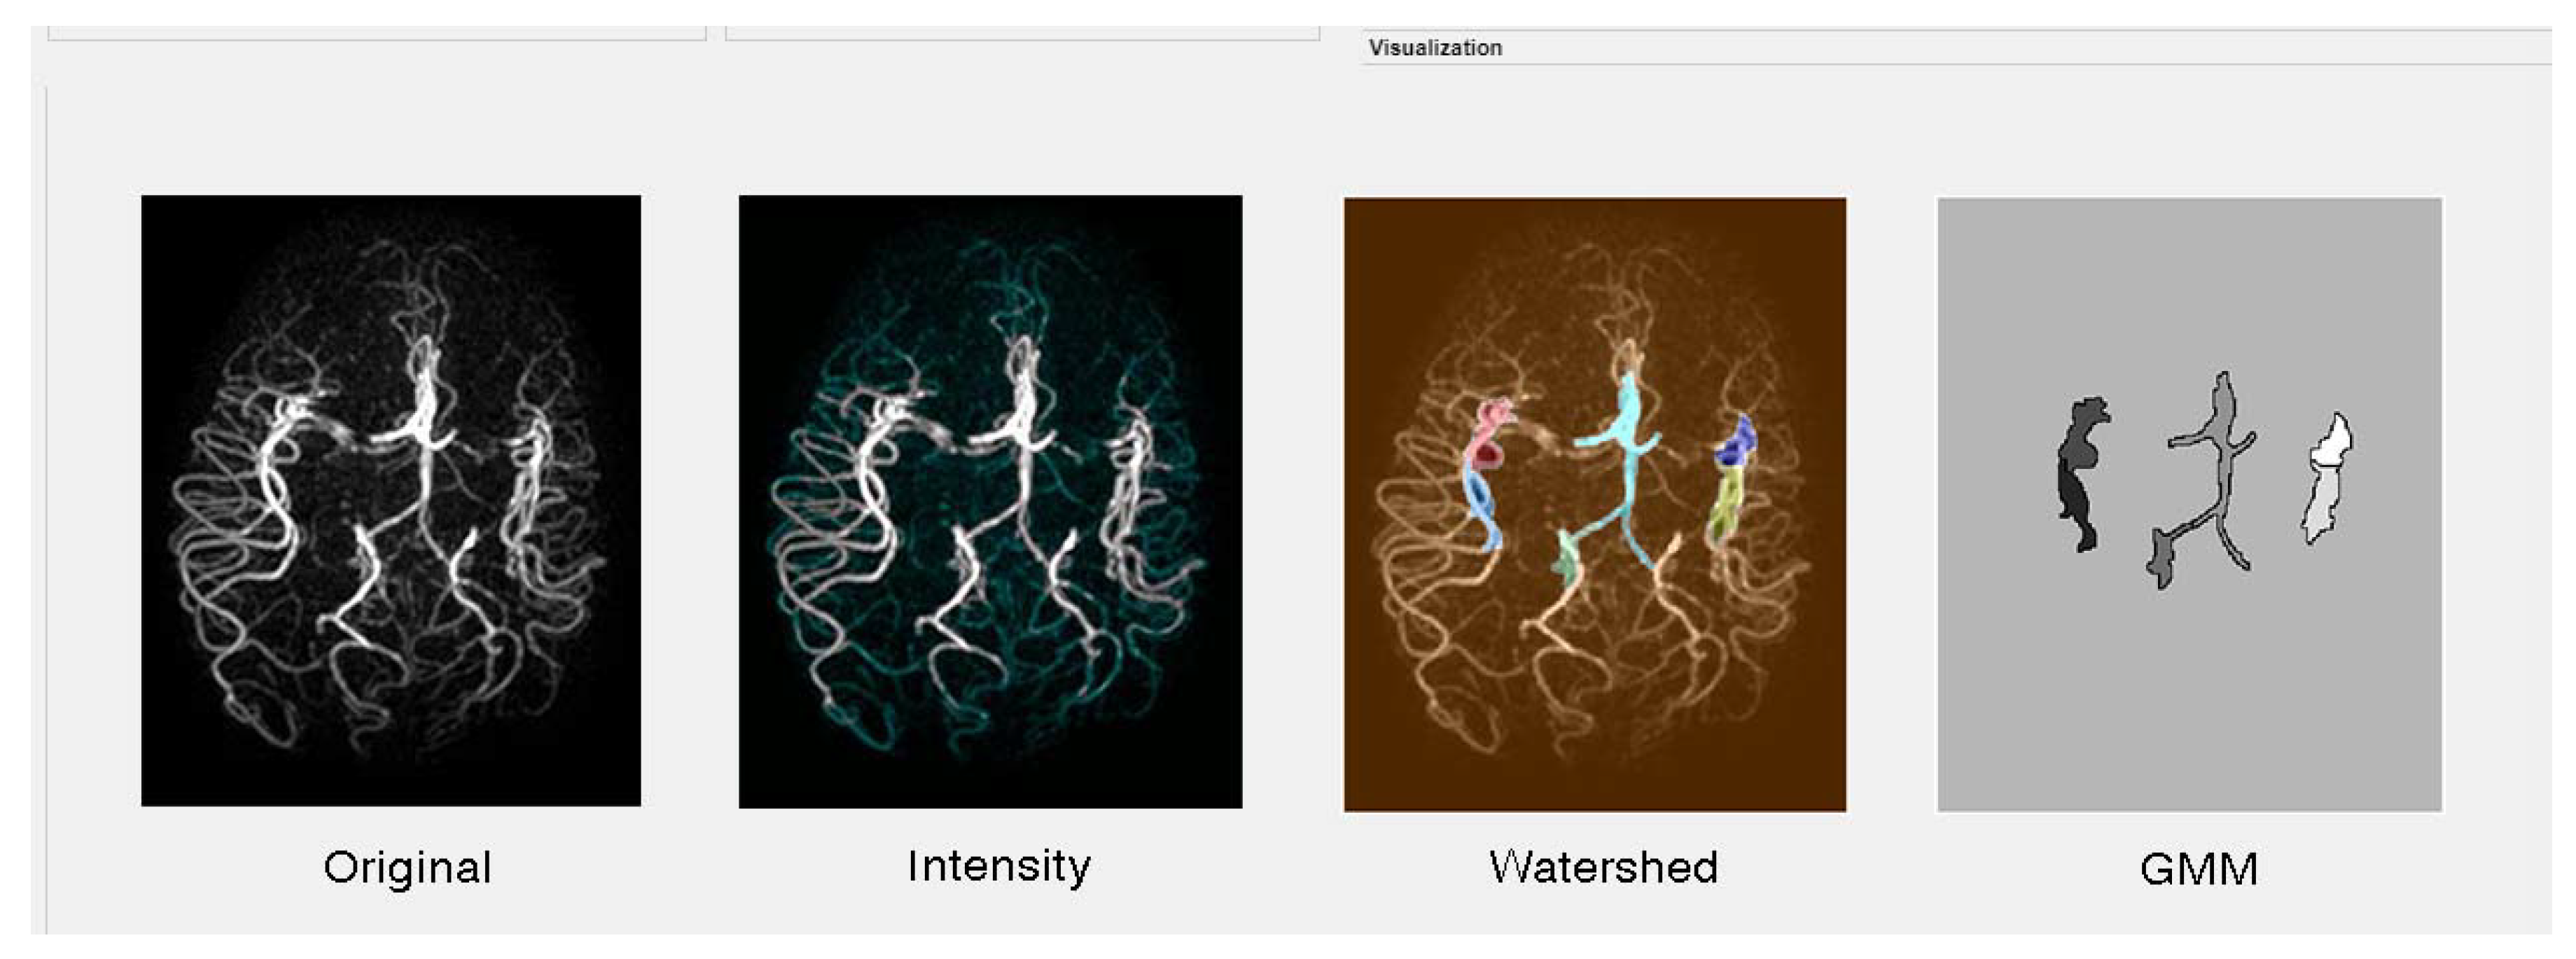
2.1.2. Magnetic Resonance Angiography (MRA) Vascular Brain Database

Another database used to test this application is carried out with the Magnetic resonance angiography (MRA) sequences of 18 paediatric patients obtained at the diagnostic imaging service of the Sant Joan de Déu Hospital (HSJD, Barcelona) [21]. A procedure called Triggered Angiography Non-Contrast Enhanced (TRANCE) is a cardiac triggered 3D TSE technique that dynamically subtracts images from different phases in the cardiac cycle to obtain high resolution arterial images with bright vessels and dark background. This database is provided by the FIS Acción Estratégica en Salud (AES) 2020 (project PI20/00296) funded by Instituto de Salud Carlos III of Spain. The images will be analysed by HSJD radiologist Dr. Josep Munuera providing clinical insight. This study will be conducted strictly following international ethical recommendations for human medical research. The studies will have been carried out in a 3T Philips Ingenia MR or 1.5T General Electric MR machine. Each of these sequences consists of 8 images showing perfusion of blood flow with a periodicity of 200 milliseconds. The images are in png format and have resolutions of 240 × 240 pixels or 288 × 288 pixels (Figure 1b).

2.1.3. MRI Prostate Database

A database with prostate MRI based on clinical data with tumour and healthy cases was used [22]. Then, among the tested patients not all the prostate studies present tumours. The examinations used in our study contained three-dimensional T2-weighted fast spin-echo (TR/TE/ETL: 3600 ms/143 ms/109, slice thickness: 1.25 mm) images acquired with sub-millimetric pixel resolution in an oblique axial plane. All the dataset and ground truth data are provided from the medical imaging department of the University Hospital of Dijon (France) [23]. The institutional committee on human research approved the study, with a waiver for the requirement for written consent, because MRI was included in the workup procedure for all patients referred for brachytherapy or radiotherapy.

2.1.4. Digital Retinal Database

The photographs for the DRIVE database were obtained from a diabetic retinopathy screening program in The Netherlands [24]. The screening population consisted of 400 diabetic subjects between 25 and 90 years of age. The DRIVE database has been established to enable comparative studies on segmentation of blood vessels in retinal images (Figure 1d).
The purpose is to use this database for retinal vessel segmentation and delineation of morphological attributes of retinal blood vessels, such as length, width, tortuosity, branching patterns, and angles which are utilized for the diagnosis, screening, treatment, and evaluation of various cardiovascular and ophthalmologic diseases, such as diabetes, hypertension, arteriosclerosis, and chorodial neovascularization.

2.1.5. Ultrasound Database

For the completion of this work, a 2D fetal ultrasound (Sonogram) database is used. Sonogram is an imaging technique that uses sound waves to produce images of a fetus in the uterus. Fetal ultrasound images are used during pregnancy to check the baby’s development, the presence of a multiple pregnancy and to help pick up any abnormalities. In some cases, fetal ultrasound is used to evaluate possible problems or help confirm a diagnosis. The different images of each baby consisted of ultrasounds performed at different planes, both coronal and sagital, and for several weeks (Figure 1e). The size of each 2D ultrasound image is 800 by 540 pixels with a pixel size ranging from 0.052 to 0.326 mm obtained from Zenodo [25].

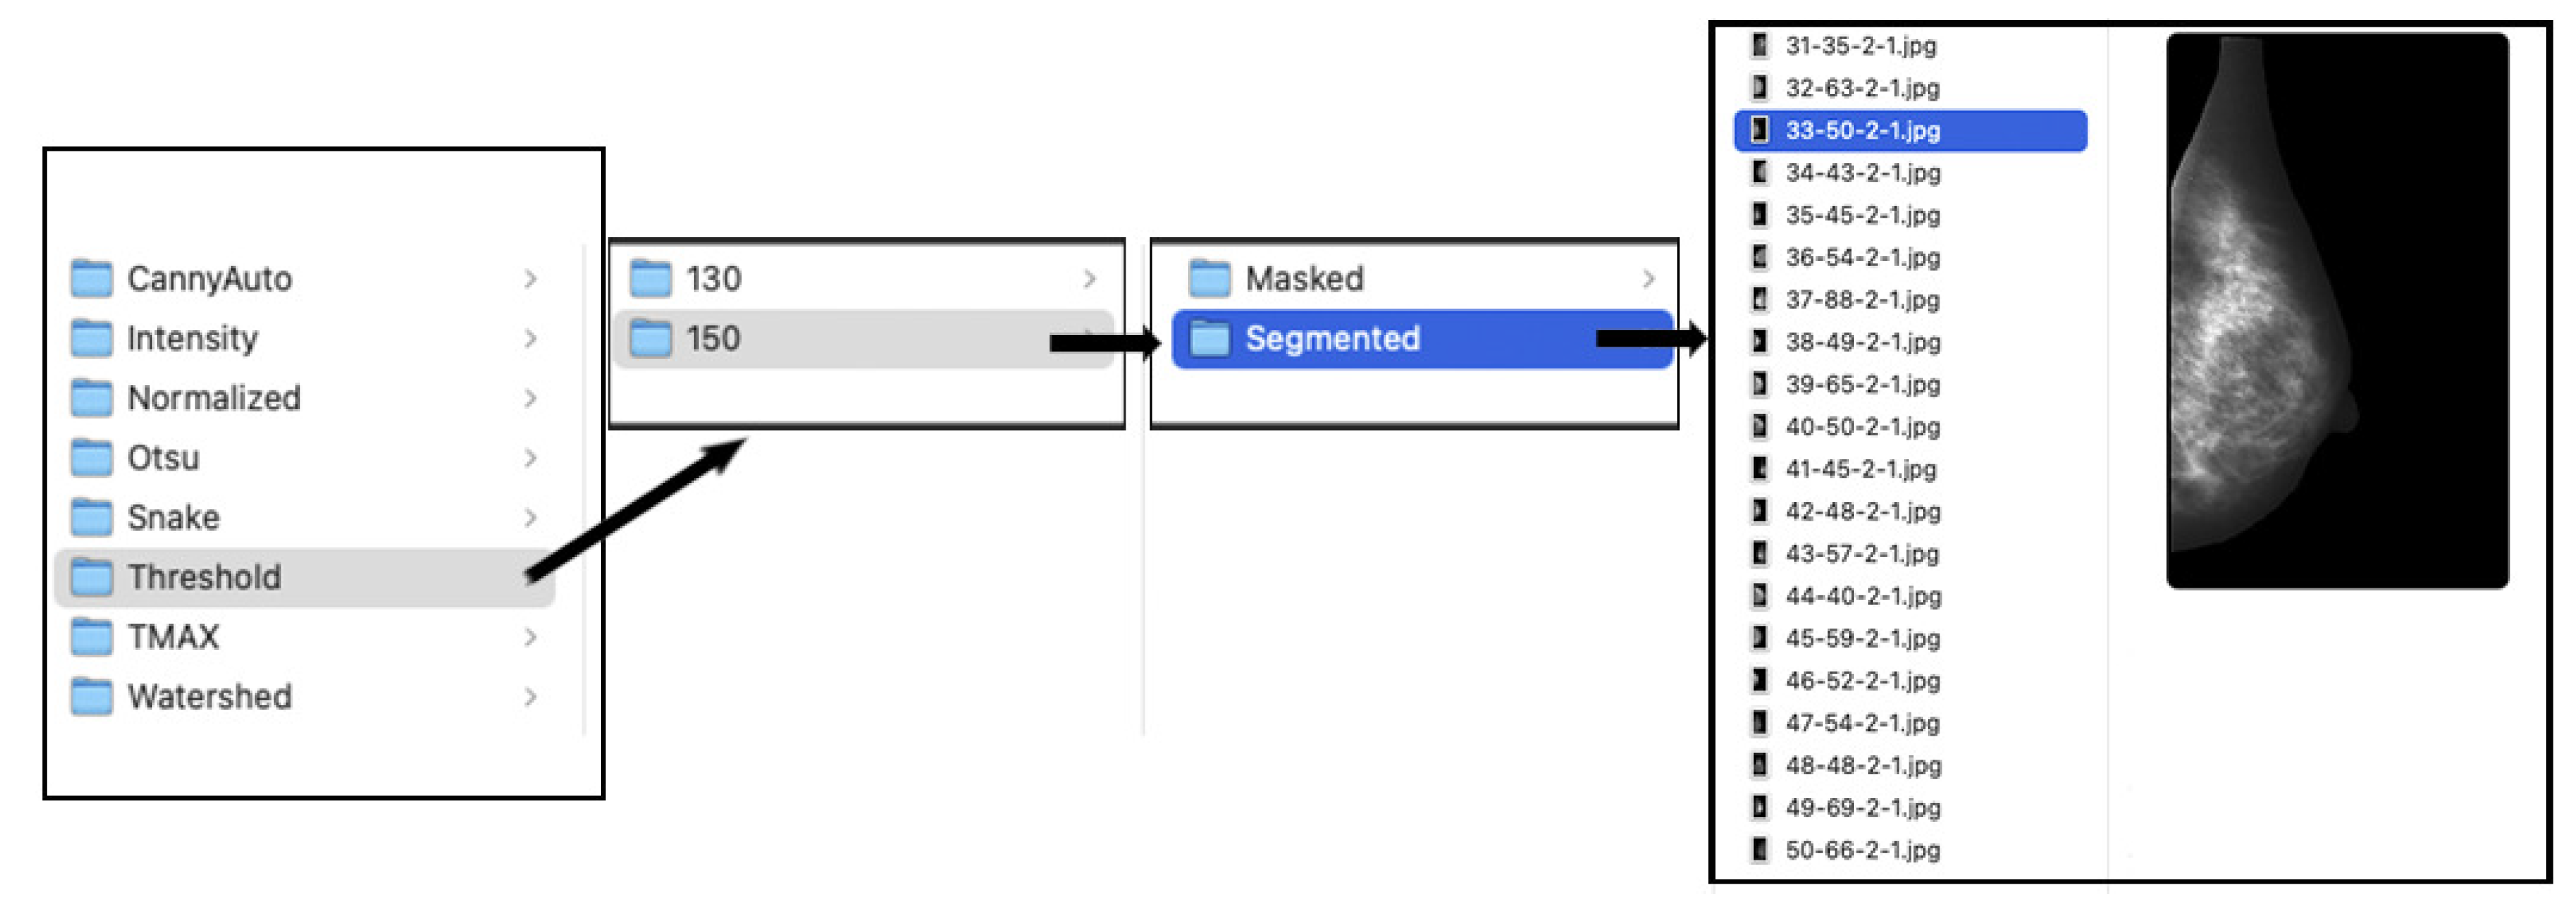
2.2. Digital Repository and Distribution

This application was developed using the App Designer of Matlab 2021a® and distributed with a free open source license. One of the main aims of this work is to provide a tool for the community to facilitate the use of image processing tasks. The main idea is to offer this tool to the scientific community in order to improve and incorporate new features and capabilities. For this reason, an open free source and redistribution are available for users. However, the redistribution and use in source and binary forms, with or without modification, are permitted, provided that the following conditions are fulfilled:
1.
Redistributions of source code must retain the above copyright notice [26], this list of conditions and the following disclaimer;
2.
Redistributions in binary form must reproduce the above copyright notice, this list of conditions and the following disclaimer in the documentation and/or other materials provided with the distribution;
3.
Neither the name of the copyright holder nor the names of its contributors may be used to endorse or promote products derived from this software without specific prior written permission;
4.
Respect and to be responsible by giving credit and acknowledging of this work. As a code of ethics, users must be appreciate our effort and reference this work on their future scientific purposes.
Licensing clarifies the rights of author according to the Berkeley Software Distribution (BSD) available on the file exchange licensing.
Three different redistribution options are available for users. All of them can download in a GitHub repository [26]. Firstly, it is available to download the full MedicalSeg source for Matlab developers that want to use the code according to their necessities. Secondly, an APP package was created to be installed in the main App panel of Matlab workstation. It facilitates the use of this application creating a shortcut icon of this App. Furthermore, a standalone installer file has been created, if users want to run MedicalSeg on target machines (Mac, Linux, and Windows) that do not have Matlab installed. However, some requirements are need in order to run it. All the installation instructions are available at the GitHub repository (Section 2.2).

3. Methods

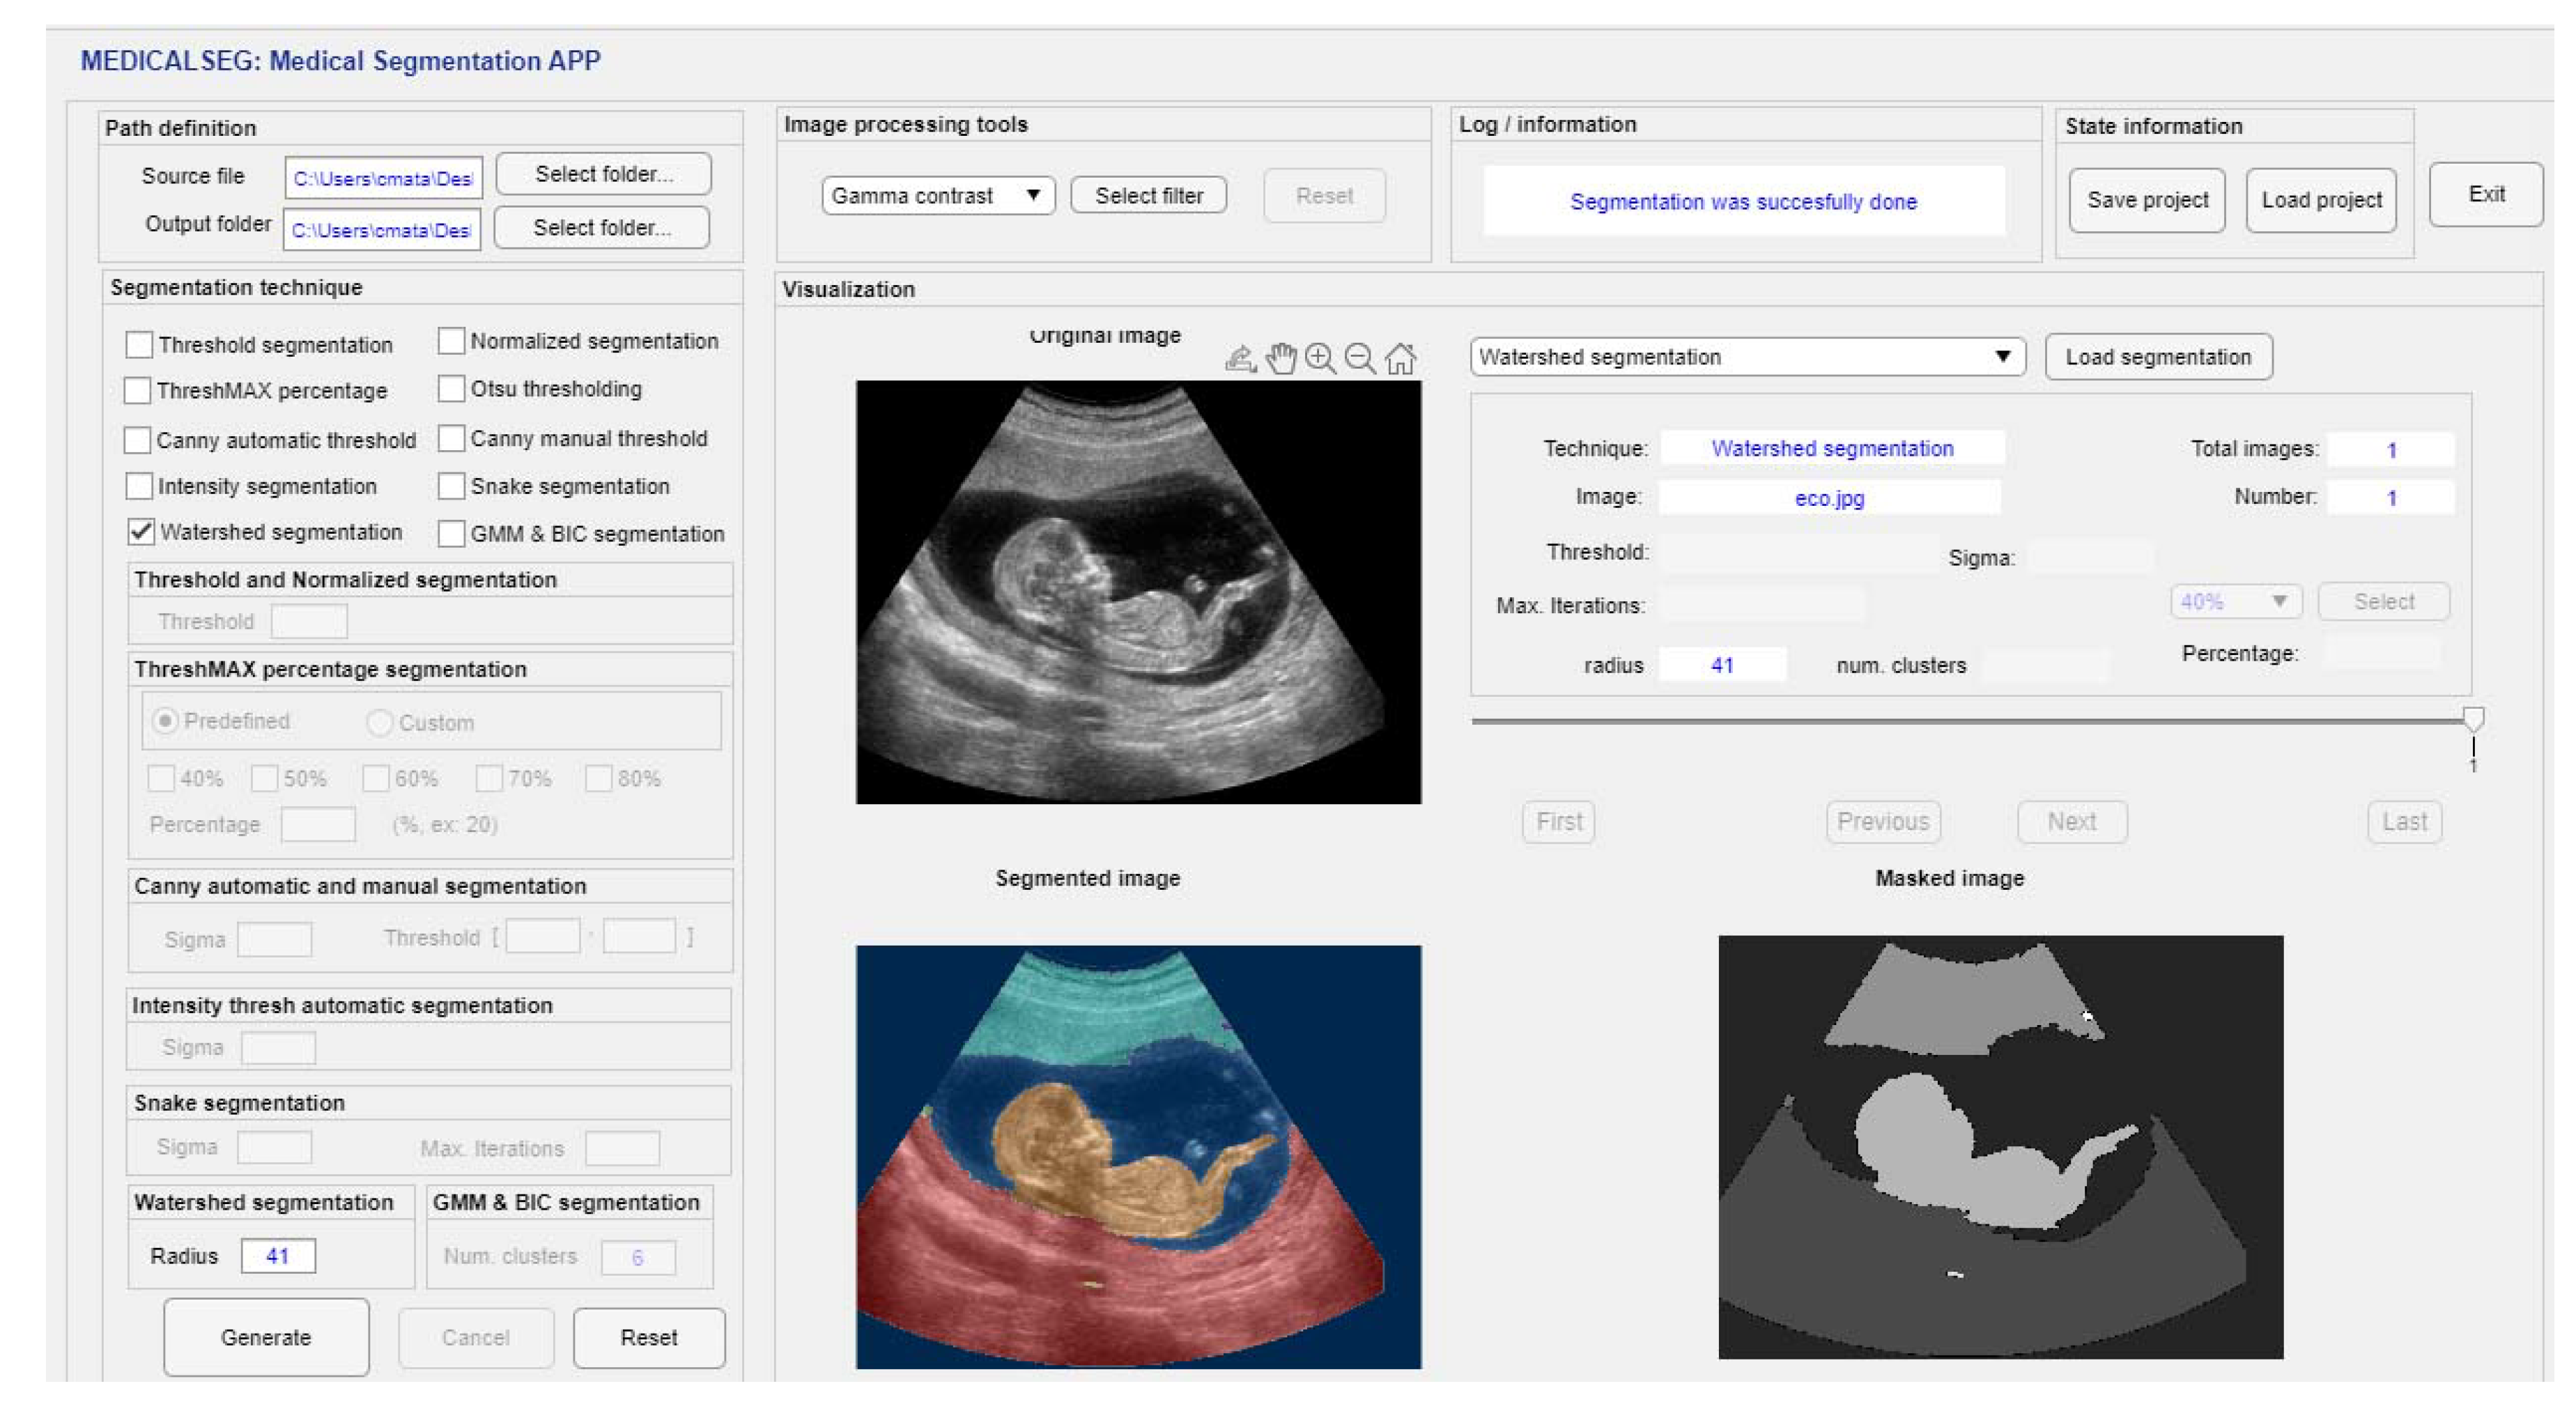
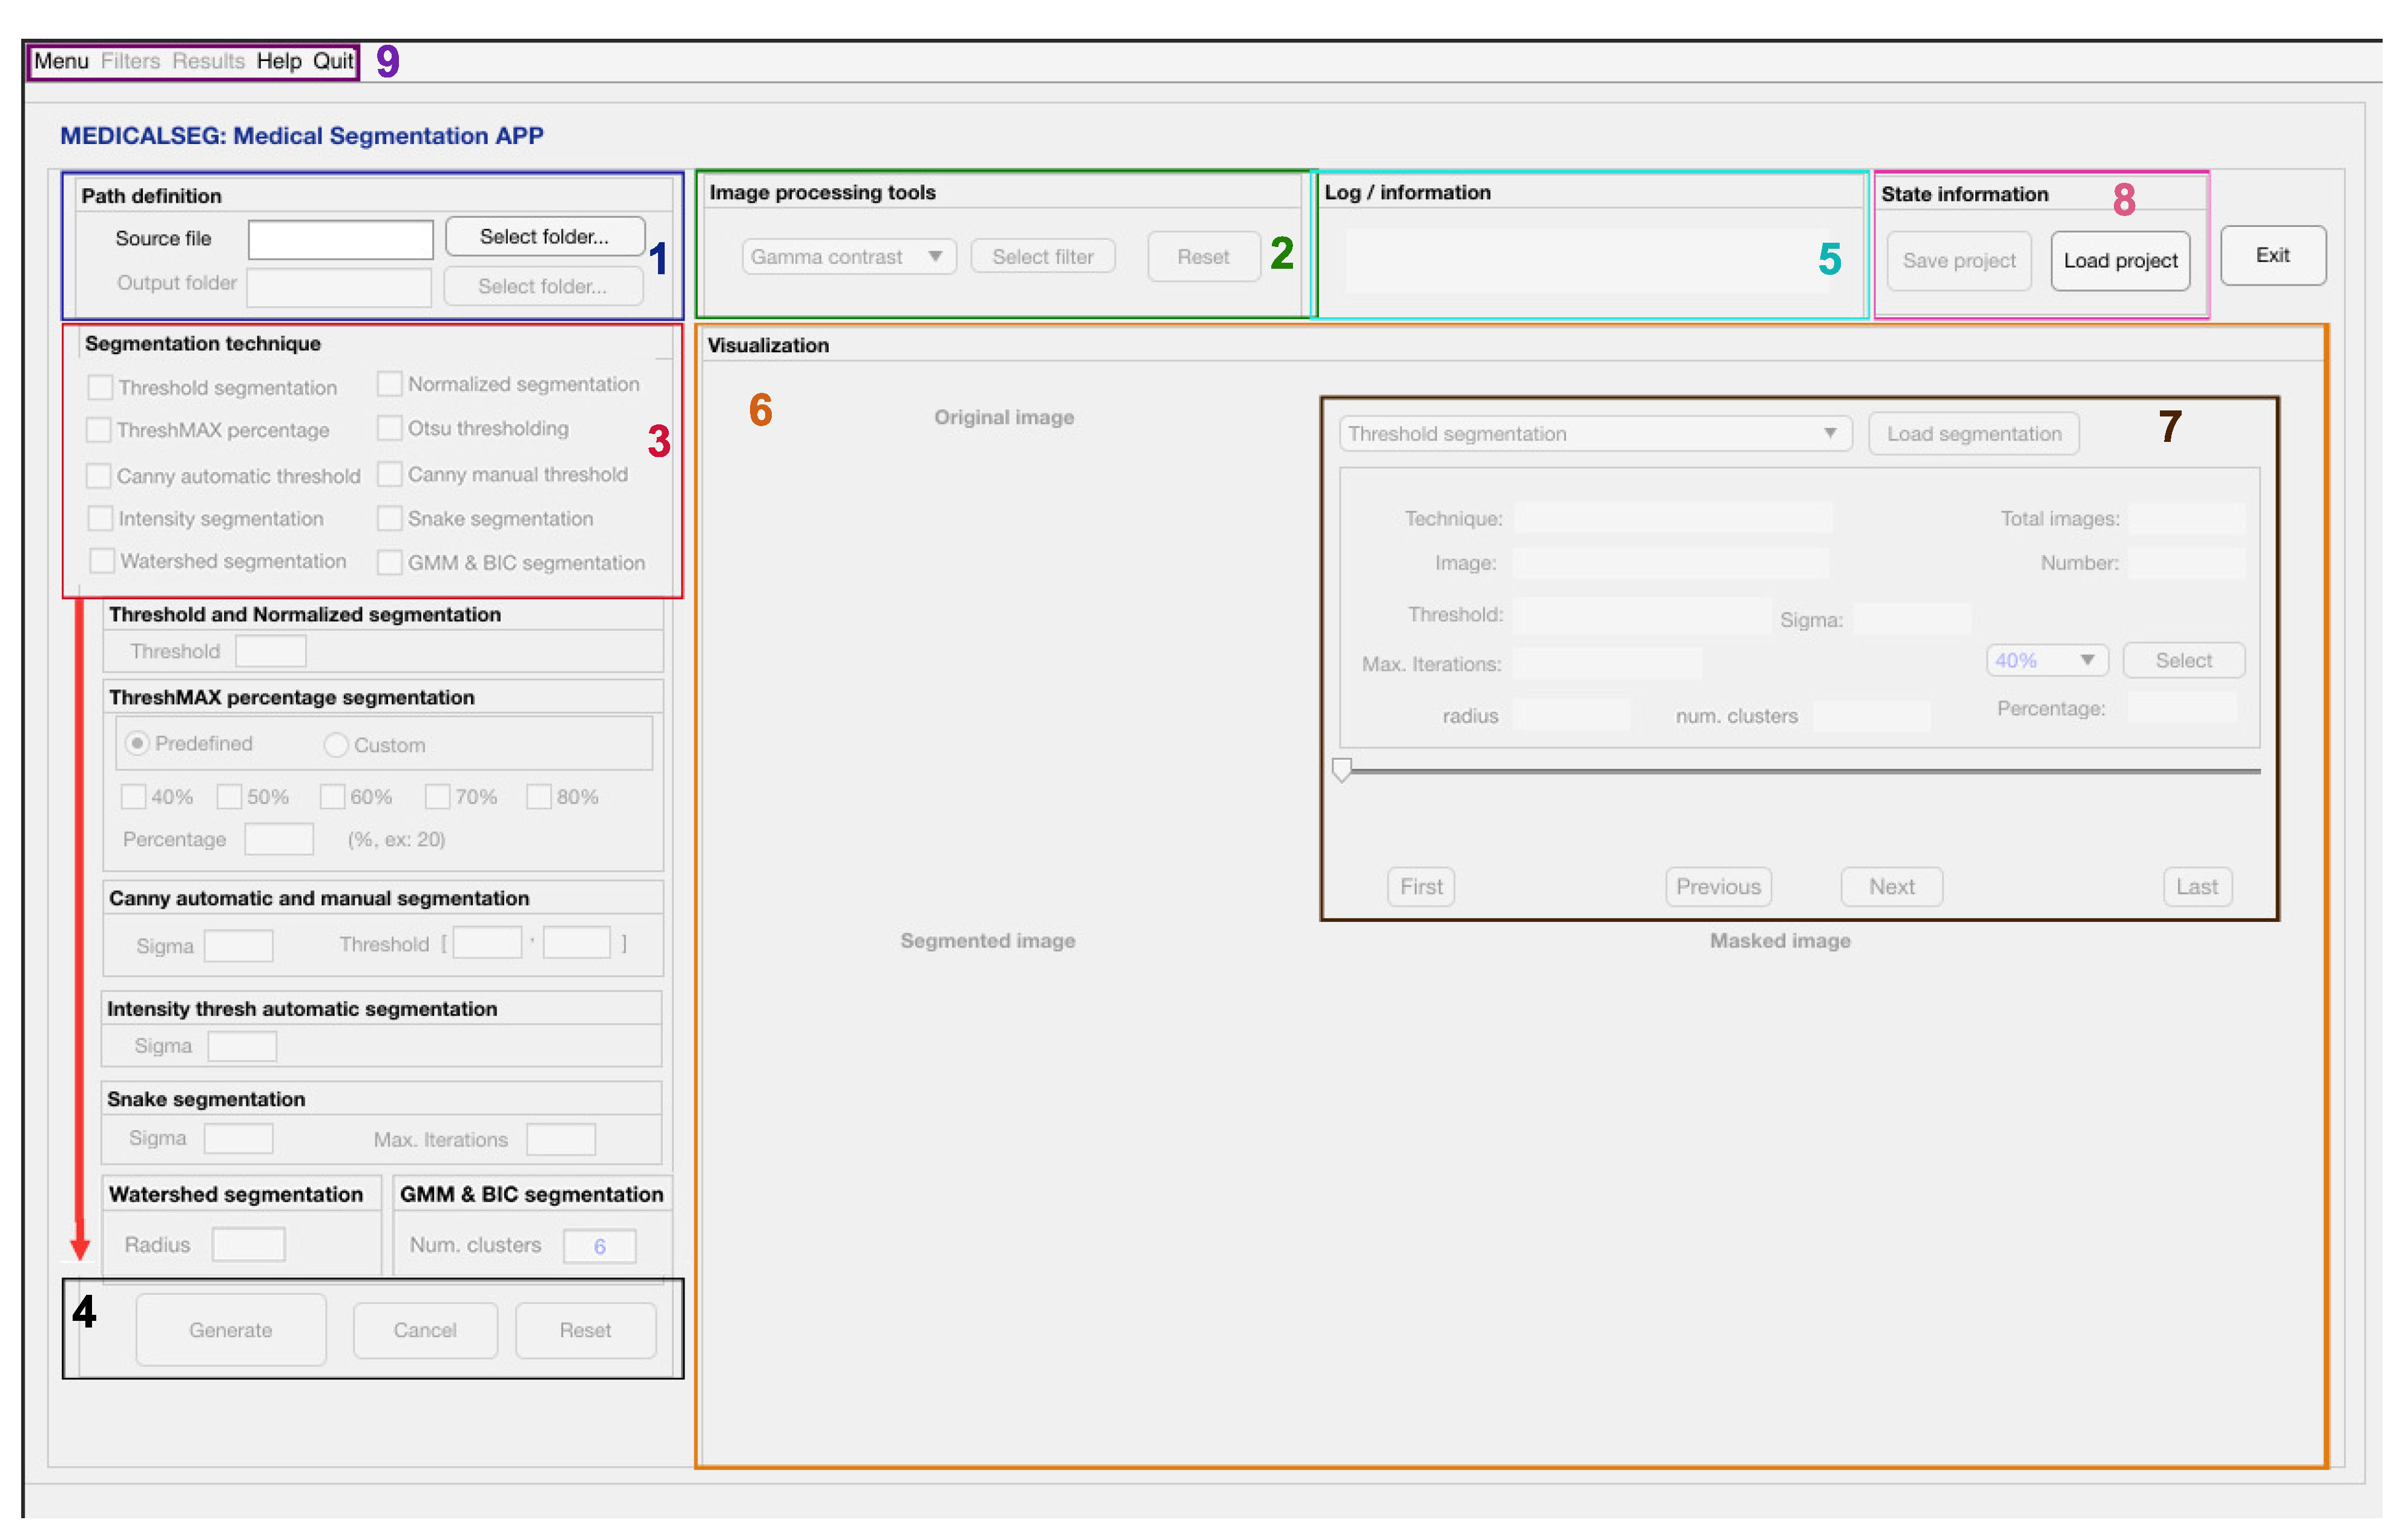
3.1. GUI Interface Design

Herein, a detailed description of the design used to develop the GUI application is explained. The first step is to define the path definition workspace (highlighted on blue box 1 in Figure 2). The users should select an input folder and all the images contained in the folder will be loaded. Moreover, the output folder must be selected to save all the results provided by the segmentation process. In this sense, MedicalSeg is designed in an intuitive way for an easy management of medical images.
Once all the files are successfully loaded, the first image defined as “original image” is displayed. Prior to the segmentation process, a image processing tools panel is enabled (highlighted on green box 2 in Figure 2). Users can use a pre-processing tools, such as gamma contrast, median, Gaussian, Laplacian, and log spatial filters and morphological filters (erode, dilate, open, and close).
Once all the files are successfully loaded and the pre-processing is finished, a panel to manage all the segmentation techniques is enabled (highlighted on red box 3 in Figure 2). Then, users should select all the segmentation techniques by clicking the checkbox area. One of the advantages of MedicalSeg application is that it is possible to select multiple techniques. For each selected technique, the corresponding panel is enabled containing all the parameters that users should fill. These parameters are implemented according to the features of each segmentation technique (Section 3.2). The main goal of the tool is to concentrate those results from previous efforts (algorithms discussed in Section 3.2) in a single one application to make it accessible to the scientific community.
Once the user has filled all the parameters the “Generate” button should be pressed to trigger the segmentation process (highlighted on black box 4 in Figure 2). A “cancel” button can be used to cancel the segmentation process, and “reset” button to refresh the application as an empty state in order to start with a new workspace.
As a consequence of the choices given by the user and an automated manner, new folders are created corresponding to each segmentation technique selected by the user (in the path defined in the output definition). It is important to remark that for each segmented technique a new folder containing the segmented and masked images is generated. The MedicalSeg application offers a log information to know the status of each action (highlighted on cyan box 5 in Figure 2). It is very useful because users can see and verify the process, or visualize errors in case that some procedure went wrong.
During the segmentation process, the users can follow the evolution of the segmentation in the visualization panel (highlighted on orange box 6 in Figure 2). Once the segmentation process is completed, the original, segmented, and masked images are displayed. In the right part of the visualization panel information related to the original image and the selected segmentation technique is depicted.
A pop-up menu appears according to the checkbox area in the segmentation technique panel (highlighted on brown box 7 in Figure 2). To load the results obtained from other techniques, users can change the visualization via a pop-up button. Moreover, a slider bar is also available in order to forward or go back the visualization (next or previous image). The MedicalSeg application supports basic functionalities, such as zoom in/out, move, or rotate between others, to help the visualization of the images. This pre-visualization provides an overview of the results and stored in the selected output folder. As can be seen in an example (Figure 3), a folder is created for each segmentation technique containing all the segmented results according to the criteria chosen by users. The format of the images is saved in jpeg format and in a “mat file”. This option is important if we want to later continue with further post-processing tasks with the obtained results.
MedicalSeg offers some options to manage the configuration of the actual status (highlighted on pink box 8 in Figure 2). Users can save the current work as a project Matlab file pressing the “Save project” button; it is a useful feature as often a user might want to make different tests during their work, and, in this manner, it can retrieve previous results easily using this as a checkpoint. In the same way, one of the advantages of this application is to rapidly loading a previous checkpoint of the work by selecting a project Matlab file.
Finally, a top menu bar is available to help users with the management of the main options as a shortcut access (highlighted on purple box 9 in Figure 2). For example, options to load and save a project, filter options, or access the results folder after the segmentation results are available. Moreover, an option is provided for accessing repository data sources and a sample of experimental data can be downloaded from this Git-Hub repository (see Section 2.2).

3.2. Segmentation Algorithms

A set of segmentation algorithms are implemented and described in next sections: threshold algorithm (Section 3.2.1), Otsu’s method (Section 3.2.2), ThreshMAX percentage segmentation (Section 3.2.3), Canny manual and automatic edge segmentation (Section 3.2.4), intensity thresh automatic segmentation (Section 3.2.5), segmentation based on active contour models based on snake algorithm (Section 3.2.6), watershed segmentation (Section 3.2.7), and Gaussian Mixture Model (GMM) (Section 3.2.8).

3.2.1. Threshold Segmentation

One of the most common ways to extract objects from the background is to select a threshold value ( T h ) applicable over an entire image. Any point ( x , y ) of the image at which f ( x , y ) > T h is called an object point; otherwise, the point is called background point. In other words, the segmented image g ( x , y ) , is given by:
g ( x , y ) = 1 , i f f ( x , y ) > T h 0 , i f f ( x , y ) T h
The process given in this Equation (1) is referred to as global thresholding. The term local or regional thresholding is sometimes used to denote variable thresholding in which the value of T h at point ( x , y ) in an image (I) depends on properties of neighbourhood of ( x , y ) . Moreover, that point ( x , y ) corresponds to a pixel value of the matrix obtained from the image I. The most challenging part of using this segmentation technique is to find the accurate threshold value [27].
Moreover, a normalization step was performed in our algorithm. During normalization, the T h value is used as a minimum value ( T m i n ) and a max value ( T m a x ) for each image is calculated using a maximization function. In order to normalize the image according to T. The following equations are applied in order to obtain the normalization matrix of the image T N o r m :
T m i n = T h
T m a x = m a x ( I )
T N o r m = ( I T m i n ) / ( T m a x T m i n )

3.2.2. Otsu Segmentation

Otsu’s method involves iterating through all the possible threshold values and calculating a measure of spread for the pixel levels each side of the threshold, i.e., the pixels that either fall in foreground or background [28]. The aim is to find the threshold value where the sum of foreground and background spreads is at its minimum. In this sense, an adaptation of a previous algorithms [29,30] has been used to implement our Otsu’s automatic threshold to MedicalSeg application.

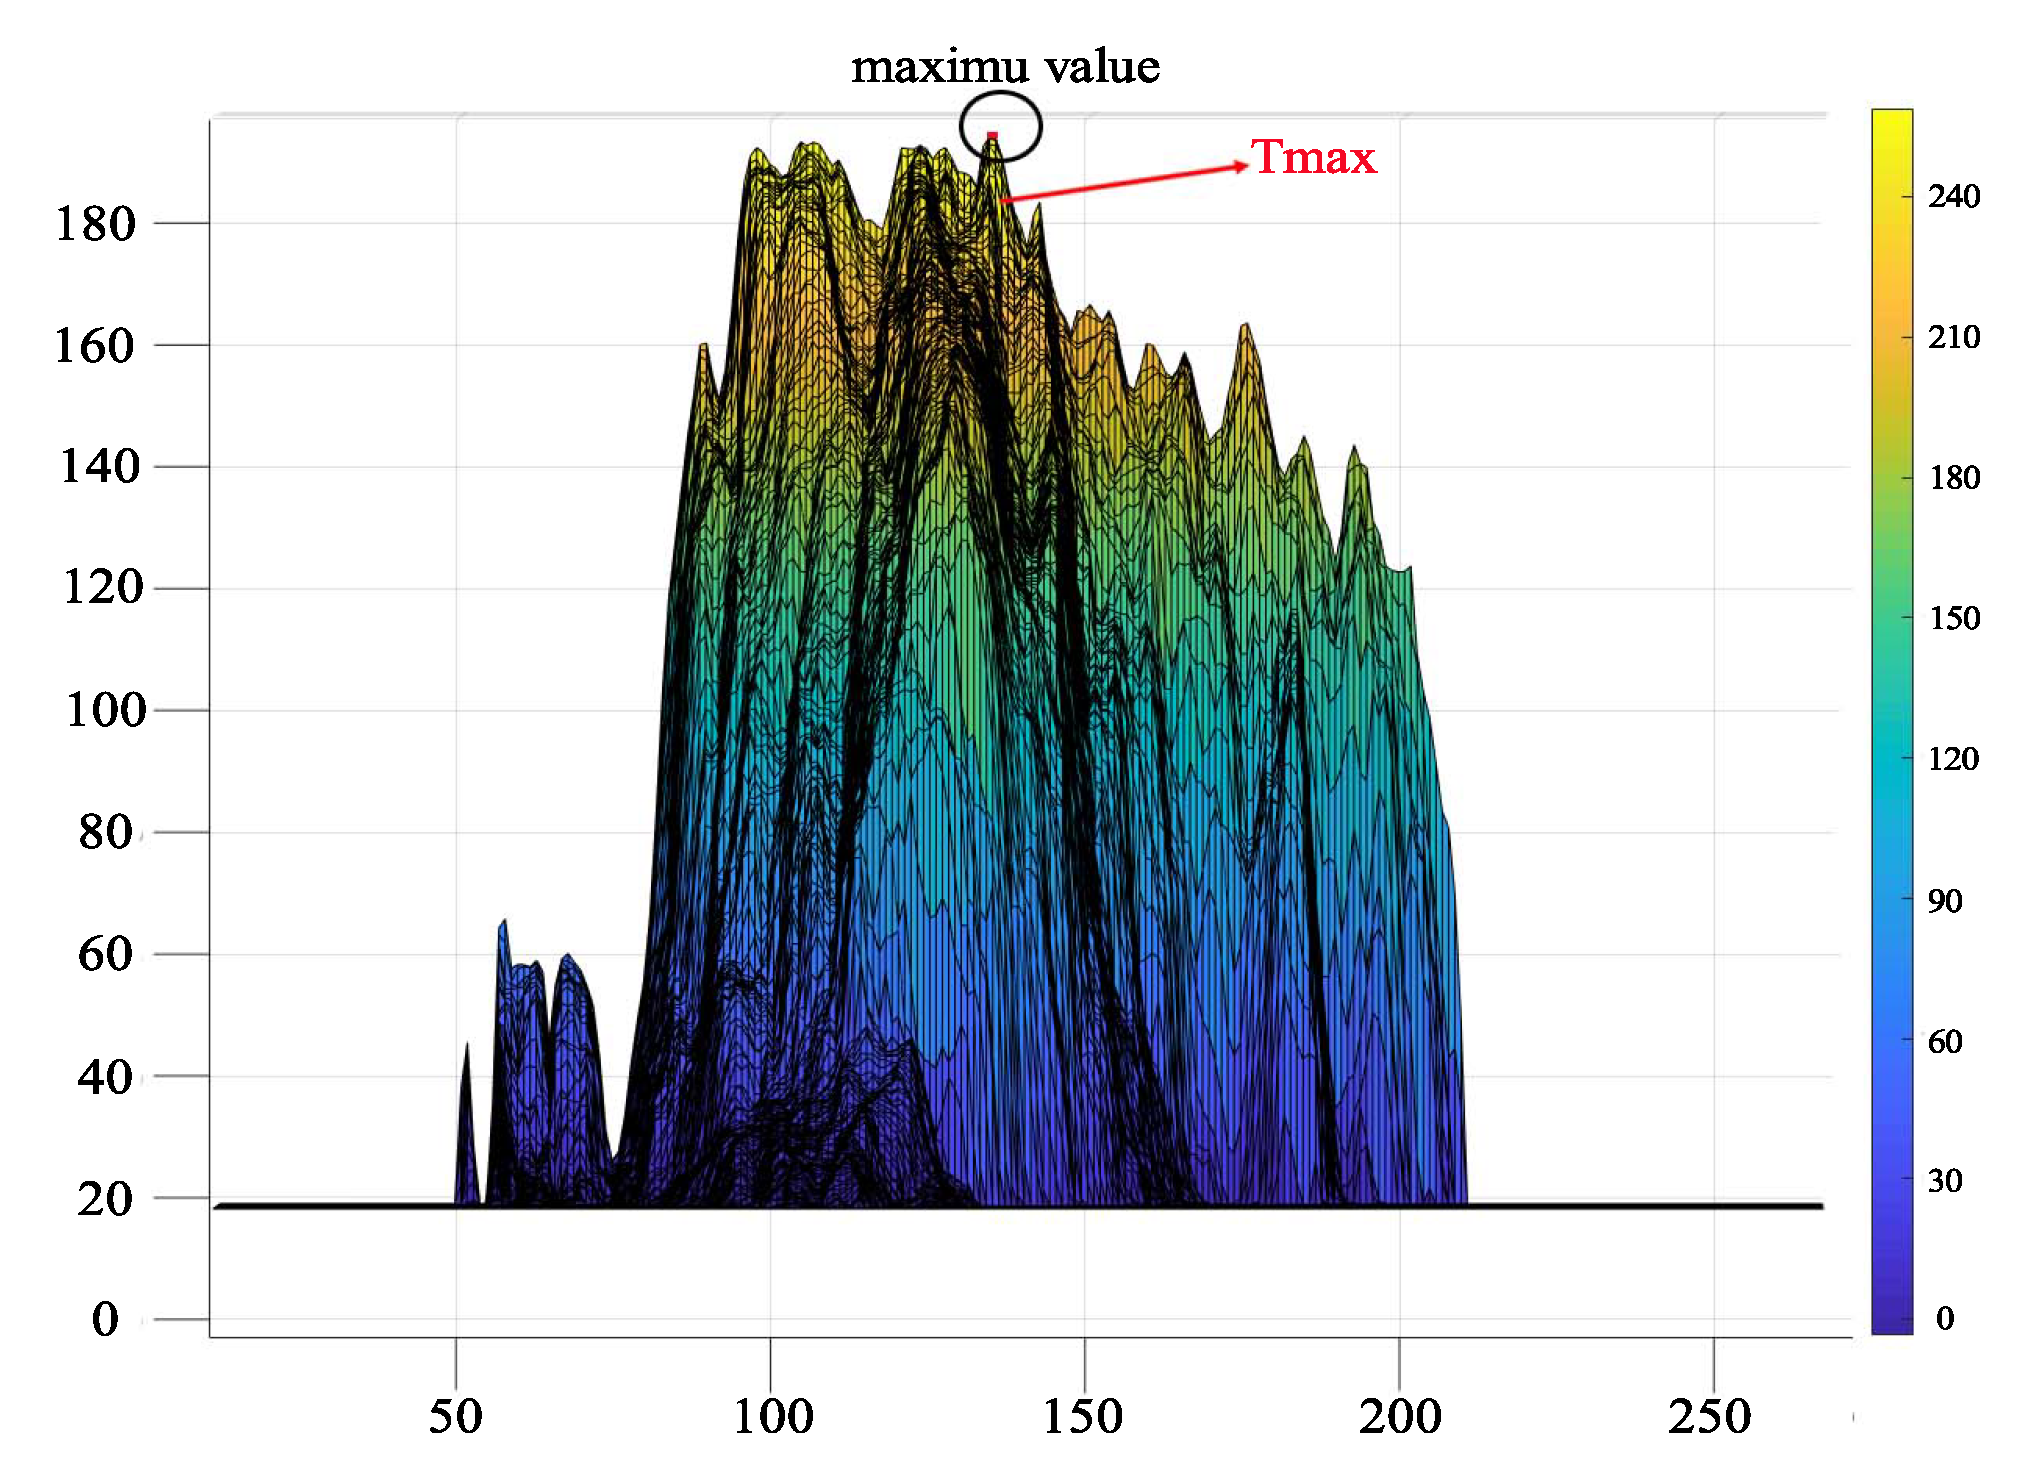
3.2.3. ThreshMAX Percentage Segmentation

A new strategy based on threshold selection has been implemented. Sometimes, it is a tedious process for users to find a correct value of threshold. In this sense, this algorithm automatically calculates an initial threshold value according to a normalization of the maximum in a histogram display. Due to this maximum value is not constant for all the images, it is considered that a representative threshold value, defined as T m a x , is obtained by applying a percentage of 95 % of the maximum value.
As it can be seen in Figure 4, the max value (highlighted in black) corresponds to 1380, but automatically, the algorithm computes the 95% to obtain a representative T m a x (highlighted in red) as a threshold value. After the T m a x is defined as a threshold value, users must use a percentage options that will be applied to T m a x to adjust this threshold. Considering the use of a 100 percentage, the threshold value will be T m a x . Then, the algorithm is computed by multiplying T m a x by the percentage selected by the user. It is another way to accurately set the threshold according to this criteria.

3.2.4. Canny Edge Segmentation

Segmentation methodologies built upon the Canny edge detector allow locating contours in medical images. It is the main reason to include this algorithm in this application. The Canny method is a well known edge detection technique [27,31]. In our implementation, two different options (manual and automatic) for segmentation are used. The first option determines the interval where the threshold search should be conducted.
A manual edge detection algorithm requires as an input parameters the original grayscale image, a sigma value corresponding to the standard deviation of the Gaussian filter to be applied, and a threshold range. Manual segmentation is focused on different steps. First, a Gaussian filter is applied to smooth the image and to remove noise and artefacts. Then, the intensity gradients of the image are calculated, and, afterwards, non-maximum suppression is applied to remove any spurious response in the edge detection stem. Subsequently, a double threshold techniques are used to determine potential edges. Finally, the detection of edges is carried out by suppressing all the other edges that are weak and not connected to strong edges.
A second edge implementation for automatic edge detection is used based on the approach proposed by Farras [32]. This method provides a criterion to reduce, in a significant way, the number of initial values to be considered as threshold candidates compared to manual segmentation. The proposed method can be applied to any feature image provided by an edge detector upon which hysteresis has been implemented. In this case, the inputs required by this algorithm include the original image (in greyscale), a sigma value corresponding to the standard deviation of the Gaussian filter to be applied, and a set of candidate pairs organized in a M x 2 matrix where M is the number of candidates. These candidates are chosen in an unsupervised manner. Users should select the choice of local extremes as the candidates for the hysteresis thresholds. Then, the automated algorithm is capable of identifying the optimum pair of hysteresis thresholds based on the distribution of grey levels in the input image.

3.2.5. Intensity Automatic Threshold

An intensity threshold segmentation approach is also implemented based on previous Otsu’s algorithm and using a standard deviation value ( σ ) for the Gaussian filter and the normalization (grayscale) of the input image [27]. After applying the Gaussian filter, an automatic thresholding from a global threshold of the grayscale image is applied. Then, a threshold that minimizes the interclass variance of the thresholder black and white pixels is chosen. The global threshold can be set using a binarization step to convert a grayscale image to a binary image.
For this purpose, sometimes medical images usually have the presence of noise and intensity algorithms can detect the noisy pixels in easily way. Then, using a modified median-based filter can remove this noise on medical images [33]. It demonstrates that this algorithm can obtain satisfactory segmentation results when it is applied to the noisy images. For the implementation of this algorithm, it has been used a signal processing toolbox provided by Matlab 2021a®.

3.2.6. Active Contour Models: Snakes

The general idea of active contour model is to modify a curve based on certain forces that push the boundaries of such curve until it reaches the border of the object of interest. Usually, the features are lines, edges, and/or object boundaries [34]. Typically, most snake-based algorithms follow the information about the gradient of the image, which means the curve will try to evolve towards the edges of the object. Nonetheless, if the object does not contain well defined edges, or it has been previously smoothed in order to reduce the noise, this algorithm might fail in finding the shape of the object. As a consequence, the outcome will be either a contour that is smaller or larger than the object’s boundaries, or in the worst case, the contour will be reduced until it disappears.
For the implementation, Matlab toolbox provides some functions for manipulating planar, closed splines to implement image or video segmentation by means of deformable (or active) contours. A previous version using a Python implementation was used [22]. In this case, in a Matlab version only a sigma value and a number of iterations are used as an input parameters. Contour topology is managed in a way that should allow changes similar to what can be observed with level sets (merging and splitting but no whole creation).

3.2.7. Watershed Segmentation

The concept of watersheds is based on visualizing an image grayscale distribution in three dimensions (two spatial coordinates versus intensity) similar to a topographic landscape [27,35]. This approach based on morphological watersheds embodies many of the concepts of the previous segmentation algorithms. The main objective is to find the watershed lines and visualize them creating a connected boundaries [36].
The proposed algorithm computes the gradient magnitude as a first step. The gradient (gradient is a directional change in the intensity or colour in an image) is high at the borders of the objects and low inside the objects. Next, it creates a two-dimensional filter of the specified type returning a correlation kernel, which is the appropriate form to use using an image filter function. A variety of procedures could be applied to find the foreground markers, which must be connected blobs of pixels inside each of the foreground objects. In this sense, morphological techniques called “opening-by-reconstruction” and “closing-by-reconstruction” are used to “clean” up the image. These operations will create flat maxima inside each object. Opening is an erosion followed by a dilation, while opening-by-reconstruction is an erosion followed by a morphological reconstruction. Following the opening with a closing can remove the dark spots and stem marks.

3.2.8. Gaussian Mixture Model

Gaussian Mixture Models (GMMs) is a probabilistic model using a soft clustering approach for distributing the points in different clusters [37]. Hence, a Gaussian Mixture Model tends to group the data points belonging a probabilistic distribution of pixel levels p ( x ) . This Gaussian distribution displays a bell-shaped curve, with the data points symmetrically distributed around the mean value [38] given by Equation (5).
p ( x ) = i = 1 N G π i · N ( x | μ i Σ i )
where, N G : number of Gaussians, π i : weights, μ i : centroids, and Σ i : covariance matrix. Finally, a Bayesian Information Criterion (BIC) is used to compare models from the perspective of decision theory by minimizing the balance between model error and model complexity, as measured by expected loss of parsimony [39]. Model parameters are estimated using the Expectation-Maximization algorithm, which is a maximum-likelihood estimation in the presence of latent variables (assignment of pixels to clusters is a latent, unknown variable). Based on this, an adaptation of the algorithm proposed by the work Finite Mixture Models is implemented [40].

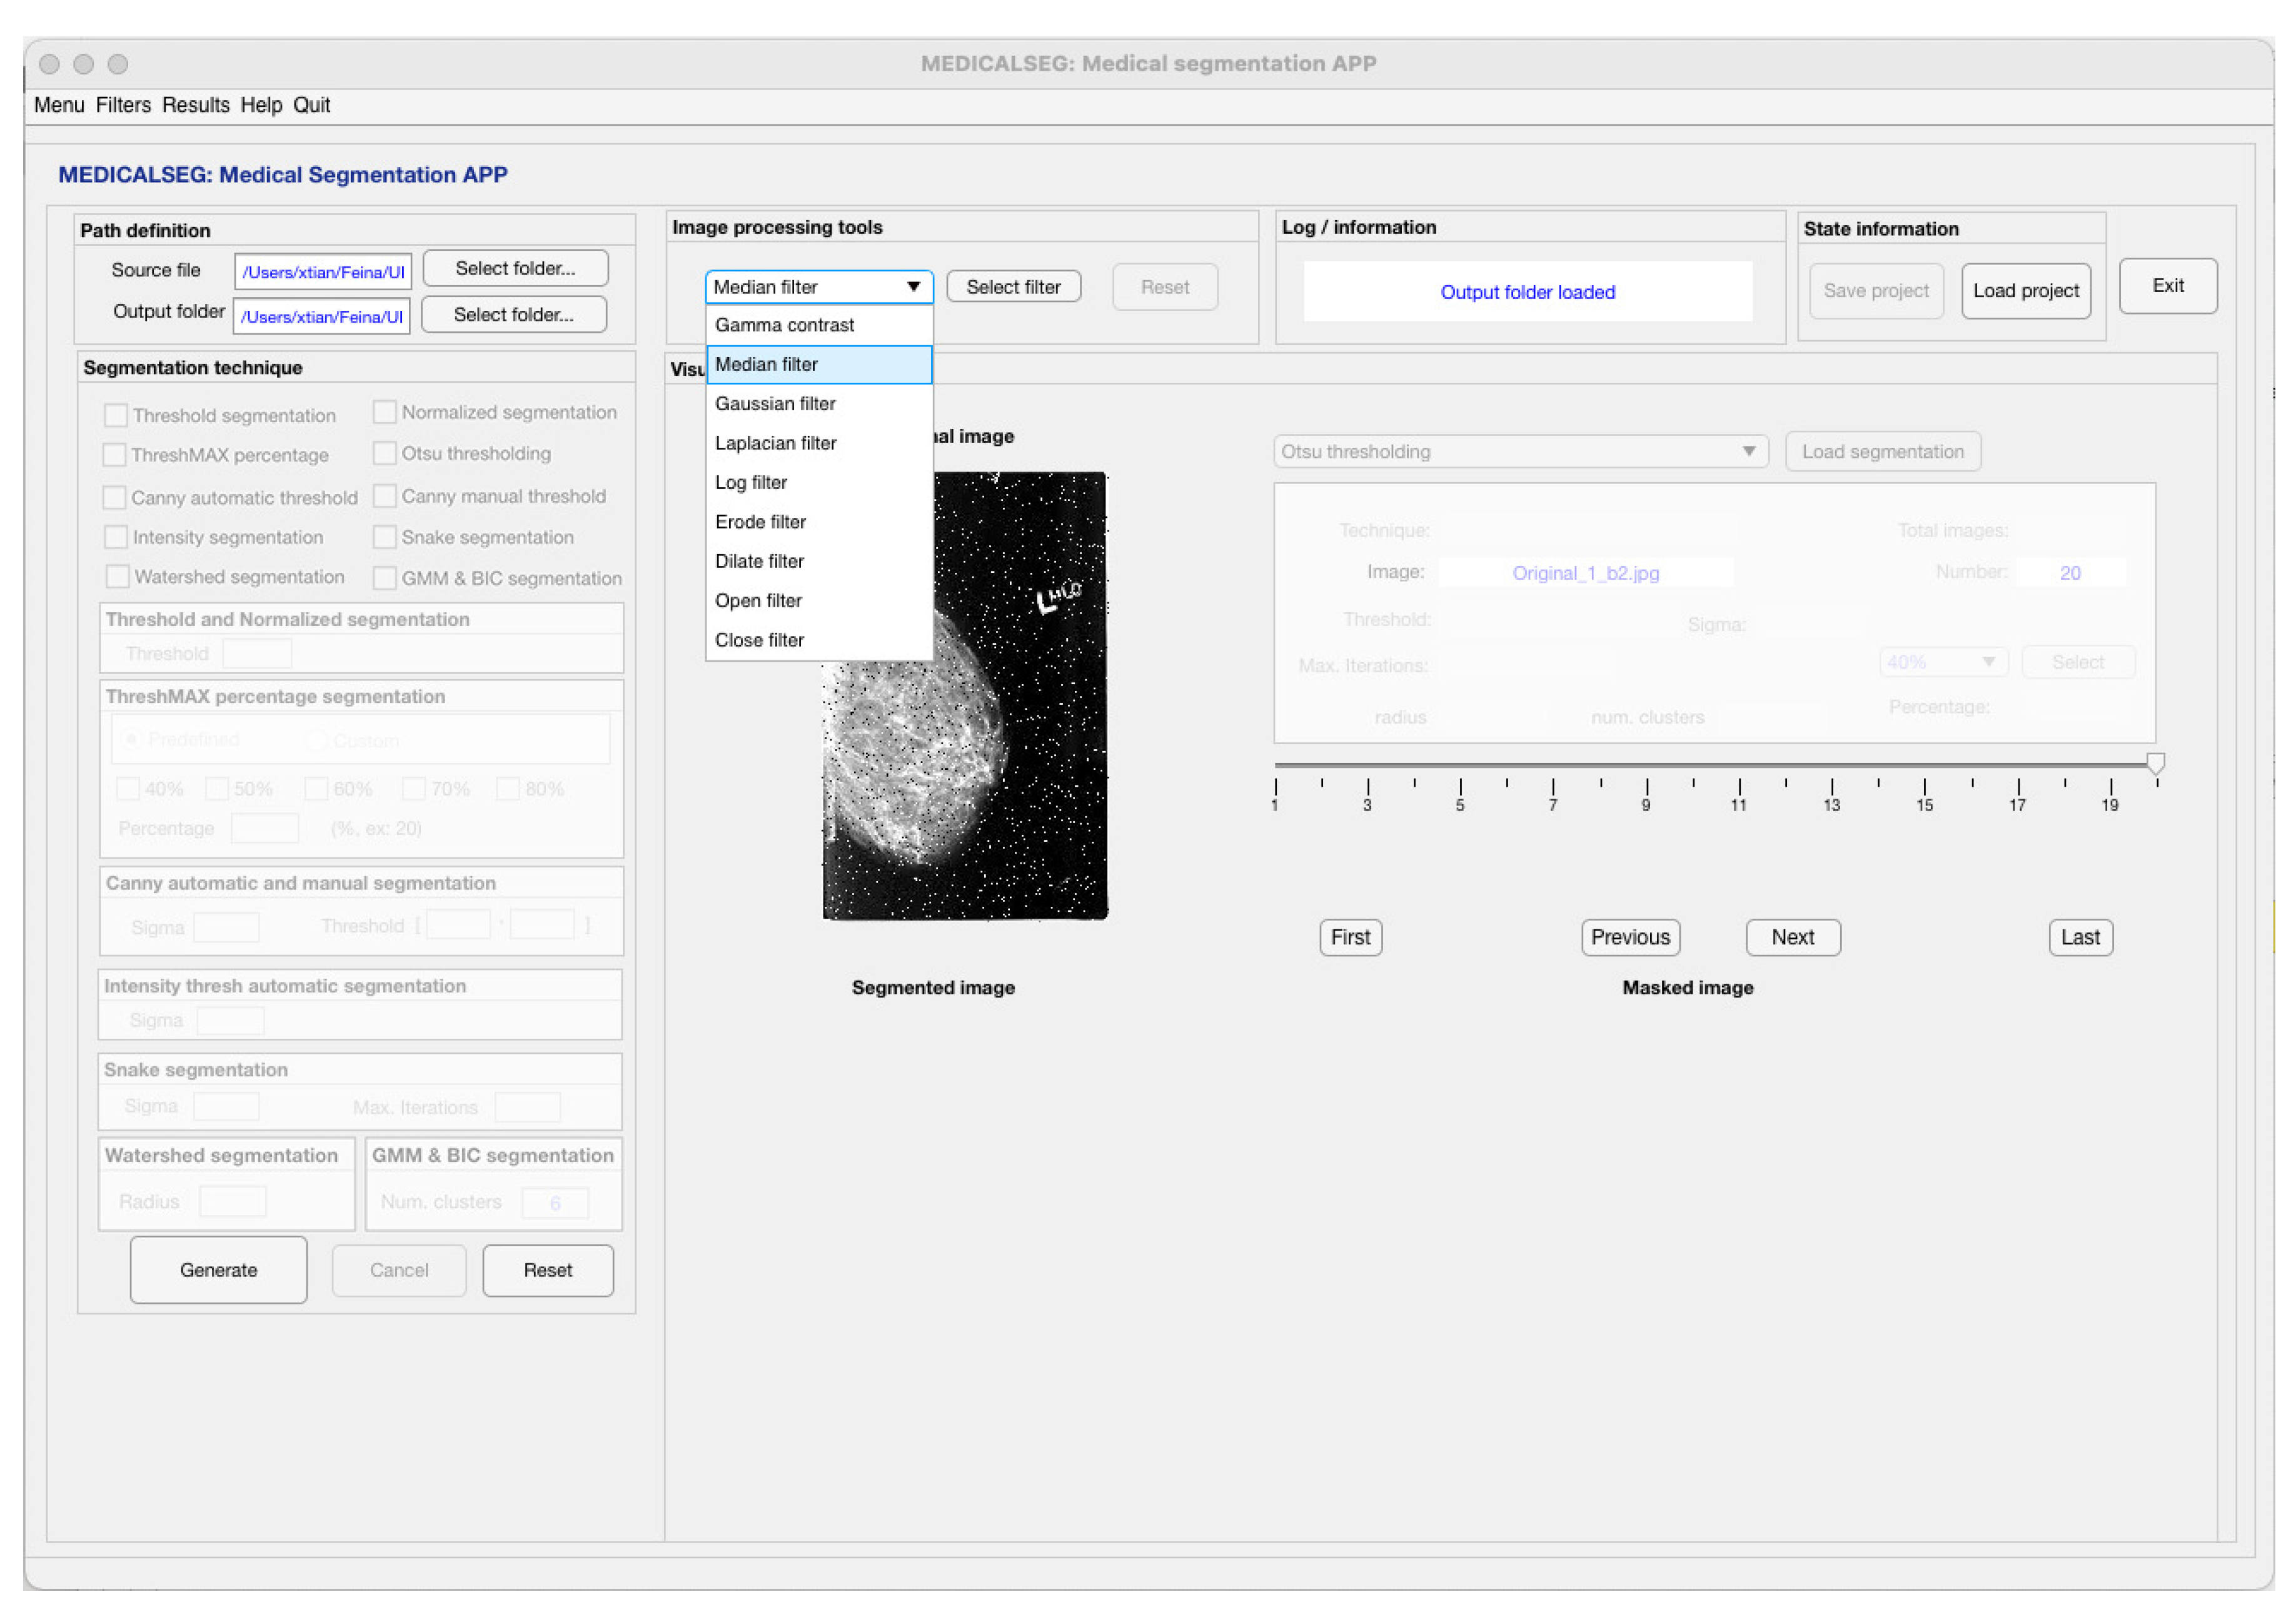
3.3. Image Processing Tools

Different filters have been used to facilitate the visualization and pre-processing part before segmentation. The main implemented filters are lastly exposure Gamma contrast, median, Gaussian, Laplacian, log, and morphology filters, such as erosion, dilation, open, and close filters.

3.3.1. Gamma Contrast Filter

Gamma correction is used to correct the differences between the way a camera captures content, the way screen displays content and the way our visual system processes light. It is the name of a non-linear operation used to code and decode luminance, maximizing the use of the bits or bandwidth relative to how humans perceive light and colour [41].

3.3.2. Gaussian and Median Filters

A Gaussian filter is a low-pass spatial filter used for reducing noise, high-frequency components, and smoothing regions of an image [27]. In this sense, it is similar to the mean filter, but it uses a different kernel that has the shape of the function ‘Gaussian distribution’ to define the weights inside the kernel, which are used to compute the weighted average of the neighbouring points (pixels) in an image. Moreover, a median filter is a smoothing filter and it removes speckle noise and impulsive noise from the image, especially impulse and salt and pepper noise. As the median filter is applied onto an image, each pixel is replaced with the median value of its neighbours. One of the main advantages of the median filter is that it also preserves the edges present in the image. Furthermore, it does not introduce new pixel values since it only re-use existing pixel values from the window.

3.3.3. Laplacian and Log Filters

The Laplacian of an image highlights regions of rapid intensity change and is an example of a second order or a second derivative method of enhancement [42]. It is particularly good at finding the fine details of an image. Any feature with a sharp discontinuity will be enhanced by a Laplacian operator.

3.3.4. Morphological Filters

Erosion is a morphological filter where the value of the output pixel is the minimum value of all pixels in the neighbourhood. By using erosion, islands and small objects can be removed so that only substantive parts remain. It acts like a local minimum filter [27]. Opposite to erosion, dilation filter adds a layer of pixels to both the inner and outer boundaries of regions so that the value of the output pixel is the maximum value of all pixels in the neighbourhood. Therefore, it acts like a local maximum filter. Dilation can be used to make objects more visible and fill in small holes in objects.

4. Results and Discussion

According to the databases explained in the previous Section 2, a demonstration of the obtained results applying segmentation techniques and performance analysis are described in this section. Firstly, a pre-processing example testing the filters and showing the usability of these processing tools are described in this Section 4.1. Then, different examples testing the proposed segmentation algorithms are described. The purpose is to apply each segmentation technique for each one, and discuss the advantages or disadvantages comparing the obtained results.

4.1. Pre-Processing Test

Once all the images are successfully loaded to MedicalSeg application, before to the segmentation process a first pre-processing step could be required. Sometimes, the acquisition machines print labels, depicts blurring or noise regions, and it is important to be processed before the segmentation process.
Figure 5 shows an example of a digital mammography image tagged with noise (it has been taking this image as example to demonstrate the usability of the pre-processing tools). As can be seen, there are nine filters implemented on our tool: statistical filters, such as median filter, laplacian filter, log filter, or gamma contrast. Secondly, morphological filters, such as erode filter, dilate filter, open filter, and close filter. For this example, selecting the corresponding filter a pop-up window is displayed. In this case, a median filter is used in order to remove the noise (Figure 5).

4.2. Experimental Test

After the pre-processing step (if necessary), users can select one of the segmentation algorithms at the same time. For each image, the segmented and masked images are generated and saved in a folder. In addition, all results are displayed in the application as a first preview. Often, there are long data repositories using the same acquisition system and the same protocol settings. If users can find a good procedure to segment a region of interest, it can be an excellent role to obtain many segmentation results for a long dataset. In addition, this configuration can be saved as a project file to be loaded for next time.
One of the main advantages of this tool is that users can easily compare all the results of each segmentation technique. It is clear that not all segmentation techniques serve the same purpose. The idea is to offer different possibilities for users to select and choose the right technique according to the main objective. In the following, some results obtained using different images and segmentation techniques will be shown.
Obviously, there are segmentation techniques that will not be useful depending on the image used. However, in general, with precision and using a dedicated study, excellent results have been obtained (Figure 6). In this case, a Watershed algorithm is used to segment regions in an ultrasound image. It is evident, that region growing or clustering techniques can be useful for this purpose. Threshold or active contour models can be adapted for other image modalities. Moreover, this example shows the total visualization of the GUI interface of MedicalSeg. In Figure 7 a GMM and snake algorithms are selected and compared to segment regions of mammographic images. All the results have been displayed to visualize and compare the obtained segmentations.
On the other hand, Figure 8 is the example of image that is difficult to segment without a previous pre-defined region. There are a lot of structures that depending of the algorithm, the process could be tedious with bad results. In this example, edge detection (Canny automatic threshold) or Otsu method can be a good options if the idea is to segment the contours of the image. Snake or intensity algorithms are suitable alternatives as well.
More examples are tested to segment regions of a magnetic resonance angiography of the brain (Figure 8). In this case, intensity segmentation is used to obtain the skeleton of the main structure of the arteries. Again, watershed is used to obtain sub-regions of the main structure, and GMM could be more precise in order to obtain the segmentation of these regions.
As a main purpose, the intention is to provide a tool useful to detect edges and use the generated masks to solve clinical problems, such as delimiting areas of interest, such as the prostate in perfusion images in MRI (Figure 8). Another example is to use a tool to segment the pectoral part of a mammogram in X-rays, or to quantify the dense or non-dense tissue of a breast with texture visualization (Figure 7). Moreover, another example using different techniques to know the clinical applicability of our approach applied to a slice image obtained from a TRANCE sequence is depicted in Figure 9. The interest could be conducted to find different regions of interest and clinical purposes, such as the presence of vascular brain malformations, circle of Willis, among others. This paper does not intend to give as much detail on the objectives that a radiologist or physician may have, but rather to demonstrate the usefulness of this tool for use in multiple disciplines.

4.3. Performance Analysis

The robustness and quality of the proposed segmentation methods have been evaluated. A digital retinal database for vessel extraction has been used for this evaluation [24]. This database provides true segmentation data that have been compared with our segmentation results. An example of a DSC comparison of the segmented images against a reference ground truth is depicted in Figure 10. This comparison shows the masks on top of each other. The different colours represent true positive pixels (TP, in white), true negative pixels (TN, in black), false positives (FP, in green), and false negatives (FN, in magenta). For this example, Threshold, Normalized, Intensity, and Snake segmentation results indicate a good correlation between the GT and the mask. Otherwise, Canny and Watershed are the worst algorithms for this purpose because one is based on a contour-based, and the other is region-based.
In order to perform a quantitative evaluation of the segmentation result we use the Sørensen–Dice Similarity Coefficient (DSC) [43] defined as twice the intersection between the segmentation mask S and the ground truth mask (GT) G T over union of both sets
D S C = 2 | S G T | / ( | S | + | G T | ) = 2 T P 2 T P + F P + F N
where T P stands for true positive pixels (i.e., pixels that take a value of one in both in S and G T ), F P for false positives (one in S but zero in G T ) and F N for false negatives (pixels that are zero S but one in G T ).
The DSC coefficient as a numeric scalar or numeric vector with values in the range [0, 1] and a value 1 indicates that the segmentation and ground truth masks are identical. As it can be observed in Figure 10, the best algorithm for this purpose is Otsu followed by GMM and ThreshMAX segmentation. This evaluation performance demonstrates that MedicalSeg is a useful tool to generate ground truth and which allows to compare their effectiveness and select the best algorithm for a given application.
Summarizing, Figure 10 represents the differences between the correct solution and our results. On the one hand, the green region indicates the difference areas compared to the ground truth. On the other hand, the purple shows just the opposite, with the two algorithms showing that the results are further away from the ground truth.
The purpose is not to compare our application with other medical tools available online, such as Fiji/ImageJ, 3D slicer, Horus/Osirix—OsiriX DICOM Viewer, Matlab apps, ICY, QuPath, or CADs, among others. All of them are excellent applications and allow to perform segmentations, pre-processing tools, filters similar to the ones we propose in this work, but the big difference is that you usually have to do it manually one by one. Currently, we use MedicalSeg to massively generate large volumes of segmented data with their respective masks. This application automatically generates a folder with all the masks of the block segmentations. In fact, one of the main advantage is the easy access and management of the results. This application represents a first step towards a robust tool to generate automatically and manual management ground truth data using medical images. In this sense, MedicalSeg can be used for artificial intelligence purposes, such as data augmentation.
Furthermore, a little validation compared to ImageJ [44] using the same ground truth (GT) database depicted in Figure 10 is performed. ImageJ has been chosen because we consider this tool as a reference in medical applications, and also because it contains most of the segmentations techniques that are used in MedicalSeg. In this sense, Table 1 shows the results obtained against a comparison between the G T compared with the ground truth corresponding to MedicalSeg, and G T vs. ImageJ, respectively. Finally, a last comparison between MedicalSeg vs. ImageJ was also performed. As a main conclusion, the results obtained using ImageJ and MedicalSeg are quite similar compared with the ground truth and demonstrates the quality of the proposed segmentation approaches included in our application.
In order to evaluate the performance of MedicalSeg a random case is used for each database. The criteria used to do the performance analysis is based on applying all the segmentation techniques for a group of images. For each set of images, the computation time (in seconds) for each segmentation technique is obtained. Moreover, the same set of images using all the techniques together is also performed. All the obtained results are depicted in Table 2. In this case, the parameters of each segmentation technique are fixed. In the previous section the results obtained for each experimental dataset applying all the segmentation techniques were discussed. In this section, the purpose is to obtain the elapsed time and the quantity of images generated using different experimental datasets.
It is important to remark that in ThreshMAX percentage segmentation technique, the estimation of the elapsed time is performed by evaluating the method whithin a range of percentage options (40% to 80%). In the case of the snake segmentation algorithm the number of iterations was fixed to 30. Finally, Canny edge threshold for manual and automatic options were also computed.
Analysing the results, the Canny edge detector and snake algorithms require more time than the others. It is normal because both algorithms require more steps and parameters that slow down the calculation iterative process. The purpose of this section is to estimate the computational time response according to the parameters presented in this work. Consequently, if users change these parameters the elapsed time will vary according the size of the dataset used for each test and the computing resources used. Finally, the size of the selected images from the dataset were 320 × 240 cm, and the computer used to perform this test was an Intel® Core™ i7-6700 Processor 8M Cache, up to 4.00 GHz, 4 Cores (8 Threats) with 16 GB of RAM memory running in a Windows 10 OS.

5. Conclusions

A new application based on different segmentation techniques using medical databases is presented. The management of MedicalSeg is developed in three main parts: (i) image segmentation development, (ii) the design of a GUI interface, and (iii) management and analysis. The image segmentation tool contains a set of nine segmentation techniques, such as threshold and normalization segmentation, Otsu, ThreshMAX percentage segmentation, manual and automatic canny edge threshold segmentation (manual and automatic), intensity threshold segmentation, active contour model (snake segmentation), Watershed and GMM. The GUI interface is described and a study case of its main functionalities is detailed. Moreover, the analysis of the results are included In order to evaluate this application, five medical datasets (mammography, prostate, retinal, ultrasound, and brain vascular) are tested to prove the usability of this tool. A validation procedure and performance analysis are presented in this work.
MedicalSeg tool demonstrates that the use of the proposed segmentation techniques are useful for medical imaging. A comparison among all the algorithms discussing the advantages and disadvantages of each dataset is performed. At this moment, it has been implemented nine segmentation techniques, but the purpose is continue working on to add more processing tools. MedicalSeg is designed as an open-source platform. In this sense, developer users can add new segmentation techniques to this application being an advantage compared with other medical applications. For this reason, users can adapt to their purposes and evolved methods offered by frameworks such as ITK, among others. The inclusion of segmentation techniques based on convolutional neural networks, such as U-net, could be a good improvement to this tool.
In conclusion, the intention is not to use this tool just to compare segmentations, and creates a tool that substitutes others medical applications. Indeed, the purpose is not trying to compare MedicalSeg with other medical applications that are available online. However, a comparison with reference applications, such as ImageJ, is performed to demonstrate the robustness of the proposed work. Rather, we want users to be able to take advantage of a tool that can choose different models and different techniques on the same time and compare the obtained results. Moreover, the easy interface that automatically save the results in folders facilitating the management of data that could be used for post-analysis purposes. We intend to offer users all these advantages proposed in our work. The interest is always to share knowledge and help the scientific community, in particular in the medical field.

Author Contributions

Conceptualization, C.M. and R.B.; software, C.M.; methodology, all authors; validation, all authors; resources, J.M. and A.L.; data curation, C.M., J.M., and A.L.; writing—original draft preparation, C.M.; writing—review and editing, all authors; visualization, all authors; supervision, R.B. All authors have read and agreed to the published version of the manuscript.

Funding

This research received no external funding.

Institutional Review Board Statement

Not applicable.

Informed Consent Statement

Not applicable.

Data Availability Statement

Not applicable.

Acknowledgments

This work was supported by the Spanish Ministry of Economy and Competitiveness [Project PID2020-116927RB-C22, Agencia Estatal de Investigación funds]. We would like to express our special thanks of gratitude to Paul Walker (Hospital of Dijon, France) to use a set of prostate database for testing.

Conflicts of Interest

The authors declare that they have no known competing financial interests or personal relationships that could have appeared to influence the work reported in this paper.

References

  1. Wong, K. Medical Image Segmentation: Methods and Applications in Functional Imaging. In Handbook of Biomedical Image Analysis; Topics in Biomedical Engineering International Book, Series; Suri, J.S., Wilson, D.L., Laxminarayan, S., Eds.; Springer: Boston, MA, USA, 2005. [Google Scholar] [CrossRef]
  2. Norouzi, A.; Shafry, M.; Rahim, M.; Altameem, A.; Saba, T.; Rad, A.; Rehman, A.; Uddin, M. Medical Image Segmentation Methods, Algorithms, and Applications. IETE Tech. Rev. 2014, 31, 199–213. [Google Scholar] [CrossRef]
  3. Rogowska, J. Overview and Fundamentals of Medical Image Segmentation. In Handbook of Medical Imaging, Processing and Analysis; Elsevier: Amsterdam, The Netherlands, 2000; pp. 69–85. [Google Scholar] [CrossRef]
  4. Ma, J. Cutting-edge 3D Medical Image Segmentation Methods in 2020: Are Happy Families All Alike? arXiv 2021, arXiv:2101.00232. [Google Scholar]
  5. Zgallai, W. Biomedical Signal Processing and Artificial Intelligence in Healthcare; Developments in Biomedical Engineering and Bioelectronics; Elsevier: Amsterdam, The Netherlands, 2020; pp. 241–247. [Google Scholar] [CrossRef]
  6. O’Mahony, N.; Campbell, S.; Carvalho, A.; Harapanahalli, S.; Velasco-Hernandez, G.; Krpalkova, L.; Riordan, D.; Walsh, J. Advances in Computer Vision. In Advances in Intelligent Systems and Computing; Springer: Cham, Switzerland, 2020. [Google Scholar] [CrossRef] [Green Version]
  7. Mr Gloom GitHub. Awesome Semantic Segmentation. Available online: https://resume.github.io/?mrgloom (accessed on 24 February 2022).
  8. Radau, P.; Lu, Y.; Connelly, K.; Paul, G.; Dick, A.; Wright, G. Evaluation Framework for Algorithms Segmenting Short Axis Cardiac MRI. MIDAS J. 2009. Available online: https://doi.org/10.54294/g80ruo (accessed on 15 March 2022). [CrossRef]
  9. Lequan, Y.; Hao, C.; Qi, D.; Jing, Q.; Pheng-Ann, H. Automated Melanoma Recognition in Dermoscopy Images via Very Deep Residual Networks. IEEE Trans. Med. Imaging 2017, 36, 994–1004. [Google Scholar] [CrossRef]
  10. Chang, C.-S.; Lin, J.-F.; Lee, M.-C.; Palm, C. Semantic Lung Segmentation Using Convolutional Neural Networks. In Bildverarbeitung für die Medizin 2020; Springer: Wiesbaden, Germany, 2020; pp. 75–80. [Google Scholar] [CrossRef]
  11. GitHub imlab-uiip Repository. Mammography Segmentation. 2021. Available online: https://github.com/imlab-uiip (accessed on 10 March 2022).
  12. Scotty Kwok, GitHub Repository. Cervix. 2017. Available online: https://github.com/scottykwok/cervix-roi-segmentation-by-unet (accessed on 18 February 2022).
  13. Li, W.; Qin, S.; Li, F.; Wang, L. MAD-UNet: A deep U-shaped network combined with an attention mechanism for pancreas segmentation in CT images. Med. Phys. 2021, 48, 329–341. [Google Scholar] [CrossRef]
  14. Christ, P.F.; Ettlinger, F.; Grün, F.; Elshaera, M.E.A.; Lipkova, J.; Schlecht, S.; Ahmaddy, F.; Tatavarty, S.; Bickel, M.; Bilic, P.; et al. Automatic Liver and Lesion Segmentation in CT Using Cascaded Fully Convolutional Neural Networks and 3D Conditional Random Fields; Springer International Publishing: Berlin, Germany, 2016; pp. 415–423. [Google Scholar] [CrossRef] [Green Version]
  15. Marko Jocic GitHub Repository. Ultrasound Nerve Segmentation. 2018. Available online: https://github.com/jocicmarko/ultrasound-nerve-segmentation (accessed on 20 February 2022).
  16. Anthimopoulos, M.; Christodoulidis, S.; Ebner, L.; Christe, A.; Mougiakakou, S. Lung Pattern Classification for Interstitial Lung Diseases Using a Deep Convolutional Neural Network. IEEE Trans. Med. Imaging 2016, 35, 1207–1216. [Google Scholar] [CrossRef]
  17. Mendrik, A.M.; Vincken, K.L.; Kuijf, H.J.; Breeuwer, M.; Bouvy, W.; de Bresser, J.; Alansary, A.; de Bruijne, M.; Carass, A.; El-Baz, A.; et al. MRBrainS Challenge: Online Evaluation Framework for Brain Image Segmentation in 3T MRI Scans. Comput. Intell. Neurosci. 2015, 2015, 813696. [Google Scholar] [CrossRef] [Green Version]
  18. Ronneberger, O.; Fischer, P.; Brox, T. U-Net: Convolutional Networks for Biomedical Image Segmentation. arXiv 2015, arXiv:1505.04597. [Google Scholar]
  19. Varma, D. Managing DICOM images: Tips and tricks for the radiologist. Indian J. Radiol. Imaging 2012, 22, 4–13. [Google Scholar] [CrossRef]
  20. Mata, C.; Freixenet, J.; Lladó, X.; Oliver, A. Texture descriptors applied to digital mammography. In Erasmus-Mundus Master in Computer Vision and Robotics (VIBOT); UPC Commons: Barcelona, Spain, 2008; pp. 105–110. [Google Scholar]
  21. Hospital Sant Joan de Déu (HSJD), Esplugues de Llobregat, Barcelona (Spain). Available online: https://www.sjdhospitalbarcelona.org/en (accessed on 11 January 2022).
  22. Rodríguez, J.; Ochoa-Ruiz, G.; Mata, C. A Prostate MRI Segmentation Tool Based on Active Contour Models Using a Gradient Vector Flow. Appl. Sci. 2020, 10, 6163. [Google Scholar] [CrossRef]
  23. Mata, C.; Walker, P.; Oliver, A.; Brunotte, F.; Martí, J.; Lalande, A. Prostateanalyzer: Web-based medical application for the management of prostate cancer using multiparametric mr images. Inform. Health Soc. Care 2015, 87, 1–21. [Google Scholar] [CrossRef]
  24. Kaggle Grandmaster. DRIVE: Digital Retinal Images for Vessel Extraction. 2021. Available online: https://www.kaggle.com/datasets/andrewmvd/drive-digital-retinal-images-for-vessel-extraction (accessed on 18 April 2022).
  25. Van den Heuvel, T.; De Bruijn, D.; De Korte, C. Automated measurement of fetal head circumference using 2D ultrasound images. PLoS ONE 2018, 13, e0200412. [Google Scholar] [CrossRef]
  26. Mata, C. MEDICALSEG Application. 2022. Available online: https://github.com/xtianu/medicalsegapp (accessed on 5 June 2022).
  27. Gonzalez, R.; Woods, R. Digital Image Processing, 3rd ed.; Prentice-Hall, Inc.: Hoboken, NJ, USA, 2007; p. 976. [Google Scholar]
  28. Otsu, N. A Threshold Selection Method from Gray-Level Histograms. IEEE Trans. Syst. Man Cybern. 1979, 9, 62–66. [Google Scholar] [CrossRef] [Green Version]
  29. Bajaj, P.; Otsu Thresholding. MATLAB Central File Exchange. Available online: https://www.mathworks.com/matlabcentral/fileexchange/74380-otsu-thresholding) (accessed on 7 June 2022).
  30. Kothwala, A.; Image Segmentation Using Otsu Method. MATLAB Central File Exchange. Available online: https://es.mathworks.com/matlabcentral/fileexchange/51297-image-segmentation-using-otsu-method (accessed on 7 June 2022).
  31. Canny, J. A Computational Approach to Edge Detection. IEEE Trans. Pattern Anal. Mach. Intell. 1986, PAMI-8, 679–698. [Google Scholar] [CrossRef]
  32. Farras, A.; Auto-Thresholding Canny Edge Detection. Auto-Thresholding Canny Edge Detection. Available online: https://www.mathworks.com/matlabcentral/fileexchange/61237-auto-thresholding-canny-edge-detection) (accessed on 8 September 2021).
  33. Trung-Thien, T.; Chan-Su, B.; Young-Nam, K.; Hyo-Moon, C.; Sang-Bock, C. An Adaptive Method for Lane Marking Detection Based on HSI Color Model. Commun. Comput. Inf. Sci. 2010, 93, 304–311. [Google Scholar] [CrossRef]
  34. Kass, M.; Witkin, A.; Terzopoulos, D. Snakes: Active contour models. Int. J. Comput. Vis. 1988, 1, 321–331. [Google Scholar] [CrossRef]
  35. Meyer, F. Topographic distance and watershed lines. Signal Process. 1994, 38, 113–125. [Google Scholar] [CrossRef]
  36. Preim, B.; Botha, C. Chapter 4—Image Analysis for Medical Visualization. In Visual Computing for Medicine, 2nd ed; Theory, Algorithms, and Applications; O’Reilly Media, Inc.: Sebastopol, CA, USA, 2014; p. 976. [Google Scholar] [CrossRef]
  37. Mohamed, O.; Jaïdane-Saïdane, M. Generalized Gaussian mixture model. In Proceedings of the 17th European Signal Processing Conference (EUSIPCO), Glasgow, UK, 24–28 August 2009; pp. 2273–2277. [Google Scholar] [CrossRef]
  38. Moitra, A. Algorithmic Aspects of Machine Learning; Cambridge University Press: Cambridge, UK, 2018; pp. 107–131. [Google Scholar] [CrossRef]
  39. Saleh, S. Robust Variable Selection Based on Schwarz Information Criterion for Linear Regression Models. Math. Stat. Eng. Appl. 2022, 71, 54–68. [Google Scholar] [CrossRef]
  40. McLachlan, G.; Peel, D. Finite Mixture Models; John Wiley & Sons: Hoboken, NJ, USA, 2000; Volume 6, pp. 355–378. [Google Scholar] [CrossRef]
  41. Handari, A.K.; Maurya, S.K. Gamma corrected reflectance for low contrast image enhancement using guided filter. Multimed. Tools Appl. 2022, 81, 6009–6030. [Google Scholar] [CrossRef]
  42. Bhairannawar, S. Chapter 4—Efficient Medical Image Enhancement Technique Using Transform HSV Space and Adaptive Histogram Equalization. In Visual Computing for Medicine, 2nd ed.; Theory, Algorithms, and Applications; ScienceDirect Academic Press: Cambridge, MA, USA, 2014; pp. 51–60. [Google Scholar] [CrossRef]
  43. Moore, C.; Bell, D. Variational Analysis. Radiopaedia Artif. Intell. 2020, 2020, 75056. [Google Scholar] [CrossRef]
  44. Schneider, C.; Rasband, W.E.K. IH Image to ImageJ: 25 years of image analysis. Nat. Methods 2012, 9, 671–675. [Google Scholar] [CrossRef]
Figure 1. Example of the medical database used to test MedicalSeg application: (a) mammography, (b) brain, (c) prostate, (d) retinal, (e) ecography.
Algorithms 15 00200 g001
Figure 2. Design of the MedicalSeg GUI interface.
Algorithms 15 00200 g002
Figure 3. Example of the organization used to classify the results distributed in folders.
Algorithms 15 00200 g003
Figure 4. Example of the calculated T m a x as a threshold value obtained from the maximum value in a histogram display.
Algorithms 15 00200 g004
Figure 5. Example of an digital mammography image with noise and tagged labels inside. A pre-processing step is required.
Algorithms 15 00200 g005
Figure 6. Example of a ultrasound image using a Watershed algorithm.
Algorithms 15 00200 g006
Figure 7. Example of a mammography MRI image using a GMM and Snake algorithm.
Algorithms 15 00200 g007
Figure 8. Example of a prostate MRI image using a Canny automatic threshold and Otsu algorithm.
Algorithms 15 00200 g008
Figure 9. Example of a vascular cerebral TRANCE image using different segmentation techniques (Intensity, Watershed, and GMM).
Algorithms 15 00200 g009
Figure 10. Example of a DSC comparison of the segmented images against a reference ground truth. The different colours represent true positive pixels (TP, in white), true negative pixels (TN, in black), false positives (FP, in green) and false negatives (FN, in magenta).
Algorithms 15 00200 g010
Table 1. Analyses the DSC for the ground truth (GT), MedicalSeg and ImageJ application for several segmentation techniques.
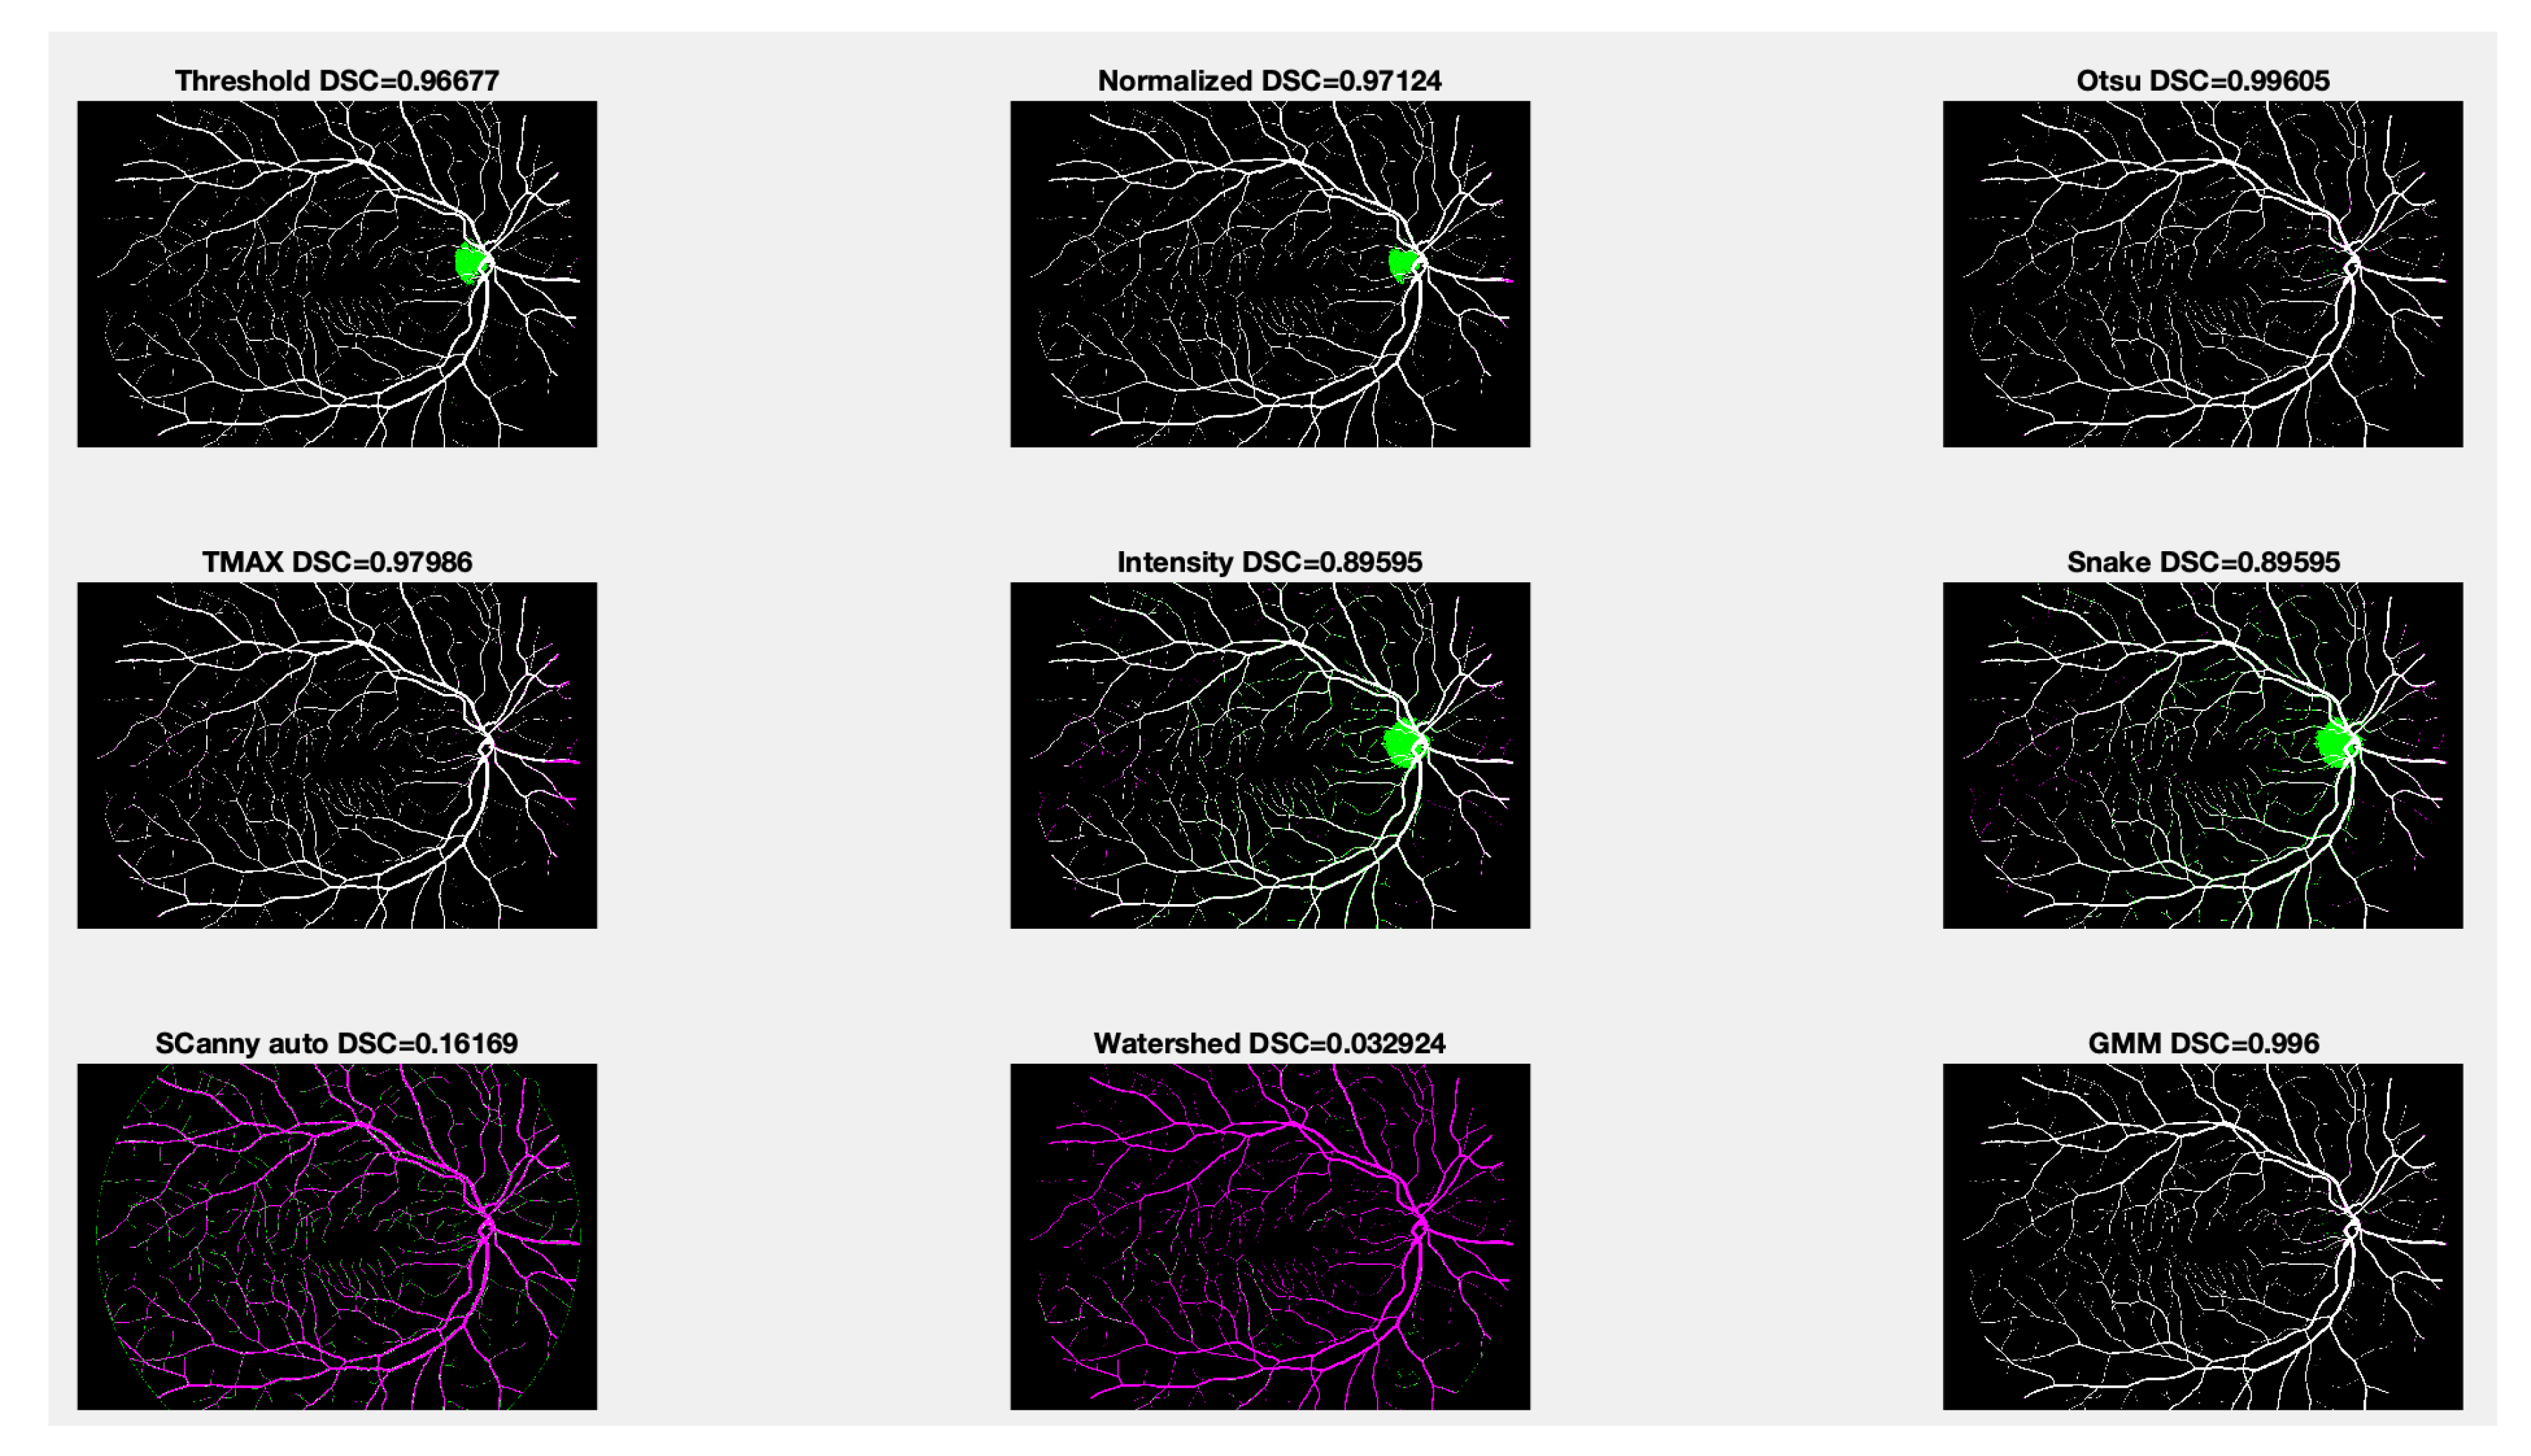
Dice Similarity Index (DSC)
GT vs. MedicalSegGT vs. ImageJMedicalSeg vs. ImageJ
Threshold0.966770.975500.99127
Normalized0.971240.969980.99874
Otsu0.996050.982560.98651
Snake0.895950.914220.98713
Canny auto0.161690.178810.98309
Watershed0.0329240.027490.99455
GMM0.996000.927720.93172
Table 2. Time-computing (in seconds) of the obtained results for each segmentation algorithm.
ImagesThresThMAXOtsuCannyAutoIntensitySnakeWatershedGMMAll
10.731.150.761.891.271.032.353.613.61
101.042.093.8412.792.461.814.3918.1918.19
202.783.9210.9323.694.502.147.3934.5034.50
504.965.4313.2160.046.285.1210.3185.4585.45
10010.1810.0433.81117.2511.8110.1222.48177.28177.28
20017.1420.6265.25220.2925.4522.2146.43336.57336.57
50058.3264.54189.60533.1882.1056.71114.651033.091033.09
1000127.01119.20396.98922.89156.39127.99216.731670.101670.10
Publisher’s Note: MDPI stays neutral with regard to jurisdictional claims in published maps and institutional affiliations.

