1. Introduction
At the moment, the development of the economy goes hand in hand with the development of informational technologies. Today, we are witnessing the fifth informational revolution associated with the development of global information and telecommunication networks, covering all countries and continents and simultaneously affecting each person individually. This stimulates the development of the informational structure of society, and, as a result, it is the information revolution that currently determines the most important competitive advantages of companies. Information comes from various sources: the company itself, its counterparties, suppliers, consumers, and many others. Increasing flows of information from different directions aggravates a long-existing problem; you need to understand what kind of information is needed to make specific decisions.
The problem of finding and selecting relevant information existed as early as the beginning of the 19th century, when the process of making paper from cellulose was mastered. Paper prices fell, and the financial sector began to use this material everywhere. For financial businesses, a lot needed to be written down, and it was desirable to have records in several copies. If, earlier, people wrote down only the most important things, then, with the advent of cellulose paper, they began to write down absolutely everything. Over time, carbon paper, typewriters, and even standardized forms emerged. A new problem arose—an overabundance of information. Entrepreneurs simply put all the papers in bundles, tied them with ribbons, and stuffed them into a cabinet in huge piles. As a result, it was impossible to understand where to find the necessary information or determine whether it existed at all. Due to such measures, some companies were mired in debt and went bankrupt. Only after almost a century, in 1890, was a special box for storing papers invented, which greatly simplified the process of working with documents; you could simply pull out the desired drawer and find the necessary folder [
1].
However, over time, much changed; paper media faded into the background, personal computers and the Internet appeared, and the information environment has been integrated into our lives. A whole digital world with information about objects in the real world has emerged. Many companies driven by economic interest are trying to integrate into the digital world as soon as possible. Only one thing has remained the same: an excess of information, including information about the companies themselves [
2,
3]. Based on this, as a topic considered in our work, we studied the information published on the Internet about enterprises, taking into account industry specifics. The courier delivery and transportation industry was chosen as an example.
Thus, 130 years after the invention of paper boxes, we faced a similar task—to make similar “boxes” but in the digital space. We developed a number of universal methods for analyzing the performance of an enterprise, taking into account its industry specifics to consider their degree of influence on the functioning of the enterprise and its position in the competitive environment in the industry. We systematized the received information into “digital boxes” and tried to visualize it for a more visual representation. This opened up the opportunity for company management and other stakeholders to make more reliable decisions, as they can be provided with well-organized data. In this work, we created a system on the basis of which enterprises can be analyzed, and, subsequently, each enterprise can be given a set of recommendations that will allow the organization to solve problems in managing its own information background and remain competitive in the informational economy.
The accelerated development of industry 4.0, the high pace of high technology development, and the testing of socio-economic modernity set the trend for enterprises to introduce advanced IT technologies and modernize their own business processes. In the digital economy, the optimization of technological and logistics operations enhances the pace of development, so delivery services with a loyal user interface and a guarantee of speed and integrity of the goods arriving at destinations are in particular demand [
4,
5].
Due to the events of 2020 related to the spread of coronavirus infection and the restrictive measures for interaction between people, online platforms and delivery services began to gain more and more popularity. Electronic marketplaces and services noted a rapid increase in demand due to the global move online, even though delivery services were popular even before the introduction of quarantine measures. The pandemic necessitated the introduction of contactless delivery as a preventive measure to protect against the coronavirus. The advantage of online trading and delivery is the absence of direct contact between people, as well as the possibility of avoiding the transfer of banknotes and even card payments.
Thus, one of the main victims of restrictions of the 2020 pandemic was the traditional food industry. Thereby, network establishments and fast food chains turned out to be the most stable in the new circumstances due to the rapid introduction of delivery services—as a result, their share in the food delivery market increased significantly over the year (
Figure 1).
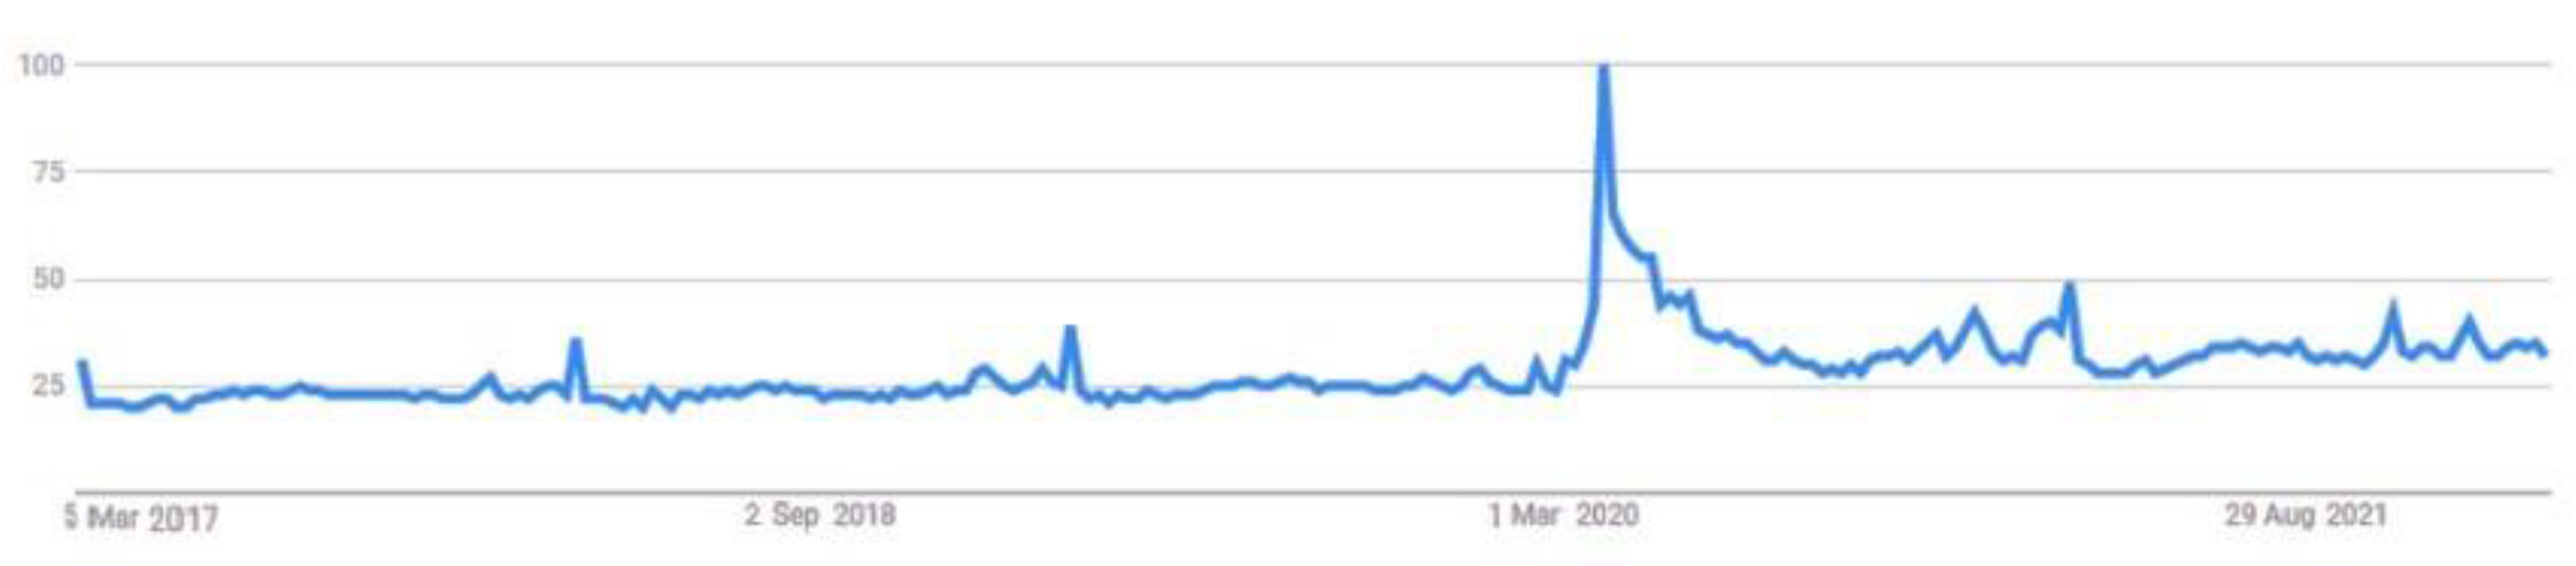
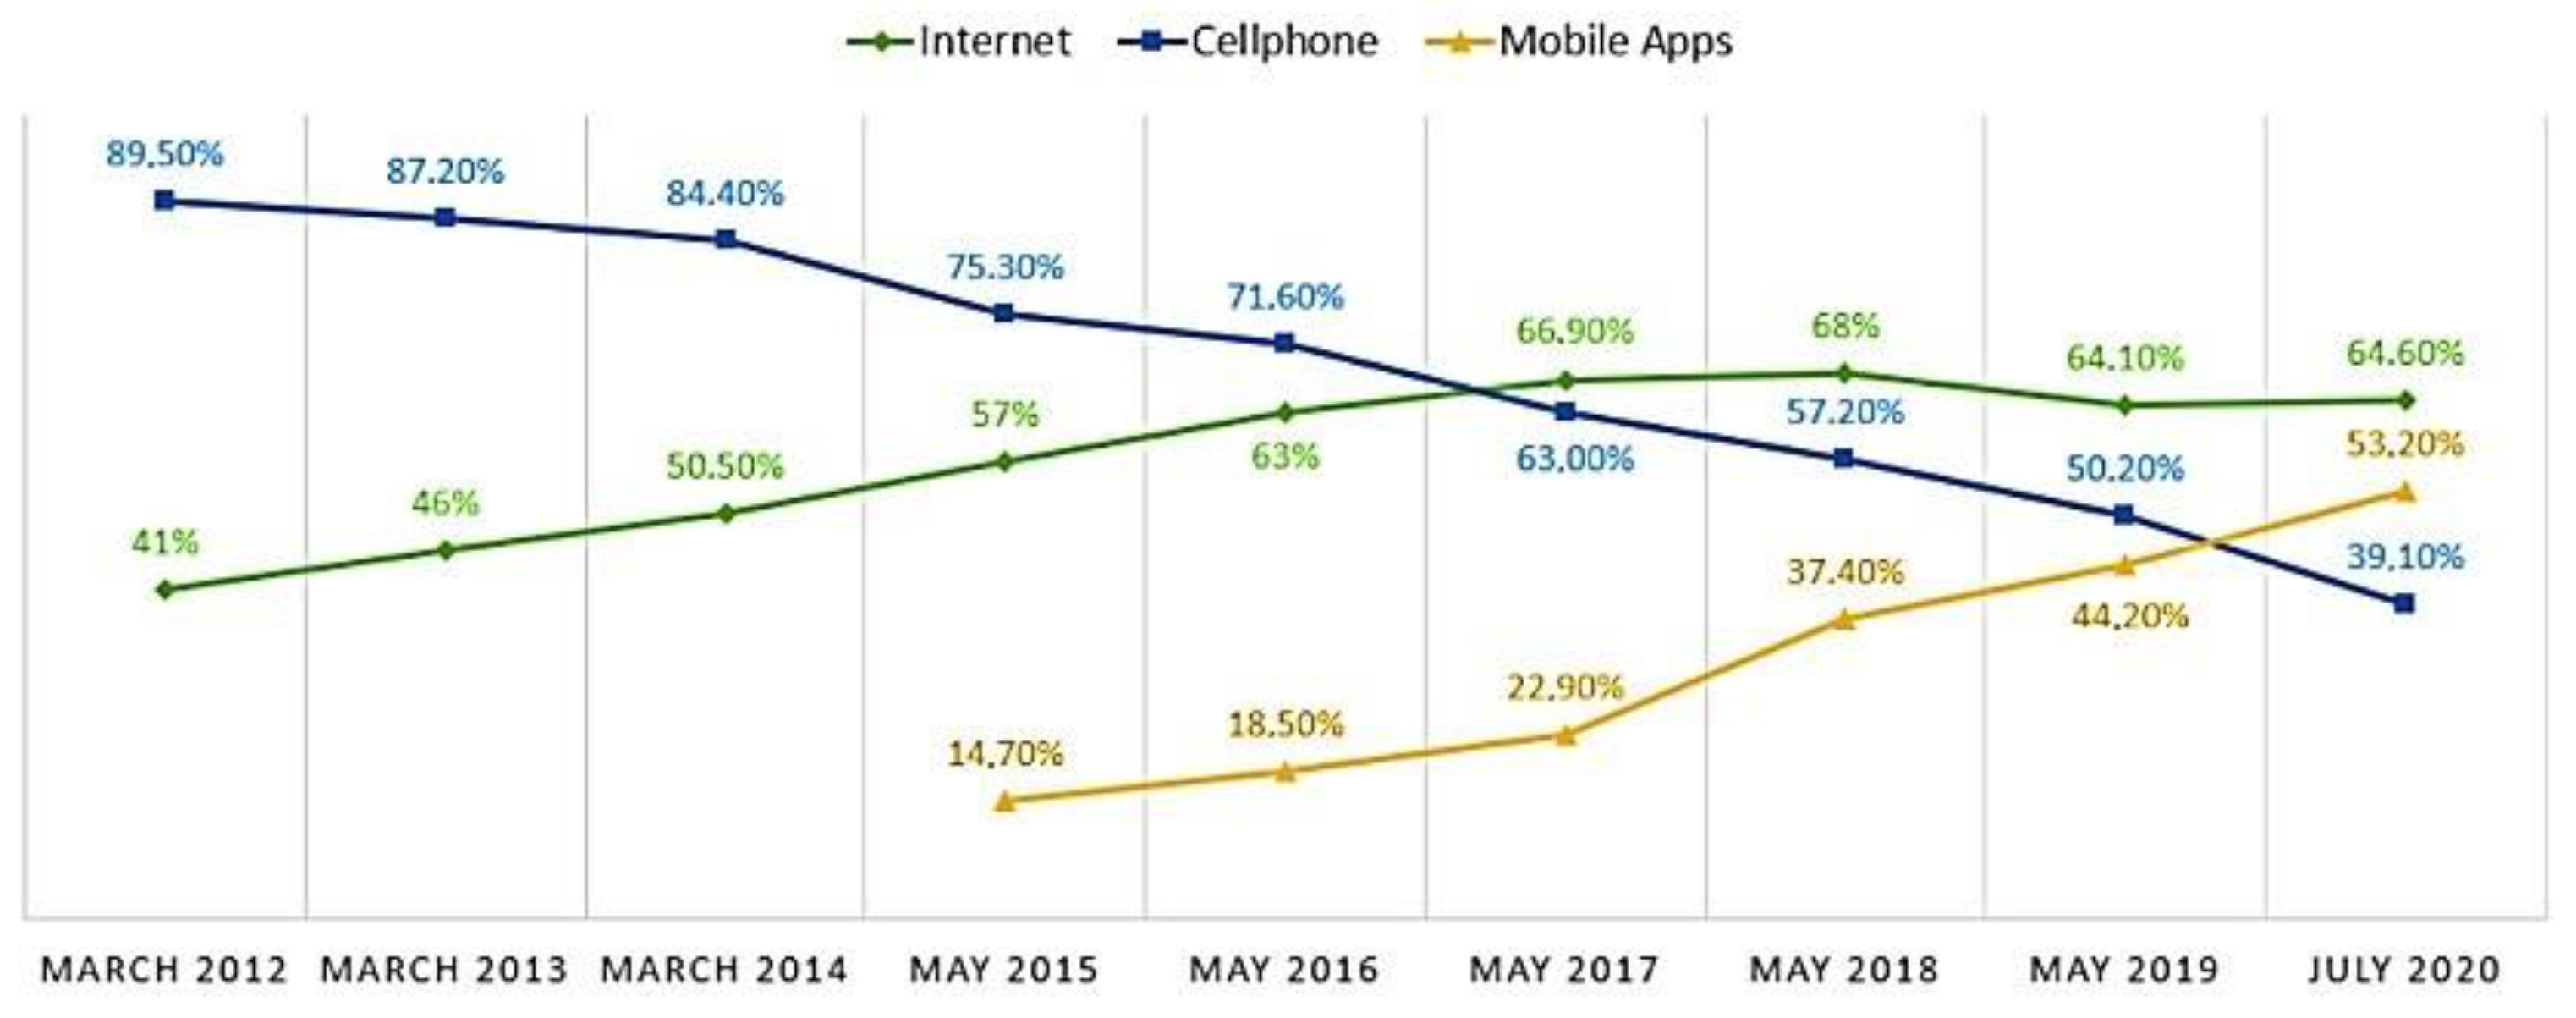
Even after the removal of several restrictive measures, the trend of placing online orders continued, and, now, the delivery services market is increasing its momentum—this is reflected in the dynamics of Google search engine users’ requests, shown in
Figure 2, and the popularity of Internet delivery, shown in
Figure 3.
The total demand for delivery services from February to March 2020 increased by 119%. In March, almost 700 thousand people searched for delivery services on Google compared to only slightly more than 300 thousand a month earlier.
In order to stay afloat and continue developing, most enterprises whose business model allows them to use and grow delivery accepted the need for change in their operations [
6]. For this reason, it was very important for them to transform some of their internal processes and build relevant digital profiles on the Internet for correct perception by consumers. Despite the relative willingness to adapt delivery services during the coronavirus pandemic, such companies needed to further develop new business models. Consumers were becoming more demanding; they expected more innovation and convenience from modern delivery services.
Moreover, the transfer of some business processes to an online format further increased the role of information in companies’ activities [
7]. A digital image of an enterprise is created on the Internet from information units such as posts, reviews, comments, etc. All future consumers, counterparties, and partners have access to this information, based on which, a new image and perception of the company is created. Consequently, a new pattern of interaction with companies is formed—some stakeholders enter the network and share information about the organization themselves, while other stakeholders analyze this information to form their own opinion about it.
Thus, the transformation of the delivery services studied in this paper made it possible to understand exactly how consumers’ perception of information about an enterprise is formed in the digital economy. The paper also studied the formation of a digital profile of an enterprise through the information environment and its components. In this work, we developed a methodology for the analysis of a digital profile, which can later be used by company management to improve consumer perception of its information on the Internet.
The purpose of this work was to form a methodology for comparative evaluation of key industry competitiveness aspects of logistics services and logistics systems of enterprises in the informational environment. The objectives are:
Identification of key informational components of the digital perception profile of delivery services;
Development of an algorithm for collecting tokens of digital components;
Collection of a sample of logistics services and services of logistics systems of enterprises;
Development of an algorithm for collecting digital environment tokens of logistics services and services of logistics systems of enterprises from the sample;
Development of an algorithm for determining the key information components of the logistics service or the logistics systems service of the enterprise, comparing it with the average indicators for the sample;
Development of an algorithm for visualizing the results of the analysis of the information profile of the logistics service or the logistics systems service of the enterprise.
2. Materials and Methods
In today’s economy, digital technologies have experienced a rapid rise, having major impact on short- and long-term development. The pandemic accelerated brand-new transformation of small and medium-sized enterprises, though it made their future management strategies tentative. However, active digitalization was gradually gaining momentum even before the coronavirus pandemic, as evidenced by the fairly early emergence of innovative business models, the move into marketplaces, and large-scale production automation.
The pandemic forced governments to impose certain regulations, including social distancing and wearing masks, as preventive measures against the spreading of the virus. As a result, those strict, law-making instruments exerted a lot of pressure on businesses to completely stop or transform working processes. However, the all-embracing development of remote communications, web apps, and digital technologies enabled small enterprises to collaborate with bigger and influential partners [
8].
One study proved a hypothesis about the impact of digital technologies on business development. The research concluded that digitalization empowers the creation of sustainable competitive advantages by accumulating and collecting big data or network effect (a phenomenon whereby a product or service gains additional value as more people use it). In other words, the more data and network effect are taken into consideration in business model, the higher the possibility of a company being competitive [
9]. An important conclusion of the study that connects digitalization and the industry under study should also be noted here: digitalization is the best-case scenario for maximizing the efficiency of transport and logistics, thereby, enabling the Russian economy to better cope with the challenges of competitiveness and efficiency [
10].
In the digitalization process, it is important to consider that poor quality of technologies used and developed can cause failures in the system which affect consumer confidence in the technology. Consumers are becoming more demanding when it comes to the quality of services, their speed and security, and the security of their data. Logistics companies must follow new consumer trends—adapting general commerce to “connected commerce”—in other words, commerce that is permanently accessible on online platforms (PwC Report, 2016). At the same time, they face the problem of managing the database, because its potential is growing rapidly, but companies have no time to master new digitalization technologies. So, according to a statistical study of PwC Industry 4.0 in 2016, only 28% of transportation companies rated themselves as “advanced” in digitalization, while consumers rated themselves as “advanced” at a rate of 41–45% [
11]. Thus, there was a lag between the digitization of delivery services and their consumers’ needs in the aspect of the use of information technology.
In addition to being influenced by the quality of technology, consumer trust is also influenced by a company’s image in the digital environment. Through digital channels, logistics, and transportation, companies remain relevant to consumers. To track the quality of a product or service, the consumer preliminarily analyzes reviews, which, in turn, form the image of the company and have a significant impact on promotion and, therefore, market capitalization. According to study [
12], 97% of consumers look for reviews before buying a product or service, 74% of consumers trust the manufacturer in the case of positive reviews of products, and 60% of respondents refuse to buy in the case of negative reviews. That being said, different platforms influence consumer opinion in various ways. The same study cited the Edelman Trust Barometer report on the search results that inspire the most trust among consumers. For example, 78% of customers depend on social media posts for their purchase decision, and 71% of consumers recommend a brand to friends through social media.
Nevertheless, it is worth emphasizing that consumers rarely purposely seek information about a product on social networks, but often purchase a product after accidentally seeing an advertising post on them (54% and 76%, respectively). A study by McKinsey & Company (2020) showed that, at this point, marketing campaigns are increasingly aimed not at famous brand ambassadors, but at a group of ordinary people with whom the consumer interacts every day. In other words, digitalization of “word-of-mouth radio”, which builds a positive image of the company and reaches a wider audience, which, in turn, increases the level of recognition [
13].
Furthermore, an important factor in the formation of a positive digital image of a company is the quality of its website [
14]. Thus, the authors of the article noted that consumer loyalty towards the firm depends on the usability of the site, its attractiveness and visual components, the availability of customer service, and the completeness of the information provided about the company on its website.
Another scientific article suggested that image is one of the main criteria for the market position of a company. This paper provided an analysis of the five historical stages in the development of the concept of “image”, where the modern stage, which started in 2010, is the emergence of the digital image of the company. The authors of the article concluded that the rapid development of the Internet entails the need to manage the digital image of the company, as it has become an effective method of influencing the target audience [
15].
In further research, the authors speculated on how the image of companies changes in information society. The authors indicated image in traditional and modern approaches. Highlighting the elements that form a company’s image on the Internet, they defined the term “image management in a digital environment” as “a set of techniques for forming an individual perception of a company based on an awareness of the unique features and characteristics of the business using current Internet technologies” [
16].
The authors of another paper argued about the importance of companies considering the halo effect (distortion of perception of private features through an overall impression of an object) arising through social media as part of their multi-channel strategy in order to respond to changes in time and monitor the focus of replicated information on social media. If the change and thrust of the information corresponds to the objectives, it is necessary to reinforce or support them with official statements, if not, they must try softening or completely excluding such discussions by refuting any information. In other words, the general impression of an object often determines the attitude towards its private features, which can both positively and negatively influence the image entirely [
17].
It is also worth mentioning the studies that proved the appropriateness of the choice of logistics services and services of the logistics systems of enterprises as the industry under study.
One scientific article put forward the thesis that the subtle and complex process of choosing logistics services, from the point of view of consumers, is significantly determined by their image. In addition, the researchers offered a classification of the main characteristics that determine the competitive power of logistics companies. The main components include such criteria as fast and accurate delivery, delivery reliability, service flexibility in operations and delivery, understanding the needs of shippers, shipment tracking tools and information services, and a range of additional services [
18].
The classification put forward in the previous article was echoed in another paper, where the authors advocated that, in an era of increasing demand for customized products, it is important and beneficial for companies to comprehensively implement the “digital twin”. The authors summarized that innovative solutions and technologies are potentially meaningful and useful for various delivery services [
19].
The rapid growth of the industry under study should also be noted. For example, the following source drew attention to how the growth of online ordering stimulated the development of home delivery services in recent decades [
20]. Home delivery offers customers several potential benefits: increased time savings and a variety of delivery methods. In addition, online ordering is particularly in demand when mobility is restricted, as was confirmed by home isolation during the COVID-19 pandemic. On the other hand, home delivery is associated with negative economic, environmental, and social consequences, which gives a reason to refer to the article [
21]. The authors of these two sources agreed on the desire of logistics companies to increase the benefits of delivery to consumers while reducing the negative consequences—which corresponds to the trend of sustainable development. In addition, in this source, the authors presented and described a detailed classification of delivery models which highlighted the following criteria: type of goods, return flow, speed and time of delivery, destination (degree of remoteness) of delivery, payment system, and degree of reliability of the security system.
The authors analyzed three delivery models: requiring orders, partially excluding orders, or completely excluding orders. In the first case, the development of information technology makes it possible to provide customers with “just-in-time” delivery, which, however, increases the complexity of organizing deliveries and increases the supplier’s costs. In the case of partial models, companies may offer customers the opportunity to permanently reserve a certain time and day of the week for delivery. Finally, the latter, no-order delivery models, which combine the advantages of both previous concepts; the first allows deliveries in line with the current needs of customers, and the second reduces the need for orders and ensures regular and reliable deliveries.
In another study, the international company McKinsey & Company (2016) illustrated the semantic analysis of delivery startups. The authors highlighted the relative novelty of transport companies involved in the integration of local trade and ready-to-eat delivery [
22]. The article also introduced and provided useful statistics on the launch of many food delivery startups thanks to venture capital investments. Thus, the authors argued that, since 2016, food delivery has attracted a lot of capital, which contributed to its development in a confident direction and allowed it to successfully adapt to the crisis in 2020.
The development of Internet commerce in Russia has given an impetus to improve the organization of delivery of goods. Using the example of the major operators DPD, IML, CDEK, and Boxberry, the author of one article analyzed the services for the delivery of goods and concluded that the use of the rating method when choosing transport companies is inefficient. This is due to the fact that the abovementioned method does not fully take into account the features of online commerce—it takes into account the characteristics of only one department of the company (for instance, if it is necessary to make a return of goods, only the claims department is evaluated) and not the entire enterprise as a whole [
23]. At the same time, another article demonstrated the importance of understanding the comparative advantages of different delivery methods; for example, when delivery service delivers by using their own couriers, it is much easier to track the status of the order and resolve problems quickly than if the delivery was carried out by a third party [
24]. However, if aggregators act as a third party, then, due to their high degree of digitalization, there may be a reduction in costs at the stages of marketing, transportation, and sale of food products. The author of another work described the third stage of the spread of the food delivery business in Russia through the organization of startups as a subject of innovative entrepreneurship which is characterized by the creation of competitor companies that spread due to the influence of the information environment [
25].
An important aspect is the fact that intensive economic development in the era of digitalization increases the demand for the services of logistics companies and, as a result, contributes to the development and emergence of new services for large and small deliveries [
21]. The infrastructure of logistics companies, like an engine, accelerates the growth dynamics of economic development. Supply disruptions may be, in a broad sense, one of the main causes of the global crisis and, in a narrower sense, leave the consumer dissatisfied and damage a company’s image. Logistics companies make a major contribution to “job creation, and the higher the productivity of these companies in the aggregate, the higher the financial performance and the faster the economy as a whole” [
26].
At the same time, social aspects are always in close, but often contradictory, relationship with economic development. Logistics companies in the modern economy, along with the goal of making a profit, must take care of social problems and the quality of service delivery. The consumer, in turn, pays attention not only to financial indicators but also to the extent of the company’s participation in social projects. Delivery companies also actively analyze customer reviews, as negative reviews may quickly spread in the digital environment and cause serious financial damage. In turn, tracking consumer feedback helps companies identify social trends. It is also important to note that the development of logistics companies contributes to the partial employment solution. It was previously predicted that, in 2022, the number of people employed in the logistics sector would increase to 30 million [
27]. The formation of new jobs and care of employees may, in turn, have a positive impact on the image of the company.
Research in this field suggested that the delivery of goods represents a significant contribution to solving the problems of congestion, lack of parking, pollution, and energy consumption in medium and large cities. The contribution of the delivery of goods to reducing the ecological footprint of cities was proposed by some researchers as a key indicator of the effectiveness of delivery services [
28]. In large cities and regions with high population density and poorly developed transport systems, the best option is to deliver a large number of goods to points of distribution. Many delivery services encourage consumers to use this option, which is justified by the economic benefits for the service and the reduced environmental impact on the infrastructure of the region [
29].
Some sources, considering the assessment of the impact of human values on the environmental behavior of consumers, pointed to the motivation of companies to encourage such behavior [
30]. In turn, the sustainability of organizations and their understanding of consumer emotions justify the increasing value of delivery services [
31].
It is worth mentioning that green products, green design, green supply chains, and green manufacturing processes improve the practice of green entrepreneurship and, accordingly, contribute to a green environment; together, these efforts allow business owners to practice sustainable development. This also applies to delivery services, because they are directly related to transport systems, packaging, and interaction with the end consumer [
32].
Summarizing the conclusions from the literature sources above, we note that the described three components: economic development, social development, and focus on environmental friendliness are reflected in the concept of sustainable development. At the same time, these characteristics are present in the activities of logistics companies, and they, indeed, excite customers. They determine the positivity of the digital image. For customers, in addition to quality, the global mission of the company and its social responsibility are important. The concept of sustainable development should be monitored in the vast information environment so that consumers have the opportunity to be convinced that social progress and care for the environment are important for the company.
A significant addition to these ideas was included in another article, where the fundamental idea which the authors put forward was a way to increase the competitiveness of carrier companies. This uses the growing interest of consumers in the trend of sustainable development. According to the article, delivery companies could, for example, offer recipients the ability to group deliveries together to minimize fuel consumption, which would also reduce delivery costs. In addition, as part of implementing their sustainability agenda, delivery service companies could offer the option of delivering by environmentally friendly vehicles, namely green delivery, despite the natural rise in the service costs [
21].
In today’s economy, businesses need to track mentions, opinions, and reviews in order to have a more responsive experience with the consumer, as well as to improve sustainability. Today, it is also important for enterprises to resonate in the context of following a social mission that ensures not only financial well-being but also the improvement of the lives of others and demonstrates concern for the future. A study by Unilever (2019), aimed at analyzing the images of its own brands, showed that companies whose missions include sustainable development missions grow more than 1.5 times faster than other companies. However, it is not enough to convince the consumer with words alone. The multi-stage execution of actions on the way to accomplishing the mission should be monitored in the vastness of the information environment so that each consumer has the opportunity to be convinced of the honesty and social responsibility of the company. Thus, the value of the brand is significantly increased not only by promoting the idea of the mission but also by its direct execution [
33].
Another important paradigm to take into account regards decision support systems (DSS). They have been proposed to develop business using social media data analytics. DSS provide a clear understanding of the key principles, issues, functionality, and big social data developments [
34]. The construction of decision-making models based on the use of data generated by current and potential consumers has been proposed by many authors as a tool to increase competitiveness and the sustainability factor. Mathematical models, which include the analysis of social networks and the information background of various companies, show good results when integrated into the decision-making apparatus of business entities. Accordingly, the study of social networks, as the main source of information about consumers, and the integration of this analysis into mathematical models helps to better meet the needs of customers, as well as create more added value [
35].
Based on the above presentation of the literature review as a theoretical component of the current research work, we tentatively concluded that the problems and all the consequences arising from them are not sporadic but, on the contrary, are natural, manageable, and predictable.
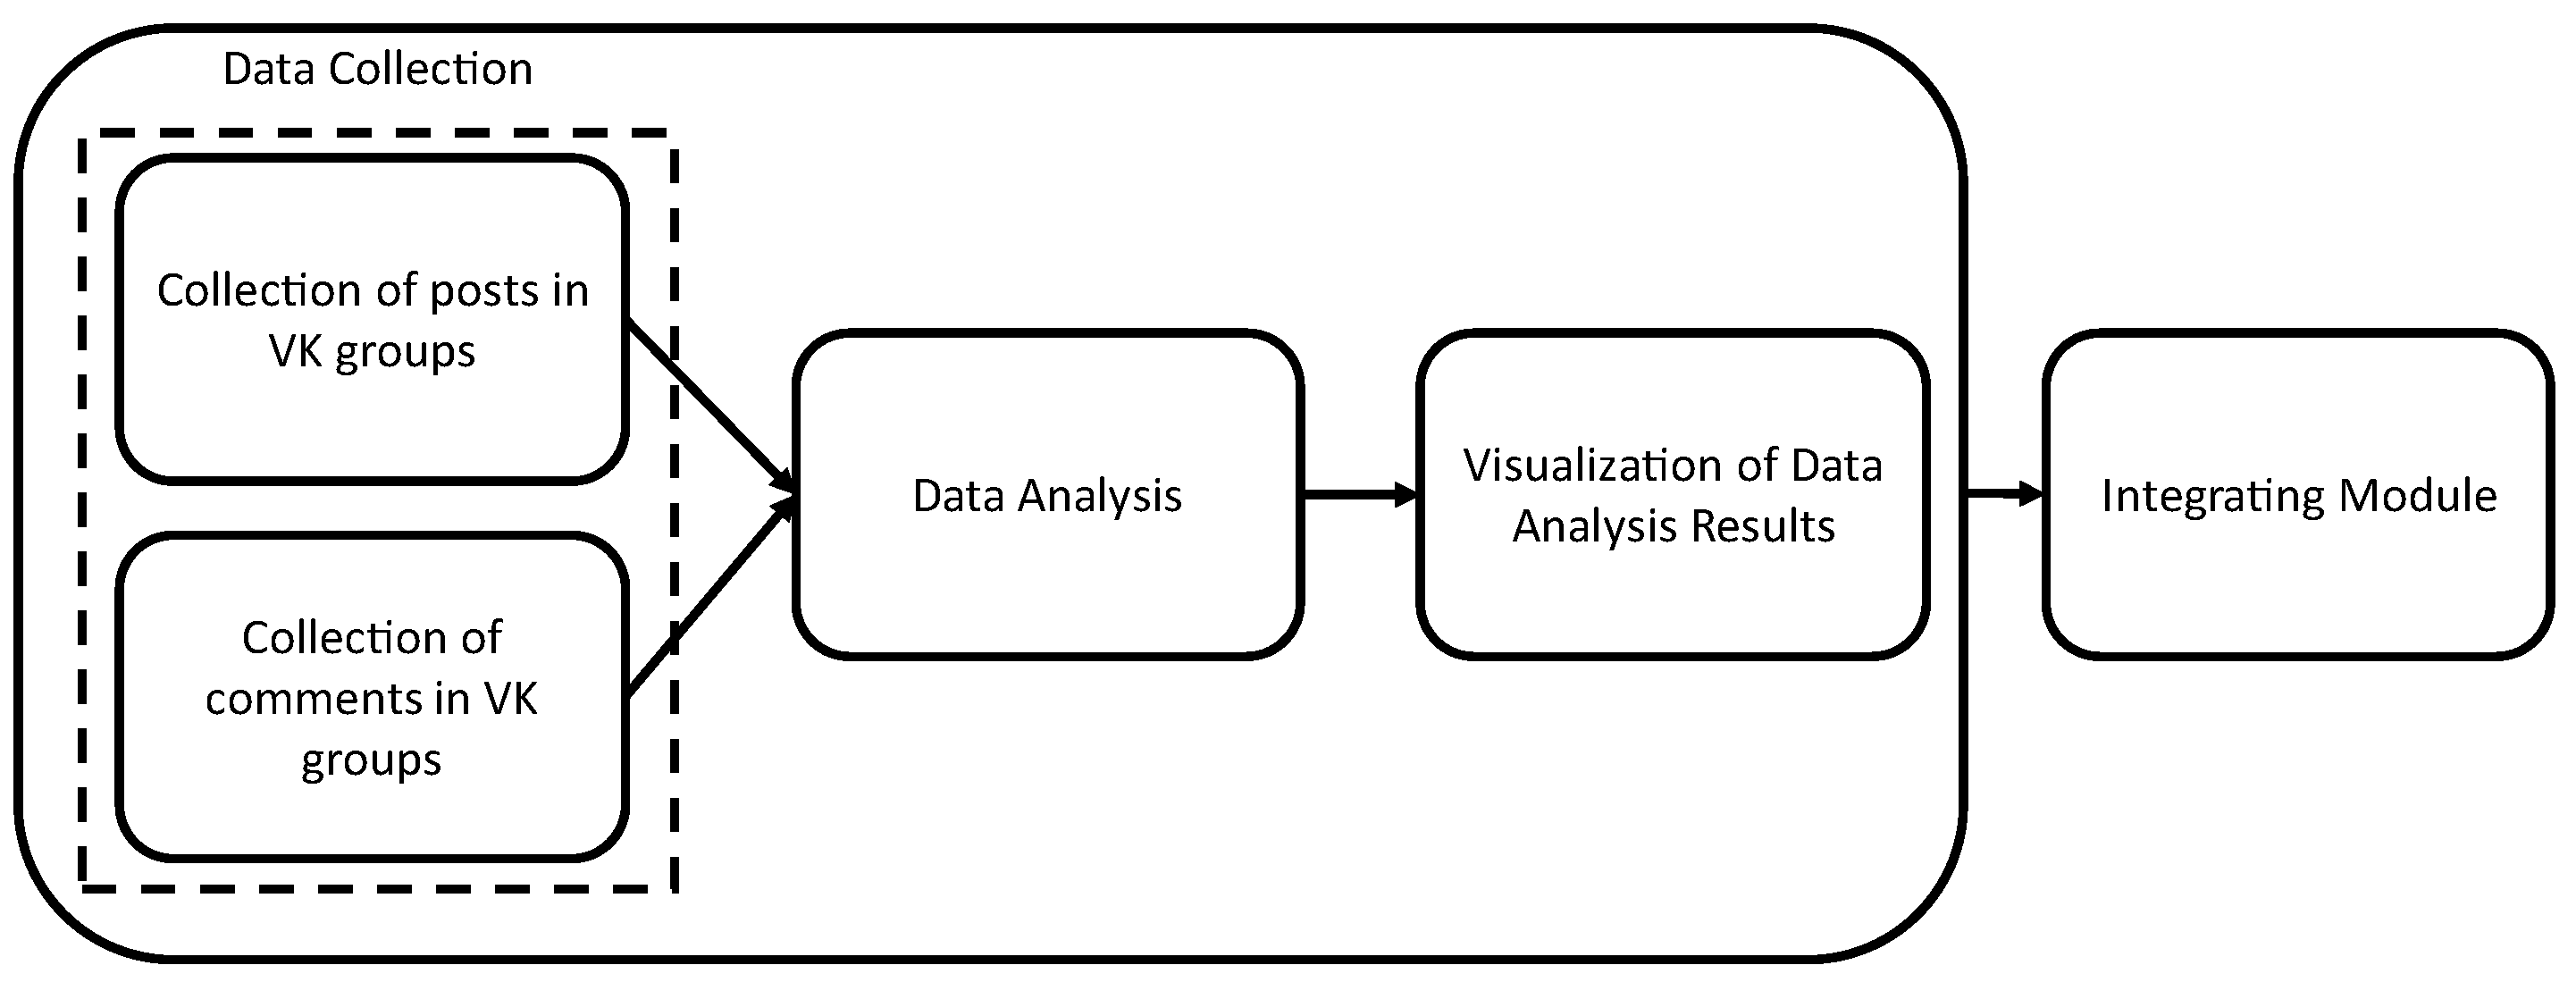
Our research methodology involved the development of an automatic tool that manages the collection of necessary data, analyzes them, and visualizes them for visual comparison. The architecture of this tool is introduced in
Figure 4.
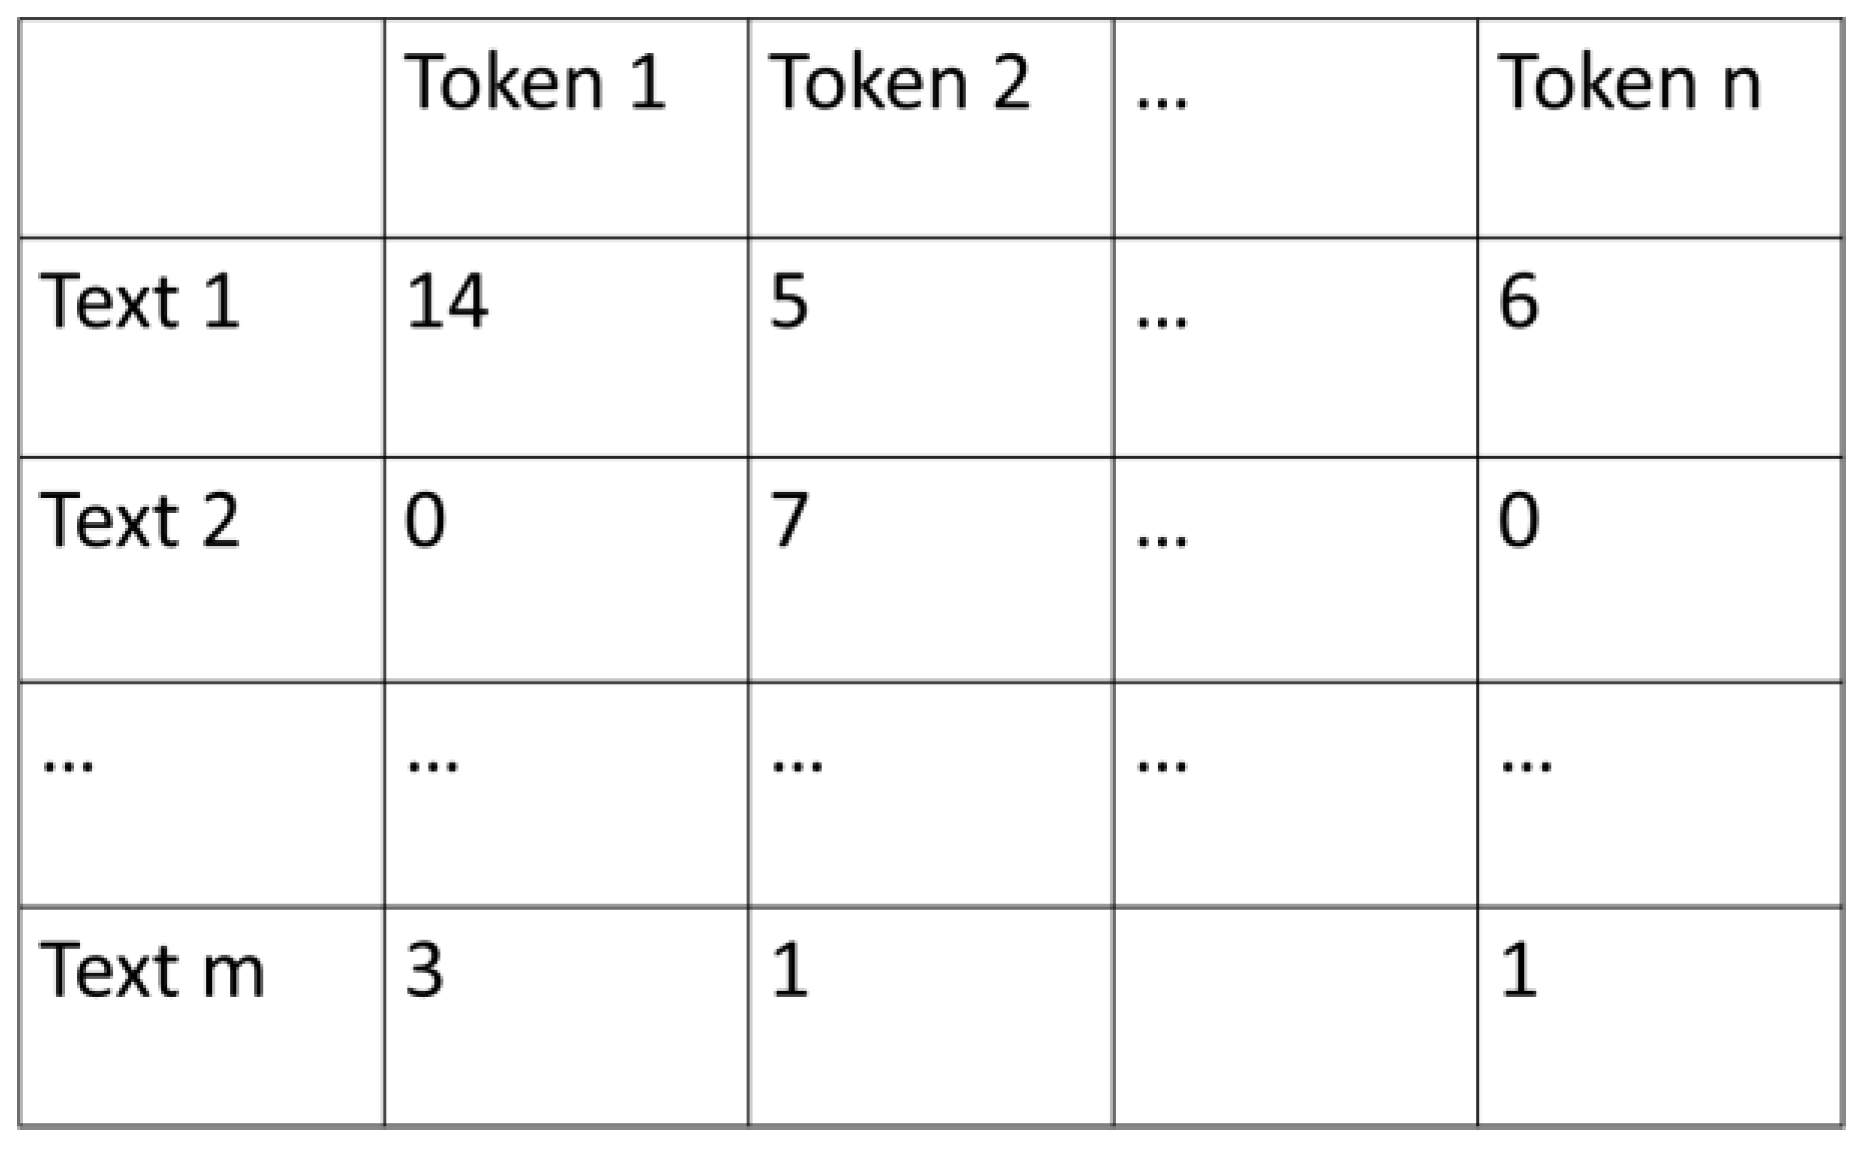
To analyze the presence of digital components, it is necessary to collect their most frequently encountered tokens. The environments of tokens of digital components must be determined—in this study, thematic groups on VK were used as these environments. Collected and tokenized texts from these groups can be seen in
Table 1 and
Table 2.
Texts and comments were also collected and tokenized in a group for the enterprise whose digital image was being analyzed; the same data on its competitors were collected as well. All data were collected for the last 365 days. The implementation of this algorithm in Python is shown in
Figure 5 and
Figure 6.
The following analysis was conducted with the use of Python 3. Python is frequently used for data analysis in science and business. This is facilitated by the simplicity of the language, as well as a large variety of open libraries.
In our work, we used different Python libraries: pandas for working with table data, numpy for working with vectors and linear algebra, scipy for specific aspects of linear algebra, nltk for working with text data, pymorphy2 for morphological analysis [
36], dostoyevski for evaluation of text sentiment in Russia, sklearn for specific tasks of machine learning, and matplotlib for visualization tasks.
Most of the indicators we offered for digital image analysis were based on the vector text analysis model. Vector text analysis is conducted by representing the totality of texts (documents) in the form of a frequency matrix. This matrix shows the number of occurrences of
i word (token) in
j text (document); it is also known as “a bag of words” [
37]. An example of such matrices can be seen in
Figure 5.
Rows of the matrix are represented in a form of vector rows, and the distance between them is calculated which helps to analyze text similarity. Hence, each vector can represent the semantic orientation of a text in a multidimensional space, and we can measure the distance between the two vectors. Cosine distance was taken as measure in this work.
Let vectors
x and
y be given. Scalar product and cosine of the angle
θ are linked through the relation:
Hence, cosine measure can be defined as:
and the cosine distance, in turn, is defined as:
Thus, the larger cosine distance between vectors of texts is, the less similar they are and vice versa. Cosine distance helps to determine several other metrics which are essential for analyzing digital image.
The first metric is the index of the presence of a key information component in a company’s digital image:
where
a is a row vector for tokens related to a company, and
α is a row vector for tokens related to an informational component.
For most key components, a high value may indicate a favorable image built by the company compared to other competitors. A group of indexes on the presence of key information components allows one to describe the digital image of a company and draw conclusions about measures to manage it correctly.
The next metric is the index of the presence of sustainable development components, calculated as:
where
SP is the index of the presence of the component of social progress,
ED the presence index of the economic development component, and
ER the index of the presence of an ecology component. An increase in this indicator demonstrates a favorable dynamic in the perception of the company’s image based on the parameters of social progress, economic development, and care for the environment.
The index of digital image uniqueness is calculated as:
where
a is a row vector for tokens related to company A,
b is a row vector for tokens related to its competitor, and
β is the total number of competitors analyzed, including company A itself.
Uniqueness of digital image allows companies to stand out from their competitors. At the same time, it can indicate both the advantages of the current image and its shortcomings (for example, if the company forms its digital image incorrectly and does not compare with competitors). To increase the value of this indicator, it is necessary to define your target and contact audience and form the unique message they need more clearly.
The next indicator—total length of a company’s digital image tokens—depends on the presence and activity of the organization in the information environment through integration with customers and publication of the company’s news agenda. It also depends on the activity of the company’s audience itself, that is, on the number of comments left by them, their general attitude towards the company, and their general desire to leave ratings and make ratings. The activity of the organization itself and the audience increases this length, its absence reduces it.
The frequency of the word “lateness”, its synonyms, and their word forms in comments is determined by the formula:
where
nl is the frequency of tokens related to the word “lateness”, its synonyms, and word forms in comments, and
N is a total amount of comments related to a company collected. Managing this parameter on the part of the organization itself includes changing the delivery conditions and adjusting the company’s strategy in order to eliminate delays. A high value of this indicator may indicate a deterioration in user experience.
Sentiment of informational environment is calculated as:
where
tpos is the level of the informational environment’s positivity (from 0 to 1),
tneg is the level of the informational environment’s negativity (from 0 to 1), and
tn is a level of the informational environment’s neutrality (from 0 to 1), all of which can be evaluated by the Dostoevsky library [
38].
The emotionality coefficient is calculated as:
Sentiment and emotionality coefficients were calculated for each comment, then the averages of coefficients for all comments were calculated. An increase in tonality may indicate high satisfaction of consumers and representatives of contact audiences with the services or the company’s image. An increase in emotionality may indicate that consumers or contact audiences feel strong (positive or negative) emotions during interaction with this company. All introduced metrics are summarized in
Table 3.
During the analysis, dimensionality reduction techniques were used to create a map of the digital image of enterprises. It was necessary to shrink the multidimensional space (the matrix of frequencies of tokens in texts) to two dimensions to see the structure and connections between objects. Dimensionality reduction, using stochastic neighbor embedding with Student’s
t-distribution (t-SNE method), reduced the dimension so as to preserve the proportions of distances between objects in the space of the new dimension: if
then
where
ρ is the distance between objects,
a,
b, and
c are coordinates of a former space and are an object’s coordinates in a resulting space [
39].
To give an illustrative example, 13 Russian companies were picked. Information about these companies is shown below in
Table 4. Information on the number of collected entries and comments on the VK social network through the groups of these companies is shown in
Table 5.
3. Results
The Delivery Club company was analyzed as an example to demonstrate how the developed methodology allows companies to manage their digital image.
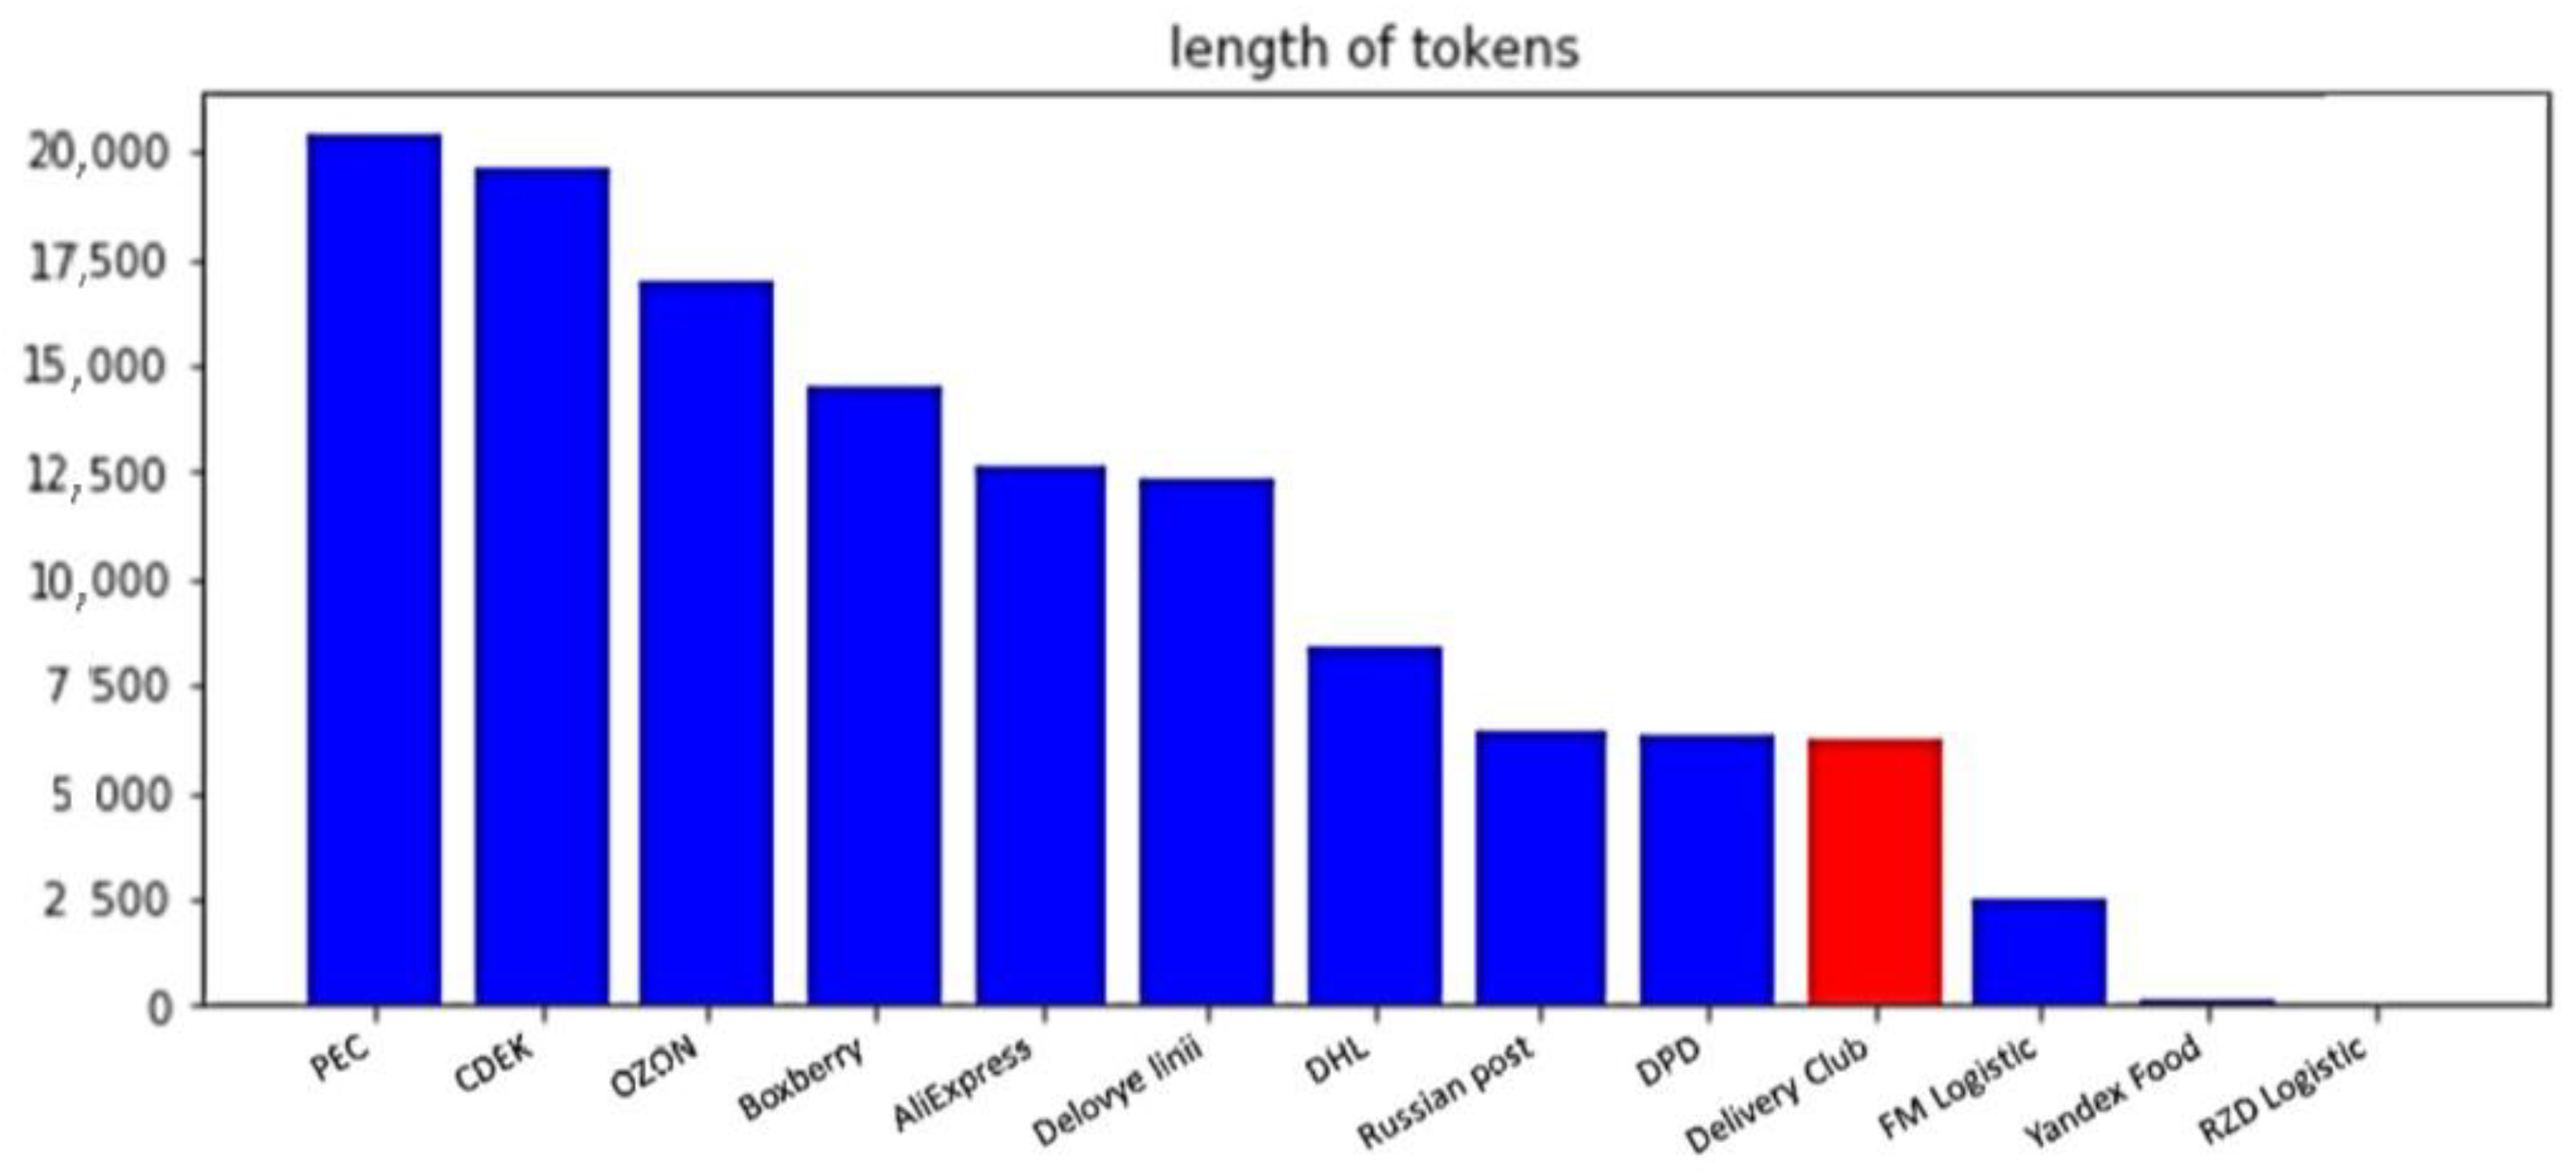
The length of the company’s tokens from the VK (illustrated in
Figure 6) was small. Delivery Club ranked 10th by this metric. This is explained by the fact that apparently the majority of consumer interaction with the company takes place through the company’s mobile app and, thus, is not reflected in our study. In addition, it should be noted that the length of the Delivery Club tokens was much longer than that of the company Yandex Food—the direct competitor of the company.
In the future, as the company has a mobile application that allows consumers to order food quickly and easily, Delivery Club should focus on maintaining it. Obviously, Delivery Club customers interact with the mobile application more often than they visit the VK newsgroup, and, therefore, posting information in the app is more effective. However, the company also needs to increase its activity on social networks. Through this communication channel, companies can inform consumers about their achievements and plans. Such information is not practically suitable for a company’s mobile app, yet it is necessary to share this information with consumers.
Another aim of the analysis was to determine the uniqueness of the image. According to this criterion, Delivery Club ranked 10th. It means that the uniqueness of the digital image was average among analyzed companies, which is a positive point. It might be highly beneficial for the company to maintain this balance in the future.
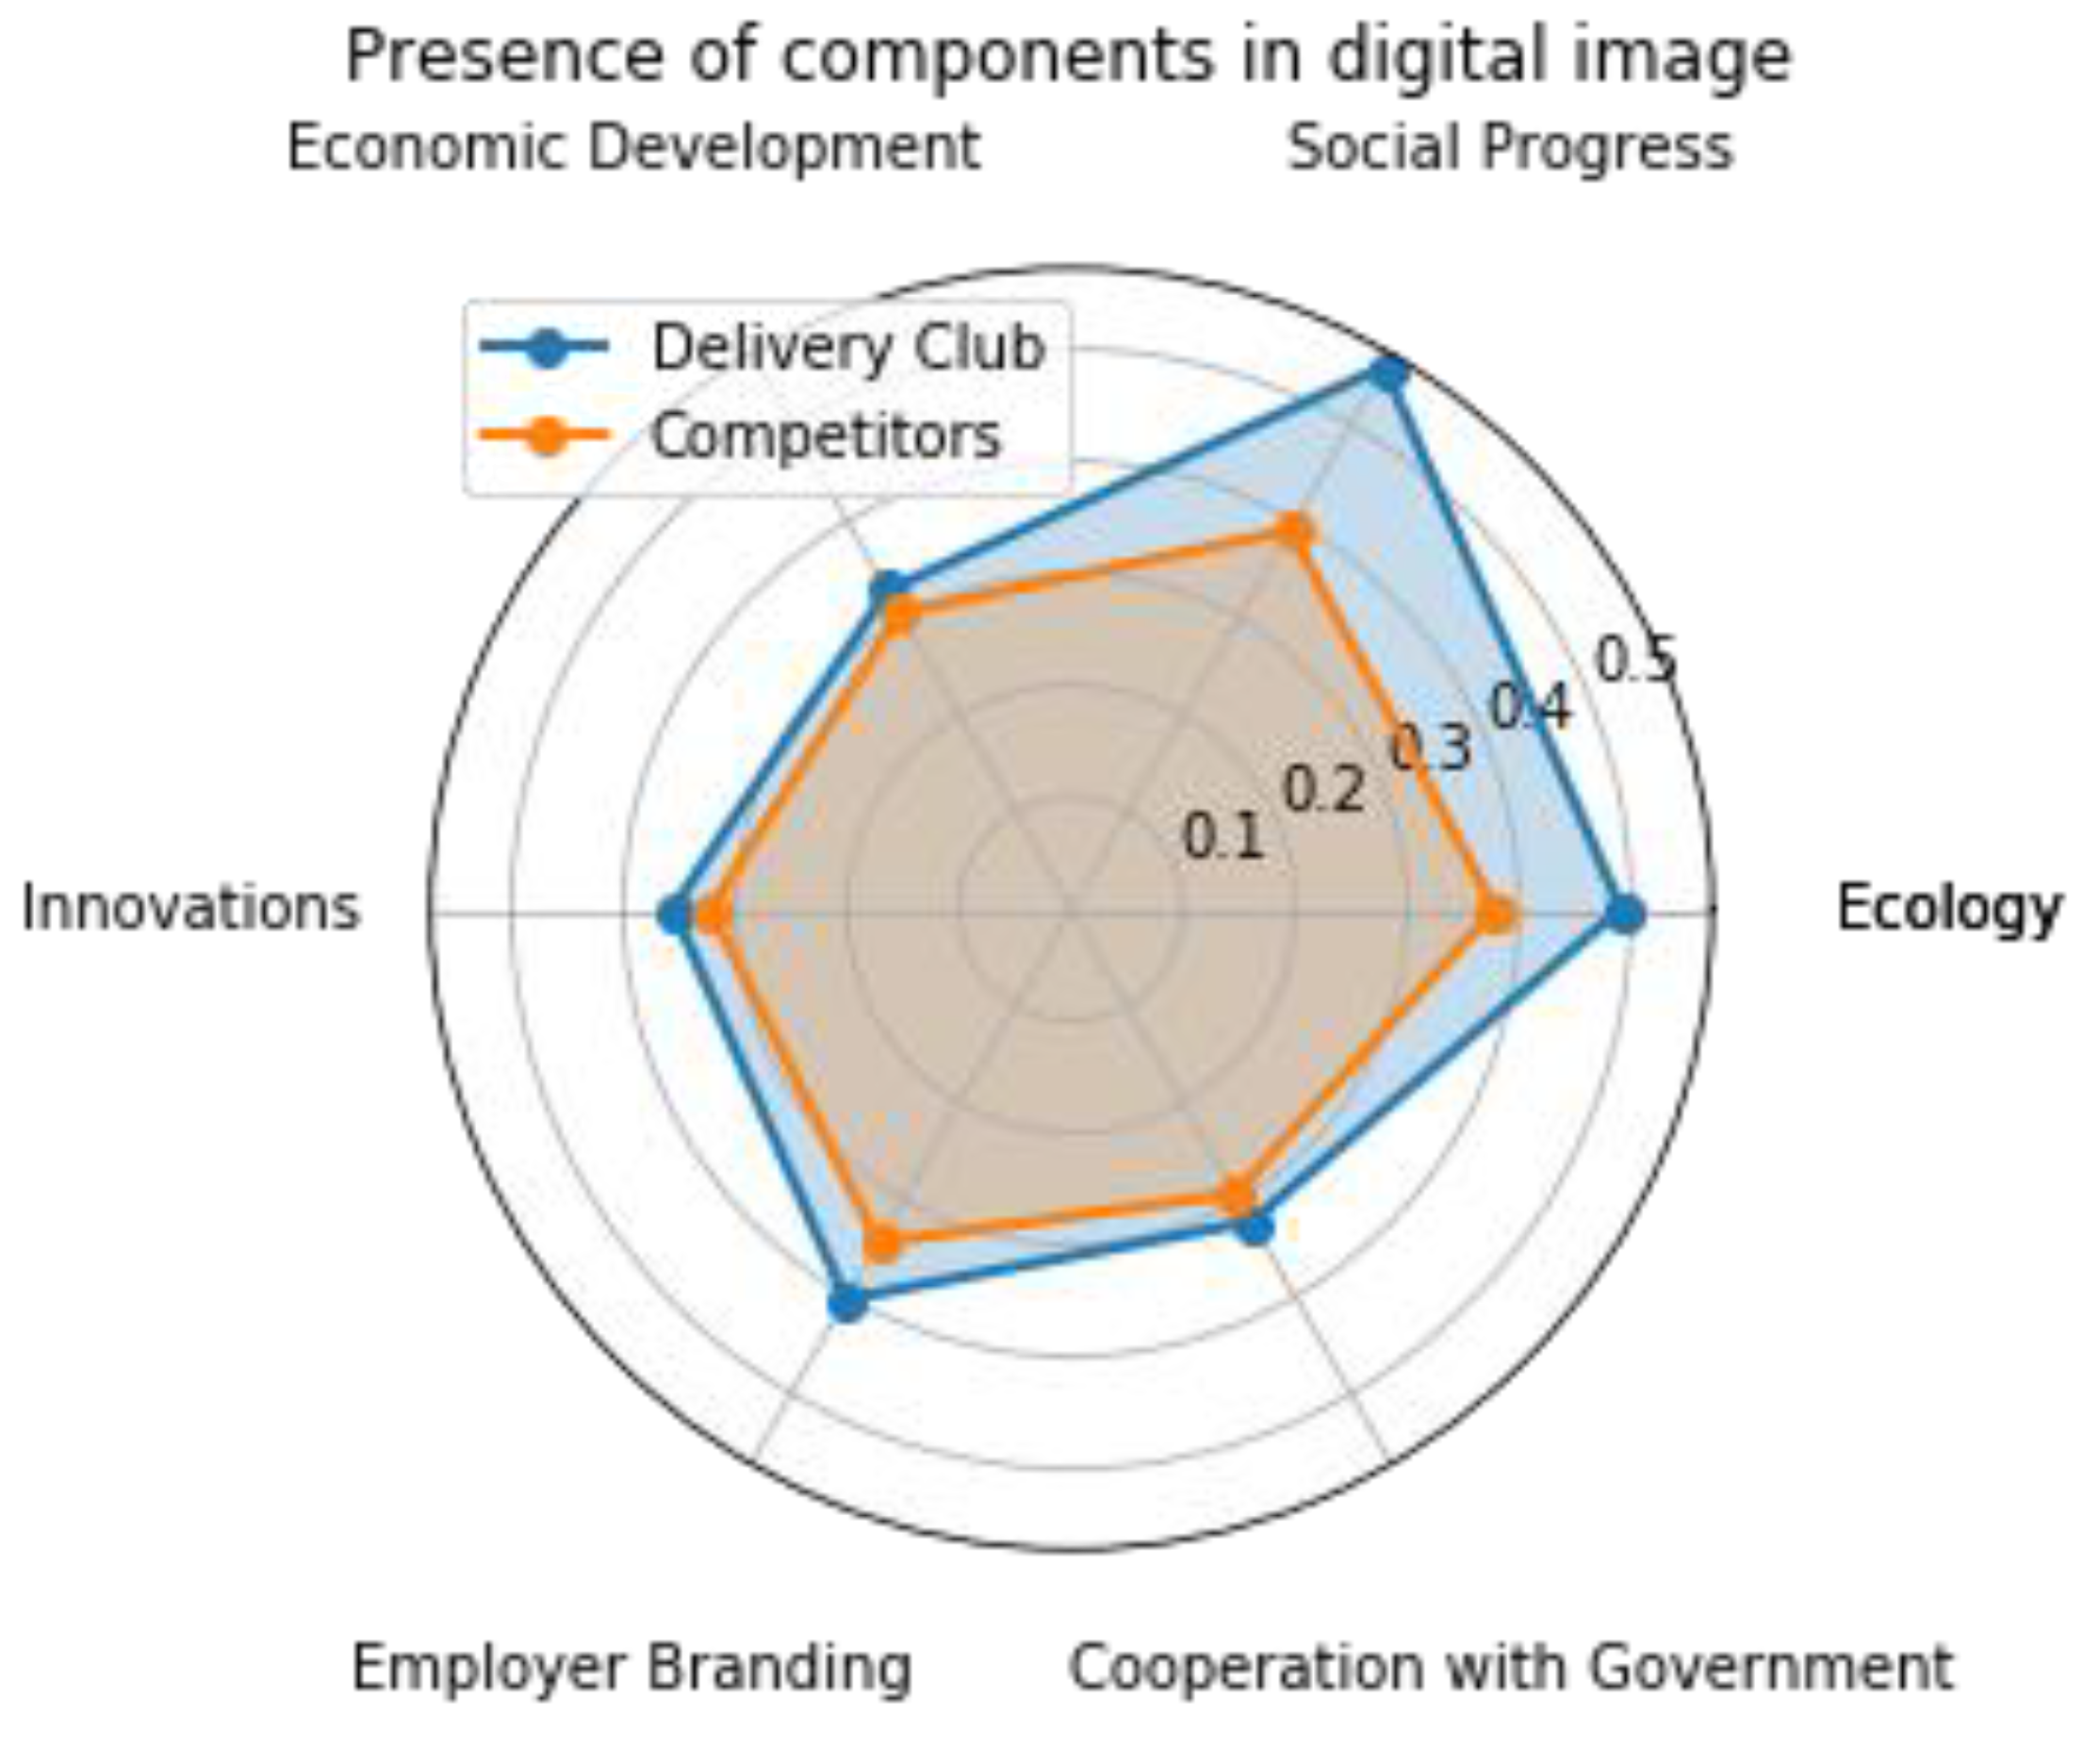
According to the index of the presence of sustainable development topics, Delivery Club ranked second, as illustrated in
Figure 6. It indicates that Delivery Club pays considerable attention to the concept of sustainable development and develops it by improving the economic, social, and environmental components of its business.
The results of the analysis presented in
Figure 7 indicate that environmental problems are important for Delivery Club.
For instance, the company favors the delivery of orders by eco-friendly transport, while most of their deliverymen use bicycles or scooters. In addition, Delivery Club participates in various environmental projects. A good example is the Wild Restaurant project, which the company launched jointly with the World Wildlife Fund. As part of this charity event, you can donate money to provide rare animals with the food from their usual diet and support projects which protect rare species [
40]. The company also contributes to the social component of sustainable development through numerous research projects, for example, the study titled “How to make Russian cities with millions of people convenient for cyclists: a study by Delivery Club and Strelka Design Bureau” [
41] or the social project “Courier Career Center” which helps couriers acquire a new profession in the sphere of IT or marketing [
42].
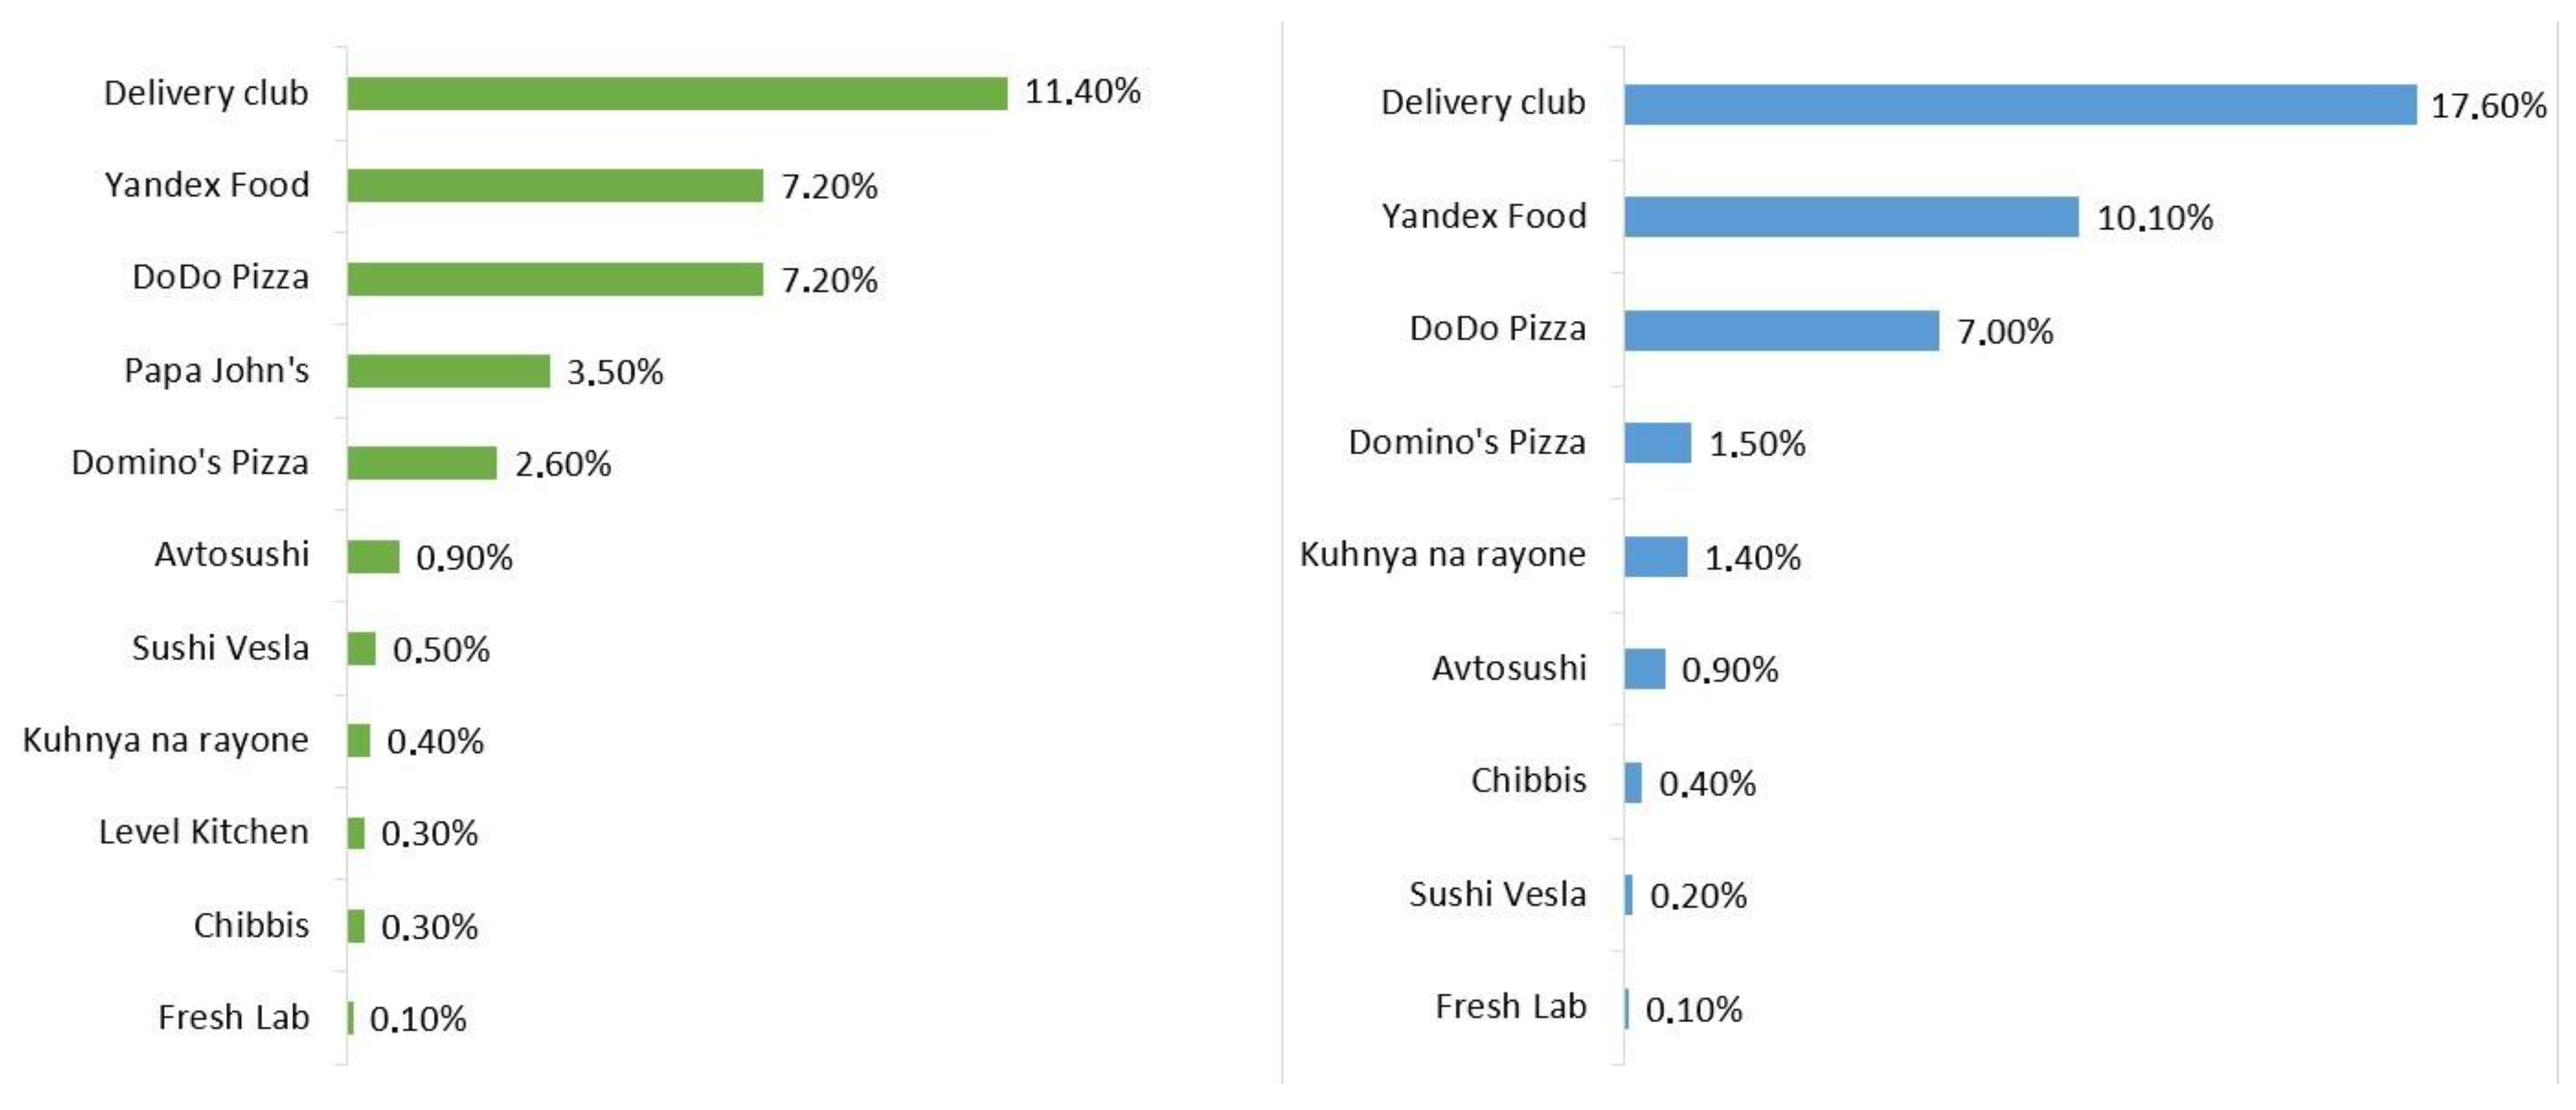
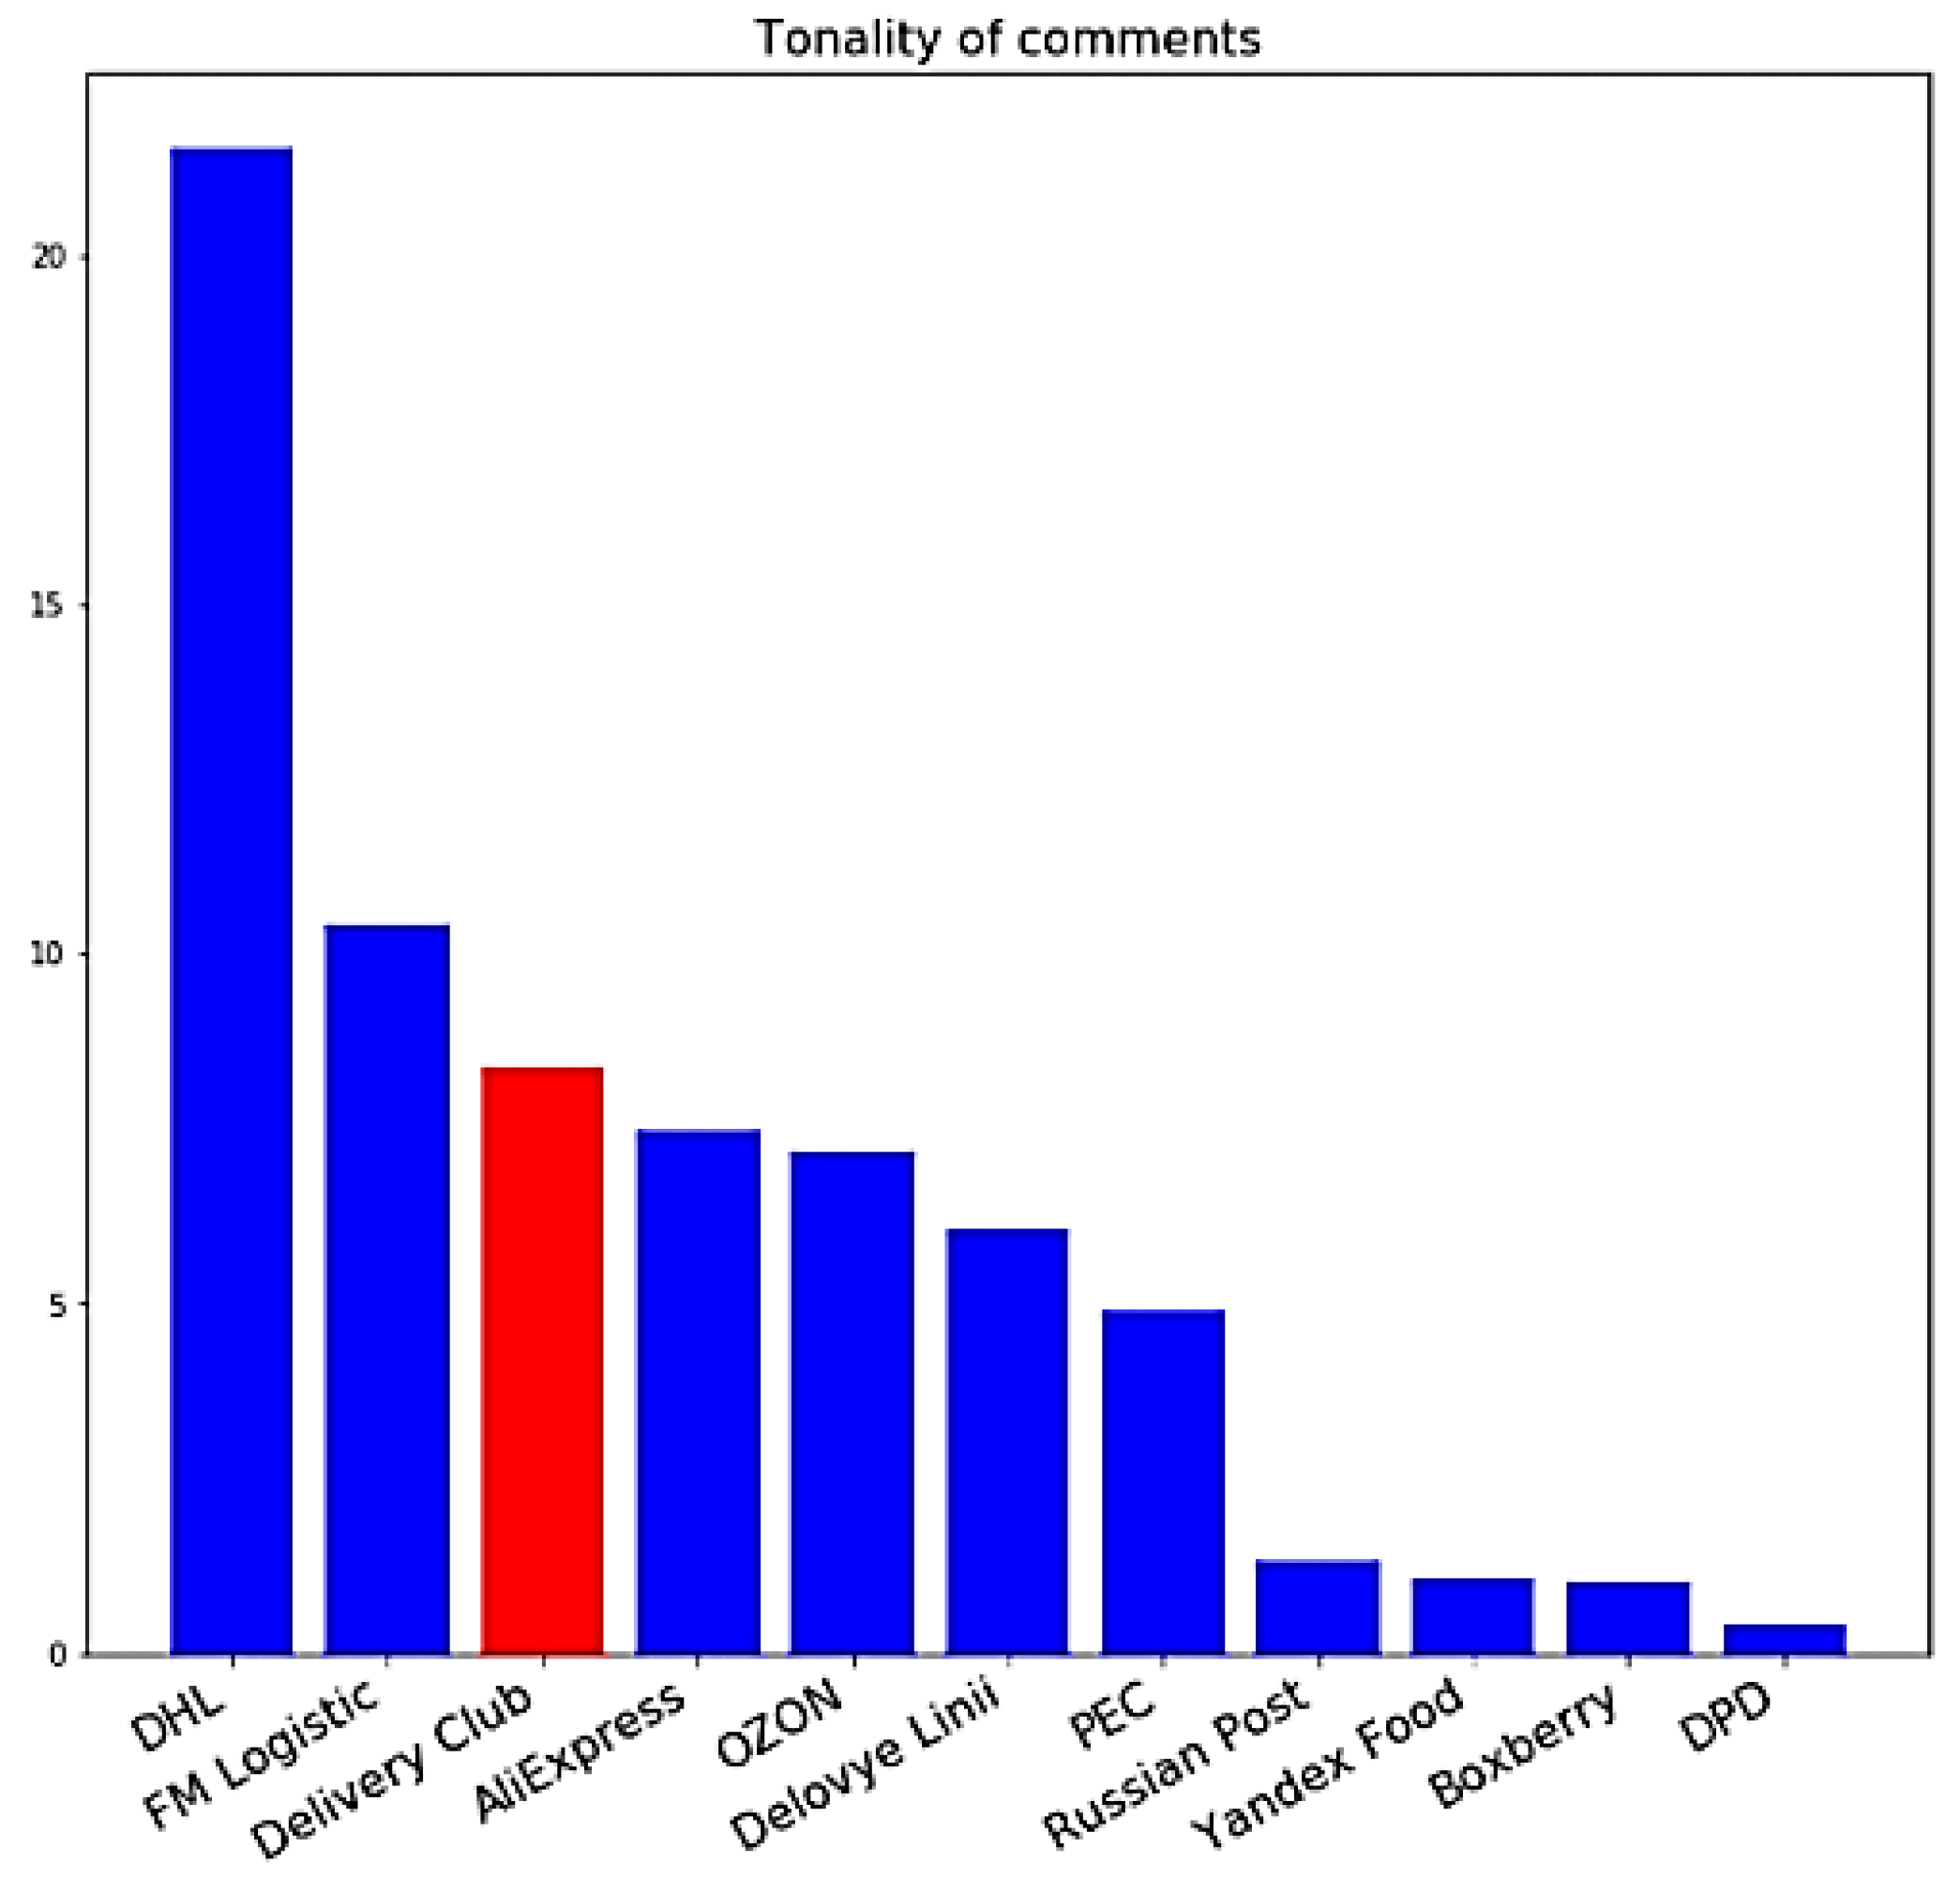
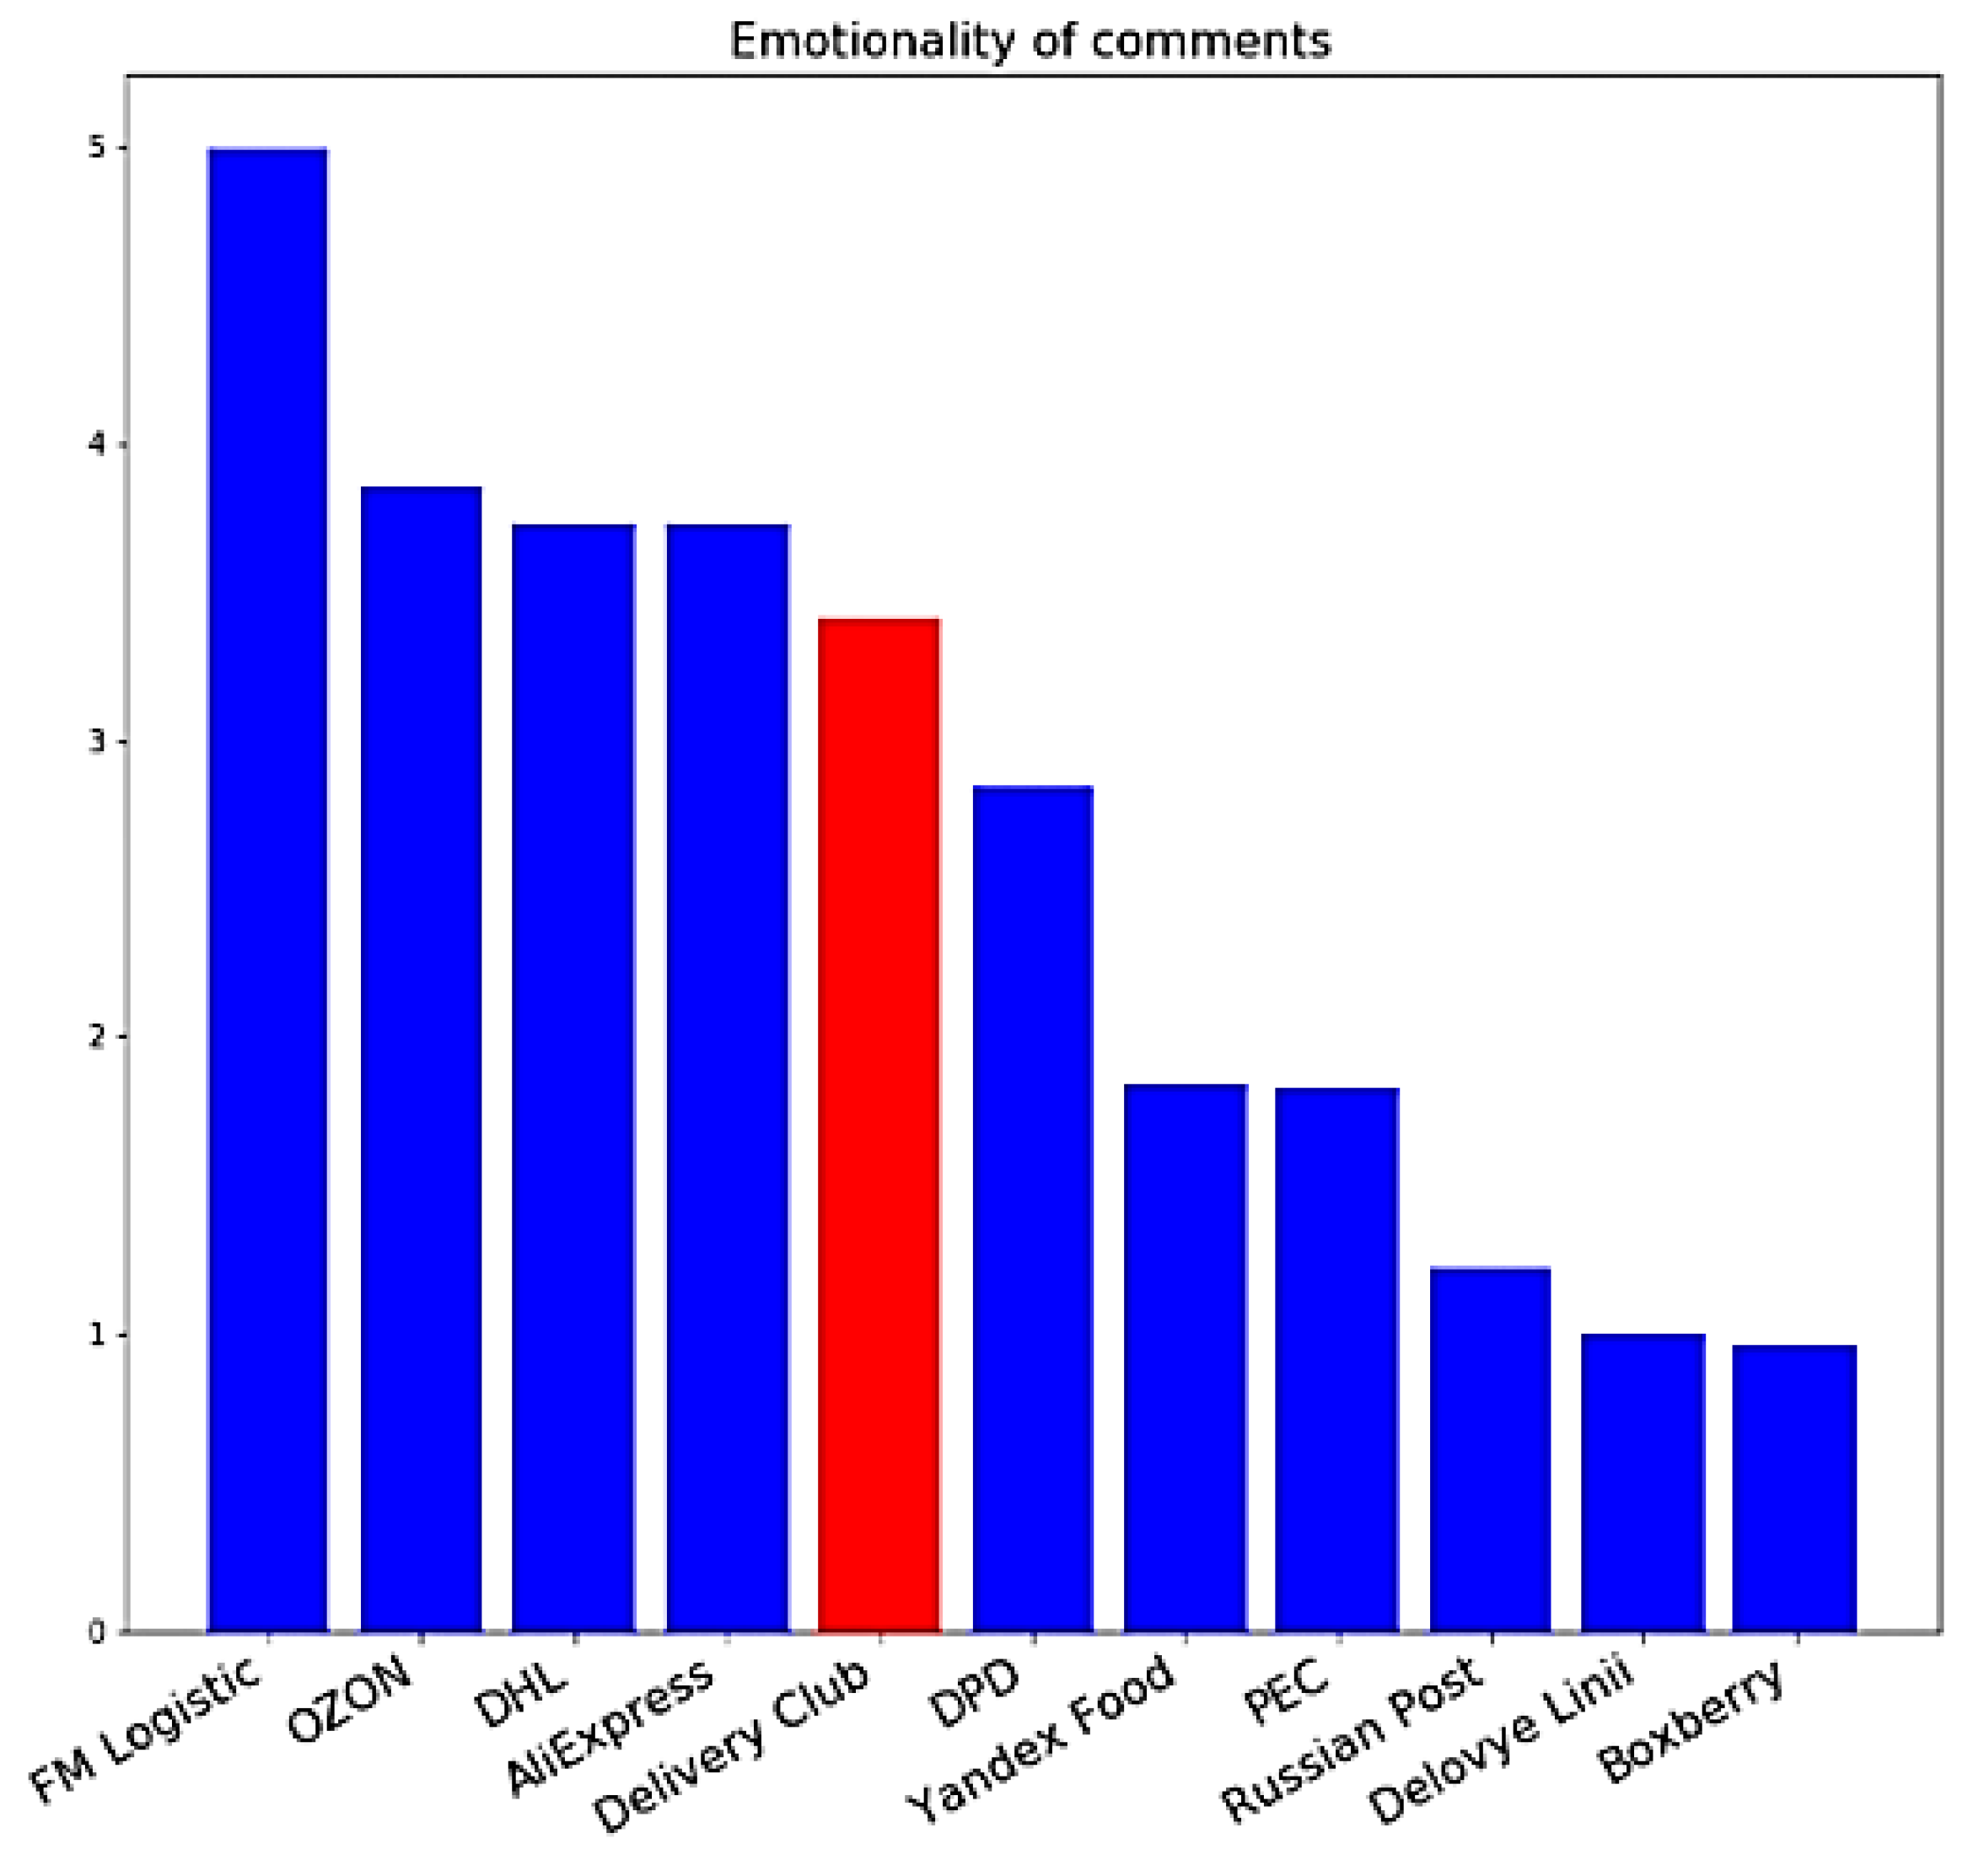
In terms of the tone and emotionality of comments, Delivery Club ranked fourth (illustrated in
Figure 8 and
Figure 9).
Presumably, it indicates customer satisfaction with food delivery services and confirms that the company cooperates with trusted partners, since customer feedback depends not only on the quality of delivery but also on the quality of food. However, as was assumed above, most of the reviews were left in the company’s mobile app.
Based on the Delivery Club specifics, the quality and delivery time depend on the employee’s responsibility. Since the delivery of the product is directly evaluated by consumers, their opinion about the quality of the delivery considerably depends on the personal factor of how responsible the courier fulfilling an order is.
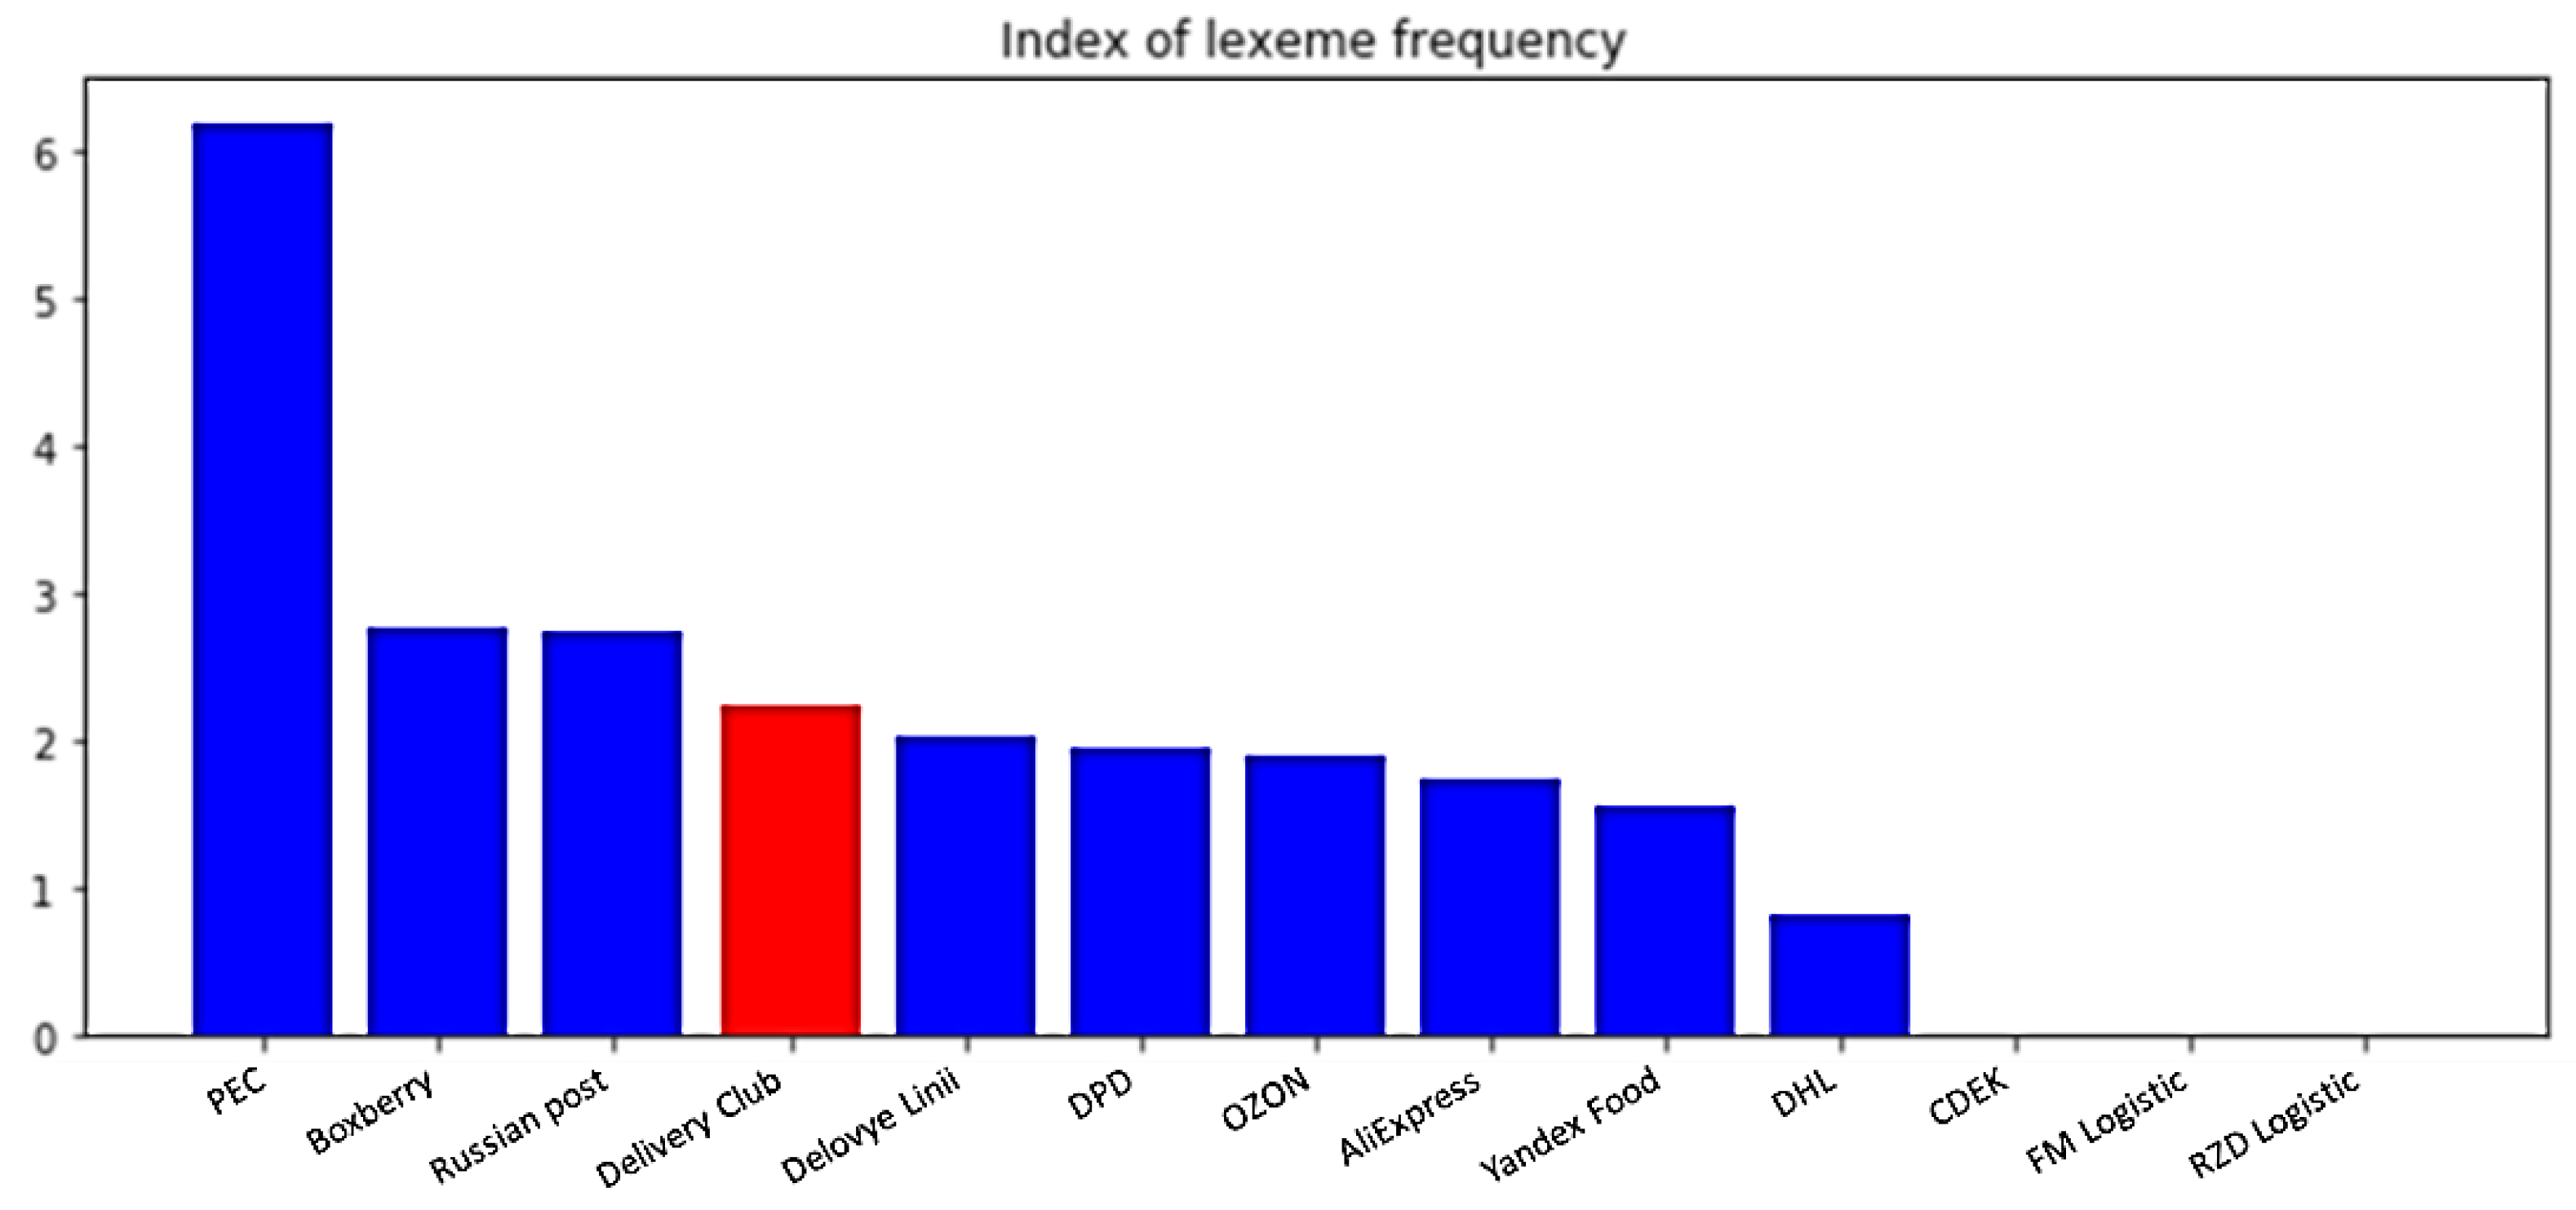
Nevertheless, the frequency of the wordform “lateness” in the comments was moderately low compared to in the comments of its competitors (illustrated in
Figure 10).
Therefore, the company’s customers do not tend to complain very frequently about the courier’s lateness. Thus, it can be assumed that the company pretty successfully applies labor motivation systems and encourages workers to achieve high-quality delivery so that clients receive an order on time. Moreover, we noted that the frequency of the word “lateness” in Delivery Club’s tokens was significantly lower than in tokens of Yandex Food. This is probably because the analyzed company calculates the delivery time more accurately and “honestly”.
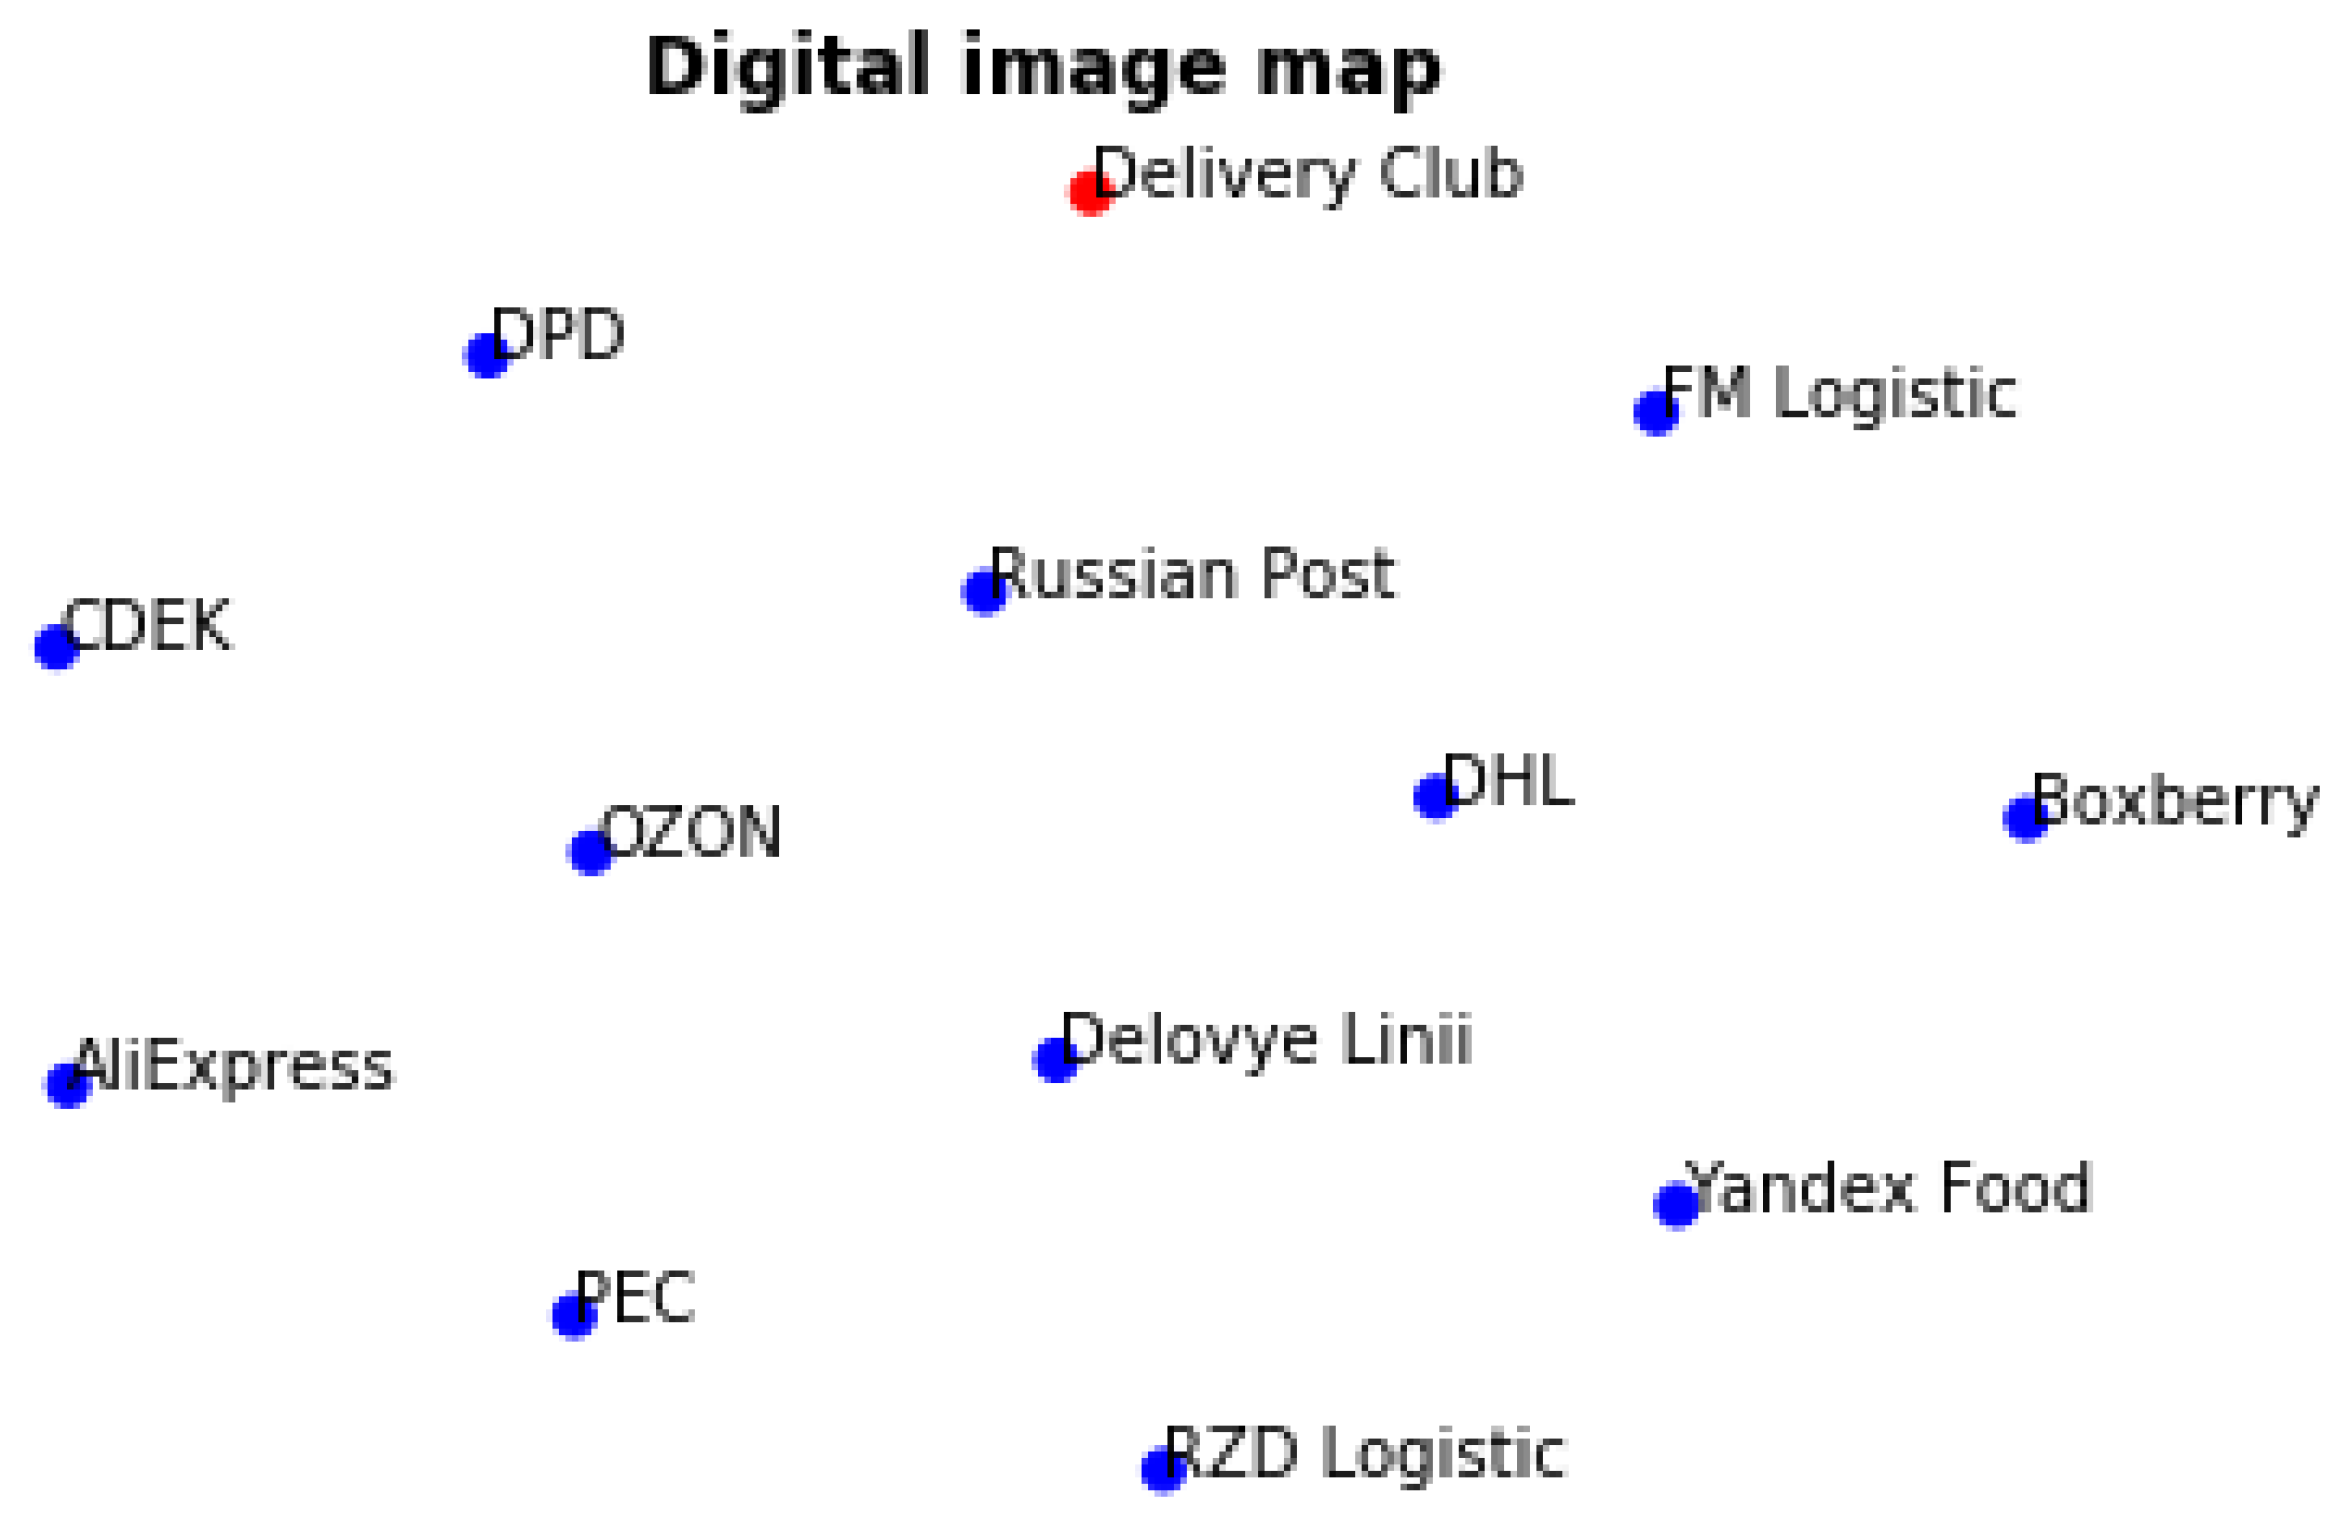
The digital image map (illustrated in
Figure 11) shows that the image of Delivery Club differs considerably from the image of Yandex Food, even though both companies have similar business models and provide a comparable range of services. Such difference can be explained by the fact that the Delivery Club company also provides a service for the delivery of everyday goods from stores and differs from the Yandex company in terms of brand development.


 ,
, 


