1. Introduction
In the early days, for the archival of stored data from personal computers, one had to have access to the personal computer. Accessing data globally was much more difficult. In the 1980s, the storage of data was conducted using fixed landline data centers, and these data centers were expensive to build. To access resources from a fixed landline server, one had to have access to the grid; this was time-consuming, and in contrast, the cloud is not restricted to storage alone, but it is also used for computing and networking. In computers and computer networking, the network has a complicated section and the collection of computer systems is affected. The cloud in the diagram signifies the fact that details about the system do not affect one’s objectives, and therefore, they hide in a cloud. Details about the computer systems delivering the service do not concern the user. Details of how this happens do not matter, and therefore, the system appears in a cloud. To avoid this, users started to purchase or install software and data centers of their own; this proved to be costly. Once a job is done, if resources are not utilized, this means it is underutilized. Therefore, the usage of resources was not scalable and efficient. Additionally, the cloud is not restricted to storage alone, but it is also used for computing and networking. To overcome these problems, the use of resources on rental or lease-based mechanisms lead to the concept of cloud computing. These facilities have access to resources from any part of the world remotely, and the location of stored data is not known to the user.
Cloud computing is an emerging technology used to store and remotely retrieve data. Hence, users do not have the botheration of investing in infrastructure. This reduces the cost, time, and energy needed, and its concept is ‘pay per use’. An example of this is electricity [
1].
Public clouds, private clouds, and hybrid clouds are the three types of cloud computing. Cloud computing provides services such as Infrastructure as a Service (Iaas), Platform as a Service (Paas), and Software as a Service (Saas). Iaas contains a pool of hardware resources such as memory, computing power, and storage capacity that are available for rent/lease. Instances of Iaas are presented by virtual machines (VMs) [
2].
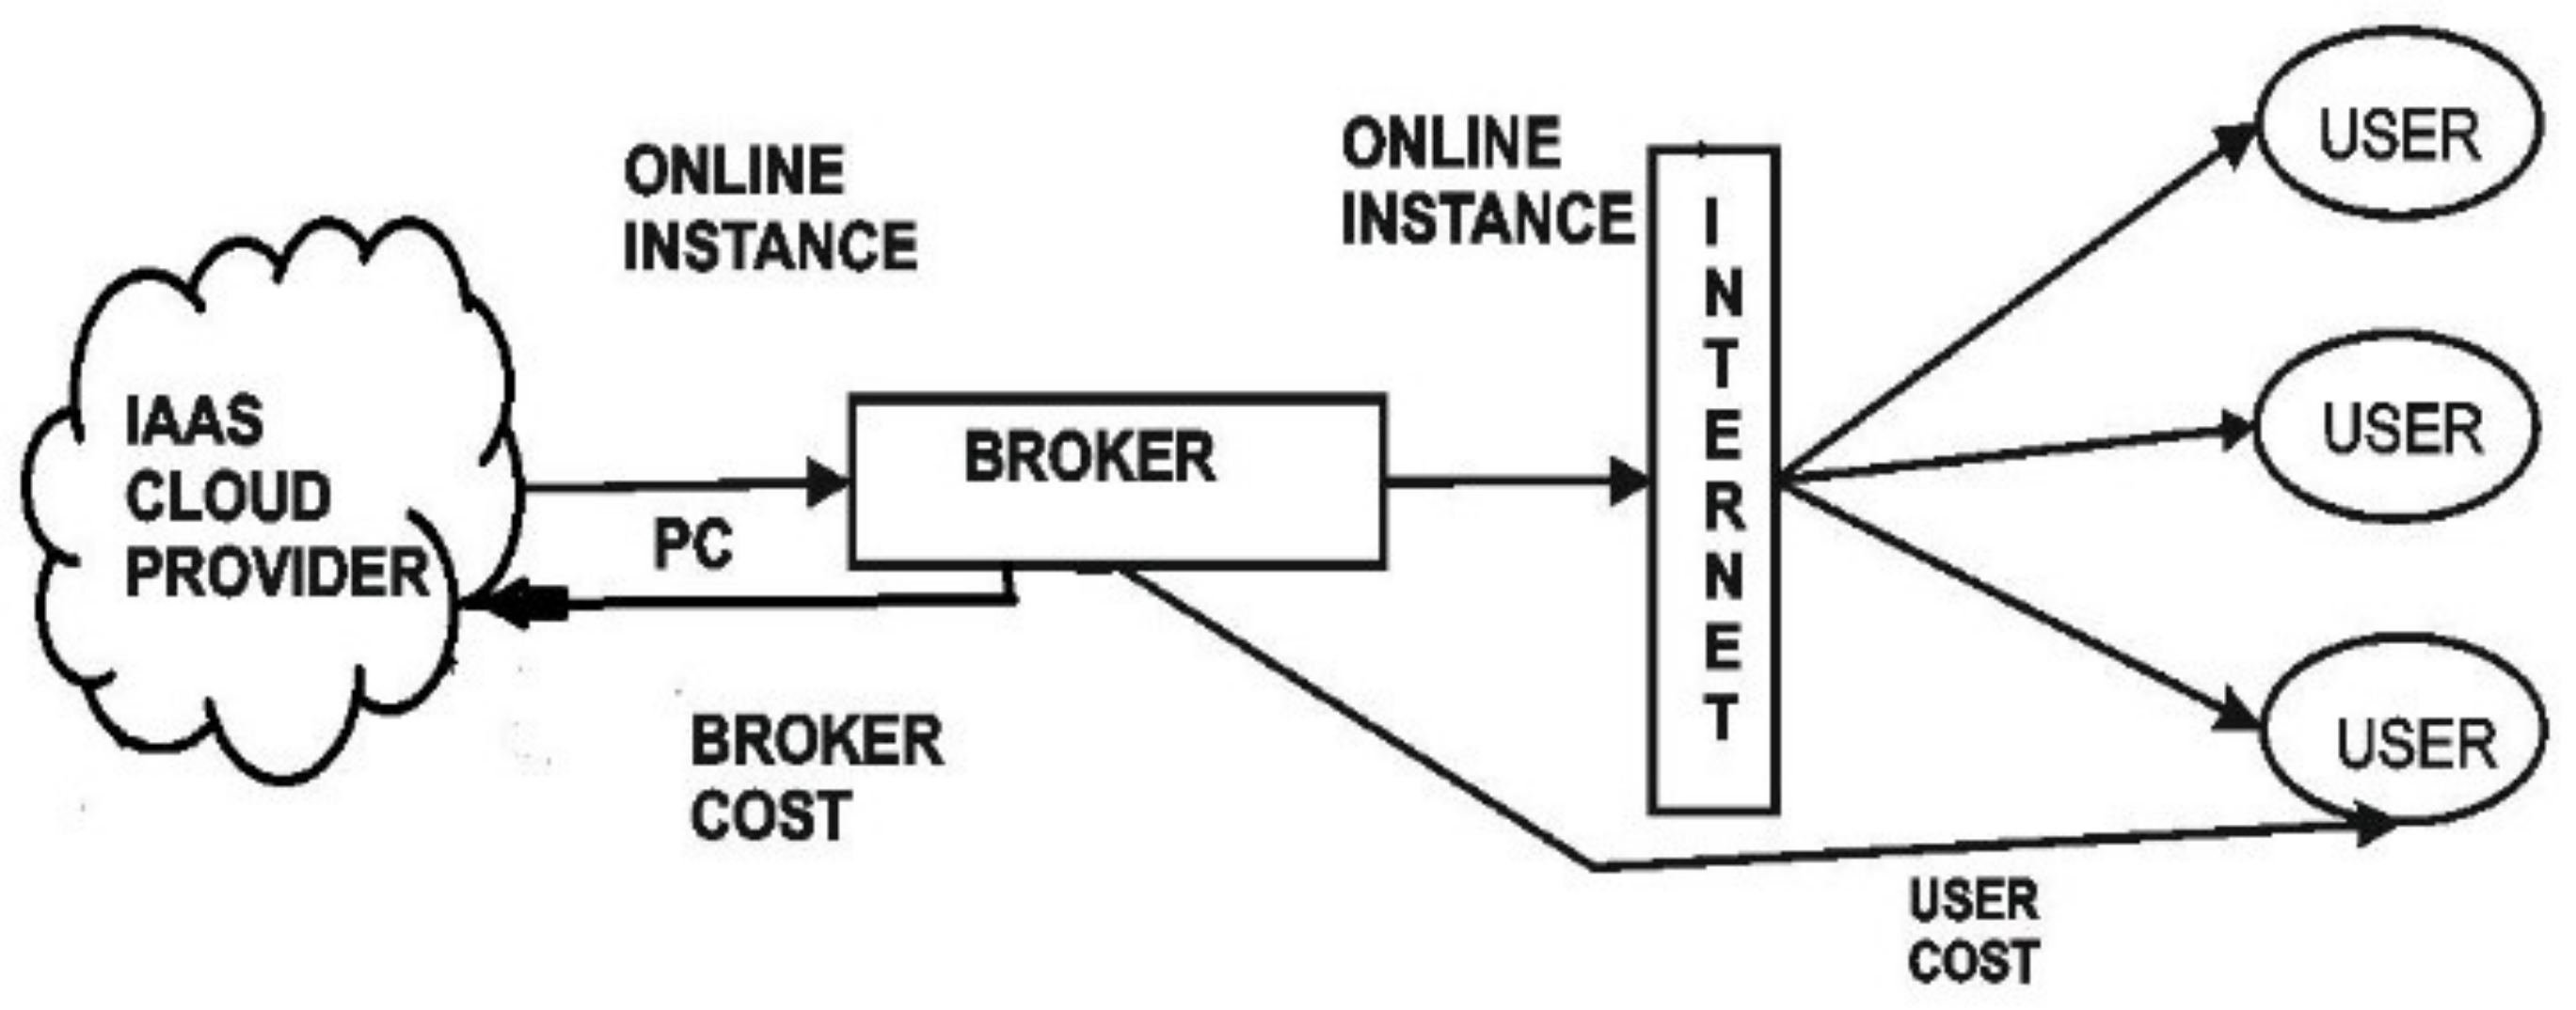
Computing can be modeled in two ways. The two-tier model directly communicates between the client and infrastructure service provider. Direct communication leads to a reduction in underutilization [
3]. The other model is called the three-tier model, which includes one more tier that acts as a mediator role between the client and the service provider [
4]. The mediator is called a broker. The cloud broker plays a dual role in the context of cloud computing. When a broker interacts with a provider, it acts as a client and behaves as a provider when interacting with a customer. This leads to effective resource utilization, but the broker benefits more, and the cost automatically escalates. To overcome this problem of cost escalation, a model is designed to reduce brokerage and thereby reduce the number of VM creations for effective resource utilization, as shown in
Figure 1. Multi-objective optimization is mainly concerned with multiple attributes and two objective functions. For example, a consumer tends to minimize the cost of car which looks to have maximum comfort while purchasing a car.
CURA is a Cloud-Managed Model which consists of a VM pool, profiler, and analyzer of a resource management system and works on jobs with deadlines. The VM pool manager, in-turn, assesses the current workload by reconfiguring the cluster workload and accordingly reconfigures the cluster size based on the type of incoming job sizes into small, medium, large, and extra-large and assesses the availability of VM cluster pools. The profiler and analyzer provide the requirements of the incoming job. The profiler identifies the available cluster pool. When smaller jobs arrive and if there is no small cluster pool available, then the available larger cluster pool divides itself into smaller ones. However, in the case of extra-large jobs, if there is no larger cluster pool available, then it cannot fit itself into a smaller cluster pool. This process is known as the reconfiguration of smaller cluster pools. The division and summation of pools is known as the reconfiguration method, which leads to the escalation of cost and is time-consuming. However, to overcome this problem, a CMRBC model is designed. This model refuses to create any type of job pool. Instead of pooling the type of job, it classifies and merges the job together. This avoids brokerage, reduces the number of VM creations and high termination costs, and uses on-demand resources. A summary of the comparison of the existing and proposed model is shown in
Table 1.
The rest of the paper is organized as follows: related work is described in
Section 2, background work is described in
Section 3, problem definition is defined in
Section 4, the entire structure of the model is described in
Section 5, experimental results are described in
Section 6, and
Section 7 concludes the paper.
2. Related Works
Kanu et al. [
6] proposed a heuristic scheduling algorithm, Particle Swarm Optimization (PSO), to reduce the total execution cost of application workflow in cloud computing. The Group Arrangement calculation chooses ideal hubs in a dynamic cloud condition to design a bunch to run Map-Reduce programs. The calculation is used for global resource utilization and gives good performance to the customers.
Kessaci et al. [
7] explored the request type made by the user and it checked the syntax according to the request type; the scheduler decided which system the request was to be assigned to. Two destinations were considered in the advancement process to limit both the response time and the cost of the VM occurrences, to fulfill the customers to amplify the benefit of the intermediary. The approach was tested by utilizing reasonable information from various Amazon EC2 cases and their pricing histories.
Anastasiadis et al. [
5] proposed a new evolutionary algorithm CSA task scheduling in cloud computing. The CSA algorithm is based on optimizing the brokerage and the best-fitting virtual machine for the job. Dynamic procedures are used for the dealer to reserve virtual machines with the target of limiting its service cost. These systems use dynamic programming and guess the calculations to quickly deal with expansive volumes of demands and expand the execution of the resources by reducing response time.
Kumar et al. [
8] proposed a DLS algorithm to efficiently trace the workload in cloud computing to meet the requirements of security, time, costs, and executing tasks within the deadline. In this algorithm, a specialist needs to enroll every one of the data centers in a registry. The vitality is devoured by assignment handling, utilizing the virtualization and vitality of IT gear such as switches. The data center chooses a system with the least vitality utilization for assignment handling. This algorithm considers the vitality control relationship and the way that vitality utilization can be reduced.
Valentini et al. [
9] proposed some heap load balancing systems depending on both memory and CPU usage, not focused on jobs’ execution times. In this system, tasks rely upon a cost grid table which adjusts the heap by sending the job to the allotted virtual machines. Two important requirements that require more consideration for vitality productivity are reducing cost and maximizing resource utilization and system reliability.
Wang et al. [
10] proposed dynamic strategies to exploit both pricing advantages of long-term occasion reservations and multiplexing additions to limit cost. A down-to-earth issue confronting cloud clients means limiting their expenses by choosing among various evaluating alternatives because of their requests. Another cloud financier benefit is that it holds an extensive pool of occurrences from cloud suppliers and serves clients with value rebates. The user ideally misuses both estimating advantages of long-term occurrence reservations and multiplexing picks up.
Tiwari et al. [
11] designed an algorithm to find the user’s needs, the best cloud service provider, and a cloud metaphysics programming algorithm, mainly based on programming techniques. The cloud computing environment provided a convenient broker execution management system to bring good prescription measurement programming techniques and a load leveling strategy to allocate resources to a number of customers for their different operations.
Pushpalatha et al. [
12] proposed a method for a load balancing scheme to adjust plans for cloud computing to expand the execution of resources by decreasing migration time and response time. The new method with stack-adjusting system TSLB calculation used a compression strategy to increase the usage of resources and to accelerate the procedure. Assignment Portion and Capacity Dispersion are the two issues that should be considered while discussing cloud storage accumulation of VMs.
Marshall et al. [
13] proposed a cloud infrastructure that the joins on-request designation of resources with the provision of cycles from sitting out of gear cloud hubs to different procedures by conveying virtual machines (VMs). For this, the Nimbus was utilized. The idea of Optimal Resource Allocation utilizes the thought of HTC clients and on-request clients. A model application that shows the confirmation of the idea was created. The experimental outcomes were encouraging. It decreased the cost of the applications by effectively using cloud resources and found the virtual cloud assets that must be appropriate for every one of the applications.
Aral et al. [
14] proposed various novel heuristics, compared them with the round-robin position procedure, and focused on better use of the resources by the cloud environment. In the meantime, Aral et al. minimized the quantity of Application Migration being used, which demonstrated that an application heuristic that depends on the difference between the maximum and minimum usage rates of the resources outperformed another application situation approach and altogether enhanced the conventional methodologies.
He et al. [
15] evaluated a new calculation for enhancing the usage of resources for cloud suppliers. The multivariate probabilistic model calculation selected reasonable PMs for VM re-distribution, which were then used to produce a reconfiguration design.
The two heuristics measurements could be utilized as a part of the calculation to enhance the resources’ use level for cloud suppliers. An example of this is Amazon EC2, which just gives constrained sorts of VM setups. These groups of VMs are framed by utilizing K-Means bunching calculation. So, before moving to any data centers, sets of VMs are made, and later, they move to the closest data center.
Shakkeera et al. [
16] proposed an Optimized Load balancing algorithm in an IaaS virtual cloud environment that limits to use of the virtual cloud resource productively. It limits the cost of the applications by adequately utilizing cloud resources and distinguishes the virtual cloud assets that must be reasonable for every one of the applications. The web application is made with numerous modules. These modules are considered as assignments, and these undertakings are submitted to the load balancing server.
Devi et al. [
17] applied a load balancing mechanism to quantify a few QoS execution measurements, i.e., normal execution times, cost, CPU usage, throughput, memory usage, disk space, organize transmission and gathering rate, scheduling success achievement rate, and asset use rate for the number of virtual machines and improve the accessibility among resources using load balancing systems. The essential aim of using assets from the cloud is to minimize the cost and to improve the execution concerning resource usage.
Wang et al. [
18] investigated a novel client infrastructure cloud stage, Spot Cloud, through extensive estimations. Supplementing a server, Spot Cloud empowers clients to contribute or pitch their private assets to all in all offer cloud administrations. Even though the limit, as well as the accessibility of this stage, is not yet equivalent to big business data centers, Spot Cloud can give extremely adaptable administrations to clients as far as both execution time and pricing mechanism are concerned. It is neighborly to the clients who frequently look to run here-and-now customer assignments at minimum expenses.
Kumar et al. [
19] introduced an innovative idea that provides on-request administration and offers a dynamic registering framework and allots resources in an ideal way. The number of clients requesting assets is expanding nowadays; because of this, it is difficult to designate cloud assets productively and precisely to the clients that fulfill prerequisites and the Service Level Agreement (SLA). Numerous parameters can be specified as the factor of the issue that should be considered, such as, for example, stack adjusting, framework throughput, benefit dependability, and benefit–cost.
Mod et al. [
20] utilized CloudSim apparatus. CloudSim is an extensible simulation toolbox that empowers the demonstration and recreation of cloud computing frameworks and application provisioning conditions. A few specialists from associations are utilizing CloudSim in their examination of cloud resource provisioning and vitality in the productive administration of server resources. The convenience of CloudSim was affirmed by a contextual analysis, including the dynamic provisioning of utilization benefits for different sorts of resources.
Kumar et al. [
21] mentioned the issues with benefits displayed in the current arrangements, including the fact that the cloud supplier may either finish providing resources or may not be in a position to serve a vast number of solicitations. All clients may not require on-request designation. The technique is used with a specific end goal to streamline the resource portion. Numerous applications exist that deal with High-Throughput Figuring (HTF), where more resources are required to be allotted. It permits quick access to servers and the effective usage of accessible assets. This reallocation of VMs enhances the execution of CPU, memory, and system activities by decreasing the heap on data centers.
Aware et al. [
22] surveyed cloud computing conditions with different cloud clients to determine the number of cloud benefits in parallel. So, there must be an arrangement in which all assets are made accessible to ask the client for effective ways to fulfill their need. In this overview, an audit of different procedures for dynamic resources allotment in cloud computing is indicated, including the Straight Planning Technique for Asset Assignment, Topology Mindful Asset Portion (TARA), and Dynamic Asset Designation for Parallel Information Handling. Besides restrictions, criticalness and favorable circumstances of utilizing Asset Designation in cloud computing frameworks are likewise discussed.
Panchal et al. [
23] concentrate on administrations incorporating IaaS (Framework as an Administration), PaaS (Stage as an Administration), SaaS (Programming as an Administration), and DaaS (Information as an Administration). VM designation enables virtual machines to be shared productively with accessible data centers, and these distribution strategies help to assess and upgrade the cloud execution. Distinctive allotment arrangements are accessible, and they have their points of interest and constraints. A new powerful VM portion arrangement is presented that takes VMs according to client necessity and shares them in a bunch shape to the accessible data centers.
Tripathy et al. [
24] used a convention intended to limit the exchanging time, enhance the asset usage, and enhance the server execution and throughput. This technique or convention depends on occupations in the cloud and aims to tackle the downsides in the current conventions. In this convention, the need for the activity which gives better execution to the PC is determined, and attempts are made to limit the holding up time and exchanging time. Efforts have been made to deal with the planning of employment to determine the disadvantages of existing conventions and improve the proficiency and throughput of the server.
Patel et al. [
25] proposed a scheduling calculation to beat the proper distribution guide of occupations because of various elements. An orderly survey of different need-based occupation booking calculations was introduced. These calculations are used from an alternate point of view; working standards, etc., infer that all the current procedures essentially center around the need for employment and diminish the benefits to education time and enhancing execution.
Dhanalakshmi et al. [
26] developed the extraction of transaction log files to predict multiple output (MOP) in a Multi-Sharing System based on resource utilization for higher accuracy using the prediction techniques Random Forest and majority voting algorithms. The goal was to gratify upcoming resource demands and to avoid over- or under-provisioning of resources. The accuracy results show that the proposed model provides higher accuracy in predicting resource utilization for upcoming resource demands, and prediction cost and time are reduced.
In the work of Dhanalakshmi et al. [
27], an algorithm named dynamic computation of threshold value (DCTV) was proposed, and based on the threshold value, the jobs were classified in the initial stage, so this classification led to the precise allocation of resources and with efficient resource utilization. The experimental result showed that by using dynamic computation of threshold value, the allocation of resource time was reduced and classification accuracy was improved compared to the manual computation of threshold value.
In the work of Dhanalakshmi et al. [
28], the ‘‘Multi Sharing Resources in Hybrid Cloud (MSRHC)’’ model was proposed. The proposed model mainly aimed to enable the sharing of multiple resources by multiple users and provide access control to unused resources. The experimental results showed that by using the Carry Forward of Unused Resources (CFUR) and Access Control for Contributed User (ACCU) approach, the results produced 100 percent of resource utilization and fully fledged access to the contributor user alone, which reduced the cost.
Dhanalakshmi et al. [
29] proposed a CMRBC model to minimize brokerage and maximize resource utilization by using classification and merging techniques. This paper is a revised and expanded version of a paper entitled ‘Efficient Resource Utilization by Reducing Broker Cost Using Multi-Objective Optimization’ presented at the 2nd International Conference on Integrated and Intelligent Computing Communication and Security (IICCS 2018), Bangalore, India, 24–25 January 2018.
3. Problem Definition
Given a set ‘J’ of ‘n’ jobs, where, J = {j1, j2, j3…jn} with different job size, and a set ‘VM’ of ‘m’ virtual machines, where VM = {vm1, vm2, vm3…vmm}, jobs in ‘J’ are classified into small, medium, large, and extra-large based on the threshold value 50 MB, 100 MB, 150 MB, 200 MB, and above for the job size, respectively. Once classification is complete, it starts merging smaller jobs based on VM capacity. The profiler gives a set of requirements ‘P’ to execute a job, where P = {Memory, CPU, RAM, Bandwidth, Start time and End time}. Profiler information is submitted to the broker, and in turn, the broker interacts between the user and service provider. The broker assigns the tasks to virtual machines by satisfying all the requirements in ‘P’. The broker is the one who is responsible for creating and destroying the virtual machines.
The objective of this work is to maximize resource utilization and minimize the brokerage in cloud computing by using multi-objective optimization.
Assumption: The execution time of every job is assumed to be predicted based on the derived results of profiling, and virtual machine capacity is assumed to be 200 MB.
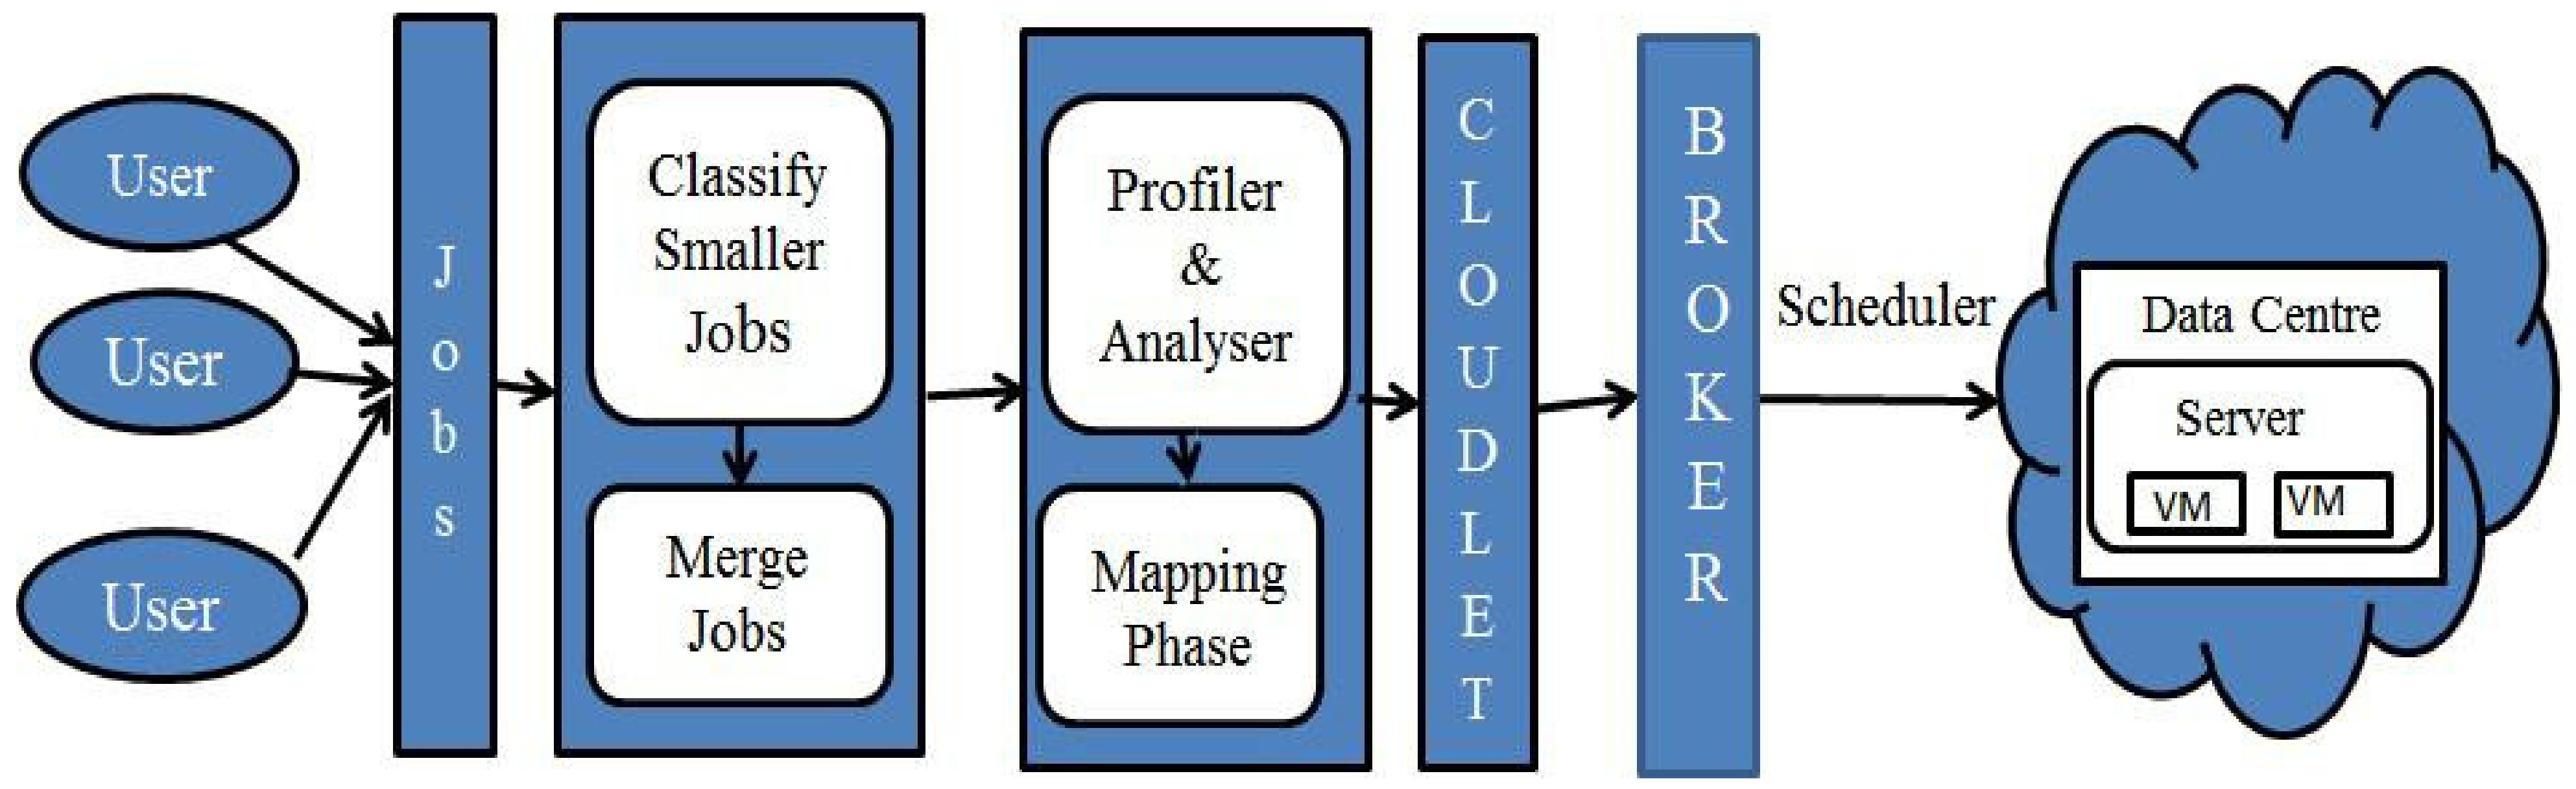
4. CMRBC: System Model
The system architecture consists of the following components: users, classifier, merger, mapper, profiler and analyzer, cloudlet, broker, and data center, as shown in
Figure 2.
Users: There are umpteen users who submit their work in the form of jobs to the cloud service provider, and in turn, these jobs are sent to the classifier.
Classifier: The classifier classifies the jobs into small, medium, large or extra-large based on the threshold value, and classified small jobs are submitted to the merger.
Merger: The merger segregates the small jobs based on their types. It reads small jobs in each group one by one and starts finding larger_jobs by merging small jobs under consideration if larger_jobs’ size is less than or equal to VM capacity. Once the larger_job’s size reaches VM capacity, it stops merging, and the larger_job is submitted to the profiler and starts creating a new larger_job for the next small job in the group.
Profiler and analyzer: The main goal of profiling is to reduce time and error. The profiler and analyzer analyze the job if it arrives for the first time and provides a set of the requirements such as Memory, CPU, RAM, Bandwidth, Start-time, and End-time to the mapper for the job to be executed, and these requirements are saved against the job. If the same type of job arrives, its requirements are retrieved and sent to the mapper.
Mapper: The mapping process makes sure not to violate the SLA constraints, and it is a process of mapping jobs with its requirement to cloudlet by interacting with the local schedulers of each data center after determining the availability of CPU, free time slots, and the expected number of resources to be utilized.
Cloudlet: The cloudlet is a mobility-enhanced, small-scale cloud data center that is located at the edge of the internet. When a larger_job is submitted to a broker by the mapper, it converts the jobs into tasks with the attributes of job length, type, and time.
Broker: The broker can act as a negotiator or intermediator between user and service provider; the allocation of a job is performed by the broker to reduce time and effort by assigning the task to available resources in a data center based on users’ Quality of Services (QoS). The broker interacts with different CSPs to provide effective resource utilization and decides which task should be executed in which virtual machine. Effective resource assignment strategies and allocation policies are required to satisfy users’ needs to maximize the profit for cloud service providers and minimize the cost to cloud users.
Data Center: In cloud computing, data are not stored on computer hardware nor local machines, but they must be housed on physical drivers somewhere in a data center. A data center is a repository that contains servers, physical machines, virtual machines, and so on, and it can be homogeneous or heterogeneous according to its equipment designs.
From
Table 2, consider a set ‘
J’ of ‘
n’ jobs, where
J = {
j1,
j2,
j3, …
jn}, and set ‘
VM’ of ‘
m’ virtual machines in the system, where
VM = {
vm1,
vm2,
vm3, …
vmm}. When the request arrives from the cloud user, it is considered as a job, and for job sizes less than or equal to 50, 100, 150, and 200, the jobs are classified as small, medium, large, and extra-large, respectively. Since the size of the jobs varies, it is difficult to allocate virtual machines dynamically because the configuration of the virtual machine is the same for all types of jobs and it consumes the same number of resources, for example, the small job does not require a higher-configuration virtual machine. For small jobs, the less resources are required, and for large jobs, more are required. As such, the utilization of resources is not efficient. Hence, to avoid this, the ‘classification and merging’ method is proposed.
The classification is completed using a classifier. When the classifier receives jobs with different job sizes, it classifies these jobs as small, medium, large, or extra-large jobs based on the threshold value, ‘ζ’. If the job size is less than or equal to 50 MB, then it is a small job; if the job size is less than or equal to 100 MB, then it is a medium job; if the job size is less than or equal to 150 MB, then it is a larger job; if the job size is less than or above 200 MB, then it is an extra-large job.
After classification, the set of small jobs are considered as
smaller_Jobs which contains ‘
n’ number of small jobs and it is denoted in Equation (1):
The set of medium jobs lies between 50 to 100 and it is defined as
The set of large jobs lies between 100 to 150 and it is defined as
The set of extra-large jobs lies between 150 to 200 and it is defined as
The set of Smaller_Jobs is given to a merger as input for merging the job, and the merger size is based on the VM capacity.
The jobs in the smaller jobs set are merged until the VM capacity is full, and they become one larger job, and the process repeats. Once the VM capacity is full, it stops merging and repeats the process. The jobs in the set of larger jobs are assigned to one VM.
The order of the Small_jobs is defined as: |Smaller_Jobs| = ns, where ns is an element present in Smaller_Jobs.
The total size of the jobs in the set
Smaller_Jobs is given by Equation (5):
where 1≤
K ≤
ns and ‘Ψ’ is a size function.
The jobs in the set
Smaller_Jobs are merged until the VM capacity is full, and they become one
larger_job, and the process repeats. Once the VM capacity is full, it stops merging and repeats the process. The jobs in the set of
larger_jobs are assigned to one VM.
The output of merger is a set of (
larger_jobs) and it is given as an input to the profiler; the profiler analyzes the
larger_jobs one by one and determines how many resources are required to execute each job in
larger_job. The one
larger_job contains a set of jobs, i.e., {
j1,
j2…
jk}; the profiler takes one
larger_job and analyzes it one by one and provides the requirements to execute each job for the first time arrival. If the same type of job arrives for the second time, the profiling is not completed and it is directly submitted to the broker. Now, the broker decides to create virtual machines for the set of
larger_job based on the job size and timestamp. This is shown in Algorithms 1 and 2:
where
i =
ith
larger_job,
j =
jth job in
ith
larger_job.Where
xij is equal to 1, then a virtual machine is created; if
xij equal to 0, then a VM is not created. The broker cost calculation is the important phase of this model. Brokerage is directly proportional to the number of virtual machines created. The time taken to create and destroy a VM degrades the resource utilization. The cost of each larger job when a VM is created is given by:
where
jij = jth
job in
ith larger job. After obtaining the cost of one larger job, the overall cost of resources is calculates, defined as
The number of merged
larger jobs reduces the number of virtual machines created which impacts the brokerage and reduces the overall cost. Once the cost of
larger jobs is derived, then we need to calculate the broker cost and number of resources, utilized as
where
Bc is broker cost,
c is a constant brokerage cost of the creation of one VM, and
K is the number of virtual machines created.
The number of virtual machine creations are reduced by using our algorithm
(n − K), the brokerage is reduced by
(n − K) ∗ c/100, and the overall execution cost is reduced by
(n − K). The CMRBC model utilizes 100% of resource utilization by creating one larger job which contains a set of jobs, but a virtual machine is only created for larger jobs; so, by doing this we can reduce 60% of brokerage and 60% of the overall execution cost. With CMRBC, the resource utilization is 100% higher than without CMRBC. A multi-objective problem is the optimization of resources, and the goal is to optimize two objective functions simultaneously, such as minimizing broker cost and maximizing resource utilization. Optimization is a linear programming technique subject to equality and inequality constrains. Every linear problem corresponds to another linear program problem called its dual. The original problem is called the primal. To solve Equations (9) and (10) with two objective functions simultaneously, the Multi-Objective Optimization technique is applied as
where
i = 1 to K and
j = 1 to the length of a larger job. Thus, the objective of the proposed system to minimize the brokerage and maximize the resource utilization is achieved. The detailed algorithm for CMRBC is shown in Algorithm 3. Every job in the algorithm is initially classified as a job with smaller job sizes based on threshold value. Then, using these jobs, it merges and profiles the merge jobs and gives the requirement for each job execution. For every service requested by the user, the broker assigns the jobs to the service provider for the execution of the job. Then, the service provider returns the job to the broker.
| Algorithm 1: Algorithm for Classification |
| 1: procedure T(o) Classify jobs based on the job size |
| 2: Input: job: Array of structure of jobs, n: Number of jobs |
| 3: Output: smaller jobs: set of smaller jobs, |
| 4: medium jobs: set of medium jobs, |
| 5: large jobs: set of large jobs, |
| 6: extra-large jobs: set of extra-large jobs |
| 7: Begin |
| 8: i = 0; small jobs = [ ], medium jobs = [ ],large jobs = [ ], extra-large jobs = [ ], |
| 9: For (i = 1 to n) do |
| 10: If (job[i].size ≤ 50) |
| 11: small jobs U = job[i]; |
| 12: Else if(job[i].size between (50 and 100) |
| 13: medium jobs U = job[i]; |
| 14: Else if(job[i].size between (100 and 150) |
| 15: large jobs U = job[i]; |
| 16: Else if(job[i].size between (150 and 200) |
| 17: extra-large jobs U = job[i]; |
| 18: End if |
| 19: End for |
| 20: end procedure |
| Algorithm 2: Algorithm Merging Jobs |
| 1: procedure T(o) merge small jobs, medium jobs, large jobs, extra-large jobs. |
| 2: Algorithm: Mergering jobs (Small, Medium, Large, Extra-large job) |
| 3: Input: C Classified Jobs (small jobs, medium jobs, large jobs, extra-large jobs). |
| 4: Output: Set of K (larger jobs) |
| 5: Step 1: Consider a job ji K extra-large jobs, if ji is equal to 200 (VM capacity) then add to large job(K) set and increment K |
| else consider some smaller jobs to best fit in larger job bin packing method and increment K. |
| 6: Step 2: Consider each job large jobs(ji) one by one, if size of ji is less than 200 then consider some smaller jobs and medium |
| jobs and large jobs to best fit in larger jobs using bin packing method and add to larger job(K) and increment K. |
| 7: Step 3: Consider medium jobs(ji) one by one, if size of ji is less than 200 then consider some smaller jobs and medium jobs and |
| large jobs to best fit in larger jobs using bin packing method and increment K and add to larger job(K). |
| 8: Step 4: Consider smaller jobs(ji) one by one, if size of ji is less than 200 then consider some smaller jobs and medium jobs |
| and large jobs consider remaining jobs in this set to best fit in larger jobs using bin packing method and add to larger job (K) |
| and increment (K) |
| 9: Step 5: larger jobs [1] …larger jobs[K] contains subset of jobs such that their sum is less than or equal to 200. |
| 10: end procedure |
| Algorithm 3: Algorithm for CMRBC Model |
| 1: procedure: (T)o Reduce the brokerage and reducing the VM creation |
| 2: Algorithm: CMRBC (job, n) |
| 3: Input: job: Array of structure of jobs (Twitter Data Set) n: Total No. of Jobs |
| 4: Output: Bc: Broker cost |
| 5: Cl: Overall execution job |
| 6: Begin |
| 7: //ClassifyingJobs(small jobs, medium jobs, large jobs, extra large jobs). |
| 8: Classifier (jobs, n) |
| 9: //Finding set of larger jobs [1] … larger jobs[k] contains subset of jobs |
| 10: //such that their sum is less than or equal to 200. |
| 11: Merging job () |
| 12: cost=0, x [ ] [ ] is a binary matrix of size k x n and initialised to 0 |
| 13: for (i=1 to K) do |
| 14: for (j=1; j = large jobs[i]. length) do |
| 15: if jobi large Jobs[i] |
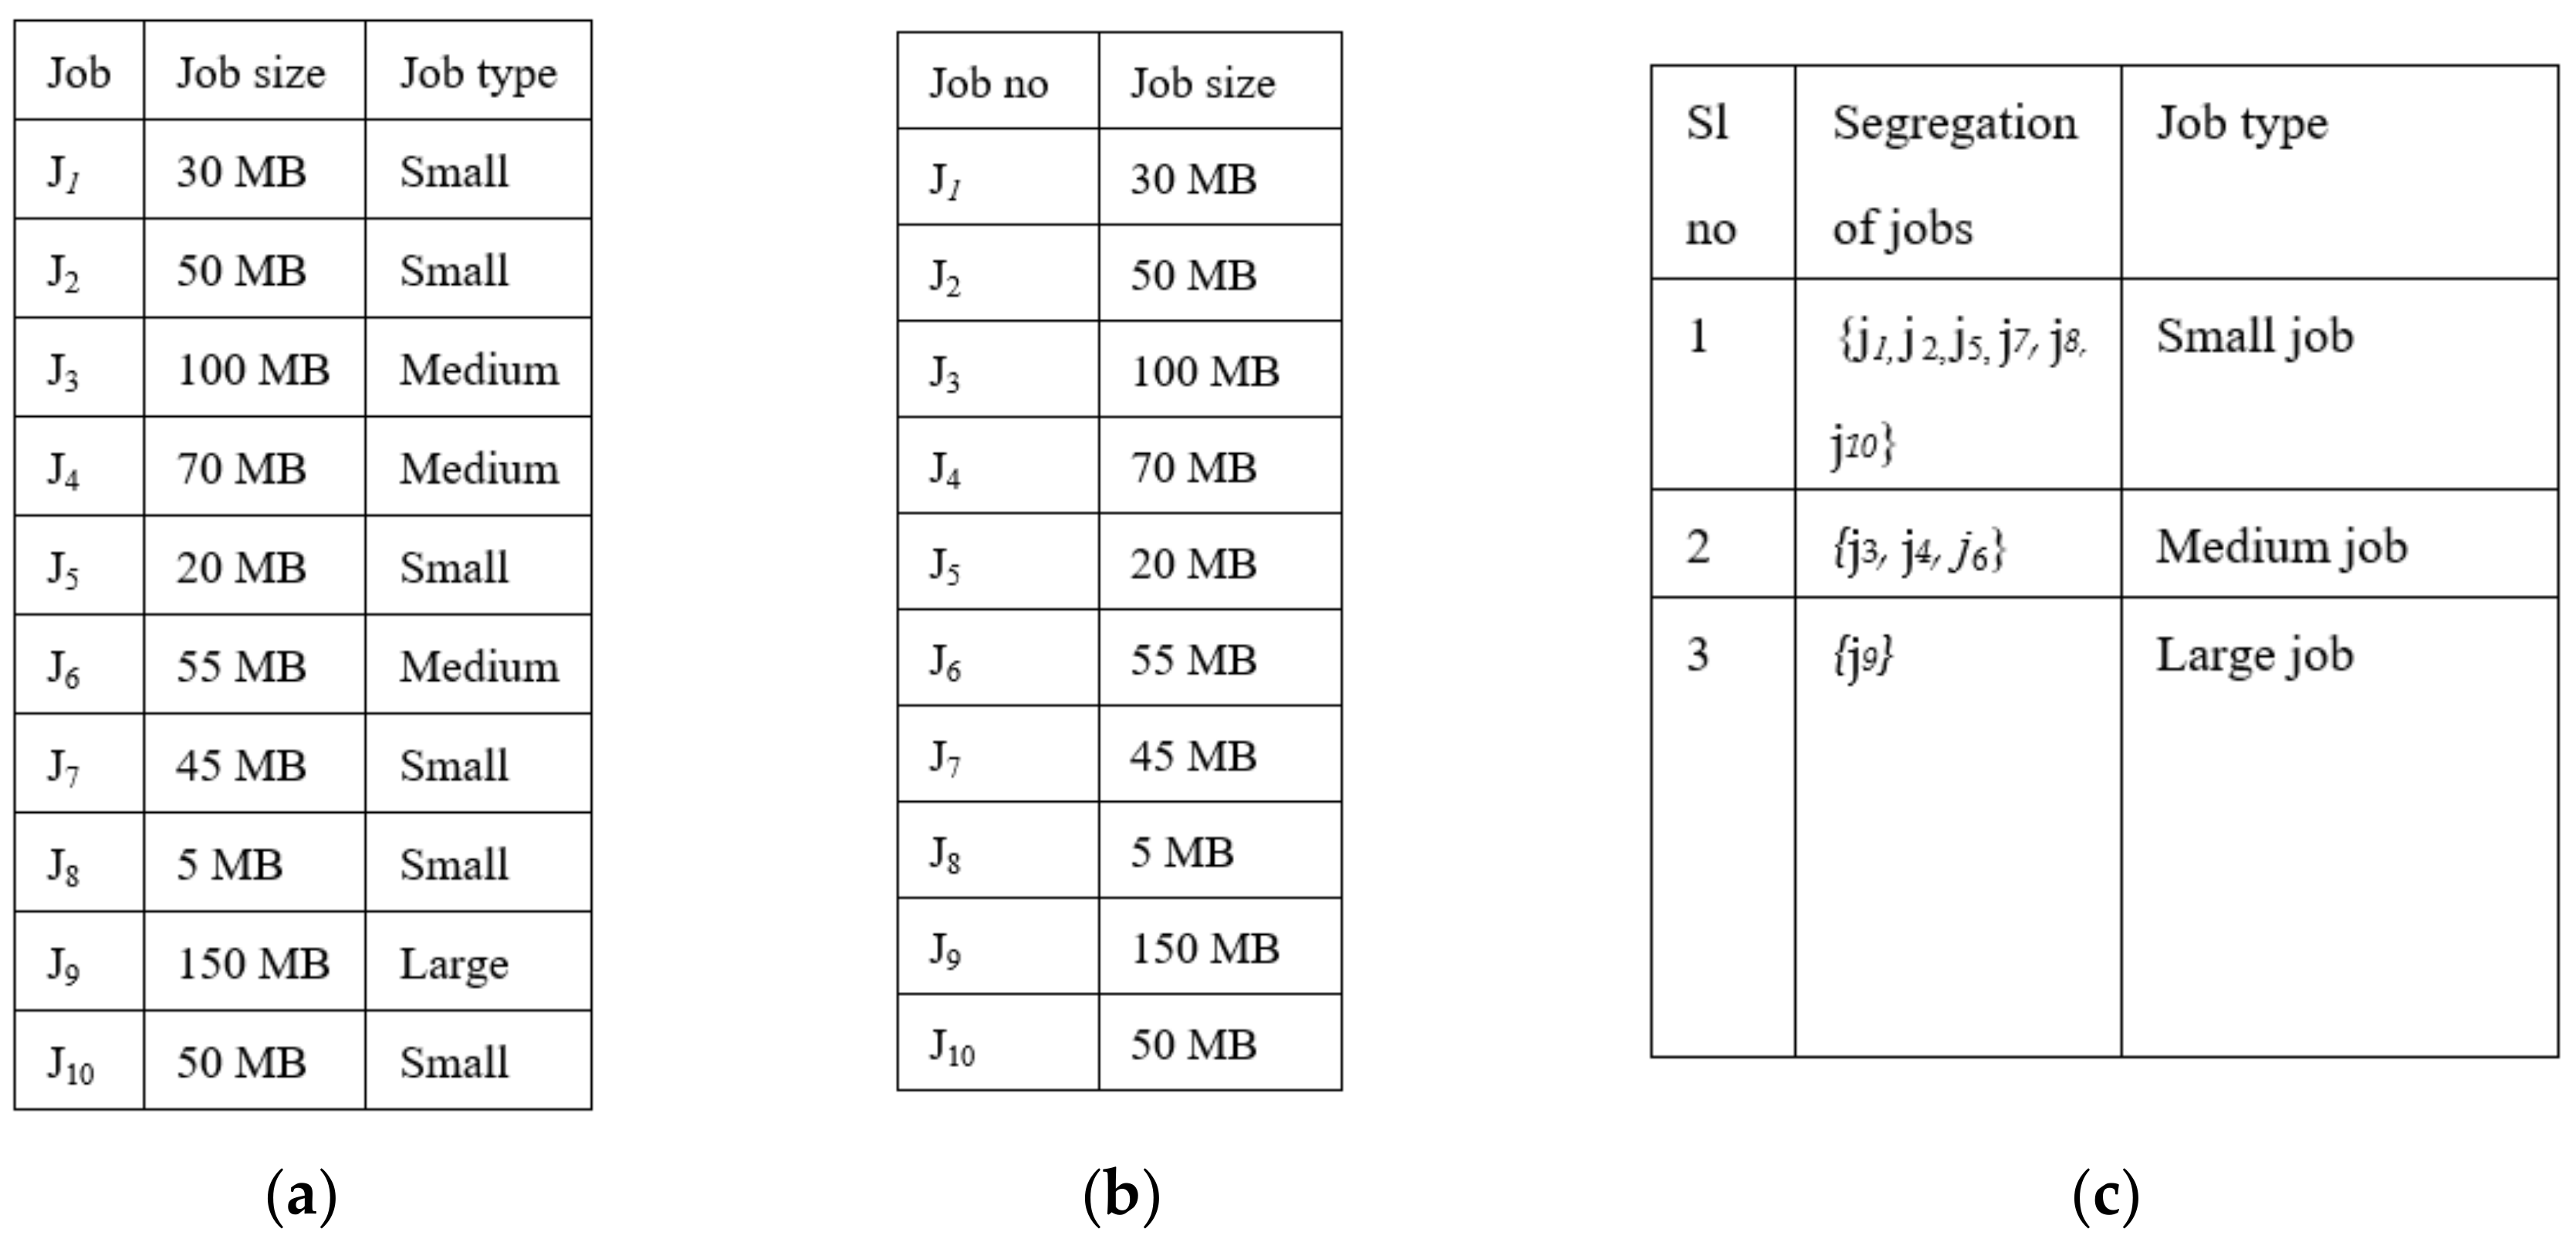
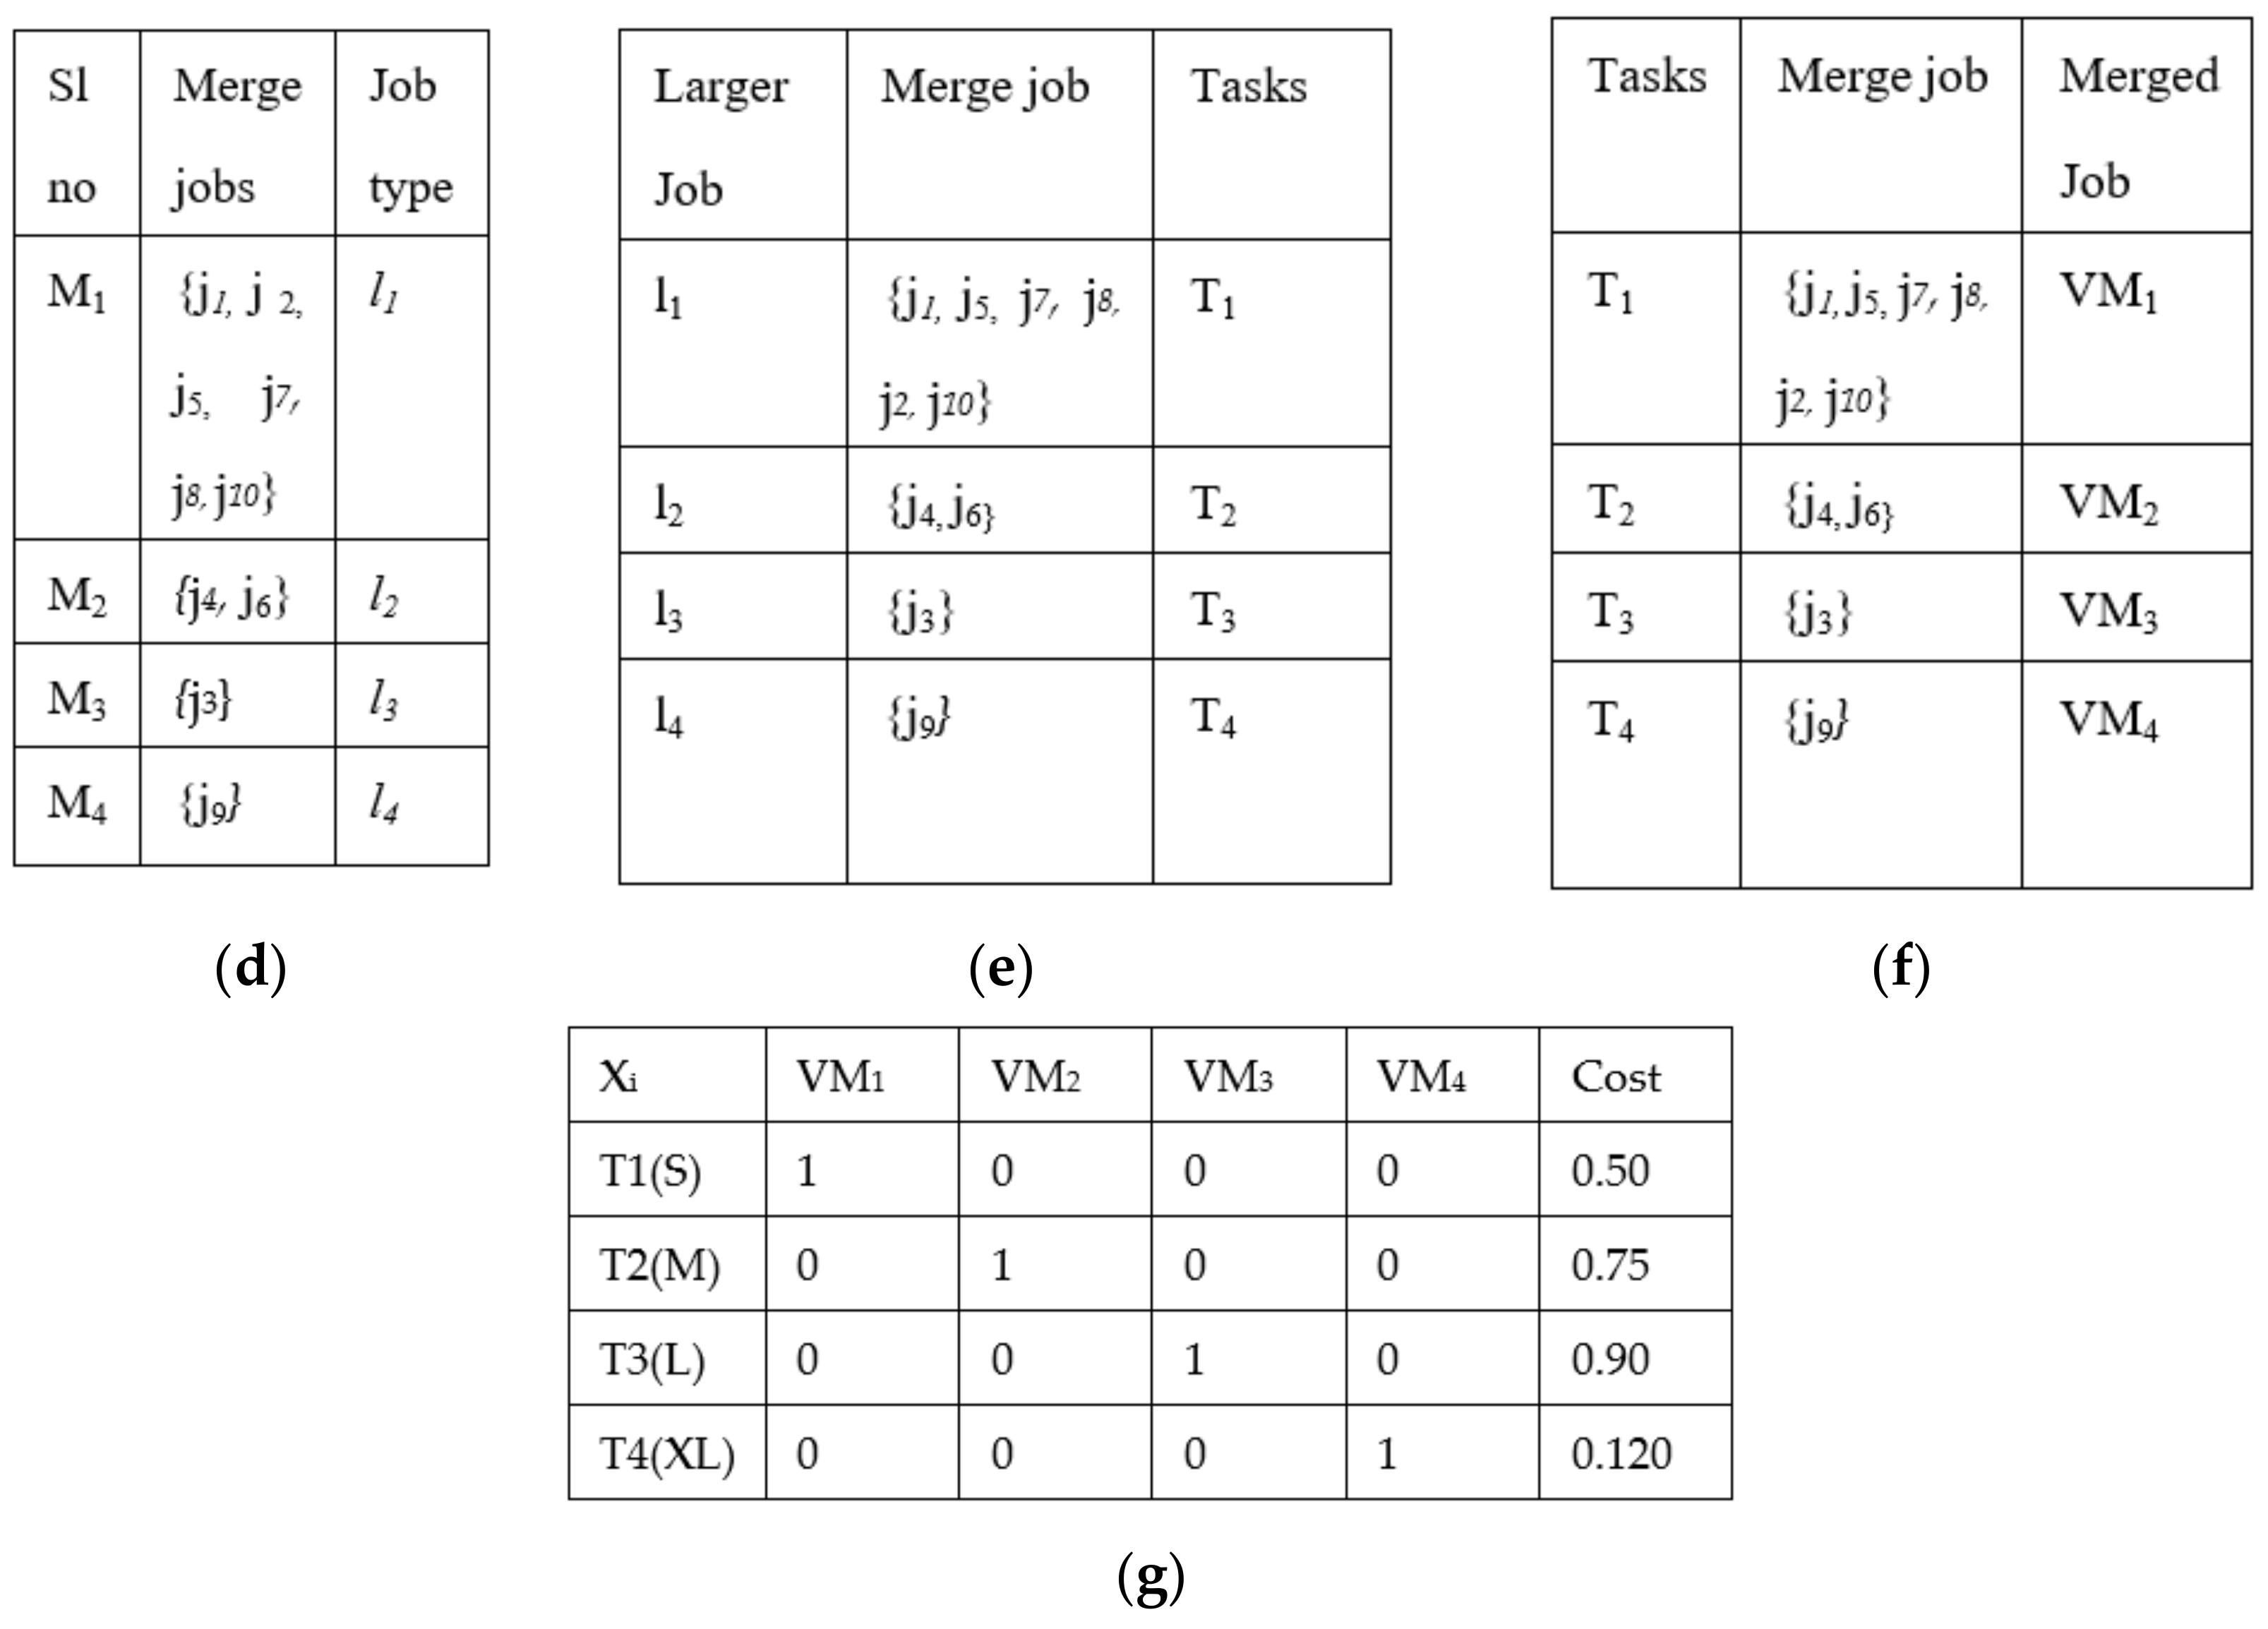
Example:Figure 3 shows the complete structure of the classification and merging process. It considers 10 jobs submitted by the user to a classifier as {
j1,
j2,
j3,
j4,
j5,
j6,
j7,
j8,
j9,
j10}, as shown in
Figure 3a
. The classifier results in classifying the job as small, medium, large, or extra-large based on threshold value ‘
p’, where ‘
p’ is set to 50 MB job size, as shown in
Figure 3b. Results of the classifier are given as input to the merger, and it first segregates the jobs based on job type, as shown in
Figure 3c. Then, it starts merging one by one until it becomes one
larger_job, as shown in
Figure 3d. Each
larger_job is profiled and analyzed to obtain a set of requirements such as CPU Cycles usage, Memory, Bandwidth, Start-time, and End-time and is submitted to a mapper. The mapper interacts with the local scheduler and gives information such as CPU, free time slots, and the expected amount of resources to be utilized. Then, all
larger_jobs along with their information are given to the cloudlet, and the cloudlet converts jobs into tasks, as shown in
Figure 3e; these tasks are submitted to the broker to be assigned to virtual machines with all the requirements for execution, as shown in
Figure 3f.
From Equation (9), we can expand it, as shown below:
The cost of the jobs is considered from Amazon Web Services EC2 (AWS), the total number of jobs are 10, and for each VM, the cost in AWS is 0.50, 0.75, 0.90, and 0.120 (USD) based on the size of the job being small, medium, large, and extra-large, respectively, as shown in
Figure 3g. The cost for each VM creation is USD 0.10 in AWS. As based on the classified and merging results shown in
Figure 3f, only four VMs are created, so the cost is only calculated for the number of VMs created. This optimizes the brokerage cost for VM creation. The CMRBC model reduced the brokerage cost to 60% of the actual price for a lesser number of VM creations. The total overall cost is USD 0.335 to execute 10 jobs, USD 0.40 is the cost of the creation of VMs for four larger_jobs instead of USD 0.100 for 10 jobs, and resource utilization is maximized to 80%.
Time Complexity:
For every job, the CMRBC algorithm is applied and executed by using the classifier and merger function to obtain one larger_job. The time taken for the execution is determined as follows.
Let n be the number of Smaller_Jobs present in the larger_job. Let t be the time taken to compute the brokerage and v the time taken to create and destroy the VM. The time complexity function for computing brokerage and the time taken for the creation and destruction of the VM for n jobs is given by the expression T(n) = n × t × v. Therefore, the time complexity is of the order O(n).
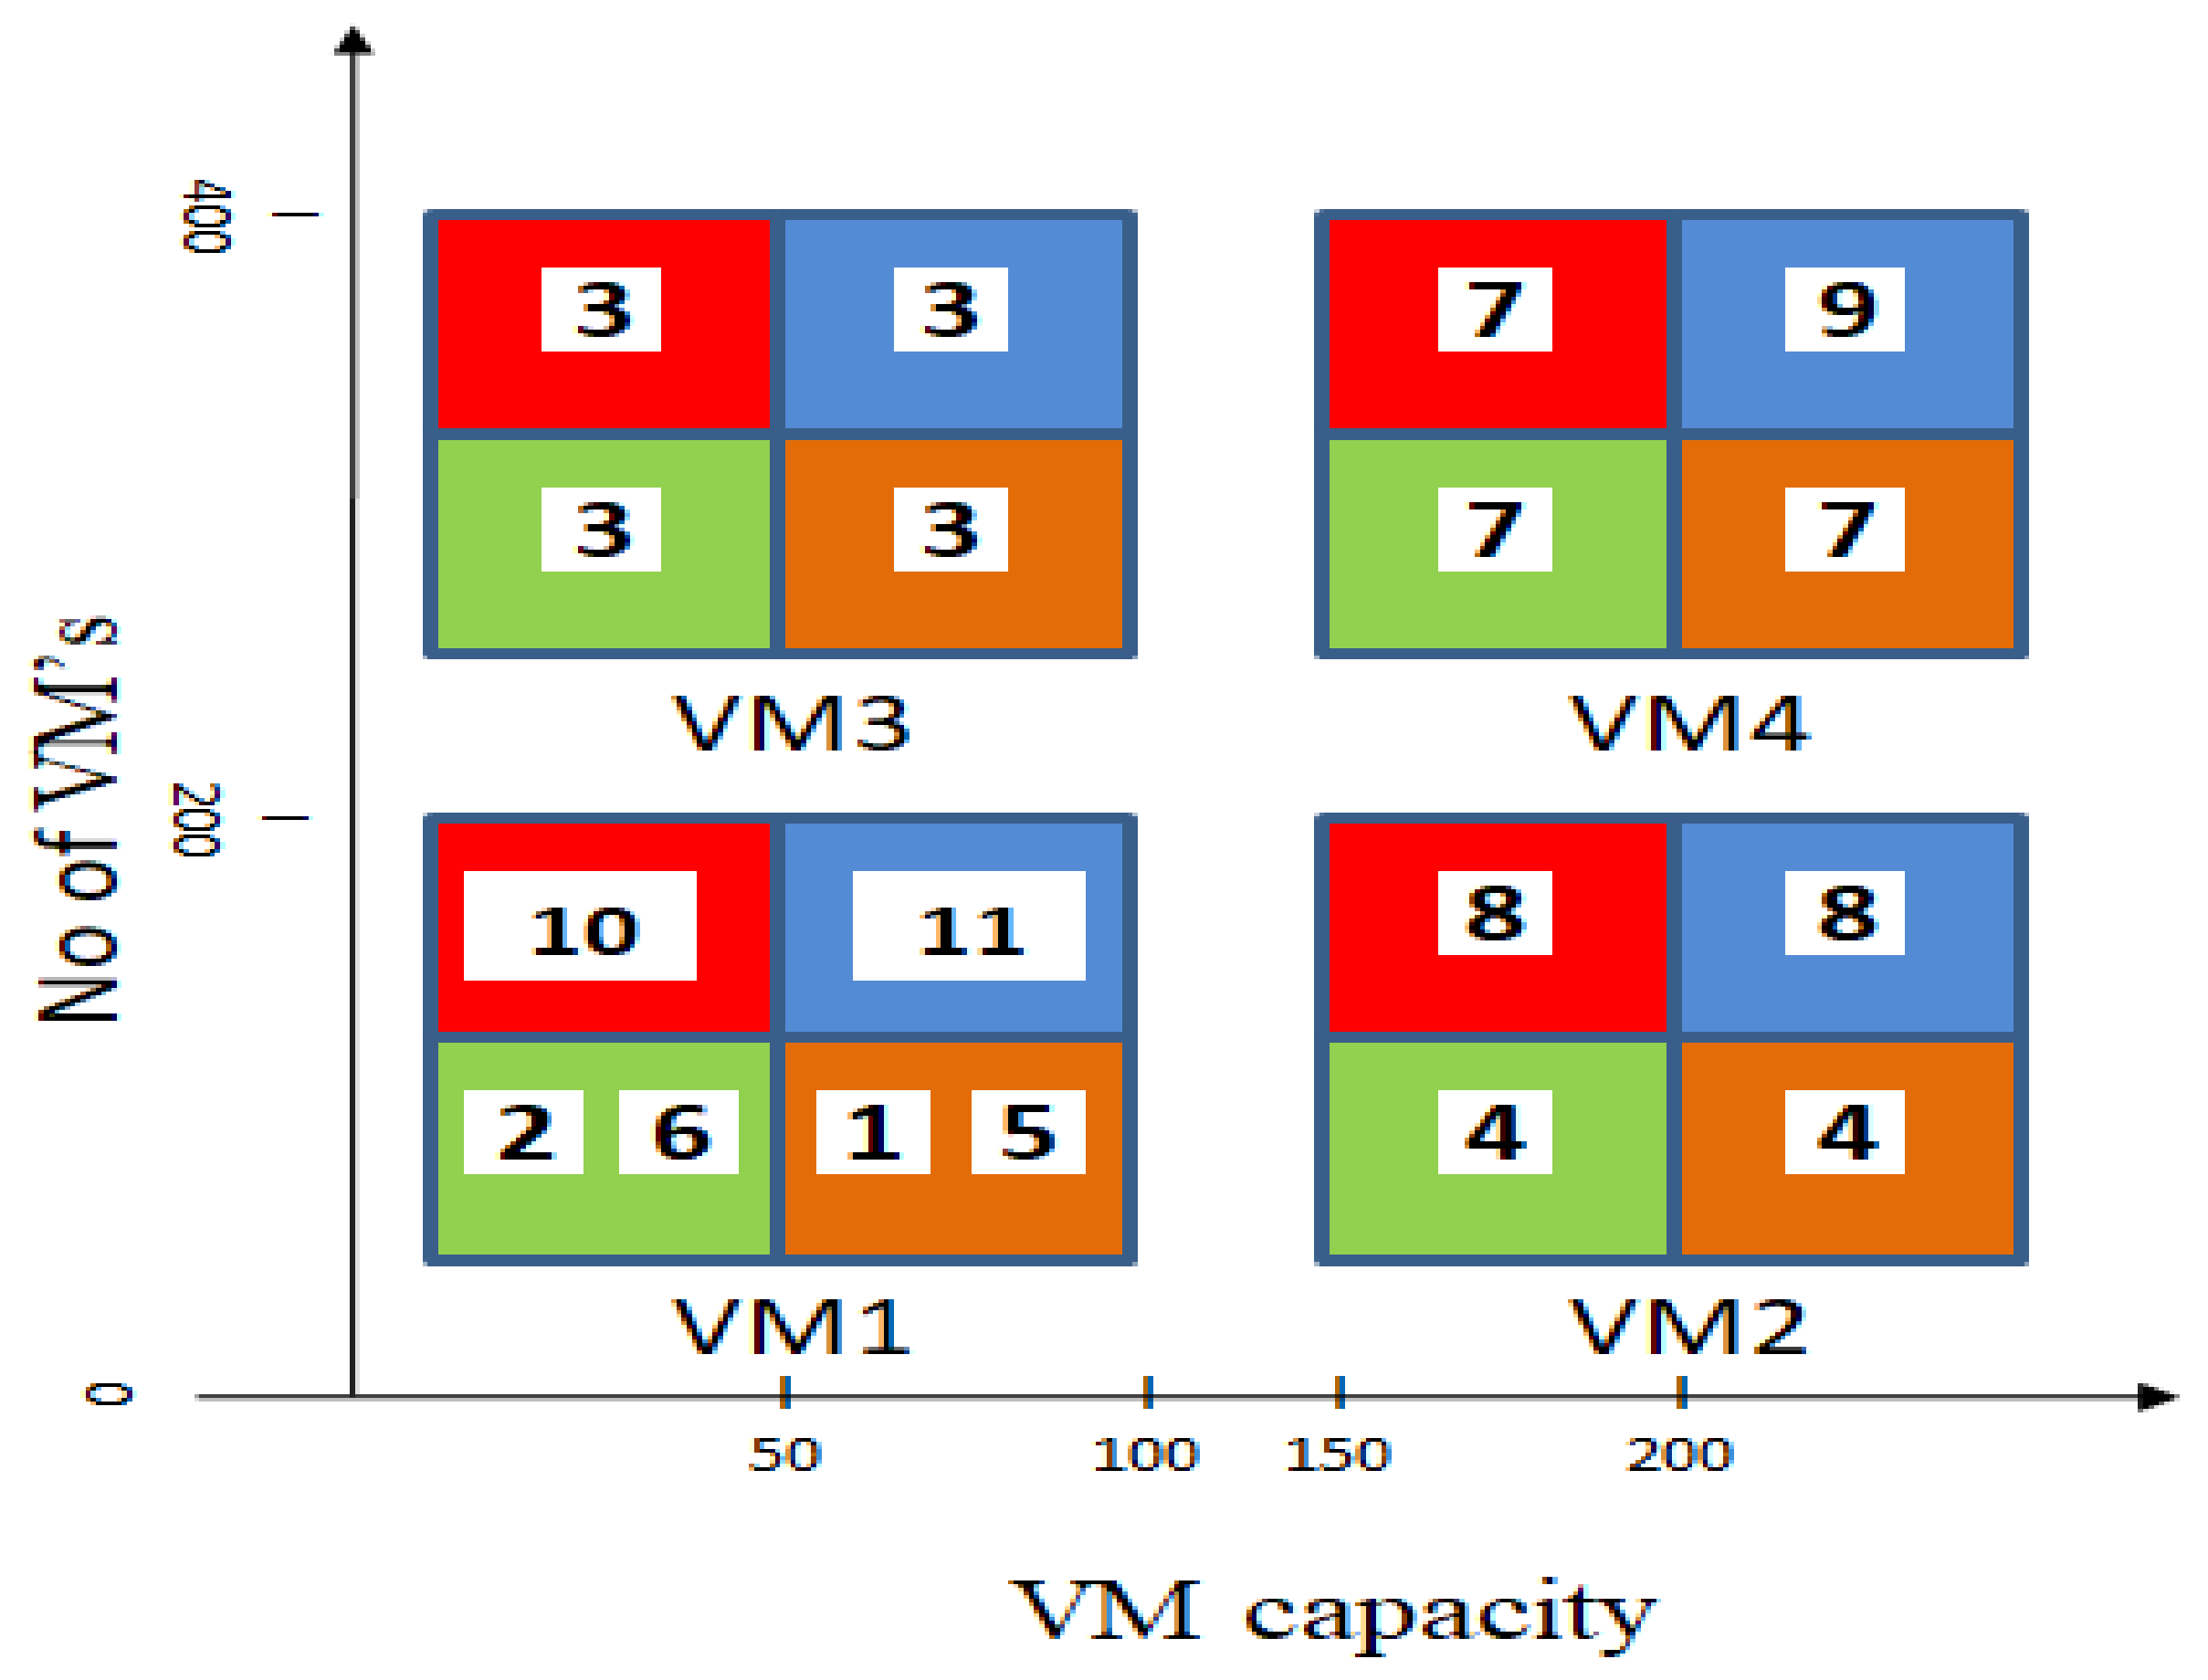
Model Evaluation Based on the Scenario
In this subsection, we discuss a model with an example by considering 500 jobs, 500 virtual machines, and 200 data centers in four different scenarios to evaluate the efficacy of the proposed model and compare the utilization of resources with virtual machines. The configuration of a VM involves CPU cycles (HZ), Memory (MB), and Bandwidth (BPS or MBPS) (CPU executes one or more instruction per clock cycle).
Scenario 1: The number of jobs is more than virtual machines.
If the job arrival rate is higher than the virtual machine creation rate, the utilization of resources leads to the scarcity of virtual machines. As a result, the execution of jobs is delayed, and the error rate is increased. For example, for 500 jobs and 200 VMs, merging takes place with some type of job to reduce the number of VMs. When there are fewer VMs, the time required to execute each job is more, which eventually leads to starvations.
Scenario 2: The rate of the arrival of the same type of job is lower than the number of virtual machines.
If the same type of job does not arrive with the expected timestamp, then each job needs to be executed on a single virtual machine. This leads to expensive brokerage, and it is very time consuming to create and destroy virtual machines, meaning charges are high. For example, if there are 100 jobs and 100 VMs, if no jobs arrive as small jobs out of 100 jobs, one job is assigned to one virtual machine, which leads to higher costs.
Scenario 3: There are fewer jobs than virtual machines.
If the number of small jobs is less than the number of VMs, then VMs remain idle, waiting for jobs. This leads to the underutilization of resources. Then, merging those small jobs still reduces the creation of VMs. For example, if there are 10 small jobs and there are 50 VM, and out of 50 VMs, only 10 are utilized, and 40 VMs remain idle.
Scenario 4: When we merge the number of jobs into one job, if any job in the merged jobs fails to be executed due to some reason, the remaining merged jobs cannot be executed. This leads to the incomplete execution of jobs and also affects the other jobs. For example, J1 and J5 are merged, and if J1 is not executed due to some problem, then J5 cannot be executed, even though it is possible to execute it.
6. Performance Evaluation
The performance of CMRBC is evaluated based on parameters such as the number of servers, resource cost, response time, and resource utilization.
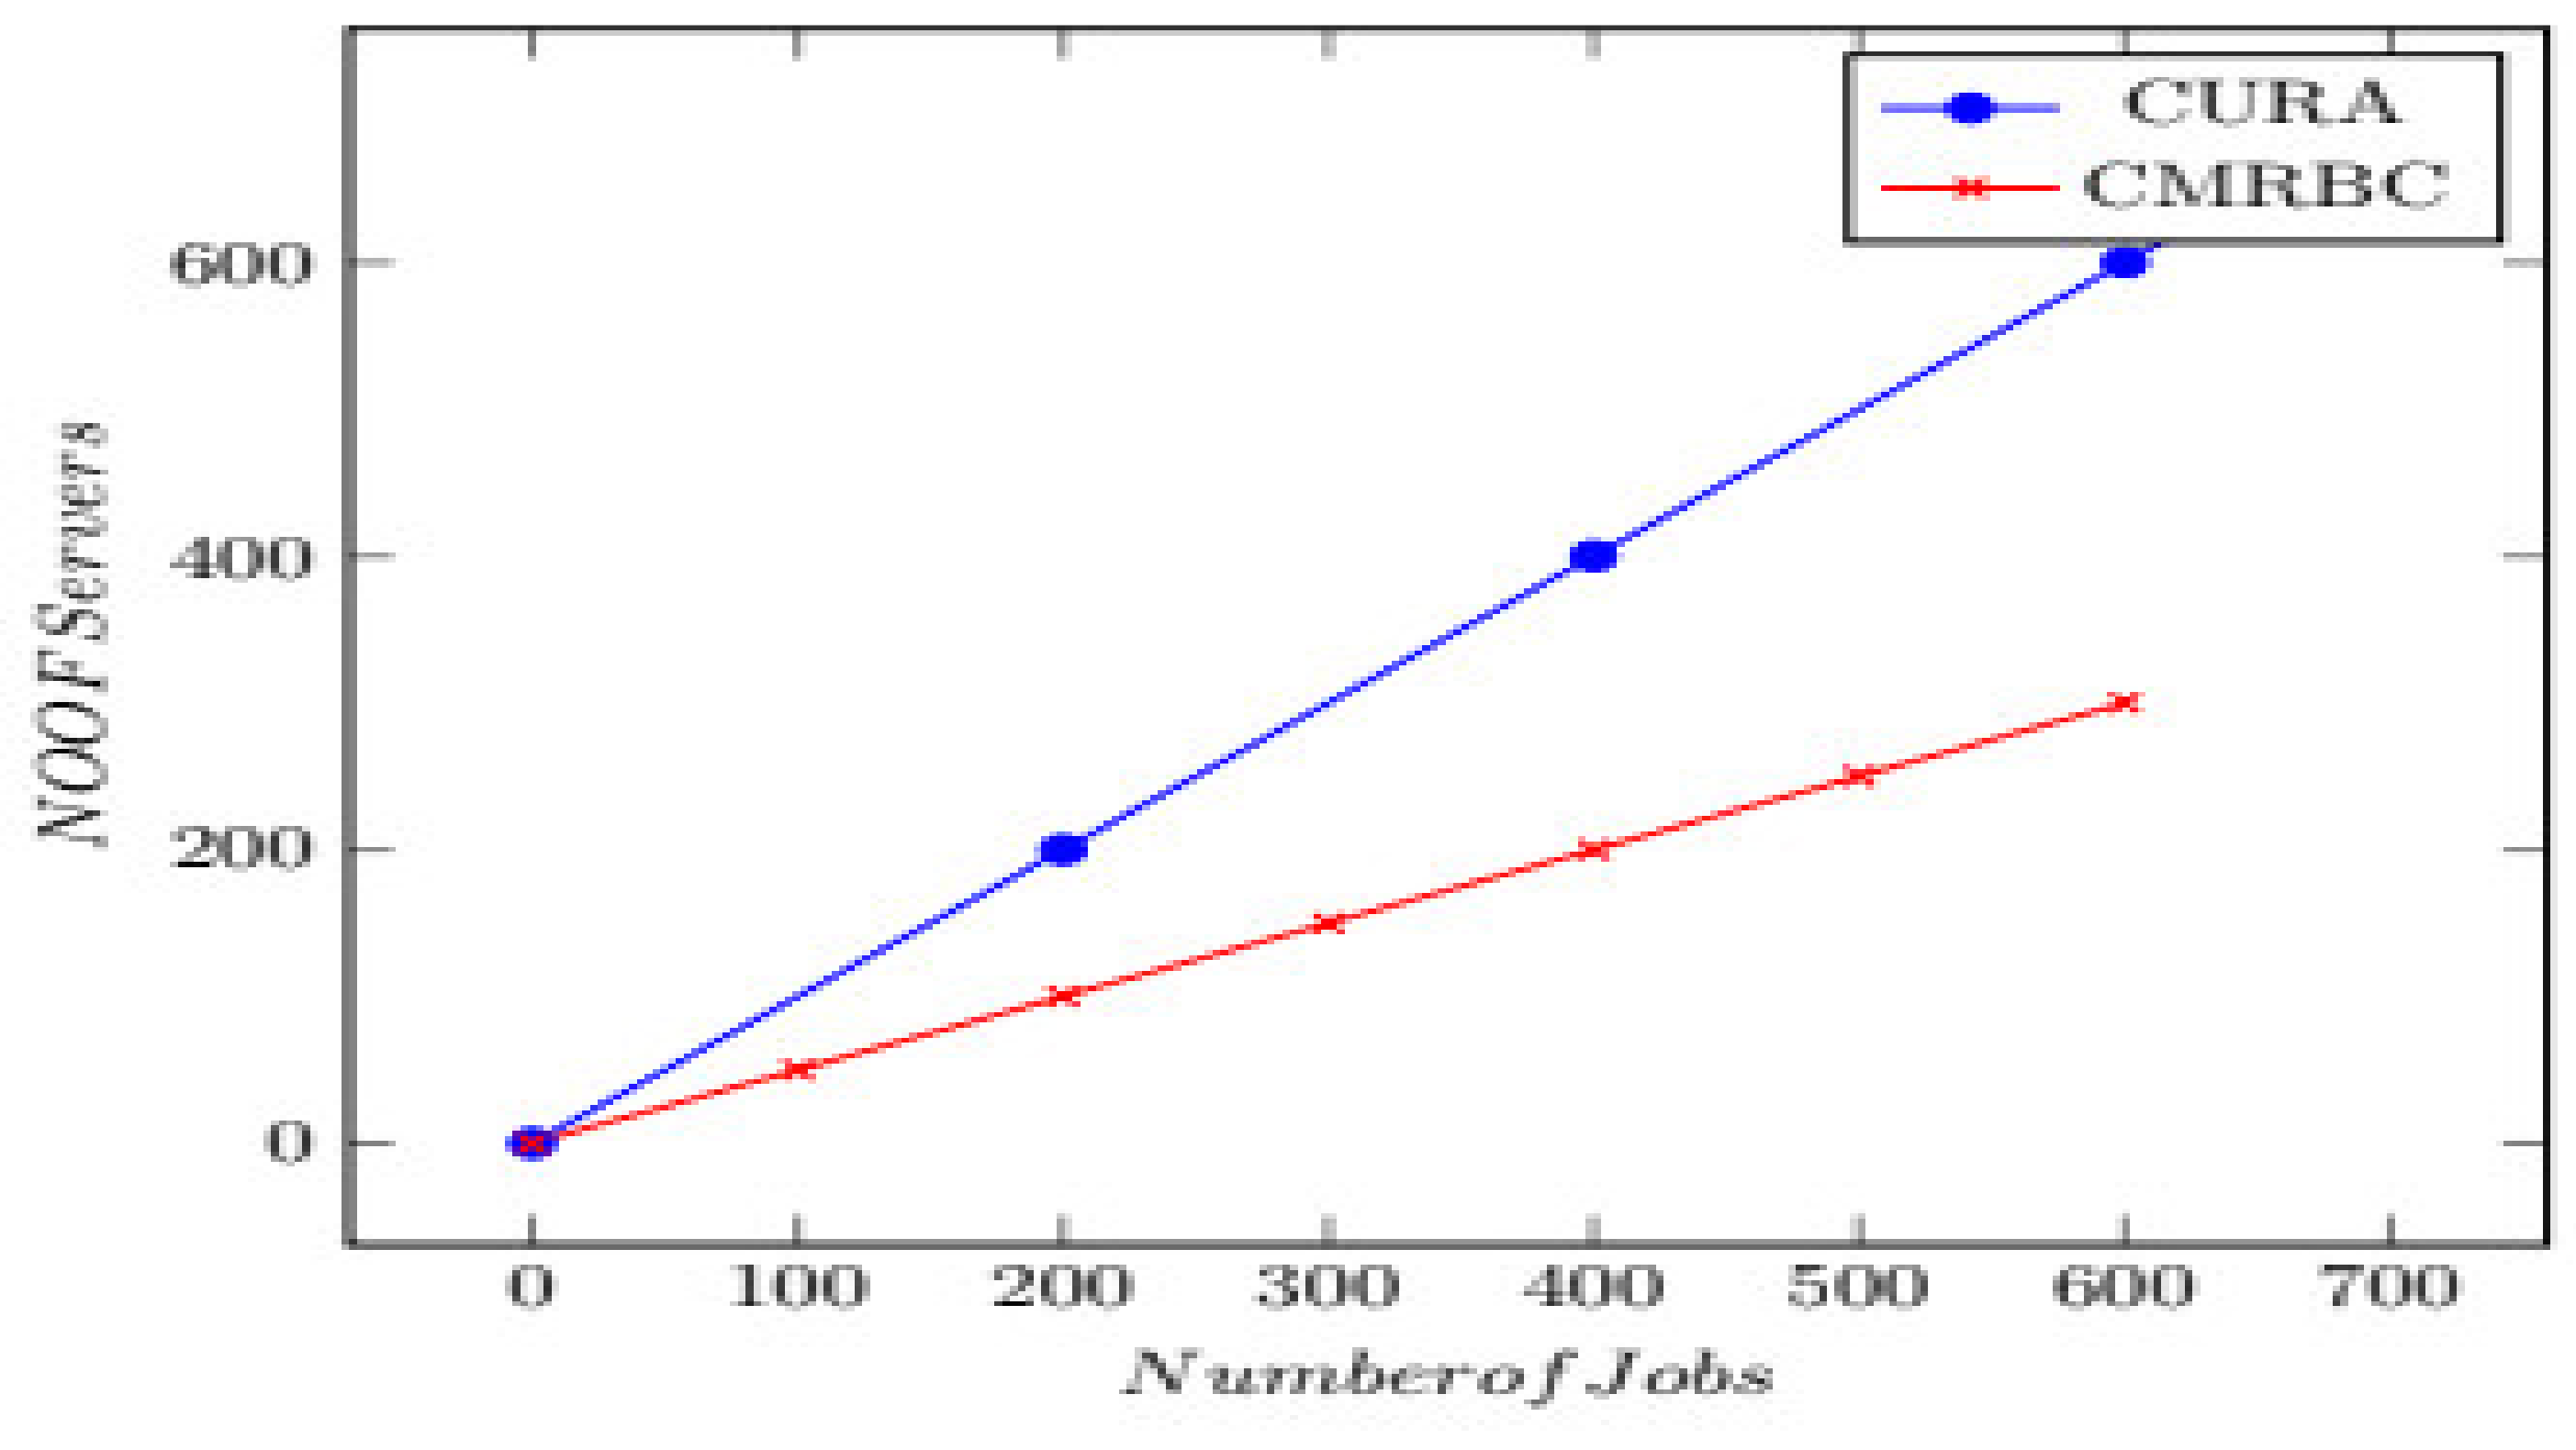
Several servers: Servers are super-computers that are equipped with programs or hardware of specified configuration which meet certain prerequisites to enable the server to offer services to the computers on its network. Methods that require a relatively lower number of VMs to successfully meet the service quality requirements are not cost-effective. The capital cost is high if a greater number of VMs are used. To overcome this,
Table 4 demonstrates the minimum number of servers required to execute the job in the CMRBC model compared to the previously used model, which utilizes a classification and merging technique.
Response Time: Response time is the total amount of time it takes to respond to a request for service, and it is a sum of service time and waiting time. Systems that have higher response times give poor service quality.
Table 4 and
Figure 5 demonstrate that the time required to execute a job is less in CMRBC compared to CURA.
Resource Cost: Resource cost is worked out based on the number of tasks and the number of VMs. In the CURA model, for every 10 tasks, an equal number of VMs are required, and for the CMRBC model, for the same number of tasks, half of the number of VMs are required, i.e., 5 VMs for 10 tasks are required, as shown in
Figure 5 and
Table 4.
Effective Utilization: Here, the effect of distinctive and decided-upon distributions of the deadline for the execution of CMRBC for various values is considered. It was found that both Poisson and uniform distribution require a comparatively fewer number of servers through exponential distribution. This requires 30 percent more servers, as there are more jobs with shorter deadlines in the exponential distribution.
Table 4 shows the comparison results of the CURA and CMRBC models with parameters of cost, time, brokerage, RAM speed, and bandwidth.
Considering the cost execution of various classification and merging methodologies, as shown in
Figure 4, when requests fluctuate from clients without stable requests, this bends the cost contrast between the online calculations and Heuristic methods. In CMRBC, it is more noticeable when clients have stable requests, but it is difficult to precisely assess their future requests.
The experiments evaluated the performance of the techniques for various job sizes based on the quantum of data input. Small jobs process 50 MB of text data, medium jobs process 100 MB, and large and extra-large jobs process 150 and more than 200 GB, respectively. In addition, small, medium, and large jobs have a mean deadline of 50 s, and extra-large jobs have a mean deadline of 180 s, as it takes a bit more running time. It is seen that the performance, in terms of the number of servers required for processing a job under CMRBC, is much lower than the CURA model, as shown in
Figure 5.
Improvements were made at a 1:4 ratio for the smaller jobs. A sincere attempt was made to prove that smaller jobs can be executed with minimum time consumption. Hence, it was proved that the CMRBC model requires significantly fewer resources even with peak work-load utilization, as the CURA model demands more resources. The CMRBC model consumes fewer resources, and the output would be at a much more optimal speed, with less consumption of time, and without any hindrance whatsoever. Further, this model will not create virtual machines (thereby reducing their usage) for every small job, because classification and merging techniques are used.
- 2.
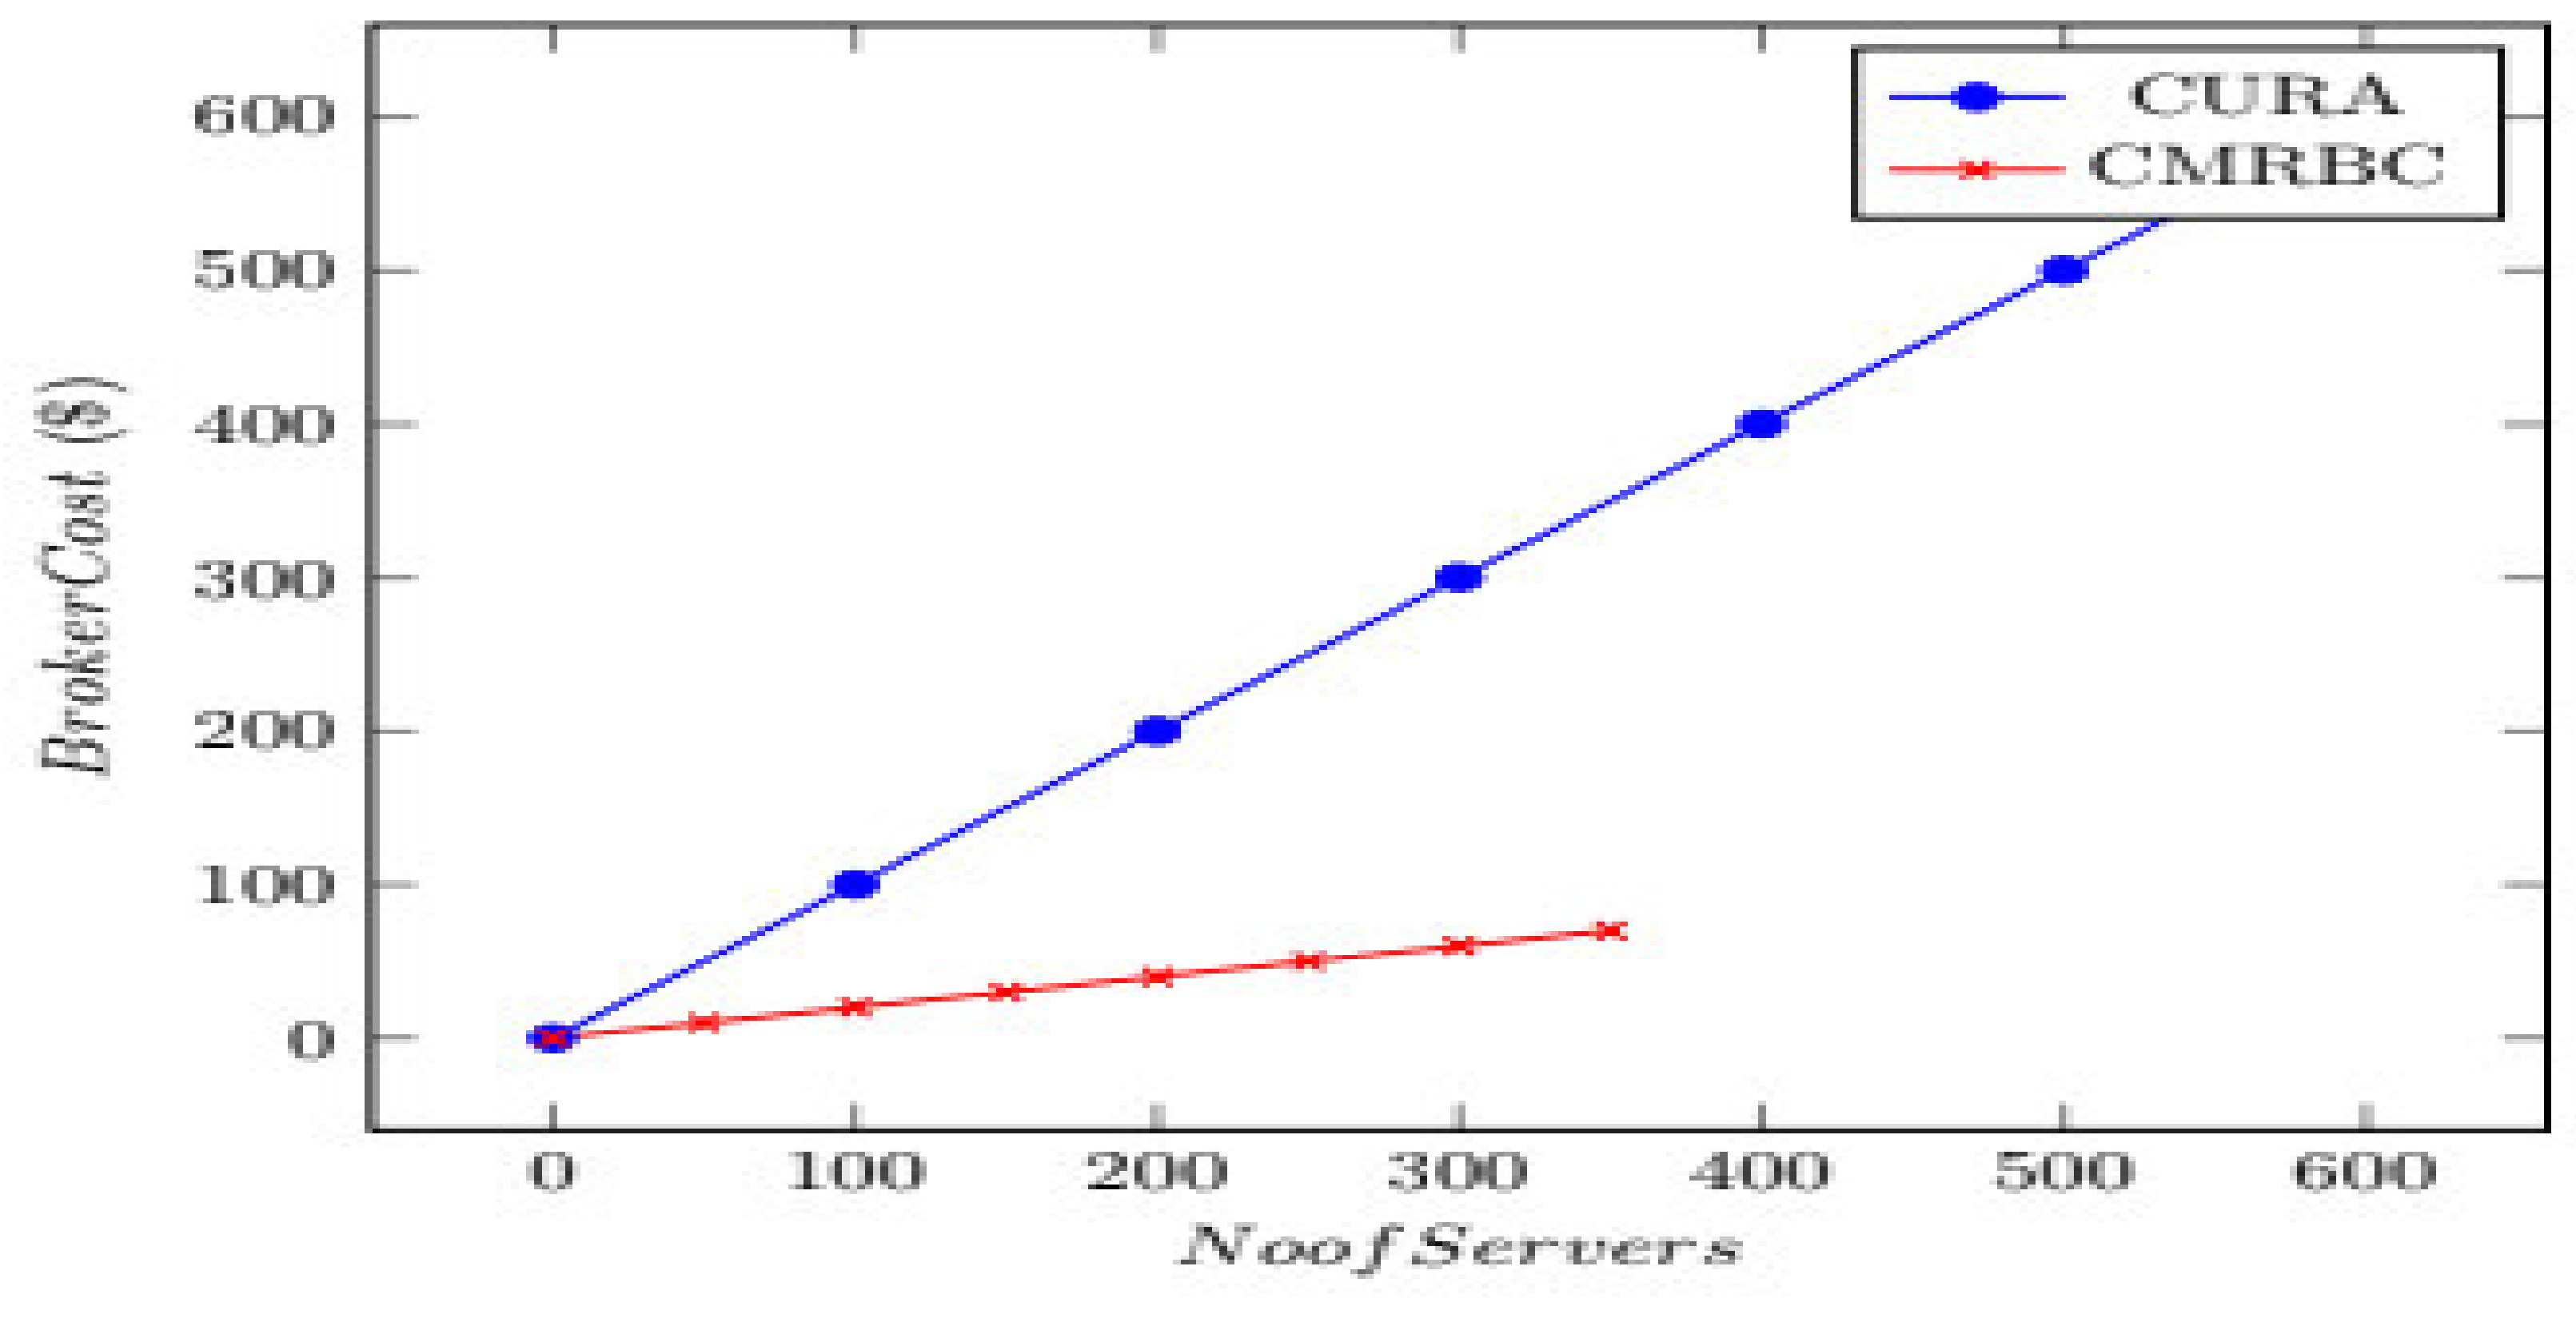
Number of Servers Versus Broker Cost
The comparison between the CURA and CMRBC models is shown in
Figure 6. The
x-axis represents the number of servers, and the
y-axis represents broker cost.
In CURA, to execute each job, one virtual machine is created. The user has to bear the cost for both the creation and termination of the VM, and thus, the cost is on the higher side, and so is the brokerage. In the CMRBC model, for every four jobs, one VM is created, which would automatically reduce the cost of their creation and termination. Hence, the creation ratio is 4, which is towards the cost of VMs. In CURA, four VMs have to be created, ultimately making users pay higher costs. However, in CMRBC, only a one-time cost is levied on the user, thereby reducing the cost to be borne, which amounts to a 4:1 ratio between CURA and CMRBC.
- 3.
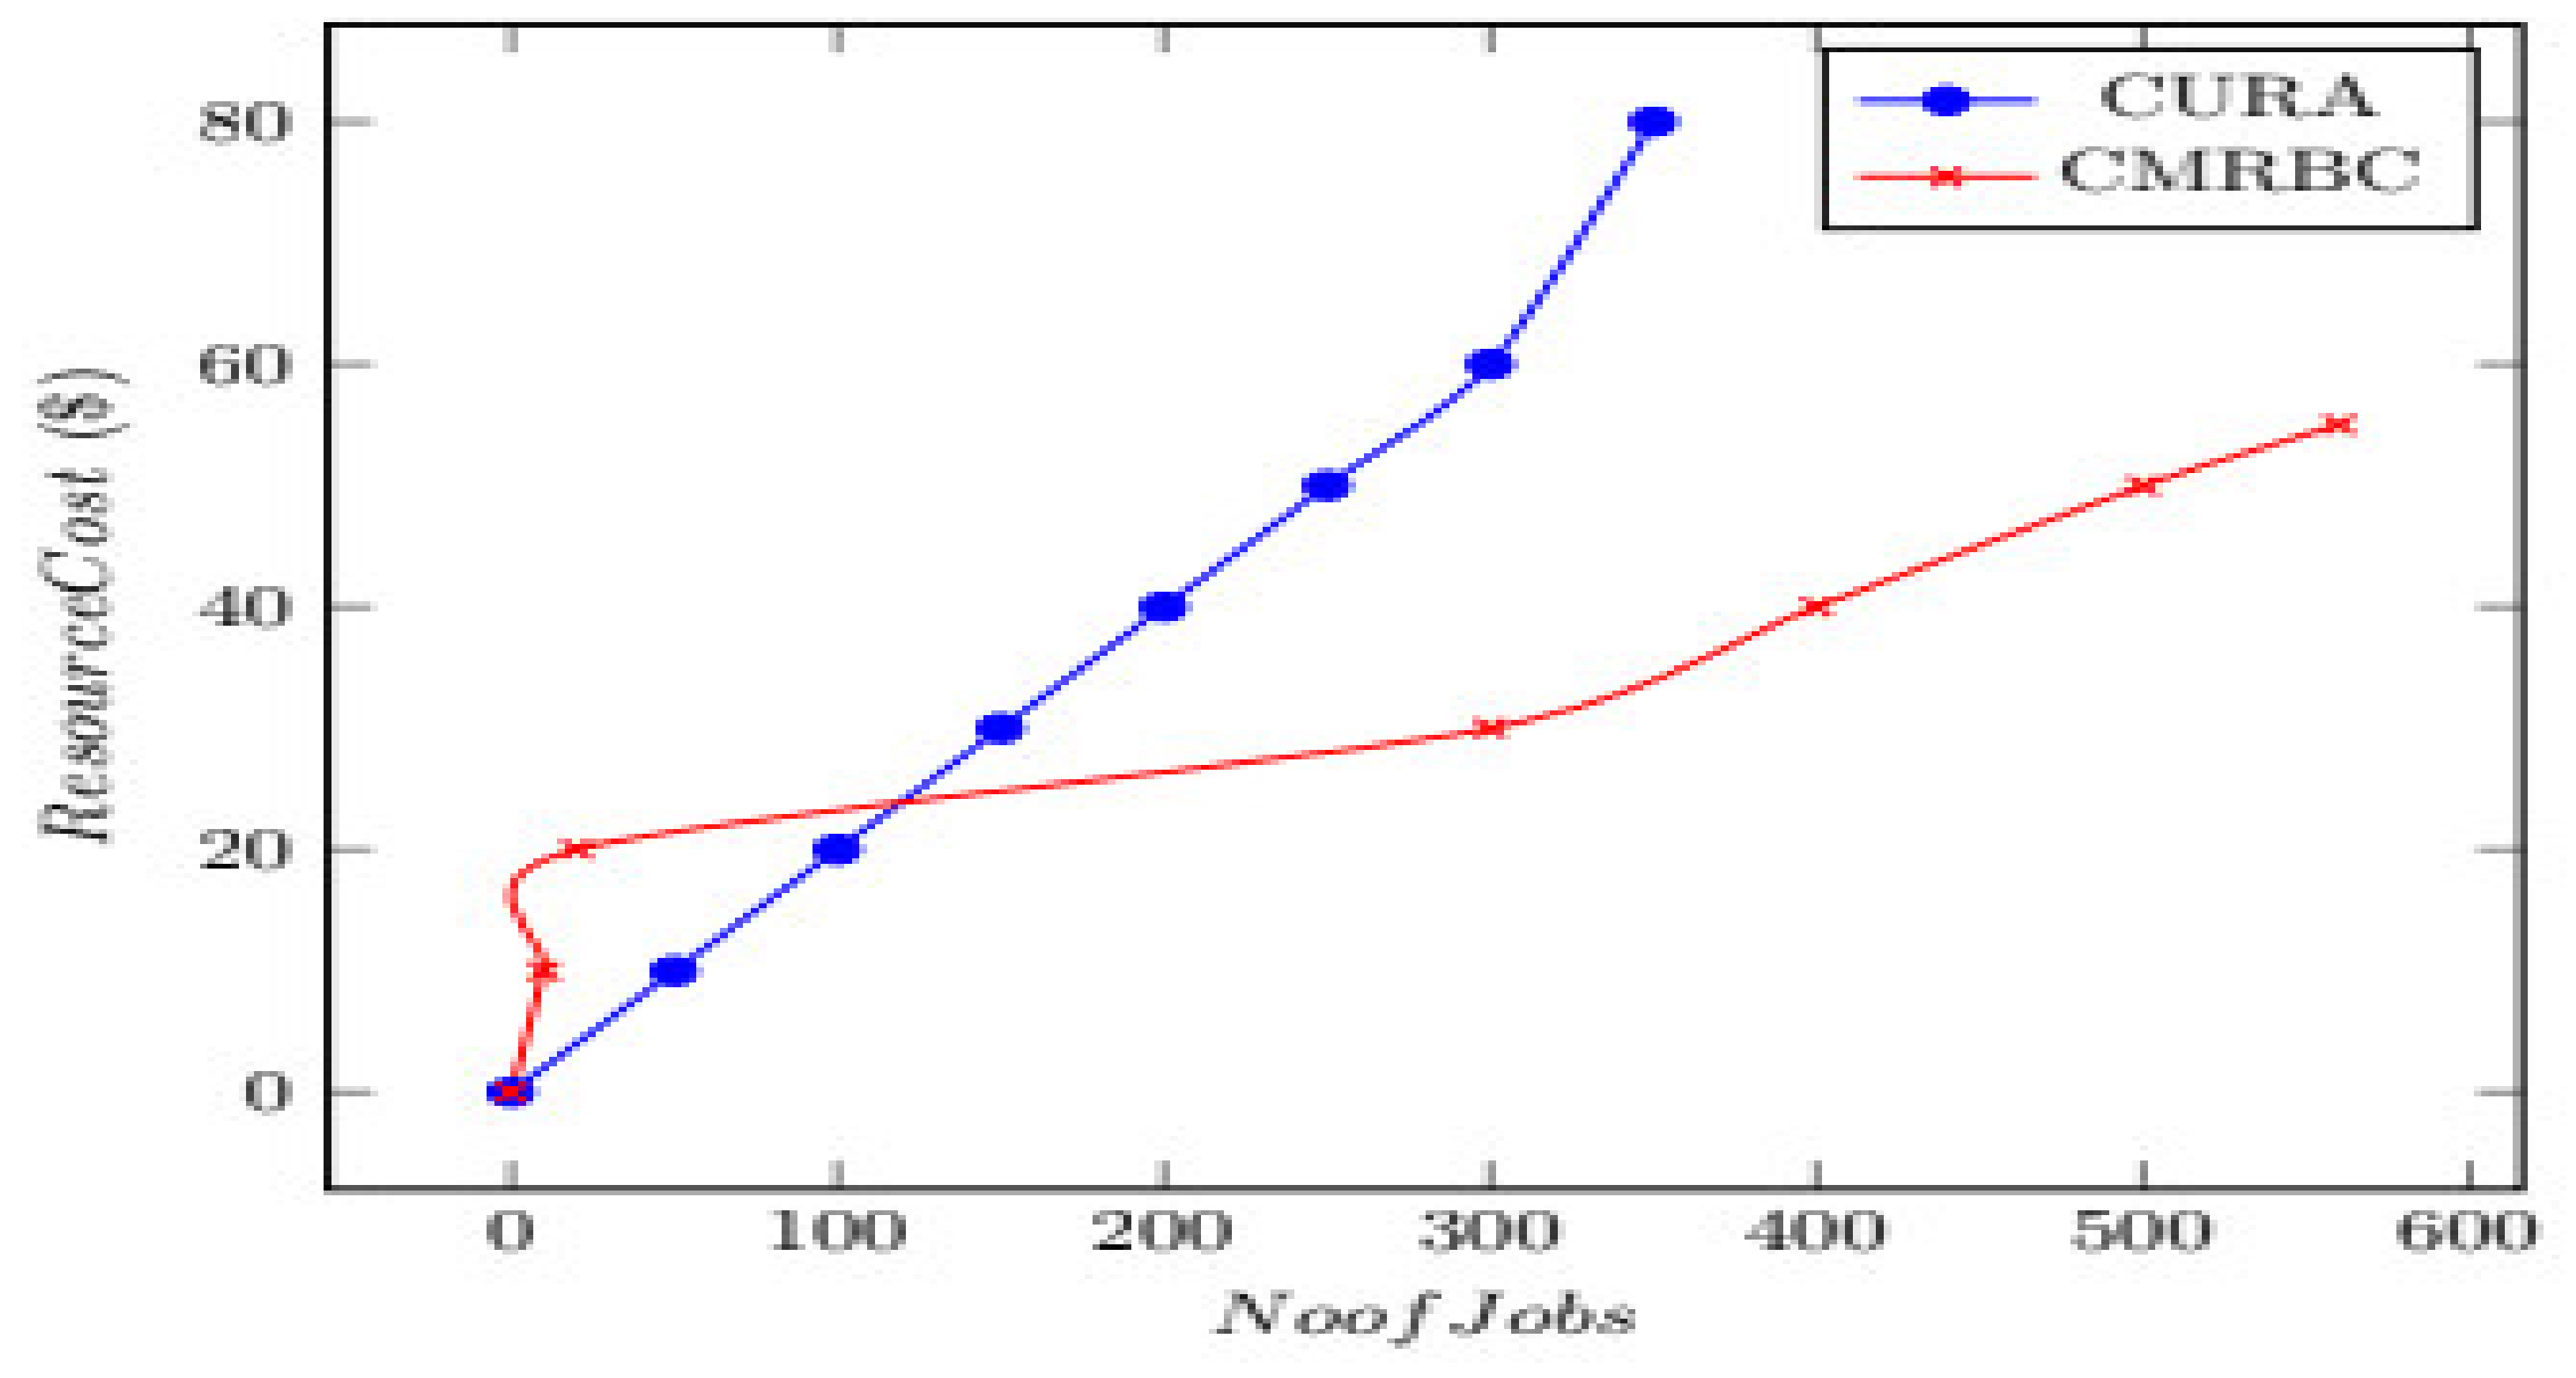
Number of Jobs Versus Resource Cost
In
Figure 7, the cost and number of jobs are dealt with. The
x-axis represents jobs, and the
y-axis represents resource costs. Here, it is shown how the cost would be reduced by three-fourths.
Figure 7 indicates the overall cost involved in executing a bunch of jobs. The CURA model shows a 65% higher cost than the actual cost incurred by a user under the CMRBC model. This is because of the usage of a lower number of VMs.
- 4.
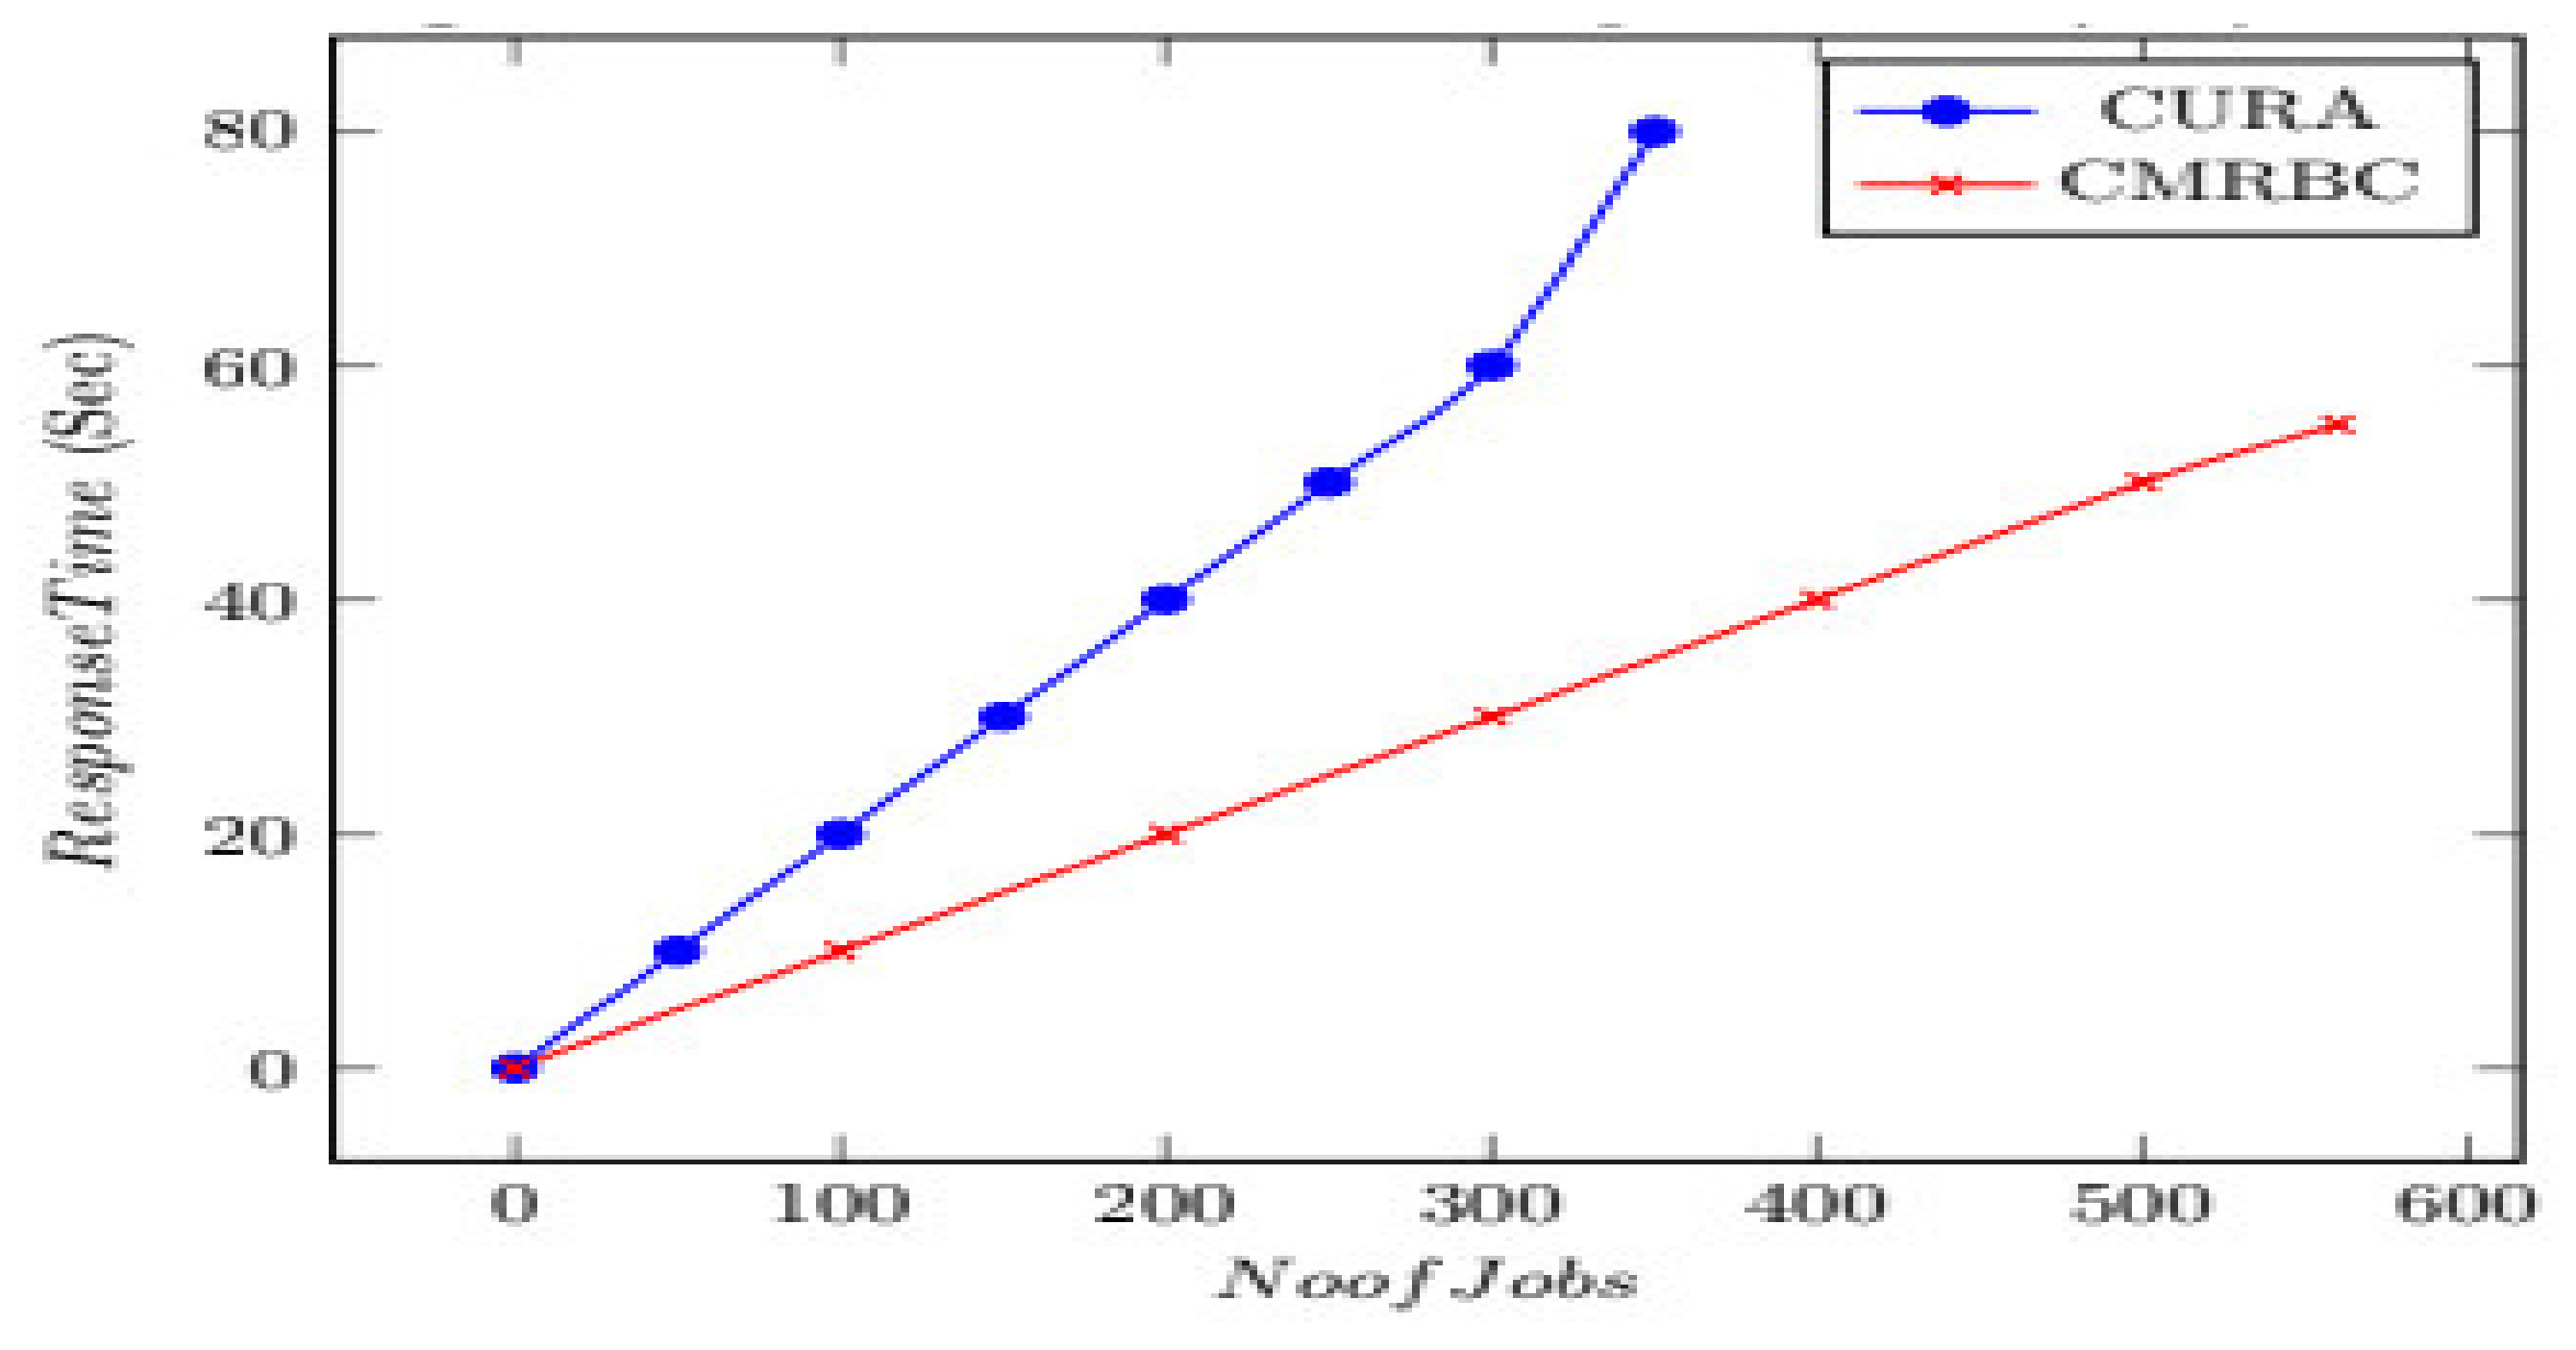
Number of Jobs Versus Response Time
In
Figure 8, emphasis is laid upon the time consumed for completing jobs, and response time is taken into account. The
x-axis represents the number of jobs, and the
y-axis represents response time.
A comparison between the CURA model and the CMRBC model is shown. The time consumed for the creation of VMs in the CURA model is double when compared to the CMRBC model. This is due to the creation of fewer VMs. This also automatically reduces the time taken.


 ,
, 


