Article

A Hybrid Optimization Framework with Dynamic Transition Scheme for Large-Scale Portfolio Management

Department of Electrical and Electronic Engineering, The University of Hong Kong, Hong Kong SAR 999077, China
*
Author to whom correspondence should be addressed.
Algorithms 2022, 15(11), 404; https://doi.org/10.3390/a15110404
Submission received: 26 September 2022 / Revised: 26 October 2022 / Accepted: 30 October 2022 / Published: 31 October 2022
(This article belongs to the Special Issue Metaheuristics)

Abstract

:
Meta-heuristic algorithms have successfully solved many real-world problems in recent years. Inspired by different natural phenomena, the algorithms with special search mechanisms can be good at tackling certain problems. However, they may fail to solve other problems. Among the various approaches, hybridizing meta-heuristic algorithms may possibly help to enrich their search behaviors while promoting the search adaptability. Accordingly, an efficient hybrid population-based optimization framework, namely the HYPO, is proposed in this study in which two meta-heuristic algorithms with different search ideas are connected by a dynamic contribution-based state transition scheme. Specifically, the dynamic transition scheme determines the directions of information transitions after considering the current contribution and system state at each iteration so that useful information can be shared and learnt between the concerned meta-heuristic algorithms throughout the search process. To carefully examine the effectiveness of the dynamic transition scheme, the proposed HYPO framework is compared against various well-known meta-heuristic algorithms on a set of large-scale benchmark functions and portfolio management problems of different scales in which the HYPO attains outstanding performances on the problems with complex features. Last but not least, the hybrid framework sheds lights on many possible directions for further improvements and investigations.

1. Introduction

Optimization problems are widespread in real-world applications like logistics [1], manufacturing [2], finance [3], and Medicine [4]. The problems are varied and strictly subject to specific constraints for satisfying production requirements. Even though the no-free lunch theorem [5] has clearly stated that there is no single method to handle all tasks, researchers dedicate to intelligent algorithms with wider applicability so that users can apply them to more general scenarios with few domain knowledge. As a problem-agnostic approach, meta-heuristic algorithms have demonstrated outstanding capabilities in tackling problems of tough features such as non-differentiable, non-convex or multi-modal. Especially in solving large-scale problems with numerous local minima, nature-inspired meta-heuristic methods can provide feasible solutions within a reasonable period of time whereas gradient-based methods and programming methods are infeasible on it due to intensive computations on the gradient or matrix of objective functions. In addition, the modularization design of meta-heuristic algorithms can flexibly switch the search behavior between exploration and exploitation to customize practical applications. Basically, meta-heuristic algorithms can be categorized into single individual-based approaches and population-based approaches. Single individual-based approaches conduct the search by keeping one candidate per iteration, which reduces the search efficiency and limits the information exchange among individuals. Therefore, more researchers have been attracted by population-based approaches in recent years. A population consisting of several individuals can be used to concurrently explore feasible solutions in promising regions. Meanwhile, the useful information is spread to all individuals of the population in which other individuals can learn from it. However, most population-based approaches depend on a single search manner with the same update mechanism during the whole search process, for which the diversity of search strategies is limited and may not adapt to more fields. To cooperate with multiple meta-heuristics, it cannot merely merge different algorithms without an effective cooperation mechanism. Thus, a carefully designed cooperative framework to integrate different meta-heuristics is critical to enhance the quality of solutions and speed up the convergence.
Computational finance [6,7] is a modern discipline that applies mathematical tools to optimize financial problems including stock price prediction [8], asset pricing [9], portfolio allocation [10] and risk measurement [11]. Among them, portfolio optimization is a fundamental financial problem, having been studied for few decades. Given a set of assets like stock, futures, and bond, investors allocate the initial capital to each asset of the portfolio for maximizing the returns and controlling the risk at a certain level. Modern Portfolio Theory (MPT) [12] was introduced by Markowitz and has become one of the foundation theories in computation finance. Within this theory, a pioneering concept named the mean-variance model was presented to describe the relationship between the expected returns and volatilities of a portfolio through calculating the mean and standard deviation of weighted daily returns. To further study the forming of equilibrium price for discovering arbitrage opportunities, there are some theories [13,14] that extend the MPT by introducing practical market constraints and reducing the sensitivity of impact factors. However, those MPT-based models mainly focus on the allocation in a single period, but lack prediction abilities to adjust portfolios during multiple trading periods. Thus, originating from the Capital Growth Theory (CGT) [15], more portfolio strategies [16] in the past few years have tried to dynamically adjust wealth allocation at any timepoint of the trading period at which fund managers can maintain efficient portfolios all the time. Furthermore, more intelligent algorithms have been introduced to deal with online portfolio optimization problems with the consideration of real market factors such as transaction cost, slippage, and turnover rate. Yet for the simplicity of the analysis of large-scale portfolio management problems, it is our intent to consider returns and risks only in the following sections.
As aforementioned, cooperating two or more meta-heuristic algorithms may benefit from adapting more scenarios by introducing various search mechanisms. However, when hybridizing different algorithms, unconditionally exchanging all information between meta-heuristic algorithms may reduce the diversification of populations because the populations in all meta-heuristic branches are synchronized to the same individuals after exchanging at each generation. In particular, in the early search stage, all branches will search on the same local areas so that the abilities to explore more promising areas will be limited, eventually leading to premature convergence. Accordingly, a simple yet efficient Hybrid Population-based Optimization (HYPO) framework is presented in this paper to flexibly control the directions of information flow between two meta-heuristic algorithms so as to appropriately transmit the useful information to another side while both sides can keep their characteristic search paradigms. First, an Adaptive Multi-Population Optimization (AMPO) algorithm and a self-adaptive Differential Evolution (DE) algorithm are selected and assigned to two algorithmic branches. Then, a Dynamic Contribution-based State Transition (DCST) scheme is proposed to decide the directions of information transition through reviewing the current contribution and system state. Lastly, according to the updated directions of information flow, useful information is shared from one side to another side from which the individuals can learn. The useful information can be defined as the currently best solution or all good-performing solutions of each meta-heuristic. The main contributions of this paper are described as follows:
  • Both swarm intelligence techniques and evolutionary computation algorithms are integrated into a united optimization framework. The advanced concepts of search in each algorithm are retained and complement each other so that the proposed framework can adapt to more scenarios.
  • The proposed dynamic transition scheme can conditionally control the directions of information flow by introducing a contribution-based mechanism in which the findings of each algorithm can be shared at the appropriate time to enhance the search efficiency and avoid trapping into local minima.
  • For large-scale optimization problems, different meta-heuristic algorithms are good at optimizing different subcomponents with a set of non-separable decision variables. The proposed hybrid framework can help to integrate locally optimal solutions of subcomponents so as to enhance the quality of the whole solution and speed up the convergence.
  • Compared with other meta-heuristic algorithms, the presented framework clearly demonstrates outstanding improvements on different scales of problems with various difficult aspects both on well-known benchmark functions and portfolio management problems.
The rest of this paper is organized as follows. Section 2 reviews the past studies on meta-heuristics and portfolio management. Then, Section 3 introduces a dynamic transition scheme to control the directions of information transition. The experimental settings and results both on well-known benchmark functions and portfolio optimization problems are described and analyzed in Section 4. Lastly, Section 5 concludes the proposed framework, and sheds light on improving large-scale portfolio management for future investigation.

2. Preliminaries

2.1. The Overview of Meta-Heuristic Algorithms

In terms of nature-inspired views, population-based meta-heuristic algorithms can be roughly categorized into Evolutionary Computation (EC) and Swarm Intelligence (SI). As inspired by the natural selection and biological evolution theory, evolution-based approaches like Genetic Algorithms (GA) [17] maintain superior populations through natural inheritance processes, basically consisting of several classical operations including mutation, crossover, and selection to perform updates and elimination at each generation. Differential Evolution (DE) algorithms [18] update their offspring according to the difference among parent individuals. Intrinsically, the choice of reference individuals to generate new trial vectors directly decides the search direction performing the exploration or exploitation. There are many mutation strategies such as DE/Rand/1, DE/Best/1, DE/Current-to-best/1, DE/rand-to-best/1 and DE/current-to-rand/1 having been proposed in past studies, some of which are trying to further integrate them to a combined strategy. To balance the exploration and exploration during the search process, Refs. [19,20,21] present several efficient self-adaptive mechanisms to dynamically select mutation strategies from the strategy pool and also adjust hyper-parameters such as scaling factors and crossover rates by reviewing historical performance.
By mimicking biological swarm behaviors, SI techniques have attracted much attention in the past few decades. After being affected by the environment in natural evolution, many kinds of social animals have maintained an efficient survival strategy for foraging, mating and enemy defending. The core components in swarm cooperative mechanisms including organization, communication and assignment are considered as the key features to obtain highly competitive advantages of those species in nature, some of which have inspired many powerful SI-based algorithms. Whale Optimization Algorithms (WOA) [22] are based on the two hunting behaviors to attain both exploration and exploitation capabilities while Particle Swarm Optimization (PSO) [23] algorithms imitate the swarm behaviors of fishes or birds to update the solutions through considering group and individual information.
Despite the effectiveness of meta-heuristic approaches having been successfully demonstrated in many practical problems, those algorithms following a single search pattern are limited to specific kinds of tasks, and then cannot flexibly adapt to more challenging problems. Accordingly, in recent years, some studies have tried to hybridize different meta-heuristics. The authors of [24] try to integrate tabu search and simulated annealing into the Ant Colony System (ACS) to improve the local search ability, while [25] presents an Electrical Harmony-based Hybrid Meta-heuristic (EHHM) algorithm to optimize feature selection on machine learning tasks. In addition, Ref. [26] dynamically assigns agents to the bat algorithm and krill herd algorithm by introducing a logistic function to calculate the selection probability at each iteration in terms of the performance rank of agents whereas [27] generates a new trial vector from both the cuckoo search and PSO algorithm, and a control factor is introduced to balance the weights of the two methods. However, although the proposed frameworks are easy to implement, the continuity of search of each meta-heuristic mechanism is broken up, for which the search advantages of each meta-heuristic cannot be demonstrated through iterations. Meanwhile, there are limited studies applying hybridized meta-heuristics to large-scale problems, especially in handling the problem with dependent decision variables.

2.2. The Adaptive Multi-Population Optimization Algorithm

As originated from hybridized meta-heuristic algorithms, the Adaptive Multi-Population Optimization (AMPO) [28,29,30] is a newly meta-heuristic algorithm that integrates both EC and SI techniques. To flexibly adapt to more tasks at different search stages, the AMPO approach introduces five search groups, including local search group, global search group, random search group, leader group and migration group. Multiple populations are assigned to those groups for performing different search behaviors, respectively. Specifically, the members of each population are not fixed and will be transferred to other populations when triggering corresponding criteria. Among these search groups, the global search group and local search group imitate the swarm intelligence mechanisms conducting the search toward the currently best candidate or around themselves whereas the migration group performs the DE/rand/1/bin search. For the remaining search groups, the random group tries to distribute initial candidates throughout the search space to escape from local minima while the leader group always keeps the best solution for the current time. In the AMPO framework, the update rule of candidates in the global search group is shown as Equations (1) and (2):
S i , t g = ω × S i , t 1 g + β × g b e s t t 1 x i , t 1 ,
x i , t = x i , t 1 + S i , t g ,
where x i , t is the solution of i t h candidate at iteration t, S i , t g is the global step size, ω ( 0 , 1 ) is the constant decay rate of global step size, β U ( 0 , 1 ) is the control factor generated by uniform distribution, and  g b e s t t 1 is the best solution at the last iteration.
Furthermore, the new solution of candidates in the local search group is described as Equation (3) to Equation (5):
σ i , t = γ × σ i , t 1 ,
S i , t l = N 0 , σ i , t × x i , t 1 ,
x i , t = x i , t 1 + S i , t l ,
where x i , t is the solution of i t h candidate at iteration t, S i , t l is the local step size, N is the Gaussian random number generator with the mean value at 0 and standard deviation σ i , t , and  γ ( 0 , 1 ) is the constant decay rate of σ i , t 1 .
As clearly depicted in Figure 1, the AMPO algorithm follows an evolution-like workflow. At the beginning of the search, all user-defined hyper-parameters are inputted into the algorithm, and new candidates are initialized. In the transformation stage, all candidates in the random group are transferred to one of the global or local search groups by preset transformation probabilities, and then those candidates fully or partially inherit the solution and individual parameters from candidates in the source group where the global search group, local search group and leader group are included. This will encourage candidates to explore promising areas and reduce meaningless random searches at the later stage. After that, all candidates update the control parameters and conduct the search based on rules that are defined by their corresponding search group. The candidates in the global search group will gradually approach the best current candidate from different directions. Meanwhile, the individuals in the local search group walk around the locally best solutions to jump out the local minima. Besides, the exploration ability of the AMPO will be weakened when all individuals in the random search group are transferred to other groups after iterations. Thus, the recovery mechanism is set up to reset part of the poor-performing candidates in the source group to the global search group or random search group. The updated candidates are evaluated and sorted, and then the currently best solution will be selected to replace the candidate in the leader group. Furthermore, the migration group performs the DE-based search in which the globally best solution found by the migration group is transferred to the leader group with the preset probability. Ultimately, the AMPO framework will be halted and output the globally best solution if reaching the maximum iterations.
Due to the transformation and recovery mechanisms, the size of search groups is dynamic over the search process so that the search resources can be adapted at different stages, and the useful information can be spread to other candidates. The AMPO approach attained remarkable performance in tackling a set of well-known benchmark functions with relatively small problem size when compared to other State-Of-The-Art (SOTA) meta-heuristics. However, the performance of the AMPO approach is not very impressive when solving large-scale problems. In addition, it is worth noting that there is a unidirectional communication from the migration group to the source group in the AMPO approach where the candidates in the source group can obtain useful information from the migration group, but it limits the information exchange at the versa direction. This will adversely slow down the convergence and weaken the capability to escape from local minima.

2.3. The Differential Evolution with Combined Strategy

DE has been proved the outstanding performance on many practical problems over the past few decades. The key to success is the trial vector generation strategies (i.e., mutation strategies) that utilize the difference between candidates to update the solutions. Through taking different individuals as the reference, mutation strategies perform different search patterns, some of which conduct the exploration while others run the exploitation. In fact, both exploration and exploitation are required for tackling a real-world problem at different search stages; thus, how to balance them during the whole search process has become a critical challenge in recent years. In addition, it is also necessary to consider the control factors of mutation and crossover strategies. A larger control factor can speed up the optimization process at the beginning of the search, but it may fail to converge later. Hence, similar to the learning rate in deep learning approaches, a flexible control factor can enable the algorithm to adapt more to different environments. CSDE [31] is a simple yet powerful adaptive DE algorithm in which the adaptability is achieved from two aspects including the selection of mutation strategy and the adjustment of control parameters. As inspired by the JADE [19], the CSDE approach proposes two new trial vector generation strategies. The DE/current-to-pbest/1 strategy encourages individuals to explore the neighborhood of themselves. The update rule is shown as Equation (6):
v i , t C = x i , t + F i , t C × x p b e s t , t x i , t + F i , t C × x r 1 , t x r 2 , t ,
F i , t C = M t × M t + 1 M t × I i , t ,
where v i , t C is the trial vector of i t h individual at iteration t when using DE/current-to-pbest/1, x i , t is the original individual, F i , t C is the control factor which is updated by Equation (7), x p b e s t , t is one of the solutions randomly selected from t o p p % individuals, x r 1 , t and x r 2 , t are the reference individuals, M t is the individual independence macro-control factor, and  I i , t is the individual status.
Another strategy named DE/pbest-to-rand/1 tries to exploit the promising areas around the locally best solutions. The vector generation strategy and control factor update function are presented as Equations (8) and (9):
v i , t R = x p b e s t , t + F i , t R × x r 1 , t x i , t + F i , t R × x r 2 , t x i , t ,
F i , t R = M t × M t + 1 M t × P t ,
where v i , t R is the trial vector of i t h individual at iteration t when using DE/pbest-to-rand/1, F i , t R is the control factor, and  P t is the modulo-based periodic parameter.
Besides, it is worth noting that using t o p p % individuals instead of the currently best individual as the reference can avoid the search trapping into local minima. Furthermore, to adapt the search strategy over the optimization process, the selection probability is introduced to choose mutation strategies by comparing the historical performance between the two strategies:
S R t = S R t 1 C S R t 1 C + S R t 1 R ,
where S R t 1 C and S R t 1 R are the success rate of the two proposed strategies, respectively.
The workflow of the CSDE approach is demonstrated in Algorithm 1. It follows the usual operations of DE algorithms including mutation, crossover, evaluation, and selection, but the search strategies and control factors of each individual are dynamically adjusted at each iteration.
Algorithm 1: The Overall Procedure of the CSDE Approach
Algorithms 15 00404 i001

2.4. Portfolio Optimization

As one of classical yet still challenging problems in the finance field, portfolio optimization has been studied for decades. To track the price trend online, many efficient methods have been proposed. Examples include the Follow-the-Winner strategy [32,33] which increases the weights of successful assets based on their historical performance under the assumption that the market keeps the trend with momentum. Then, these strategies have higher probability to get more returns when investing past good assets. Conversely, there are some approaches using the Follow-the-Loser strategy [34,35]. The strategy is based on the mean revision theory in which the asset performing good returns in the past time will eventually drop back to the historical mean value. Hence, the strategy prefers to increase the investment on poor assets, expecting them on the rising cycle in the following time. In addition, Pattern-Matching approach [36] tries to predict the market and then update the portfolio by reviewing and matching historical samples whereas the meta-learning algorithm [37] considers multiple strategies to generate a trading signal, further enhancing the stability of investment than a single strategy. In recent years, with the significant advantages of Deep Learning (DL) on complex pattern analysis, especially on understanding time-series data, more DL-based approaches have been introduced to manage portfolios. The authors of [38] apply a Long Short-Term Memory-based network to construct a portfolio of Exchange-Traded Funds (ETFs) of market indices and achieve competitive performance during the COVID-19 crisis. In addition, Ref. [39,40] train an intelligent portfolio manager to dynamically adjust the weights of assets by using deep reinforcement learning to interact with financial market environments. However, those latest DL-based algorithms are evaluated on some relatively small-scale portfolios in which the number of assets is not more than one hundred per portfolio. This will surely limit the diversity and capacity of investment to consider multiple markets around the world.
Furthermore, some studies [41,42] formulate the mean-variance model as a quadratic programming problem where the objective is to minimize the risk while subjecting to the returns at a certain level. However, the computing time of solvers will exponentially increase when the scale of problems becomes larger. However, for many financial problems in real markets where the execution time is a major concern, spending much time on a decision cannot be acceptable for investors as the potential opportunities are immediately exploited by the dynamic market. Besides, many investigations try to apply meta-heuristic algorithms to manage portfolios due to the remarkable performance of meta-heuristics on combinatorial optimization problems. The authors of [43] employ GA to optimize portfolios by using different return-risk measures as the fitness function whereas [44] introduces a modified FA model and entropy constraints to tackle cardinality constrained mean-variance portfolio problems in which the diversification of a portfolio is considered by the presented model. Except for integrating multiple objectives into a single target, Ref. [45] formulates the portfolio allocation problem as a multi-objective optimization problem, and then solves it by using the Non-dominated Sorting Genetic Algorithm II (NSGA-II).

3. Methodology

3.1. Overall Architecture

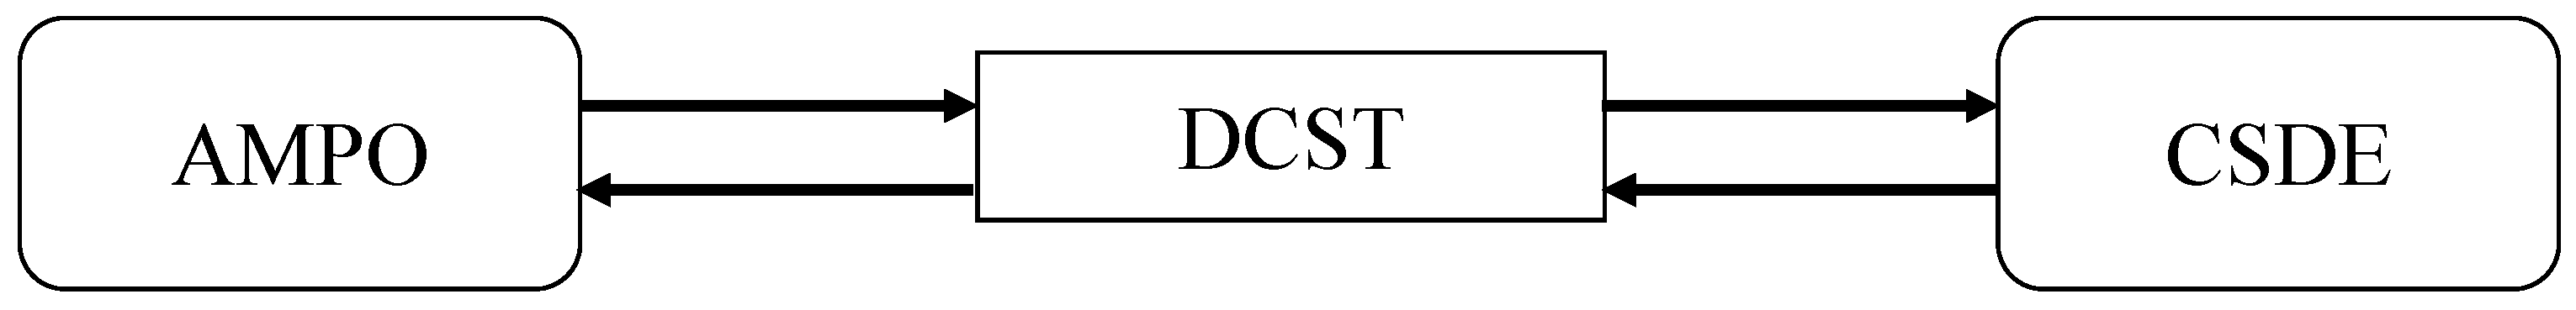
As mentioned in the previous section, the existing hybrid mechanisms between meta-heuristics suffer from two pitfalls. First, the information exchange mechanisms are not carefully considered for the factors including the timing, directions, and information of transition. For instance, frequently exchanging the currently best solution of each meta-heuristic branch to the opposite side may prematurely converge to local minima due to the diversification of populations being reduced. Besides, another major pitfall in some cases is that the hybrid frameworks randomly select one of meta-heuristics for every single individual at each iteration. Clearly, this will adversely affect the continuity of search behaviors, and limit the originally nature-inspired search mechanism of each algorithm for which the advantages of evolution may be revealed after keeping the characteristic search for a few iterations. Therefore, to develop an effective transition mechanism while retaining the advantages of special designs of each meta-heuristic algorithm, a simple yet powerful Dynamic Contribution-based State Transition (DCST) scheme is proposed in this work to connect different meta-heuristic algorithms for enhancing the overall search ability. As shown in Figure 2, the AMPO framework and CSDE approach are linked up by the DCST scheme. In particular, the proposed transition scheme decides when the hybrid framework transmits the information, which direction should be chosen, and what kinds of information should be exchanged. To clearly illustrate the HYPO framework, an example with practical value is how to optimize the capital allocation for different industries as a portfolio usually includes stocks from multiple industries for diversifying the risk. According to the company natures of stocks and the correlation between stocks, the stocks will be allocated to one of the industries (i.e., components). The stocks in the same component have strong correlations while different components may have contrary problems due to different impact factors. However, using a single meta-heuristic mechanism may work on one of the components, and it is difficult to find out the optimal solution for all components at the same time, especially in solving a large-scale portfolio. Thus, integrating different meta-heuristic mechanisms can adapt to more components during the search. For example, a portfolio has several stocks from two industries including real estate and the Internet. The AMPO method may work well on optimizing the capital allocation of stocks in real estate and fail at that of stocks in the Internet, but the CSDE method may fail in real estate and achieve better performance in the Internet. The proposed HYPO framework integrates two meta-heuristic methods and also completely retains their distinctive heuristic mechanism. During the search, those branches obtain some good-performing solutions that implicitly include the locally best allocation schemes of one of the industries, but they trap into local minima as the rest of solutions representing other industries are not optimal. To solve it, the dynamic contribution-based transition scheme in the HYPO framework decides the direction and information of transition by reviewing the contributions of each heuristic branch in the past few generations. Through the dynamic transition scheme, the optimal allocation plan collected by each branch can be shared to help escape from local minima and generate a better solution for the whole portfolio.
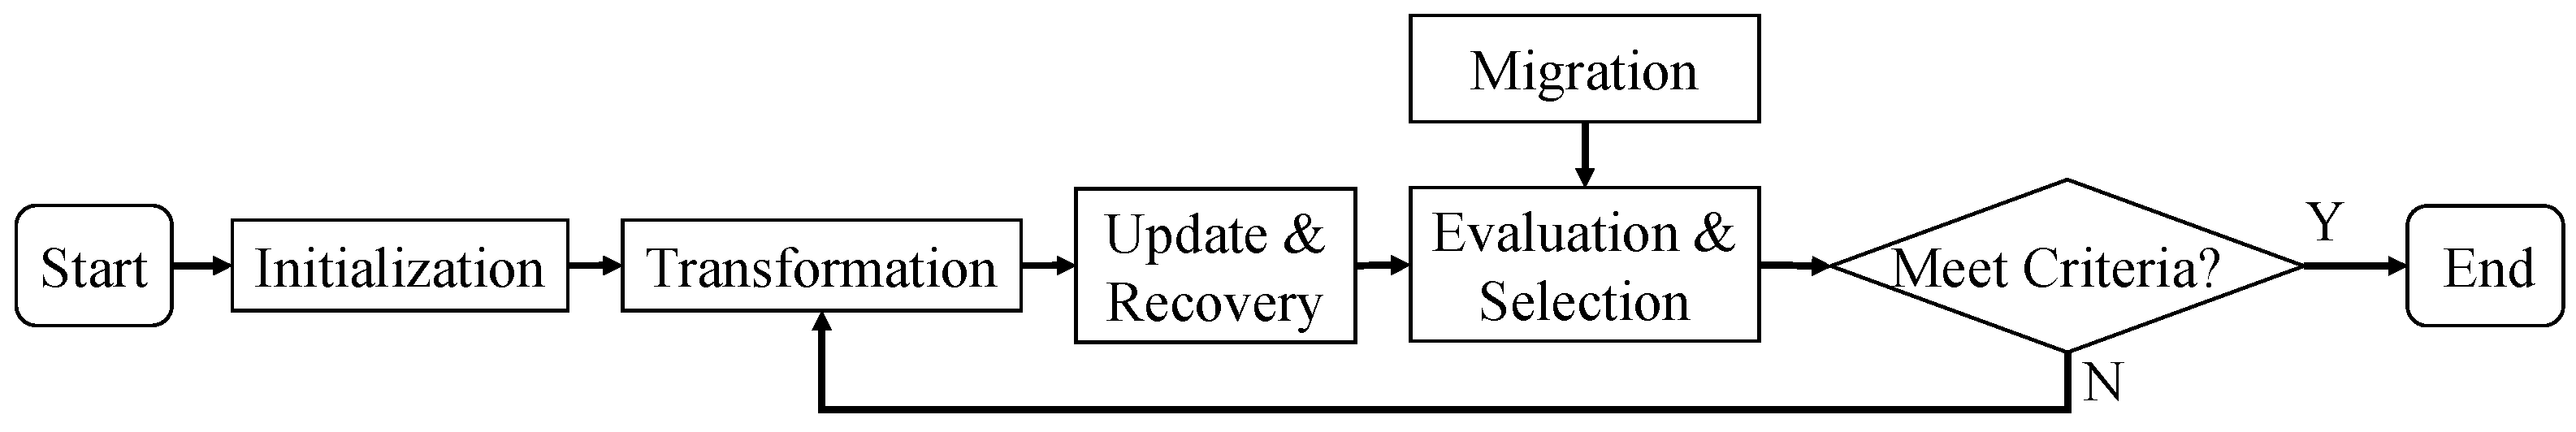
Algorithm 2 describes the overall process of the hybrid optimization framework. At the beginning of the search, all user-defined parameters are input to the model. Then, all individuals are initialized and assigned to one of populations in two meta-heuristic algorithms. When starting the evolution process, the algorithm decides whether to transmit the good-performing solutions generated by the CSDE approach to the population of the AMPO framework in terms of the current transition direction. After that, the AMPO algorithm sequentially executes a set of evolutionary operations including transformation, update, recovery, evaluation, and selection on the AMPO population. Furthermore, the DCST scheme allows the information transition from the AMPO framework to the CSDE approach if satisfying the transition conditions. In addition, the CSDE approach conducts the evolution-based DE search on its populations. Also, by evaluating the enhancements of the CSDE approach after introducing the extra information from the AMPO algorithm, the signal of contribution will be given later to support the system state transition. More importantly, to flexibly control the frequency and direction of information exchange between meta-heuristics, a system state transition mechanism in the DCST scheme is presented to update the latest system state and its corresponding transition direction through reviewing the current system state and flow direction. The above optimization processes will be iteratively executed until the maximum iterations are satisfied. Lastly, the globally best individual in all meta-heuristics will be output as the final solution of problems.
Algorithm 2: The Overall Procedure of the HYPO Approach
Algorithms 15 00404 i002

3.2. Dynamic Information Transition

As inspired by the dynamic branch prediction in the computer architecture filed, the decision process of information exchange in the proposed hybrid framework should be quickly responded to with less computing delay according to the historical contributions of meta-heuristics. As aforementioned, the information should not be unconditionally exchanged at each iteration. Accordingly, there are three essential components in the DCST scheme, namely contribution identification, state transition mechanism, and direction update mechanism. Before discussing the details, two new concepts, namely the system state and transition direction, are introduced into the DCST scheme for constructing the branch predictor. Specifically, the system states including the stable state and intermediate state indicate the current position of the transition system. Besides, three transition directions are defined in this work. The bi-directional information transition enables the two meta-heuristic algorithms to share their best solutions with each other, whereas the other two situations are unidirectional transition for two algorithms such that that only one side can send the information to the opposite side. For convenience, the symbol of bi-directional transition is represented by 0 while that of unidirectional transitions are described by 1 or 2 for the transition flow from the AMPO framework to the CSDE approach only or vice versa.
In recent studies, most adaptive mechanisms or cooperative mechanisms in meta-heuristic algorithms adjust search strategies by reviewing the historical contributions of each component. However, in tackling time-sensitive tasks such as online trading and path planning of unmanned driving, calculating the contributions of individuals or populations by using complicated rules is computationally intensive and requires larger memory space for storing historical data. Hence, to trade off the time requirement and contribution calculation on solving large-scale optimization problems, a simple update scheme is presented to identify the current contribution so that it can drive the state transition in the following step. As clearly depicted in Algorithm 3, the scheme will check if any information is being transmitted from the AMPO framework to the CSDE approach at the current iteration. It returns false if no information is being exchanged, otherwise it will further verify if there is an enhancement that is driven by the exchanging information just now. Finally, the value of the contribution signal is assigned true when the transmitted information from the AMPO approach can promote the CSDE search. The intent of the positive signal is to encourage the information transition from the AMPO algorithm to the CSDE approach in the following iterations.
Algorithm 3: The Update of Contribution Signal
Algorithms 15 00404 i003
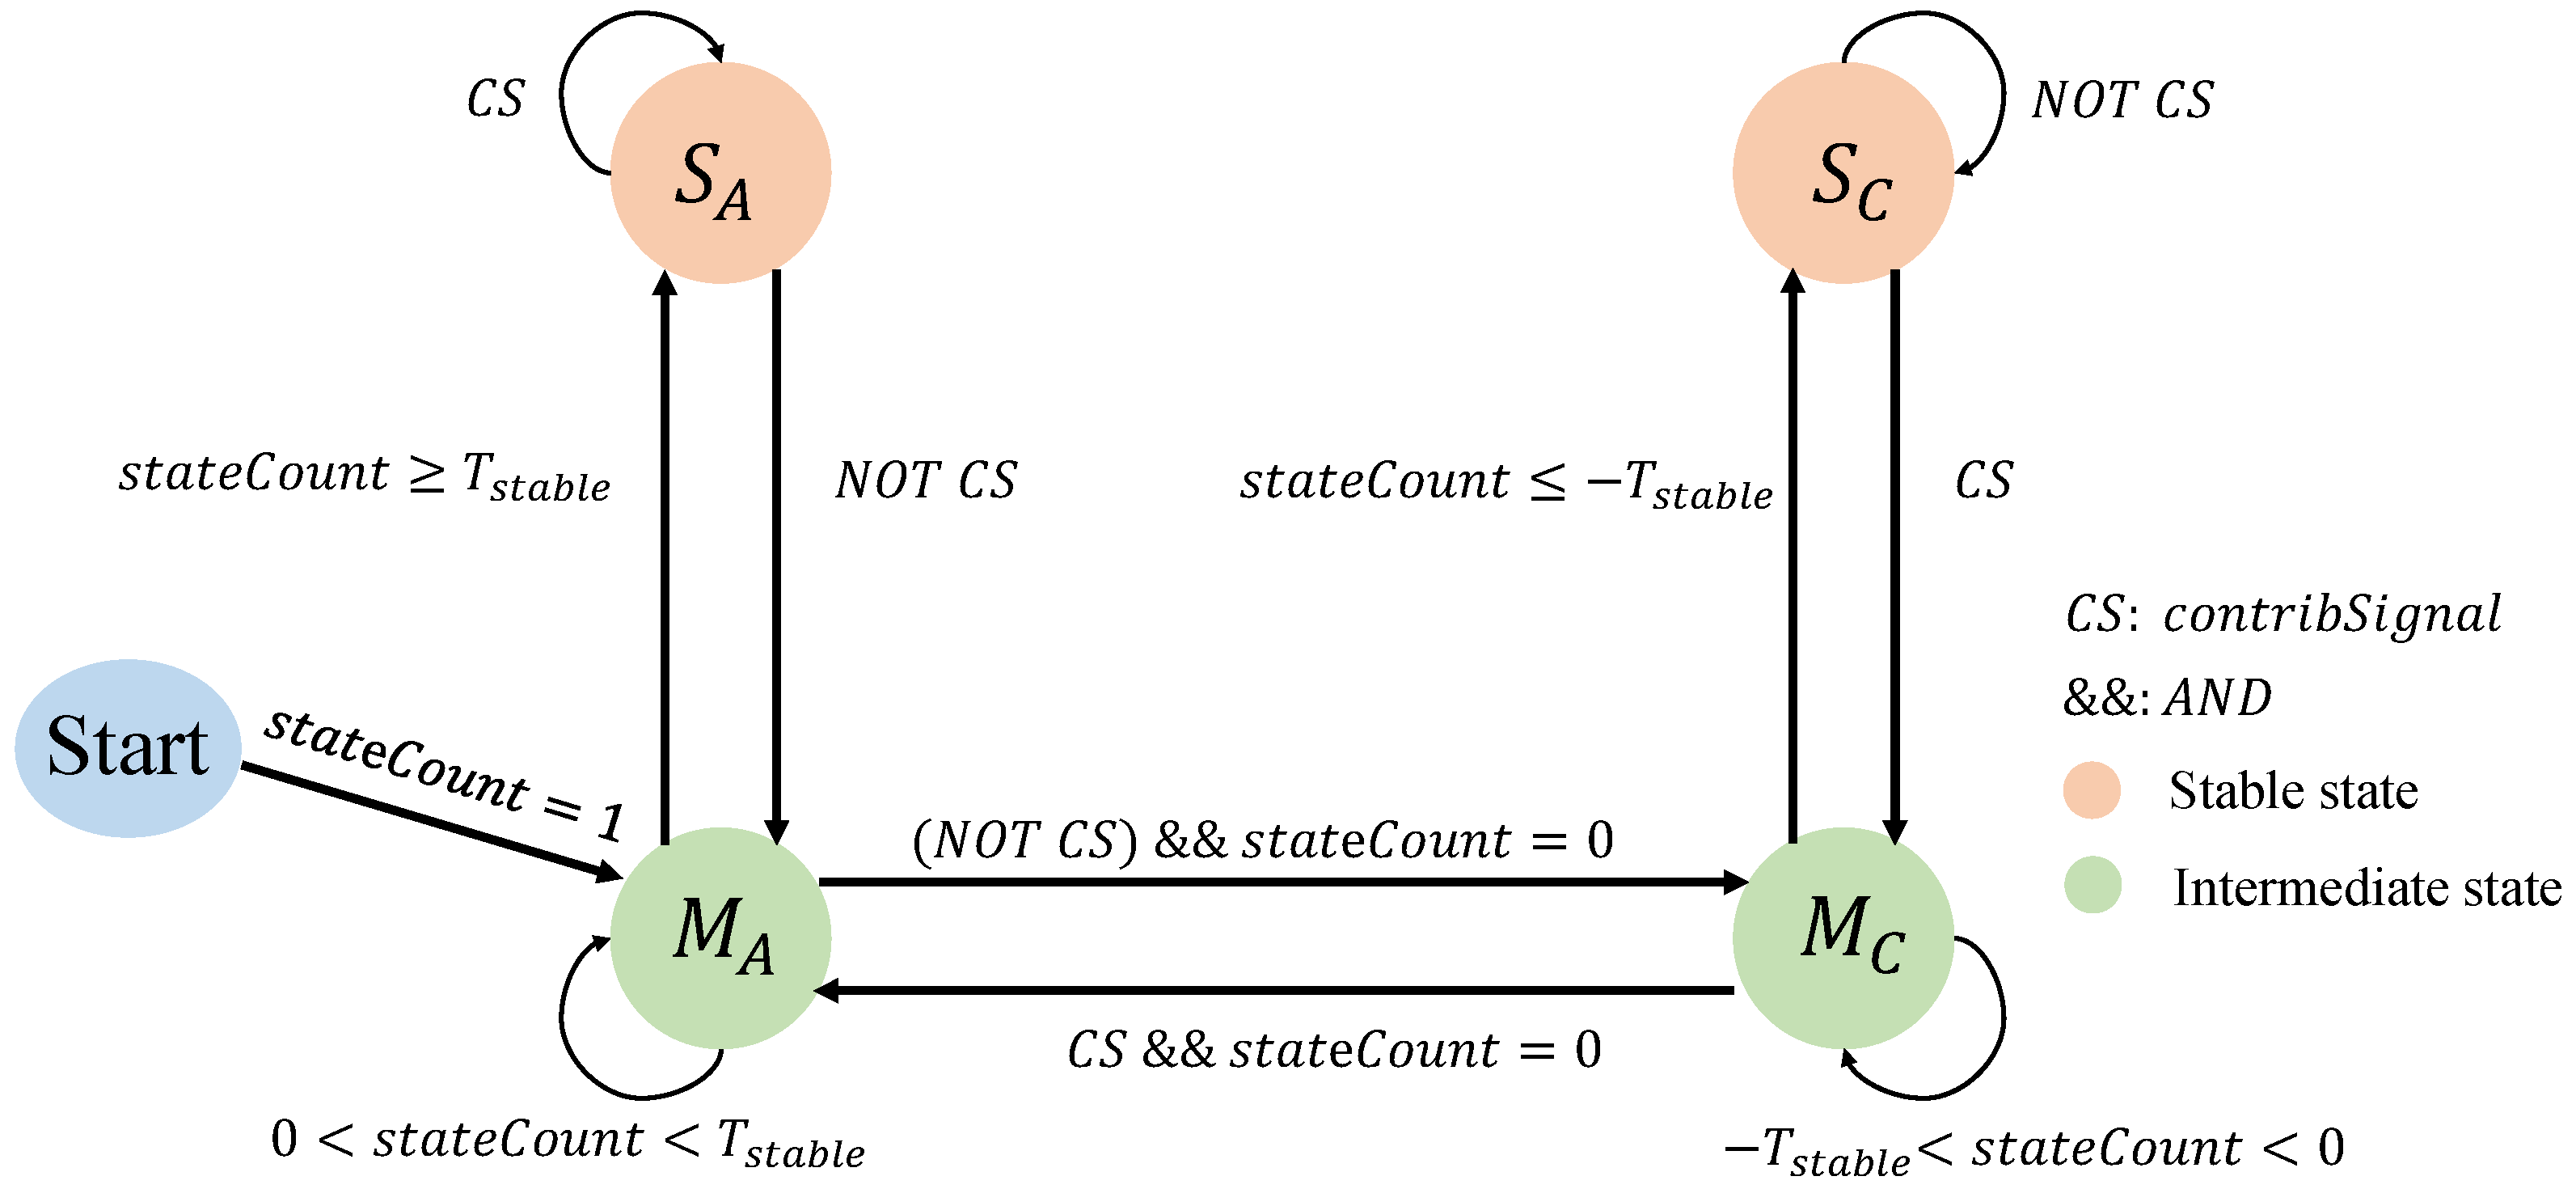
Furthermore, instead of using memory to store the historical performance of each meta-heuristic algorithm, a state-based transition system is applied in this work in which the system states are utilized to implicitly indicate the current environment of the system with the consideration of historical impacts. As depicted in Figure 3, S A and M A are the stable state and intermediate state that indicate the information transition direction from the AMPO to the CSDE. Conversely, S C and M C are the stable state and intermediate state that show the direction from the CSDE to the AMPO. s t a t e C o u n t records the current position of the system in which the s t a t e C o u n t will increase by 1 when the c o n t r i b S i g n a l is true, otherwise it will decrease by 1 when the c o n t r i b S i g n a l turns false. Specifically, the information is transmitted from the AMPO to the CSDE when the s t a t e C o u n t is greater than 0 (i.e., the system is in S A or M A ) whereas the information flow follows the opposite direction when the s t a t e C o u n t is less than 0 (i.e., the system is in S C or M C ). Furthermore, the state transition depends on the s t a t e C o u n t and c o n t r i b S i g n a l at the current iteration. The  s t a t e C o u n t stops increasing and the system moves to the stable state S A when the s t a t e C o u n t is equal to the predefined value T s t a b l e and the c o n t r i b S i g n a l remains true. Similarly, the  s t a t e C o u n t stops decreasing and the system gets into another stable state S C when the s t a t e C o u n t is equal to T s t a b l e and the c o n t r i b S i g n a l remains false. Once entering the stable state, the system will stay here until it receives a false contribution signal at the S A or a true contribution signal at the S C . More importantly, the information transition direction is reversed when the s t a t e C o u n t increases or decreases to 0. Intrinsically, the chain system drives the state transition based on contributions so that the direction generated by the current state reflects the performance of each branch in the past few iterations, but the preservation of large amounts of historical data is not required for the contribution calculation.
The overall procedure of the system state transition mechanism is described in Algorithm 4. Besides the exchange conditions between two unidirectional transitions discussed above, a bi-directional transition mechanism is introduced to prevent the search from keeping the same direction for a long time. When the continuously accumulated iterations of the same direction exceed the predefined trigger condition, the search enables the bi-directional information exchange for a few iterations to share useful ideas in which it may help to escape from local minima. After that, the search will come back to the unidirectional transition.
For Algorithm 4, c u r r e n t D i r e c t i o n is the current direction of information transition, a c c D i r e c t i o n is the accumulated number of the same direction, T B i is the number of iterations running on bi-directional transition, and  T t r i g g e r 
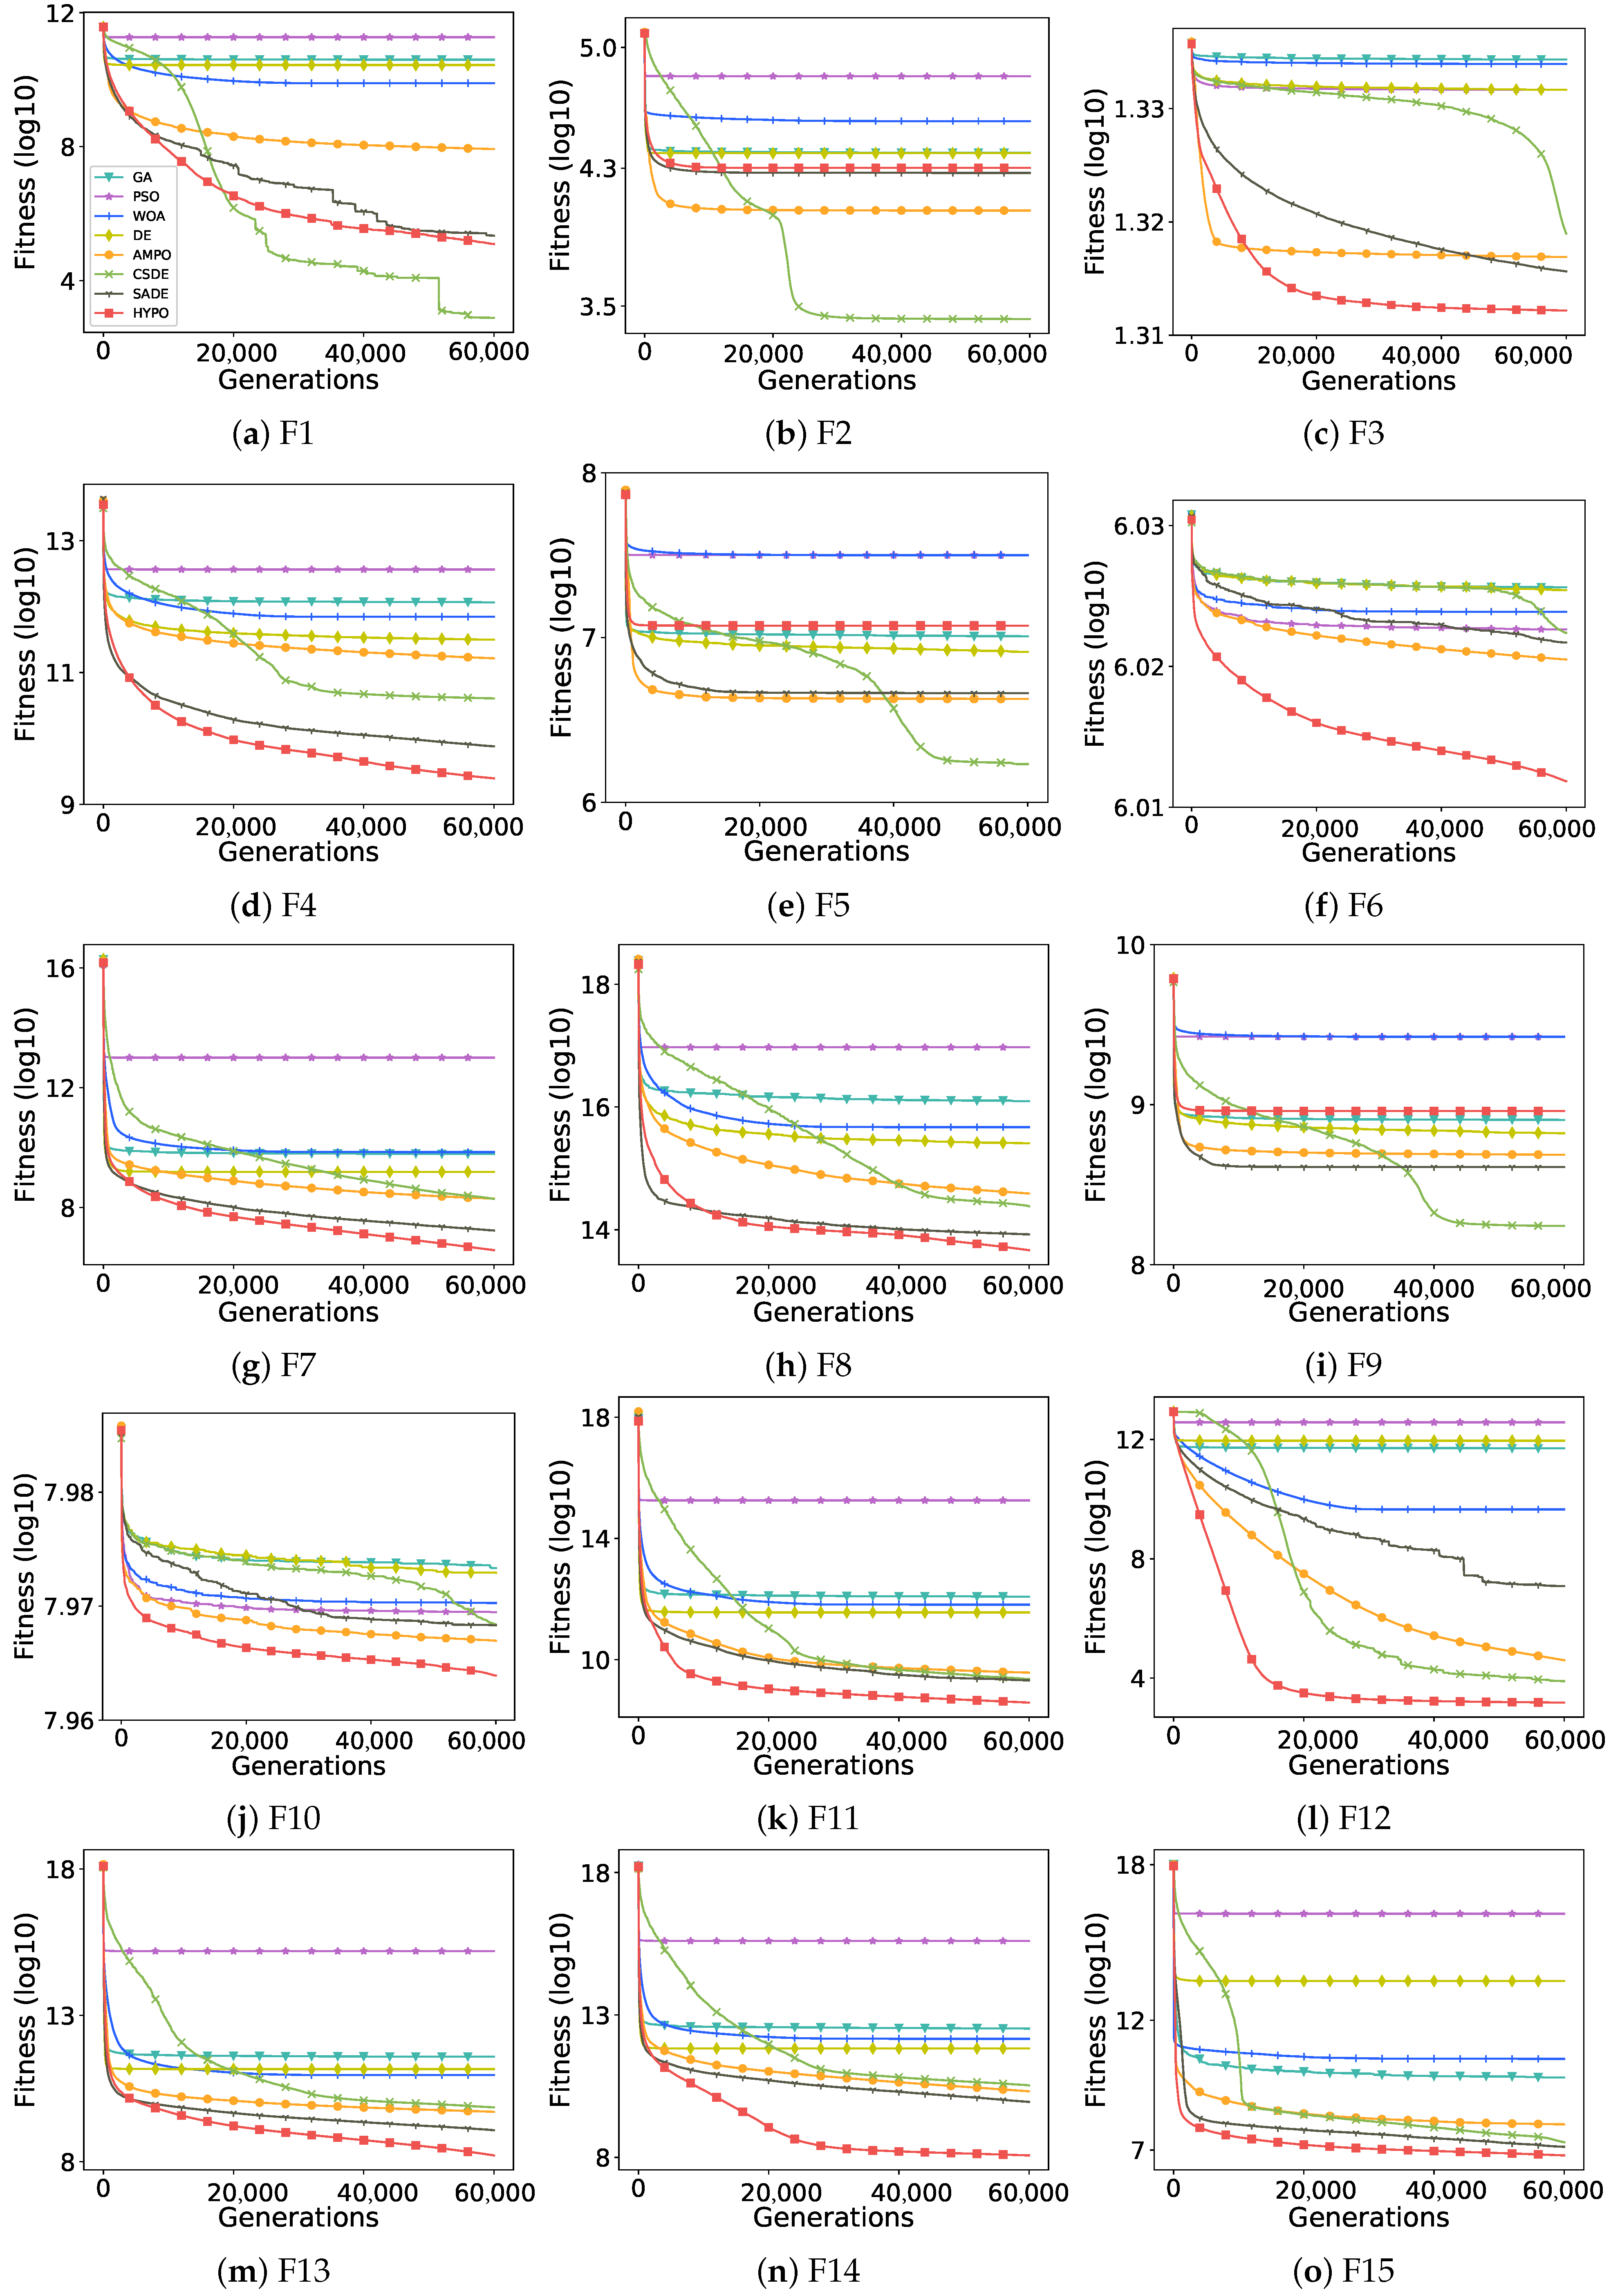
is the number of iterations on the same direction to trigger the bi-directional transition. In addition, for the kind of information being transmitted, the whole currently best solution of each meta-heuristic framework will be taken as the most important information being sent to the opposite side. Furthermore, the impact of different kinds of information for transition will be studied in the ablation experiments.
Algorithm 4: The Mechanism of System State Transition
Algorithms 15 00404 i004

4. Empirical Results and Discussion

To carefully evaluate the performance of the proposed hybrid framework against those of other meta-heuristic algorithms, including the Genetic Algorithm (GA) [17], Particle Swarm Optimization (PSO) [23], Whale Optimization Problem (WOA) [22], Differential Evolution (DE) [18], Self-adaptive Differential Evolution (SADE) [46], Adaptive Multi-Population Optimization (AMPO) [28], and CSDE [31], a set of popular large-scale optimization functions called CEC2019 [47] and a set of portfolio optimization problems of different dimensions are selected for testing the algorithms both on benchmark functions and real-world problems. In all experiments, the population size of each algorithm is set to 50 for a fair comparison. Besides, the user-defined parameters of compared approaches follow the literature [22,28,31,46] that demonstrate the SOTA performance on testing cases. Among which the GA consisted of random tournament selection, perturbation mutation, and two-point crossover strategies while the DE algorithm applied the DE/Current-to-best/1 strategy. The detailed parameter settings of all compared algorithms are shown in Table 1. In addition, the Wilcoxon rank-sum test [48] is introduced to compare the statistical significance of the proposed framework against the compared approaches with a significance level at 0.05. More specifically, the symbols “+”, “=” and “-” indicate that the results of the proposed hybrid framework are statistically better than, similar to, or worse than that of the compared algorithms, respectively. Lastly, all algorithms are implemented by Python on a desktop computer installed with the Intel i9-7900X processor running at 3.3 GHz and 64 GB of RAM.

4.1. The CEC2019 Benchmark Functions

The CEC2019 benchmark set includes 15 minimization functions of 1000 dimensions, and then it can be further categorized into four different groups of interaction between variables. Specifically, F 1 F 3 are fully separable functions while F 4 F 11 are partially separable functions consisting of a set of non-separable subcomponents. Furthermore, F 12 F 14 are overlapping functions in which some shared decision variables exist on two subcomponents. Lastly, F 15 is the fully non-separable function. To study the stability of all algorithms, there are 25 independent runs being conducted by each algorithm in which the mean and standard deviation of fitness values in all runs are saved. Meanwhile, the maximum number of function evaluations is set at 3 × 10 6 .

4.1.1. Numerical Results

As shown in Table 2, the numerical results on the CEC2019 dataset reveal that the proposed HYPO framework achieves the 1st rank on 11 out of the 15 large-scale benchmark functions, and most of them are non-sparable functions that are close to real-world applications. Besides, the CSDE algorithm performs the best on the rest of the problems in which half of them are fully separable functions. The details are discussed as follows in terms of different categories.
  • For the fully separable functions of F 1 F 3 , the HYPO algorithm attains relatively good solutions on F 1 and F 3 while keeping the stability at a low level on 25 runs. It is worth noting that the algorithms do not need to consider the correlation among variables for which all decision variables are independent. In fact, real-world problems are complicated and involve a large amount of dependent components.
  • For the partially separable functions of F 4 F 11 , F 4 F 7 are the functions with a set of non-separable subcomponents and one fully separable subcomponent whereas F 8 F 11 are the functions with only a set of non-separable subcomponents and no fully separable subcomponent. The proposed framework is ranked first on 3 out of 4 functions on two sub-categories evaluation, respectively. Specifically, the mean values on F 7 , F 8 and F 11 collected by the HYPO approach are significantly smaller than that of compared algorithms.
  • For the overlapping functions of F 12 F 14 , the HYPO approach excels all compared algorithms on all functions in terms of both the mean and standard deviation of fitness values, especially on optimizing F 13 and F 14 in which mean values of the HYPO framework are at least an order of magnitude smaller than that of other algorithms.
  • For the fully non-separable function F 15 , the proposed framework outperforms other compared algorithms. This clearly demonstrates that the HYPO algorithm has a strong capability to handle large-scale optimization problems with complicated dependent correlations among decision variables.
Furthermore, Table 3 carefully counts the results of the significant test of each algorithm. It is evident that the proposed HYPO framework significantly achieves outstanding performance on solving large-scale problems when compared to other testing algorithms in the perspective of statistics, especially with the comparison of its two meta-heuristic components that are the AMPO and CSDE frameworks, for which the effectiveness of the contribution-based state transition scheme of the proposed framework can be verified.

4.1.2. The Analysis of the Convergence

Besides being evaluated the quality of solutions at the end of the search, the speed of convergence is concerned in this work in which the average currently best fitness values at each generation on 25 runs are recorded to plot the convergence curve. The x-axis represents the number of generations whereas the y-axis shows the log f ( x ) m e a n with the base of 10. As clearly depicted in Figure 4, the fitness values of the HYPO framework (the red line) dramatically drop down to a very low level at the beginning of the search and then stabilizes at a competitive result at the middle stage on the most of cases. For comparison, other compared algorithms slowly obtain the enhancements and ultimately halt at a higher fitness value. This surely reveals that the presented transition scheme can efficiently promote the search and help to escape from local minima for discovering more promising areas.

4.1.3. The Analysis of the Computational Cost

Through analyzing the CPU time of all algorithms in Table 4, PSO runs faster than others on all evaluations, but it fails to get competitive solutions. As it unavoidably spends extra time to deal with the state and information transition when compared with the AMPO and CSDE approaches, the HYPO framework occupies more computing resources to reach the predefined generations. In fact, the HYPO algorithm can use a shorter time instead of running a whole search period to generate a good-performing solution when reviewing the convergence graphs.

4.2. Portfolio Optimization

Portfolio optimization is still a challenging real-world problem in computational finance in which fund managers expect to maximize the returns while maintaining lower risk through adjusting the weights of assets in a portfolio. By formulating it as a combinatorial optimization problem, this section mainly focuses on the relationship between the return and risk in terms of the mean-variance model. In the experiments, there are three datasets from the constituents of different financial market indices, including CSI300, SP500, and a mixed market index (Mix for short) consisting of SP500, CSI300 and HSI. The testing period is 5 years from July 1, 2017 to June 30, 2022, and the stock will be removed from the dataset if it is not included in the market index during the whole testing period. The details of three datasets are described in Table 5 in which the risk-free rate comes from the average daily values of 5-year bond yield on the corresponding market. More importantly, to test the scalability of all algorithms, different scales of portfolios on the same dataset are selected and evaluated according to the ascending order of the market capitalization of companies. Besides, only long positions will be allowed during the trading in order to simplify the scenario.
To convert the optimized solutions to investment weights after the search, the transformation rule between the solution x of algorithms and actual weight w of assets in a portfolio is described as Equation (11). Besides, a specific example in Figure 5 is given to illustrate the transformation rule:
w i = x i j = 1 N x j ,
where x i [ 1 , 1 ] is the value of i t h dimension of solution x, w i is the weight of i t h asset in a portfolio, and N is the total number of assets in a portfolio.
Furthermore, to convert the problem from multi-objective optimization to single objective optimization, a popular measurement indicator called Sharpe Ratio ( S R ) is applied to consider both the return and risk of a portfolio. The definition of S R is shown below:
S R = E R P R f σ P ,
where E ( R P ) is the annually expected return of a portfolio (see Equation (13)), R f is the risk-free rate of that market, and σ P is the standard deviation (i.e., risk) of a portfolio (see Equation (14)).
E R P = T Y i = 1 N w i r i ,
σ P = T Y W M W T ,
where T is the trading days, Y is the trading years, N is the number of assets in a portfolio, w i is the normalized weight of i t h asset, r i the average daily return of i t h asset during the whole trading period, W is the weight matrix of a portfolio, and M is the covariance of the returns among assets in a portfolio.
Since a higher S R value indicates a better portfolio, the fitness function shown in Equation (15) is the reciprocal of S R for formulating a minimization problem. In addition, each experiment will independently run 30 times, and the number of function evaluations ( F E ) in each run is calculated as Equation (16).
f ( x ) = 1 S R , if S R > 0 10 10 , otherwise ,
F E = N 100 + 0.5 + 1 × 5 × 10 4 .

4.2.1. Numerical Results

Table 6, Table 7 and Table 8 show the summary of the results on all three markets of different dimensions in which the mean and standard deviation of S R of each algorithm is computed. The HYPO framework attains the best performance of all relatively large-scale portfolios except the smallest portfolio of those markets, including 100 assets on SP500, 50 assets on CSI300 and 100 assets on the mixed market. Specifically, the proposed framework can obtain the higher S R greater than 2 on all portfolios which hold more than 200 assets at the same time. For the largest portfolio on the mixed market, the HYPO approach excels all algorithms at least 0.5 S R , for which less risk will be taken while obtaining the same returns. More importantly, the stability of algorithms decides whether they can provide a confident trading strategy at each run so that the unpredictable investment can be reduced. This clearly demonstrates that the HYPO algorithm attains very small standard deviation values in which consistent investment decisions are performed at each run, especially on dealing with more complicated and large portfolios with the assets from multiple financial markets. This will effectively extend the scalability and flexibility of a portfolio to consider multiple markets for diversifying the risk into more assets. Similar to the CPU time performance on the CEC2019 functions, the HYPO method spends more computing resources on executing the dynamic information transition for adapting to the problems.

4.2.2. Visualization of Mean-Variance

As clearly depicted in Figure 6, Figure 7 and Figure 8, the mean-variance distribution of each algorithm is described. Among this, the ideal portfolio should appear in the lower right corner of the scatter graph. The portfolios generated by the GA and PSO methods are located in the lower left corner in which those algorithms tend towards a lower risk investment, but the returns are also less than others. In addition, although the portfolios collected by the WOA have higher returns, they have to undertake much higher risk and demonstrate unstable investment strategies. Compared with the DE, SADE, AMPO, and CSDE methods, the HYPO framework generates competitive portfolios in small-scale scenarios. However, when the portfolio scale becomes larger, the HYPO method significantly obtains higher returns at the same risk level. This can verify the idea that integrating multiple meta-heuristic mechanisms by using the dynamic transition scheme can achieve better performance than a single meta-heuristic algorithm for which the components with different natures can be optimized at the same time to avoid local minima in the HYPO framework.

4.3. Ablation Studies

To investigate the effectiveness of the proposed transition scheme for hybridizing meta-heuristics, a set of ablation experiments are conducted to study the significance of transition directions and the kinds of information being transmitted. First, four different settings of transition directions including the unconditionally unidirectional transition from the AMPO to the CSDE (named Uni-AMPO-CSDE), unconditionally unidirectional transition from the CSDE to the AMPO (named Uni-CSDE-AMPO), unconditionally bi-directional transition between the AMPO and CSDE (named Bi-AMPO-CSDE), and no information exchange between the two algorithms (named No-exchange) are evaluated and compared with the proposed framework. None of these schemes include the dynamic transition scheme. Then, to further discuss the impact of information types on transition, another version (HYPO-LocalBest for short) of the proposed framework is implemented in which the meta-heuristic approach transmits all good-performing solutions to replace the inferior solutions of another meta-heuristic algorithm.
Table 9 demonstrates the results of different transition direction settings on some sampling functions from CEC2019 and portfolio optimization. The HYPO algorithm is ranked first on 5 out of the 7 functions while the Bi-AMPO-CSDE generates the best solutions on the remaining 2 functions. Compared to the algorithms with unidirectional transition or no transition, the outstanding performance of the HYPO approach reveals the benefits of sharing information between meta-heuristic algorithms for which the information from one side can provide a good reference to another meta-heuristic so that it can start the search from promising areas. Meanwhile, providing the extra information to another meta-heuristic branch can help to escape from local minima if the algorithm is stuck for a long time running by itself. Furthermore, the dynamic state transition scheme can suggest a good timing and direction for exchanging information than the unconditionally bi-directional transition as frequently exchanging information can reduce the diversification of a population and premature converge at the beginning of the search.
In addition, what kind of information being transmitted is a concern when applying hybrid meta-heuristic mechanisms. Except for only transmitting the currently best solution of each meta-heuristic branch, another design that transmits all good-performing solutions from one side to replace the poor-performing solutions of the opposite side is evaluated and compared. As shown in Table 10, the HYPO-LocalBest outperforms the original HYPO on all four CEC2019 sampling functions whereas the original HYPO excels on the portfolio optimization problems. During the search, different individuals of a population may have locally optimal solutions of different subcomponents. More locally optimal solutions are transmitted and learnt by the other sides so that the HYPO-LocalBest scheme performs well on such large-scale non-separable functions like F7, F12 and F15 in which the decision variables are dependent upon each other and grouped by several subcomponents.

5. Conclusions

There are various meta-heuristic algorithms conducting different nature-inspired search mechanisms that may succeed in tackling certain optimization problems, yet possibly fail to solve other problems. Accordingly, hybridizing meta-heuristic algorithms into a united framework may help to strengthen the adaptability of the underlying algorithms and potentially solve more optimization problems while speeding up the convergence at different search stages. This is especially the case when solving large-scale optimization problems for which different meta-heuristic approaches can be good at optimizing various subcomponents of the problem at hand. More importantly, the hybrid mechanism is the key to success in developing a cooperative framework in which an intelligent guiding mechanism is included to determine the direction, information, and frequency of exchanges between the key search methods. However, the existing approaches do not carefully consider such a guiding mechanism of a hybrid search framework in a systematic manner, for which the resulting hybrid search framework will prematurely converge to local minima at an early search stage. Therefore, an efficient Hybrid Population-based Optimization (HYPO) framework is proposed in this work in which a systematic guiding scheme named the Dynamic Contribution-based State Transition (DCST) is considered to integrate two prominent meta-heuristic algorithms into the HYPO framework through constantly reviewing their individual contributions to decide the timing and direction of an information exchange between the two concerned search algorithms. Essentially, the DCST scheme is a very adaptive state transition mechanism for guiding the search in which each state transition is determined according to the current contributions of the underlying search algorithms. In other words, the current system state of the DCST is decided by the accumulative performance of each individual search algorithm in the past iterations. To carefully evaluate the performance of the proposed framework, the HYPO approach is compared to other reputed meta-heuristic algorithms on a set of well-known large-scale benchmark functions and a set of portfolio management problems of different dimensions from the real-world financial markets. The results clearly reveal that the HYPO framework significantly outperforms other algorithms on most of the test cases, especially in tackling the large-scale optimization problems with complex features in which the decision variables are not independent. Furthermore, ablation studies are conducted to investigate the possible impacts of directions and information of exchange between the underlying search algorithms. The comparative results undoubtedly demonstrate the effectiveness of the proposed “contribution-based” state transition scheme and the significance of the specific types of transferred information.
More importantly, there are some possible directions that are worth investigating in future studies. First, except for the adjustment of the direction to transfer the relevant information, how to flexibly select different type(s) of information during the exchange process should be carefully examined in order to adapt to the underlying search environments. Second, more meta-heuristic algorithms can be introduced to construct a pool of search strategies in which the adaptive framework may have a wider spectrum of meta-heuristic approaches to select during the search. Last but not least, it is worthwhile to apply the hybrid meta-heuristic framework to tackle large-scale optimization problems in other real-life applications such as flight scheduling, neural network hyperparameter tuning, and circuit design, etc.

Author Contributions

Conceptualization, Z.L. and V.T.; methodology, Z.L. and V.T.; software, Z.L.; validation, Z.L.; formal analysis, Z.L. and V.T.; writing—original draft preparation, Z.L.; writing—review and editing, V.T.; supervision, V.T. All authors have read and agreed to the published version of the manuscript.

Funding

This research received no external funding.

Institutional Review Board Statement

Not applicable.

Informed Consent Statement

Not applicable.

Data Availability Statement

The CEC2019 dataset can be found at http://www.tflsgo.org/special_sessions/cec2019, (accessed on 10 September 2022). The portfolio optimization dataset is collected from the Yahoo Finance (https://finance.yahoo.com), (accessed on 10 September 2022), and the processed data can be downloaded from https://github.com/SteamerLee/HYPO, (accessed on 10 September 2022).

Conflicts of Interest

The authors declare no conflict of interest.

References

  1. Griffis, S.E.; Bell, J.E.; Closs, D.J. Metaheuristics in logistics and supply chain management. J. Bus. Logist. 2012, 33, 90–106. [Google Scholar] [CrossRef]
  2. Musharavati, F.; Ismail, N.; Hamouda, A.M.S.; Ramli, A.R. A metaheuristic approach to manufacturing process planning in reconfigurable manufacturing systems. J. Teknol. 2008, 55â–70â. Available online: https://journals.utm.my/jurnalteknologi/article/view/219 (accessed on 10 September 2022). [CrossRef] [Green Version]
  3. Zhu, H.; Wang, Y.; Wang, K.; Chen, Y. Particle Swarm Optimization (PSO) for the constrained portfolio optimization problem. Expert Syst. Appl. 2011, 38, 10161–10169. [Google Scholar] [CrossRef]
  4. Dey, N.; Ashour, A.S. Meta-heuristic algorithms in medical image segmentation: A review. Adv. Appl. Metaheuristic Comput. 2018, 185–203. Available online: https://www.igi-global.com/chapter/meta-heuristic-algorithms-in-medical-image-segmentation/192005 (accessed on 10 September 2022). [CrossRef]
  5. Wolpert, D.H.; Macready, W.G. No free lunch theorems for optimization. IEEE Trans. Evol. Comput. 1997, 1, 67–82. [Google Scholar] [CrossRef] [Green Version]
  6. Cavalcante, R.C.; Brasileiro, R.C.; Souza, V.L.; Nobrega, J.P.; Oliveira, A.L. Computational intelligence and financial markets: A survey and future directions. Expert Syst. Appl. 2016, 55, 194–211. [Google Scholar] [CrossRef]
  7. Huang, J.; Chai, J.; Cho, S. Deep learning in finance and banking: A literature review and classification. Front. Bus. Res. China 2020, 14, 1–24. [Google Scholar] [CrossRef]
  8. Ding, X.; Zhang, Y.; Liu, T.; Duan, J. Deep learning for event-driven stock prediction. In Proceedings of the Twenty-fourth international joint conference on artificial intelligence, Buenos Aires, Argentina, 25 July–1 August 2015. [Google Scholar]
  9. Weigand, A. Machine learning in empirical asset pricing. Financ. Mark. Portf. Manag. 2019, 33, 93–104. [Google Scholar] [CrossRef]
  10. Ye, Y.; Pei, H.; Wang, B.; Chen, P.Y.; Zhu, Y.; Xiao, J.; Li, B. Reinforcement-learning based portfolio management with augmented asset movement prediction states. Proc. Aaai Conf. Artif. Intell. 2020, 34, 1112–1119. [Google Scholar] [CrossRef]
  11. Huang, A.; Qiu, L.; Li, Z. Applying deep learning method in TVP-VAR model under systematic financial risk monitoring and early warning. J. Comput. Appl. Math. 2021, 382, 113065. [Google Scholar] [CrossRef]
  12. Markowitz, H.M.; Todd, G.P. Mean-Variance Analysis in Portfolio Choice and Capital Markets; John Wiley & Sons: Hoboken, NJ, USA, 2000; Volume 66. [Google Scholar]
  13. French, C.W. The Treynor capital asset pricing model. J. Invest. Manag. 2003, 1, 60–72. [Google Scholar]
  14. Da Silva, A.S.; Lee, W.; Pornrojnangkool, B. The Black–Litterman model for active portfolio management. J. Portf. Manag. 2009, 35, 61–70. [Google Scholar] [CrossRef]
  15. Hakansson, N.H.; Ziemba, W.T. Capital growth theory. Handbooks Oper. Res. Manag. Sci. 1995, 9, 65–86. [Google Scholar]
  16. Heaton, J.B.; Polson, N.G.; Witte, J.H. Deep learning for finance: Deep portfolios. Appl. Stoch. Model. Bus. Ind. 2017, 33, 3–12. [Google Scholar] [CrossRef]
  17. Kumar, M.; Husain, D.; Upreti, N.; Gupta, D. Genetic algorithm: Review and application. Available SSRN 3529843. 2010. Available online: https://papers.ssrn.com/sol3/papers.cfm?abstract_id=3529843 (accessed on 10 September 2022).
  18. Storn, R.; Price, K. Differential evolution–a simple and efficient heuristic for global optimization over continuous spaces. J. Glob. Optim. 1997, 11, 341–359. [Google Scholar] [CrossRef]
  19. Zhang, J.; Sanderson, A.C. JADE: Adaptive differential evolution with optional external archive. IEEE Trans. Evol. Comput. 2009, 13, 945–958. [Google Scholar] [CrossRef]
  20. Sun, G.; Peng, J.; Zhao, R. Differential evolution with individual-dependent and dynamic parameter adjustment. Soft Comput. 2018, 22, 5747–5773. [Google Scholar] [CrossRef]
  21. Cui, L.; Li, G.; Zhu, Z.; Wen, Z.; Lu, N.; Lu, J. A novel differential evolution algorithm with a self-adaptation parameter control method by differential evolution. Soft Comput. 2018, 22, 6171–6190. [Google Scholar] [CrossRef]
  22. Mirjalili, S.; Lewis, A. The whale optimization algorithm. Adv. Eng. Softw. 2016, 95, 51–67. [Google Scholar] [CrossRef]
  23. Poli, R.; Kennedy, J.; Blackwell, T. Particle swarm optimization. Swarm Intell. 2007, 1, 33–57. [Google Scholar] [CrossRef]
  24. Poorzahedy, H.; Rouhani, O.M. Hybrid meta-heuristic algorithms for solving network design problem. Eur. J. Oper. Res. 2007, 182, 578–596. [Google Scholar] [CrossRef]
  25. Sheikh, K.H.; Ahmed, S.; Mukhopadhyay, K.; Singh, P.K.; Yoon, J.H.; Geem, Z.W.; Sarkar, R. EHHM: Electrical harmony based hybrid meta-heuristic for feature selection. IEEE Access 2020, 8, 158125–158141. [Google Scholar] [CrossRef]
  26. Damaševičius, R.; Maskeliūnas, R. Agent state flipping based hybridization of heuristic optimization algorithms: A case of bat algorithm and krill herd hybrid algorithm. Algorithms 2021, 14, 358. [Google Scholar] [CrossRef]
  27. Chi, R.; Su, Y.x.; Zhang, D.h.; Chi, X.x.; Zhang, H.j. A hybridization of cuckoo search and particle swarm optimization for solving optimization problems. Neural Comput. Appl. 2019, 31, 653–670. [Google Scholar] [CrossRef]
  28. Li, Z.; Tam, V.; Yeung, L.K. An adaptive multi-population optimization algorithm for global continuous optimization. IEEE Access 2021, 9, 19960–19989. [Google Scholar] [CrossRef]
  29. Li, Z.; Tam, V.; Yeung, L.K.; Li, Z. Applying an adaptive multi-population optimization algorithm to enhance machine learning models for computational finance. In Proceedings of the 2020 IEEE 22nd International Conference on High Performance Computing and Communications; IEEE 18th International Conference on Smart City; IEEE 6th International Conference on Data Science and Systems (HPCC/SmartCity/DSS), Yanuca Island, Cuvu, Fiji, 14–16 December 2020; pp. 1322–1329. [Google Scholar]
  30. Li, Z.; Tam, V.; Yeung, L.K. A study on parameter sensitivity analysis of the virus spread optimization. In Proceedings of the 2020 IEEE Symposium Series on Computational Intelligence (SSCI), Canberra, ACT, Australia, 1–4 December 2020; pp. 1535–1542. [Google Scholar]
  31. Sun, G.; Yang, B.; Yang, Z.; Xu, G. An adaptive differential evolution with combined strategy for global numerical optimization. Soft Comput. 2020, 24, 6277–6296. [Google Scholar] [CrossRef]
  32. Li, B.; Hoi, S.C. Online portfolio selection: A survey. ACM Comput. Surv. (CSUR) 2014, 46, 1–36. [Google Scholar] [CrossRef]
  33. Agarwal, A.; Hazan, E.; Kale, S.; Schapire, R.E. Algorithms for portfolio management based on the newton method. In Proceedings of the 23rd International Conference on Machine Learning, Pittsburgh, PA, USA, 25–29 June 2006; pp. 9–16. [Google Scholar]
  34. Li, B.; Hoi, S.C.; Zhao, P.; Gopalkrishnan, V. Confidence weighted mean reversion strategy for online portfolio selection. ACM Trans. Knowl. Discov. Data (TKDD) 2013, 7, 1–38. [Google Scholar] [CrossRef]
  35. Huang, D.; Zhou, J.; Li, B.; Hoi, S.C.; Zhou, S. Robust median reversion strategy for online portfolio selection. IEEE Trans. Knowl. Data Eng. 2016, 28, 2480–2493. [Google Scholar] [CrossRef]
  36. Györfi, L.; Lugosi, G.; Udina, F. Nonparametric kernel-based sequential investment strategies. Math. Financ. Int. J. Math. Stat. Financ. Econ. 2006, 16, 337–357. [Google Scholar] [CrossRef]
  37. Hazan, E.; Seshadhri, C. Efficient learning algorithms for changing environments. In Proceedings of the 26th Annual International Conference on Machine Learning, Montreal, QC, Canada, 14–18 June 2009; pp. 393–400. [Google Scholar]
  38. Zhang, Z.; Zohren, S.; Roberts, S. Deep learning for portfolio optimization. J. Financ. Data Sci. 2020, 2, 8–20. [Google Scholar] [CrossRef]
  39. Jiang, Z.; Liang, J. Cryptocurrency portfolio management with deep reinforcement learning. In Proceedings of the 2017 Intelligent Systems Conference (IntelliSys), London, UK, 7–8 September 2017; pp. 905–913. [Google Scholar]
  40. Wang, Z.; Huang, B.; Tu, S.; Zhang, K.; Xu, L. DeepTrader: A Deep Reinforcement Learning Approach for Risk-Return Balanced Portfolio Management with Market Conditions Embedding. In Proceedings of the AAAI Conference on Artificial Intelligence, Online, 2–9 February 2021; Volume 35, pp. 643–650. [Google Scholar]
  41. Ammar, E.; Khalifa, H.A. Fuzzy portfolio optimization a quadratic programming approach. Chaos Solitons Fractals 2003, 18, 1045–1054. [Google Scholar] [CrossRef]
  42. Wang, J.; He, F.; Shi, X. Numerical solution of a general interval quadratic programming model for portfolio selection. PLoS ONE 2019, 14, e0212913. [Google Scholar] [CrossRef] [PubMed] [Green Version]
  43. Chang, T.J.; Yang, S.C.; Chang, K.J. Portfolio optimization problems in different risk measures using genetic algorithm. Expert Syst. Appl. 2009, 36, 10529–10537. [Google Scholar] [CrossRef]
  44. Bacanin, N.; Tuba, M. Firefly algorithm for cardinality constrained mean-variance portfolio optimization problem with entropy diversity constraint. Sci. World J. 2014. [CrossRef] [PubMed] [Green Version]
  45. Kaucic, M.; Moradi, M.; Mirzazadeh, M. Portfolio optimization by improved NSGA-II and SPEA 2 based on different risk measures. Financ. Innov. 2019, 5, 1–28. [Google Scholar] [CrossRef]
  46. Qin, A.K.; Huang, V.L.; Suganthan, P.N. Differential evolution algorithm with strategy adaptation for global numerical optimization. IEEE Trans. Evol. Comput. 2008, 13, 398–417. [Google Scholar] [CrossRef]
  47. Li, X.; Tang, K.; Omidvar, M.N.; Yang, Z.; Qin, K.; China, H. Benchmark functions for the CEC 2013 special session and competition on large-scale global optimization. Gene 2013, 7, 8. [Google Scholar]
  48. Derrac, J.; García, S.; Molina, D.; Herrera, F. A practical tutorial on the use of nonparametric statistical tests as a methodology for comparing evolutionary and swarm intelligence algorithms. Swarm Evol. Comput. 2011, 1, 3–18. [Google Scholar] [CrossRef]
Figure 1. The Flowchart of the AMPO Approach.
Algorithms 15 00404 g001
Figure 2. The Architecture of the Proposed HYPO Framework.
Algorithms 15 00404 g002
Figure 3. The Example of State Transition.
Algorithms 15 00404 g003
Figure 4. The Comparison of the Convergence on the CEC2019 Set.
Algorithms 15 00404 g004
Figure 5. The Example of Transformation between the Solution of Algorithms and Weights of Assets in a Portfolio.
Algorithms 15 00404 g005
Figure 6. Visualization of Mean-variance Distribution on the SP500 Set.
Algorithms 15 00404 g006
Figure 7. Visualization of Mean-variance Distribution on the CSI300 Set.
Algorithms 15 00404 g007
Figure 8. Visualization of Mean-variance Distribution on the Mixed Market Set.
Algorithms 15 00404 g008
Table 1. The Parameter Settings of Compared Algorithms.
AlgorithmsParameter Settings
GA T o u r n a m e n t S i z e = 3 , P e r t u r b a t i o n R a t e = 0.1
PSO ω = 0.8 , c 1 = 0.5 , c 2 = 0.5
WOA b = 1
DE F = 0.5 , C R = 0.3
AMPO P L S L D = 0.8 , P L S L S = 0.8 , P R = 0.6 , ω = 0.1 , γ = 0.9
CSDE F P = 200
SADE L P = 40 , F m e a n = 0.5 , F s t d = 0.3 , C R m e a n = 0.5 , C R s t d = 0.1
HYPO T B i = 2 , T s t a b l e = 2 , T t r i g g e r = 10
Table 2. Comparative Results on the CEC2019 Set.
Func.MetricGAPSOWOADEAMPOCSDESADEHYPO
F1Mean3.95×10 10 1.85×10 11 7.88×10 9 2.74×10 10 8.47×10 7 7.72×10 2 2.20×10 5 1.23×10 5
Std.8.21×10 8 1.93×10 10 4.82×10 8 3.00×10 9 1.15×10 8 1.94×10 3 4.62×10 5 8.02×10 4
+/=/-+++++--
F2Mean2.45×10 4 6.82×10 4 3.74×10 4 2.44×10 4 1.13×10 4 2.66×10 3 1.87×10 4 2.01×10 4
Std.2.49×10 2 5.84×10 3 5.57×10 2 8.94×10 2 6.05×10 2 2.26×10 2 3.02×10 3 1.01×10 3
+/=/-++++--=
F3Mean2.16×10 1 2.15×10 1 2.16×10 1 2.15×10 1 2.07×10 1 2.08×10 1 2.07×10 1 2.05×10 1
Std.4.52×10 3 2.28×10 2 1.56×10 2 4.41×10 3 3.07×10 2 2.22×10 2 8.69×10 3 7.74×10 2
+/=/-+++++++
F4Mean1.16×10 12 3.67×10 12 7.03×10 11 3.15×10 11 1.65×10 11 4.05×10 10 7.59×10 9 2.48×10 9
Std.6.91×10 10 1.38×10 12 6.80×10 10 6.06×10 10 1.33×10 10 1.96×10 10 2.89×10 9 7.59×10 8
+/=/-+++++++
F5Mean1.02×10 7 3.17×10 7 3.16×10 7 8.18×10 6 4.24×10 6 1.70×10 6 4.59×10 6 1.18×10 7
Std.2.34×10 5 3.91×10 6 3.45×10 6 7.37×10 5 9.02×10 5 4.17×10 5 8.43×10 5 3.82×10 6
+/=/--++----
F6Mean1.06×10 6 1.05×10 6 1.06×10 6 1.06×10 6 1.05×10 6 1.05×10 6 1.05×10 6 1.03×10 6
Std.8.65×10 2 3.16×10 3 2.75×10 3 9.49×10 2 6.65×10 3 3.51×10 3 7.50×10 3 1.43×10 4
+/=/-+++++++
F7Mean6.15×10 9 1.02×10 13 7.15×10 9 1.57×10 9 2.00×10 8 1.96×10 8 1.72×10 7 3.79×10 6
Std.5.88×10 8 9.79×10 12 3.76×10 9 6.68×10 8 5.37×10 7 1.68×10 8 9.20×10 6 1.40×10 6
+/=/-+++++++
F8Mean1.24×10 16 9.40×10 16 4.71×10 15 2.57×10 15 3.90×10 14 2.42×10 14 8.43×10 13 4.66×10 13
Std.2.36×10 15 5.92×10 16 2.04×10 15 7.94×10 14 1.78×10 14 1.30×10 14 3.45×10 13 2.45×10 13
+/=/-+++++++
F9Mean8.03×10 8 2.66×10 9 2.65×10 9 6.62×10 8 4.87×10 8 1.75×10 8 4.07×10 8 9.13×10 8
Std.1.61×10 7 4.47×10 8 4.05×10 8 3.81×10 7 8.08×10 7 1.70×10 7 6.23×10 7 1.95×10 8
+/=/--++----
F10Mean9.40×10 7 9.32×10 7 9.34×10 7 9.40×10 7 9.27×10 7 9.30×10 7 9.30×10 7 9.20×10 7
Std.2.83×10 5 3.96×10 5 4.32×10 5 2.22×10 5 5.10×10 5 4.21×10 5 6.59×10 5 9.27×10 5
+/=/-+++++++
F11Mean1.20×10 12 1.79×10 15 6.56×10 11 3.64×10 11 3.75×10 9 2.30×10 9 2.09×10 9 3.85×10 8
Std.1.05×10 11 1.10×10 15 8.70×10 11 1.43×10 11 5.07×10 8 1.89×10 9 3.97×10 9 9.14×10 7
+/=/-+++++++
F12Mean5.07×10 11 3.74×10 12 4.54×10 9 9.05×10 11 4.00×10 4 7.97×10 3 1.23×10 7 1.52×10 3
Std.1.06×10 10 2.43×10 11 4.94×10 8 6.62×10 10 5.29×10 4 4.39×10 3 3.42×10 7 1.88×10 2
+/=/-+++++++
F13Mean3.85×10 11 1.56×10 15 9.15×10 10 1.44×10 11 5.06×10 9 7.15×10 9 1.19×10 9 1.63×10 8
Std.2.69×10 10 1.37×10 15 3.68×10 10 7.71×10 10 8.88×10 8 2.72×10 9 3.58×10 8 7.63×10 7
+/=/-+++++++
F14Mean3.32×10 12 3.97×10 15 1.45×10 12 6.65×10 11 2.07×10 10 3.34×10 10 8.85×10 9 1.17×10 8
Std.2.31×10 11 3.29×10 15 6.61×10 11 1.59×10 11 1.09×10 10 2.32×10 10 6.63×10 9 2.07×10 7
+/=/-+++++++
F15Mean6.22×10 9 1.28×10 16 3.29×10 10 3.27×10 13 9.79×10 7 1.99×10 7 1.34×10 7 6.23×10 6
Std.2.94×10 9 1.37×10 16 1.14×10 10 1.21×10 13 2.79×10 7 5.68×10 6 4.82×10 6 3.96×10 5
+/=/-+++++++
Table 3. The Significant Test on the CEC2019 Set.
GAPSOWOADEAMPOCSDESADE
+/=/-13/0/215/0/015/0/013/0/212/0/311/0/411/1/3
Table 4. The CPU Time Comparison on the CEC2019 Set.
Func.GAPSOWOADEAMPOCSDESADEHYPO
F1638.22317.07595.80756.88539.18906.76903.65993.66
F2769.90371.86732.57906.73589.001047.101032.581107.29
F3787.34378.54763.77918.48589.401053.281048.541121.27
F4664.01348.81642.87809.08574.21951.11964.521037.94
F5842.39408.55798.041003.58636.221096.681218.801188.41
F6799.28428.90778.36961.12646.371091.011212.151192.42
F7289.29159.16275.36522.87396.95582.48669.38657.20
F8798.13450.79786.29941.81681.641057.111183.891179.93
F9957.95515.62938.901124.20754.761220.32854.171327.15
F10920.01520.04934.951079.48760.351211.56882.741257.85
F11747.12439.60745.37910.93679.181010.10777.871053.56
F12109.1957.1397.17225.75289.52386.91381.35408.64
F13764.05440.75743.65941.31666.621043.53771.911059.93
F14741.46432.56749.63896.82657.371039.93775.991055.90
F15560.72295.09514.90707.74518.65825.21627.32857.73
Unit: CPU Second(s).
Table 5. The Descriptions of Portfolio Optimization Datasets.
Market IndexSP500CSI300Mix
Trading Days125812131148
Risk-free Rate1.65753.03702.0042
Number of Stocks490239788
Testing Scale of Portfolios50, 100, 150, 200, 239100, 200, 300, 400, 490100, 200, 400, 600, 788
Table 6. Comparative Results on the SP500 Set.
Dim.MetricGAPSOWOADEAMPOCSDESADEHYPO
100SR Mean1.12190.97711.17651.40511.51371.51521.52071.5207
SR Std.4.61×10 3 1.99×10 2 1.30×10 1 2.42×10 2 1.13×10 2 8.84×10 3 1.03×10 6 2.76×10 6
+/=/-++++++-
200SR Mean1.05830.90851.07931.30041.66181.61371.67491.6840
SR Std.3.87×10 3 1.70×10 2 1.13×10 1 2.13×10 2 1.38×10 2 3.12×10 2 1.29×10 2 1.72×10 5
+/=/-+++++++
300SR Mean1.04560.89161.25931.31252.03231.85492.00742.0893
SR Std.2.75×10 3 1.43×10 2 2.90×10 1 2.99×10 2 4.78×10 2 6.61×10 2 6.36×10 2 1.47×10 5
+/=/-+++++++
400SR Mean0.99770.84951.23341.21271.93981.69841.83342.0894
SR Std.2.50×10 3 9.26×10 3 3.12×10 1 1.94×10 2 4.69×10 2 4.35×10 2 5.27×10 2 5.00×10 5
+/=/-+++++++
490SR Mean0.90350.76311.13911.09881.83711.58221.70652.0891
SR Std.2.87×10 3 1.12×10 2 3.53×10 1 2.21×10 2 4.63×10 2 3.66×10 2 5.65×10 2 1.82×10 3
+/=/-+++++++
Table 7. Comparative Results on the CSI300 Set.
Dim.MetricGAPSOWOADEAMPOCSDESADEHYPO
50SR Mean1.67561.53271.66921.84611.84801.84821.84821.8482
SR Std.4.23×10 3 5.11×10 2 7.74×10 2 6.31×10 3 6.60×10 4 2.68×10 6 7.22×10 9 3.30×10 7
+/=/-++++=--
100SR Mean1.65031.42991.61251.89561.98541.98671.98811.9881
SR Std.4.74×10 3 3.69×10 2 1.03×10 1 1.81×10 2 3.58×10 3 1.67×10 3 1.53×10 5 5.20×10 5
+/=/-+++++++
150SR Mean1.57611.31801.52891.85262.02222.01992.03142.0317
SR Std.5.03×10 3 3.56×10 2 1.13×10 1 2.20×10 2 1.22×10 2 1.08×10 2 1.94×10 4 2.55×10 5
+/=/-+++++++
200SR Mean1.48101.22711.46711.77432.03702.02262.05992.0682
SR Std.6.26×10 3 2.71×10 2 1.34×10 1 2.17×10 2 2.40×10 2 1.26×10 2 9.82×10 3 7.41×10 5
+/=/-+++++++
239SR Mean1.41291.16021.42841.70862.02481.97032.03162.0703
SR Std.4.94×10 3 2.28×10 2 1.40×10 1 2.83×10 2 2.02×10 2 2.36×10 2 1.95×10 2 1.48×10 4
+/=/-+++++++
Table 8. Comparative Results on the Mixed Market Set.
Dim.MetricGAPSOWOADEAMPOCSDESADEHYPO
100SR Mean1.78381.49921.83612.13232.20992.21122.21612.2161
SR Std.7.76×10 3 3.44×10 2 1.08×10 1 1.75×10 2 7.41×10 3 3.80×10 3 1.54×10 5 2.48×10 5
+/=/-++++++-
200SR Mean1.69311.49001.78992.08522.35612.35782.41332.4285
SR Std.5.76×10 3 3.42×10 2 1.40×10 1 3.55×10 2 6.33×10 2 2.08×10 2 1.59×10 2 1.00×10 4
+/=/-+++++++
400SR Mean1.59501.36241.80901.97962.54972.52512.66592.8473
SR Std.5.04×10 3 3.03×10 2 2.67×10 1 2.66×10 2 1.65×10 1 5.66×10 2 5.38×10 2 1.47×10 3
+/=/-+++++++
600SR Mean1.50311.29051.74871.80342.45442.38372.48382.8804
SR Std.4.88×10 3 1.85×10 2 1.85×10 1 3.27×10 2 1.21×10 1 5.45×10 2 3.65×10 2 1.96×10 3
+/=/-+++++++
788SR Mean1.36241.16271.63721.62772.27652.21802.29092.8804
SR Std.3.09×10 3 1.80×10 2 2.50×10 1 3.10×10 2 1.25×10 1 6.00×10 2 4.35×10 2 7.80×10 3
+/=/-+++++++
Table 9. Comparative Results on Different Settings of Transition Directions.
Func.MetricUni-AMPO-CSDEUni-CSDE-AMPOBi-AMPO-CSDENo-ExchangeHYPO
F3Fit Mean2.08×10 1 2.08×10 1 2.06×10 1 2.08×10 1 2.05×10 1
Std.1.97×10 2 2.33×10 2 1.29×10 1 2.28×10 2 7.74×10 2
F7Fit Mean1.69×10 8 2.16×10 8 4.70×10 6 2.27×10 8 3.79×10 6
Std.4.44×10 7 4.62×10 7 1.17×10 6 6.74×10 7 1.40×10 6
F12Fit Mean1.99×10 4 3.35×10 4 1.38×10 3 6.56×10 4 1.52×10 3
Std.1.30×10 4 3.96×10 4 2.04×10 2 6.28×10 4 1.88×10 2
F15Fit Mean2.18×10 7 4.95×10 7 5.72×10 6 6.03×10 7 6.23×10 6
Std.5.71×10 6 2.62×10 7 4.86×10 5 3.93×10 7 3.96×10 5
SP500-490DimSR Mean1.70401.27152.07911.43772.0891
Std.3.16×10 1 2.47×10 2 1.16×10 2 2.06×10 1 1.82×10 3
CSI300-239DimSR Mean1.88431.80822.07001.80102.0703
Std.2.54×10 2 2.61×10 2 2.86×10 3 2.74×10 2 1.48×10 4
Mix-788DimSR Mean2.09521.89162.85211.92392.8804
Std.1.24×10 1 4.10×10 2 2.04×10 2 8.09×10 2 7.80×10 3
Table 10. Comparative Results on Different Types of Information being Transmitted.
Func.MetricHYPO-LocalBestHYPO
F3Fit Mean2.05×10 1 2.05×10 1
Std.1.00×10 1 7.74×10 2
F7Fit Mean3.09×10 6 3.79×10 6
Std.1.18×10 6 1.40×10 6
F12Fit Mean1.29×10 3 1.52×10 3
Std.1.39×10 2 1.88×10 2
F15Fit Mean6.01×10 6 6.23×10 6
Std.6.61×10 5 3.96×10 5
SP500-490DimSR Mean2.01282.0891
Std.4.81×10 2 1.82×10 3
CSI300-239DimSR Mean2.05462.0703
Std.1.35×10 2 1.48×10 4
Mix-788DimSR Mean2.74742.8804
Std.5.36×10 2 7.80×10 3
Publisher’s Note: MDPI stays neutral with regard to jurisdictional claims in published maps and institutional affiliations.

