Article

Using Explainable AI (XAI) for the Prediction of Falls in the Older Population

by
Yue Ting Tang
1,* and
Roman Romero-Ortuno
1,2,3,*
1
School of Medicine, Trinity College Dublin, D02 R590 Dublin, Ireland
2
Mercer’s Institute for Successful Ageing, St. James’s Hospital, D08 N80H Dublin, Ireland
3
The Irish Longitudinal Study on Ageing (TILDA), Trinity College Dublin, D02 R590 Dublin, Ireland
*
Authors to whom correspondence should be addressed.
Algorithms 2022, 15(10), 353; https://doi.org/10.3390/a15100353
Submission received: 28 August 2022 / Revised: 25 September 2022 / Accepted: 26 September 2022 / Published: 28 September 2022

Abstract

:
The prevention of falls in older people requires the identification of the most important risk factors. Frailty is associated with risk of falls, but not all falls are of the same nature. In this work, we utilised data from The Irish Longitudinal Study on Ageing to implement Random Forests and Explainable Artificial Intelligence (XAI) techniques for the prediction of different types of falls and analysed their contributory factors using 46 input features that included those of a previously investigated frailty index. Data of participants aged 65 years and older were fed into four random forest models (all falls or syncope, simple fall, complex fall, and syncope). Feature importance rankings were based on mean decrease in impurity, and Shapley additive explanations values were calculated and visualised. Female sex and a previous fall were found to be of high importance in all of the models, and polypharmacy (being on five or more regular medications) was ranked high in the syncope model. The more ‘accidental’ (extrinsic) nature of simple falls was demonstrated in its model, where the presence of many frailty features had negative model contributions. Our results highlight that falls in older people are heterogenous and XAI can provide new insights to help their prevention.

1. Introduction

The clinically heterogenous character of falls in older people has long challenged clinicians in their prevention and management. Falls can lead to reduced mobility, hospitalisations, and a reduced quality of life which are associated with physical and psychological restrictions post-fall [1]. In 2004, the economic cost of falls and fractures in older adults aged 65 years and over in Ireland was estimated to be €402 million, thus representing 0.32% of the Gross National Product; and with the assumption of technological improvements but the absence of a national strategy on fracture risk reduction, the projection of this cost over 25 years is estimated to be a staggering €1587 million by 2030 [2]. In response, the Strategy to Prevent Falls and Fractures in Ireland’s Ageing Population was launched as a collective recognition of the high economic, social, and health consequences of falls [3]. This strategy mirrors the UK’s 2013 National Institute for Health and Care Excellence (NICE) guidelines in that they also recommend a multifactorial risk assessment, ideally within a specialised falls service, after an older person has experienced a fall or demonstrated abnormalities in their gait and balance [4]. This prompt, multifaceted assessment is particularly important when falls are recurrent, unexplained, and/or injurious because these types of falls tend to have worse clinical outcomes [5,6].
The use of Artificial Intelligence (AI) in the research of fall prediction is not a new concept, with previous topics in the literature ranging from the use of sensors to capture gait features [7], to the study of the biomarkers for the prediction of physiological reserve [8] and frailty [9,10], which are concepts that are closely intertwined with fall risks in the older population [11].
Explainable AI, or XAI, is used to describe a set of techniques that is aimed at making the results of AI models more comprehensible to its human users [12]. AI models have been commonly classified into white box and black box, with white box models such as Random Forest and Decision Trees being easier to understand by the end-users, and black box models such as Neural Networks being more difficult to explain in terms of their inner workings and how the final outputs are derived [13]. There is potential value in XAI within the healthcare sector, where understanding how AI algorithms handle data inputs is crucial in ensuring the trustworthiness of their outputs for real-life clinical decision making [14]. Indeed, explainability can facilitate the implementation of AI in healthcare [15].
A previous falls prediction effort that was based on the simple arithmetic sum of individual health deficits (frailty index) offered significant results but with low degree of explainability [6]. However, by implementing XAI, new insights may be obtained through us being able to understand which features are the most important, and how they influence the prediction outcome. The transparency of the model’s behaviour also allows for error correction and the improvement of the model performance. These are crucial in the healthcare field where inaccurate clinical decisions could lead to adverse consequences for patients. Moreover, with the increasing implementation of AI in healthcare settings, compliance with the European General Data Protection Regulation (GDPR) is ever more important. In that regard, compared to black box algorithms, XAI techniques are better placed to support the compliance with the “right to explanation”, which is the right to be given an explanation for the output of an algorithm [14,16].
With the ability to process large amounts of data and perform complex computational tasks, and backed by the insurgence of electronic health records and other large health databases, there are increasing opportunities for AI to be implemented within both the research and clinical fields of medicine. In that regard, the increasing availability of publicly archived datasets pertaining to major longitudinal studies of ageing presents a unique opportunity to employ XAI techniques for the prediction of common clinical conditions in older people and gain unique insights into their prevention. The development of a clinically useful XAI model for the prediction of future falls could provide insights into their multi-etiological character and identify the most important predictors, which could in turn inform the screening and clinical management efforts towards their prevention.
In this work, we utilised the large, publicly available data resource from The Irish Longitudinal Study on Ageing (TILDA) to implement Random Forests and XAI techniques for the prediction of different types of falls and analyse their contributory factors using input features that included those of a previously investigated frailty index [6].

2. Materials and Methods

2.1. Dataset

TILDA is a national longitudinal population study of adults aged 50 years and over in Ireland [17]. Having been started in 2009, the dataset stores a comprehensive collection of information from over 8000 participants including their pre-existing medical conditions, physical biomarkers, and socioeconomic characteristics. New data from both existing and new participants are collected every approximately 2 years. In this study, data from Wave 1, which were collected between October 2009 and February 2011, were used for the input features, while data from Waves 2, 3 and 4, which were collected between April 2012 and December 2016, were used for the outputs. TILDA data were accessed via the Irish Social Science Data Archive—www.ucd.ie/issda (accessed on 1 July 2020).

2.2. Input Features

A total of 46 features were used. The majority of the input features were taken from the previously investigated Syncope-Falls Index (SYFI), a 40-deficit frailty index which was derived from the simple arithmetic sum of 40 health deficits selected from TILDA Wave 1 which was based on their clinically postulated likelihood of increasing the risk of syncope and falls within the older population [6]. Age and sex, which were not originally included in the SYFI, were also included as input features in the present work. The remaining 4 features, namely “Fall in the last year” (yes or no), “Any previous history of blackout/faint” (present or absent), “Frequent fainter when young” (present or absent), and “Afraid of falling” (present or absent) were included as additional features that were potentially associated with the future risk of falls.
Except for age at the time of Wave 1 data collection, which was used as a continuous variable, all of the input features were binary, where the presence of the feature was recorded as “1” and its absence as “0”. To ensure consistency with the previous SYFI study, only participants aged 65 years and over at the time of the first interview (Wave 1) were included. Table 1 summarises the 46 input features that were utilised in the present study. Details of the 40 SYFI deficits have been described elsewhere [6].

2.3. Future Falls

Falls were classified into the following types: simple, complex, and syncope. As previously described [6], simple falls were defined as accidental ones (e.g., a single slip or trip), while complex falls were defined as recurrent, unexplained, and/or injurious ones. Syncope was defined as a recollected transient loss of consciousness, which is characterised by a rapid onset, a short duration of the event, and a spontaneous, complete recovery [18]. The outcome of each model was specified as a participant reporting at least one fall by the end of Wave 4, which represents an approximate 6-year interval from their first participation in TILDA Wave 1. The occurrence of a fall which was recorded at least once in Wave 2, 3, or 4 was coded as “1”, and the absence of a fall was recorded as “0”.

2.4. Random Forests and Feature Relevance

Various applications of random forests in medicine have been described [19,20]. In the present study, random forests were used as a classifier for the above-mentioned 46 features to predict simple falls, complex falls, or syncope among participants over a 6-year period. RandomForestClassifier in the Scikit-learn Python package was used for the construction of the random forest models, and GridSearchCV was implemented to tune the hyperparameters of the models. Shapley additive explanations (SHAP) and random forest feature importance were then used to explain the prediction models that were created.
Feature importance can also be derived from the random forest models by calculating the mean decrease in impurity (MDI) [21]. The most important features are utilised earlier as splitting attributes at the top of the tree, and these continue downwards according to the order of their importance. The decision tree identifies the feature importance based on its Gini coefficient, which measures the probability of a particular variable being wrongly classified when it is randomly chosen. The lower the Gini coefficient of a feature is, the more important the decision tree deems the feature to be in its classification [22]. In the context of random forests, the final feature importance is derived from the average of the impurity decrease across all of the trees [21].
With its origins from game theory, SHAP is a technique that can be applied to predictive models to enhance their explainability [23]. This is because with SHAP, the individual contribution towards each prediction can be observed in comparison to other techniques that only present the aggregate contribution. For each input feature, SHAP measures its contribution to the model. SHAP values also indicate if the feature contributes positively or negatively towards the output, which in this case is the prediction of a future fall.

2.5. Classification Performance Measures

To assess the overall performance of the random forest models, the precision, recall, and F1-score were utilised. The precision score is the number of correct predictions of a class which is divided by the total number of times that the model predicted that class, while the recall score is the number of correct predictions of a class over the total number of members in that class. The F1 score is the harmonic average of both the precision and recall scores, and it provides a single value of the classification performance for each class [24].

2.6. Workflow Summary

The workflow process of the present study is summarised as follows:
  • Extraction of data from the TILDA database.
  • Data processing and cleaning (removing data with missing values, removing duplicate data, and encoding binary variables).
  • Building random forest prediction models (all falls and syncope model; simple falls model; complex falls model; syncope model).
    • Python 3 programming language was used on the Anaconda platform.
    • GridSearchCV package was implemented for tuning of hyperparameters.
  • Assessing the model’s performance by calculating the precision, recall and F1 scores.
  • Feature relevance: SHAP and random forest feature importances were derived from the four models.

2.7. Detailed Code

The full code that was used to build the models can be accessed through the following links:

3. Results

3.1. Dataset

Of the 8504 TILDA Wave 1 participants, 3499 were aged 65 or more years. By Wave 4, 599 of the participants (17.1% of Wave 1 sample) did not provide information for the 6-year outcomes. This resulted in the data of 2900 participants being included in this study. Out of the 2900 samples, 217 simple falls, 1077 complex falls, and 185 syncope episodes were recorded. The random oversampling of the smaller class was performed in all of the models to preserve the model performance in consideration of the class imbalance. The dataset size of each model is presented in Table 2.

3.2. Prediction Performance

The precision, recall, and F1 scores for each model are presented in Table 3.

3.3. Feature Importance
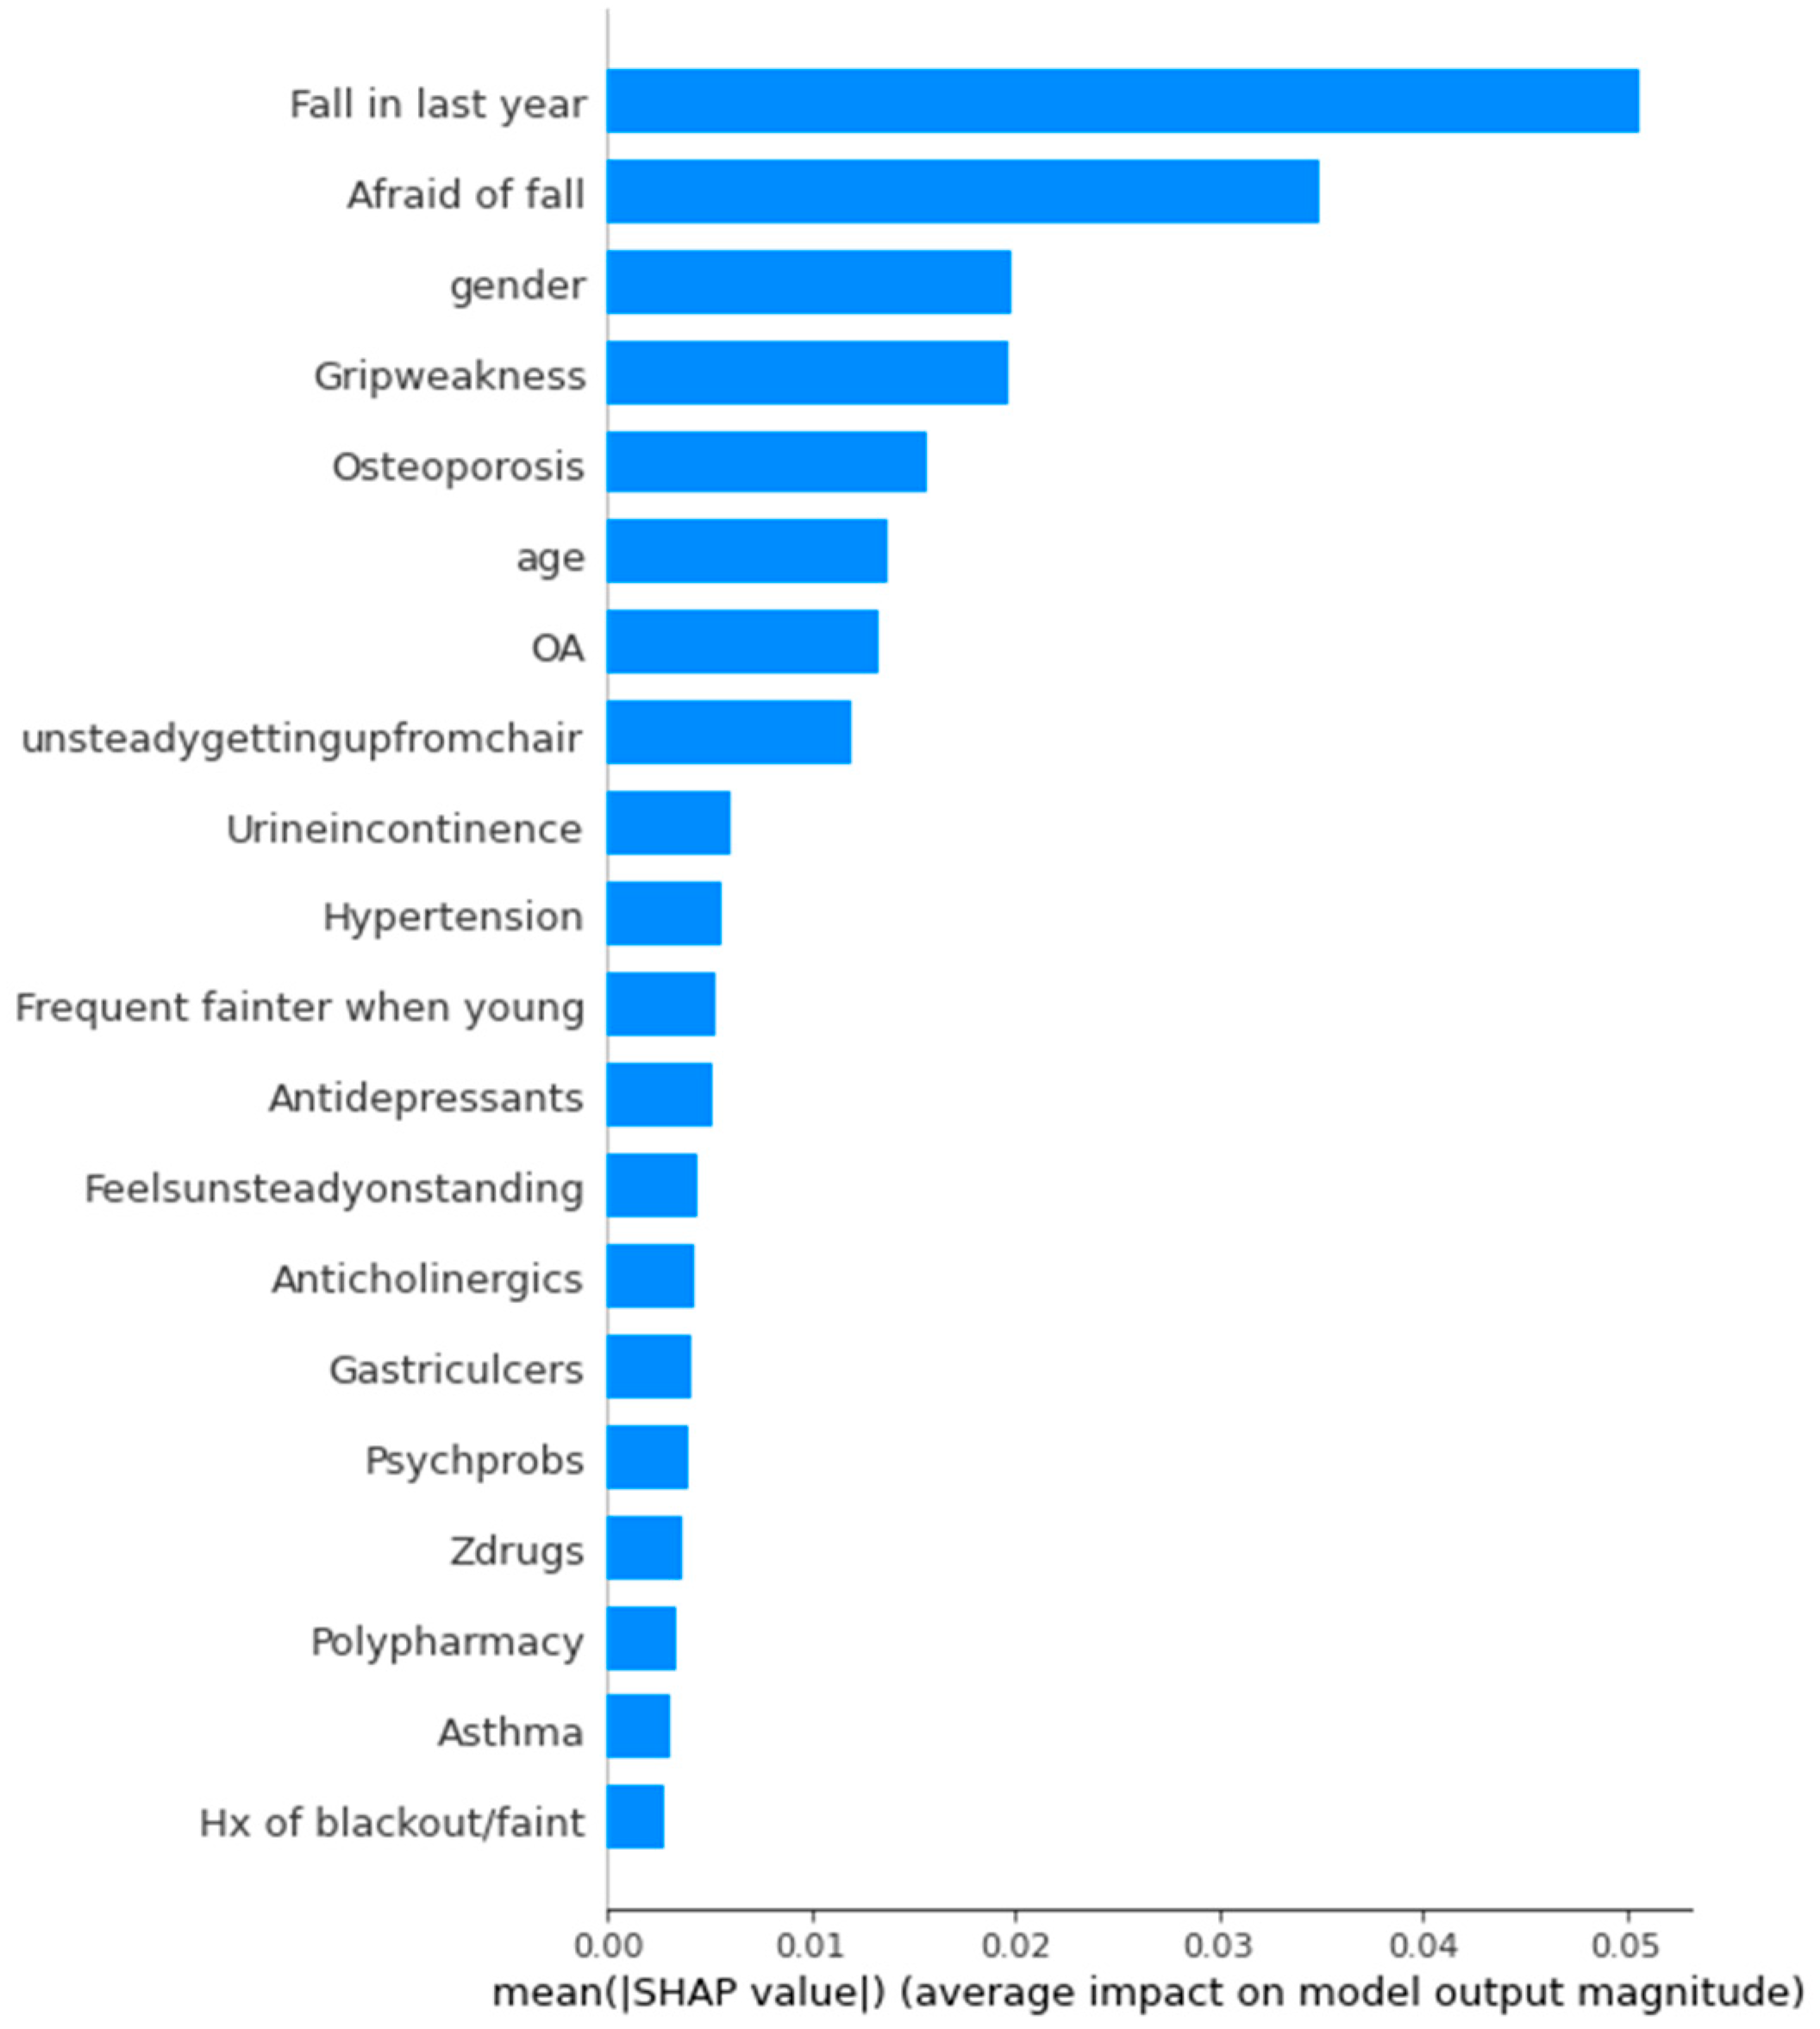
The most important 20 features in each model based on their MDI are shown in Table 4, Table 5, Table 6 and Table 7.

3.4. SHAP Values

A summary and the bar plots containing the top 20 features of the highest mean absolute SHAP values for each model are presented in Figure 1, Figure 2, Figure 3, Figure 4, Figure 5, Figure 6, Figure 7 and Figure 8. The SHAP value summary plot shows the spread of every SHAP value that was calculated for every feature in each sample. The colour of the plots represents the feature value, with ‘1’ being represented as red and ‘0’ represented being blue for the binary variables. For age, the colour changes from blue to red with an increasing feature value. The summary plot visualises the distribution of the SHAP values for each feature whilst ranking the feature according to the mean absolute SHAP values. Alternatively, this can be observed in the bar plot, which provides a comparison of the mean absolute SHAP values of the top 20 features.

4. Discussion

In this work, we utilised the large, publicly available TILDA dataset to implement Random Forests and XAI techniques for the prediction of different types of future falls and analysed their contributory factors using 46 input features. Being of the female sex and having had a previous fall were found to be high in the feature importance ranking in all of the models, and polypharmacy (being on five or more regular medications) was ranked high in the syncope model. The accidental (or more ‘extrinsic’) nature of simple falls was demonstrated in this model, where the presence of many frailty features showed negative model contributions.

4.1. Accuracy of Prediction

From the results in Table 3 (precision, recall, and F1 score for each model), it can be observed that both the syncope and simple falls models (overall accuracy of 0.83 and 0.79 in the Kaggle outputs, respectively) had a better prediction performance, while the all falls and syncope and complex falls models had a more modest performance (overall accuracy of 0.60 in the Kaggle outputs).
The performance of our XAI algorithms to predict future falls in TILDA can be compared to that of a recent TILDA study which utilised conditional inference forests and included additional input features that were not available in the public TILDA dataset. Compared to the present study, their study showed a lower overall accuracy for future syncope (0.62), and similarly low predictive accuracy for future recurrent, injurious, and unexplained falls [25]. However, it is possible that our achievement of higher accuracy for syncope may be explained by the higher degree of class imbalance in the model, thereby resulting in a larger number of times that the data belonging to the smaller class was duplicated. This could also apply to our simple falls model, which also had higher overall accuracy. By being trained on more duplicates, a model could be more likely to correctly predict the classes of the duplicates in the test dataset.
However, it is of contextual importance that in community-dwelling older adults, the prediction of falls remains elusive, and a recent systematic review showed that existing prognostic models had high risk of presenting a bias, rendering them unreliable for prediction applications in clinical practice, and in the few validated models that have been reviewed, the area under the curve ranged from 0.62 to 0.69 [26]. This low predictability could be related to the fact that in community-dwelling older people, the occurrence of falls is, overall, infrequent. In contrast, a study that was looking at various AI models, consisting of calculations of the bagging, random forest, adaptive boosting and classification trees for inpatient fall risk prediction using electronic health records, showed that they had more accurate predictions [27].

4.2. All Falls and Syncope

Judging by the feature importance scores (≥0.1), the model would suggest that if a clinician was interested in predicting any future falls or syncope over a six year period, the most important features to consider would be whether a fall had occurred in the last year and their age. The highest SHAP feature importance score was also for whether a fall had occurred in the last year, which was followed by their sex (being female had a positive impact on model output), and a fear of falling. In keeping with the literature [28,29], higher age values tended to contribute positively to the model, with the opposite being generally true; however, the SHAP plot allowed us to appreciate a degree of heterogeneity (i.e., with some older—more red—participants having a negative impact, and some younger participants —more blue—having a positive impact). This interesting nuance that is evidenced by XAI is helpful for reminding clinicians that despite it having average effects, individual disagreements with the norm are not uncommon. Previous falls have also been highlighted in the literature as being predictive of future falls [26], and the top importance of them having had a fall in the last year in our model resonates with the top clinical recommendation by NICE that older people who are in contact with healthcare professionals should be asked routinely whether they have fallen in the past year [4].
The fact that female sex contributed towards the prediction of all falls and syncope is consistent with the literature, which suggests that women are more prone to falls than men [30,31]. The SHAP summary plot demonstrated that there was little deviation over the SHAP values of sex between the samples, thereby suggesting that there was little variability amongst samples of the contribution of the sex feature towards the final output. This contrasted with the features such as having had a fall in last year, where a large variance in the SHAP values could be seen. This suggests that the importance of this feature to the prediction that is makes may differ from person to person.
There was also a general trend where the absence of a binary feature which was represented by a blue spot on the summary plot had a lesser impact on the model output as compared to the presence of the feature. This may be observed on the SHAP summary plot as larger absolute SHAP values for the red dots in comparison to the corresponding blue ones. It may be suggested that the presence of a feature is much more relevant to the prediction of a fall, rather than its absence. A clear example of this is being on Z-drugs, as is highlighted in the literature [32].

4.3. Simple Falls

Judging by feature importance scores (≥0.1), age was the most important feature in the prediction of future simple falls. However, in the SHAP summary plot, there was also some individual age heterogeneity. The highest SHAP feature importance scores were for age, sex, having a myocardial infarction, and having had a fall in the last year. However, the presence of a myocardial infarction had negative contribution to the model. The SHAP summary plot also showed a similar effect for other features such as weight loss, being unsteady while standing, being unsteady when one is getting up from chair, and having a cognitive impairment, COPD, asthma, and osteoporosis. This may be due to the likely more “extrinsic” (e.g., environmental) nature of simple falls, with them having a less likely influence on the “intrinsic” morbidity factors. Yet, the presence of other features such as urine incontinence, an abnormal heart rhythm, poor hearing, a poor sense of smell, and psychiatric problems had positive contributions to these. Overall, the findings from the simple falls model are helpful for reminding clinicians that falls in the older population with comorbidities are less likely to be “accidental” or even “mechanical”, and hence, they warrant a timely multifactorial assessment as recommended by the NICE guidelines [4].

4.4. Complex Falls

Judging by feature importance scores (≥0.1), the top features were them having had a fall in the last year and their age. In the SHAP summary plot, having had a fall in the last year and having a fear of falling were also the most important features, which were followed by sex (being female had a positive impact on model output), having grip weakness, osteoporosis, and their age (older generally having a more positive impact on model output).
The importance of the fear of falling in this model can be interpreted in the light that the complex falls included injurious events. For example, Young et al. described the psychological influence of the fear of falling on the attention and behaviour of older adults, which can in turn contribute to further falls [33]. On the other hand, generalised muscle weakness that is due to sarcopenia can persistently impair gait and balance and contribute to recurrent falls [34].
Fragility fractures, which are fractures that are incurred from falls from a standing height or lower are associated with osteoporosis and may contribute to a sharp decrease in mobility and quality of life [35]. In 2017, the total health burden of fragility fractures within the EU6 (France, Germany, Italy, Spain, Sweden, and UK) was calculated to be 1.02 million QALYs, with an expected increase of 25.6% by 2030 [36]. Given that injurious falls are classified as complex falls, the significant contribution of osteoporosis to the risk of a fall causing fractures is observed by its rank within the top features for complex falls.

4.5. Syncope

Judging by the feature importance scores (≥0.1), age was the top predictor for this. In the SHAP plot, having had a fall in the last year, polypharmacy (being on five or more regular medications), their age, being unsteady when getting up from chair, and having osteoporosis, and a myocardial infarction all had clear positive influences in the model. Being a frequent fainter when they were young had a more mixed effect on the model output.
Polypharmacy was placed second in the SHAP summary plot, which was much higher when it was compared to the other models, underlining the additive contribution of cardiovascular and non-cardiovascular medications towards the risk of orthostatic hypotension as a common cause of syncope in older people [37]. In our model, the feature of antihypertensives had the highest feature importance and SHAP values amongst the individual-type medications that were considered in the syncope model. This is consistent with the literature [38], and it reinforces the importance of careful medication review in the prevention of syncopal falls in older people. The SPRINT trial showed that intensive blood pressure control in adults aged 50 years and above was associated with an increased risk of syncope and hypotension. but not with falls [39]. However, the replication of the trial using the TILDA dataset on adults aged 75 years and older, fulfilling the inclusion criteria for SPRINT, showed that there was a five-fold increase in injurious falls (complex falls) and syncope as compared to the SPRINT group that received standard care [40]. The perils of intensive blood pressure control in older adults aged 65 years and over that are living with frailty, including having a higher risk of future syncope, have been further evidenced in the TILDA dataset [41].
Unsteadiness when they are getting up from a chair is a feature that showed high importance among the simple falls, complex falls, and syncope models. This may be interpreted differently, where in simple and complex falls, unsteadiness may be associated with musculoskeletal weakness and balance problems, but in syncope, it may be more related to orthostatic intolerance associated with orthostatic hypotension. In orthostatic hypotension, a drop in blood pressure is observed when a person changes, often too quickly, from a sitting to standing position and this results in sudden cerebral hypoperfusion that may precipitate a transient loss of consciousness [18].
Regarding the mixed effect of them being a frequent fainter when they were young in the syncope model, the clinical implication is that when an older adult with multimorbidity presents with syncope and there is a history of them fainting as a young person, the clinicians should not immediately attribute the current fainting to the old benign tendency to faint (i.e., vasovagal syncope), and regardless of their previous fainting history, they should instigate a comprehensive review of the pathological drivers of the syncope (e.g., orthostatic hypotension or cardiac arrhythmia) [42].

4.6. Limitations

4.6.1. Self-Report Limitation

The type of fall that was experienced was determined by the participants themselves. These may not be entirely reliable due to the subjectivity of the recollection of the events, thereby leading to a potential recall bias [43,44]. A recall bias may also contribute more significantly to the simple falls model, especially if the participants were unable to recall the triggering mechanism of the fall, therefore, brushing off the event as accidental. This may be contributory to the seemingly mixed profile of predictors within the simple falls SHAP values. In addition, amnesia or loss of consciousness has been reported in syncope and these may be more prevalent in the older age group [45]. The self-reporting of falls contributing to a recall bias is an appreciable limitation in a falls assessments, and a collateral history should always be considered by clinicians.

4.6.2. Low Granularity in Certain Features

A limitation in our design is that some input features had a low level of granularity, which precludes the postulation of mechanistic effects in the results. For example, the polypharmacy or antihypertensives features in the syncope model did not provide further information on the exact medication classes and/or dosages of the patients, which are aspects that clinicians need to take into account. In other datasets with more medication granularity, XAI models could be useful in analysing the impact on falls that different medications within each drug class have, as well as the impact of common drug combinations on falls. The interactions between the features, which was not considered in this study, also has potential in future research. The refinement of predictors based on clinical knowledge, feature selection, and feature engineering will improve the predictability and quality of the analyses in future AI models.

4.6.3. Other Dataset Limitations

A small number of simple and syncopal falls were recorded in the TILDA dataset. As noted above, this caused a large class imbalance in the respective models, and balancing the sizes of the classes with random oversampling resulted in many duplicates that may have affected the results.

4.6.4. Technical Limitations and Alternative Algorithms

Tree-based models are more prone to bias towards continuous variables such as age over binary variables due to there being more split points for these [46]. Age being present within the top features of all of the models may suggest that the effect of such a bias and categorisation of the age groups may be a future alternative for a similar implementation of tree-based models. However, the overall effect of age in our models is clinically plausible and it is discussed above, and it is also supported by the literature. We did not discretise the variables, and we used age groups instead because as is noted above, we wished to evidence the extent to which individual variability in age existed in the models.
XAI models are also insufficient to prove cause-and-effect relationships. Hence, the relevance of a feature may not equate to its importance as a risk factor for falls, but instead as a non-causal association. An example would be osteoporosis, where the history of a fall may lead to the screening for and diagnosis of osteoporosis, whereas osteoporosis does not per se cause falls. However, understanding how AI models utilise each feature into the predictions that they make might provide some intuition as to the possible causal relationships between the features.

4.6.5. Alternative Algorithms and Explainability Considerations

Maximising the utility of machine learning models requires the selection of the correct model that best suits the context of the problem. These considerations include the type of problem, the characteristics of the features, versatility, and the need for explainability. Real life application then further considers the technical feasibility of it such as its computational intensity. For a binary classification problem as per our research question, supervised learning alternatives could have been decision trees and the supervised vector machine (SVM). Deep learning models such as neural networks could have also been alternatives [47]. Amongst these considerations, explainability is crucial, particularly in analysing population datasets of health and healthcare relevance, where it is essential to allow both clinicians and patients to interpret the feature relevance of the model’s prediction. This can help to personalise and streamline the preventative measures and medical management for a maximum amount of individual patient benefits. Decision trees allow for direct visualisation of how the algorithm makes a prediction using the features that are provided. Explainability is achieved easily as both the patient and clinician can interpret the tree results visually, without requiring extensive knowledge in artificial intelligence [22]; however, decision trees have high variance and are more prone to overfitting, which reduces the consistency and quality of their predictions in real datasets. This is important to be avoided especially when the consequences of erroneous predictions are significant, such as in the healthcare context. Utilising the strength of ensemble learning, random forests are able to provide more accurate and stable predictions through the aggregation of results from randomly built decision trees. This is at a slight expense of their interpretability, where the expression of feature relevance may be less straightforward for the general population.
On the other side of the explainability spectrum, deep learning models such as neural networks may offer better prediction performance but with minimal transparency over the derivation of the predictions. This may make clinical correlations of the results more difficult and less attractive for their practical application in medicine [48]. Moreover, the small dataset that is present in each of our classification problems may also restrict the performance of neural networks, which require a large training dataset for the delivery of stable and accurate results. However, in recent years there has been increasing interest in the optimisation of the performance of neural networks for small datasets, which can increase their applicability to the medical field [49,50].

5. Conclusions

XAI applications can be useful in medicine, and our study exemplifies this in the area of fall prediction in older adults, by providing a comprehensive, easy-to-understand perspective on the multi-faceted nature of various types of falls whilst reinforcing the existing knowledge to support clinical and research efforts in fall prevention. The identification of modifiable risk factors can help to streamline and optimise the prevention efforts, which is beneficial in ageing societies that increasingly need to divert scarce healthcare resources towards older citizens. Future clinical applications may see AI models providing rapid point-of-care personalised results to reduce falls risk and provide contributory red flags for the individualised management of this issue. The implementation of XAI techniques in medicine will also help us to comply with regulatory requirements and reduce user reluctance towards the utilisation of AI in clinical settings because of their ability to generate results that are more human-understandable. However, challenges remain that need to be targeted and in the specific area of falls prediction, and more work is required to continue to refine the definitions of falls, provide more granularity and objectivity in the inputs, consider possible interactions between inputs, and identify the algorithms that provide the best explainability and accuracy.

Author Contributions

Conceptualization, Y.T.T. and R.R.-O.; methodology, Y.T.T. and R.R.-O.; software, Y.T.T.; validation, Y.T.T. and R.R.-O.; formal analysis, Y.T.T.; investigation, Y.T.T. and R.R.-O.; resources, R.R.-O.; data curation, Y.T.T. and R.R.-O.; writing—original draft preparation, Y.T.T.; writing—review and editing, R.R.-O.; visualization, Y.T.T.; supervision, R.R.-O.; project administration, R.R.-O.; funding acquisition, R.R.-O. All authors have read and agreed to the published version of the manuscript.

Funding

R.R.-O. is funded by Science Foundation Ireland, grant number 18/FRL/6188. The Irish Longitudinal Study on Ageing (TILDA) is funded by Atlantic Philanthropies, the Irish Department of Health and Irish Life.

Institutional Review Board Statement

The study was conducted according to the guidelines of the Declaration of Helsinki, and approved by the Faculty of Health Sciences Research Ethics Committee at Trinity College Dublin, Dublin, Ireland (wave 1, reference: ‘The Irish Longitudinal Study on Ageing’, date of approval: May 2008; wave 2, reference: ‘The Irish Longitudinal Study on Ageing’, date of approval: October 2011; wave 3, reference: ‘Main wave 3 Tilda Study’, date of approval: June 2014; wave 4, reference: 150506, date of approval: July 2015).

Informed Consent Statement

Informed consent was obtained from all subjects involved in the study.

Data Availability Statement

TILDA data was accessed via the Irish Social Science Data Archive—www.ucd.ie/issda (accessed on 1 July 2020).

Conflicts of Interest

The authors declare no conflict of interest. The funders had no role in the design of the study; in the collection, analyses, or interpretation of data; in the writing of the manuscript; or in the decision to publish the results.

References

  1. Stel, V.S.; Smit, J.H.; Pluijm, S.M.; Lips, P. Consequences of falling in older men and women and risk factors for health service use and functional decline. Age Ageing 2004, 33, 58–65. [Google Scholar] [CrossRef] [PubMed]
  2. Gannon, B.; O’Shea, E.; Hudson, E. The Economic Cost of Falls and Fractures in People aged 65 and over in Ireland: Technical Report to NCAOP/HSE/DOHC. 2007. Available online: https://www.hse.ie/eng/services/publications/olderpeople/the-economic-costs-of-falls-and-fractures-in-people-aged-65-and-over-in-ireland.pdf (accessed on 24 September 2022).
  3. HSE; NCAOP; DOHC. Strategy to Prevent Falls and Fractures in Ireland’s Ageing Population: Report of the National Steering Group on the Prevention of Falls in Older People and the Prevention and Management of Osteoporosis throughout Life. 2008. Available online: https://www.hse.ie/eng/services/publications/olderpeople/strategy-to-prevent-falls-and-fractures-in-irelands-ageing-population---full-report.pdf (accessed on 24 September 2022).
  4. NICE. Falls in Older People: Assessing Risk and Prevention: Clinical Guideline [CG161]. 2013. Available online: https://www.nice.org.uk/guidance/cg161 (accessed on 24 September 2022).
  5. Tan, M.P.; Kenny, R.A. Cardiovascular assessment of falls in older people. Clin. Interv. Aging 2006, 1, 57–66. [Google Scholar] [CrossRef] [PubMed]
  6. Fitzpatrick, N.; Romero-Ortuno, R. The Syncope-Falls Index: A tool for predicting risk of syncope and complex falls in the older adult based on cumulative health deficits. QJM 2022, 115, 367–373. [Google Scholar] [CrossRef]
  7. Usmani, S.; Saboor, A.; Haris, M.; Khan, M.A.; Park, H. Latest Research Trends in Fall Detection and Prevention Using Machine Learning: A Systematic Review. Sensors 2021, 21, 5134. [Google Scholar] [CrossRef] [PubMed]
  8. Davis, J.R.C.; Knight, S.P.; Donoghue, O.A.; Hernández, B.; Rizzo, R.; Kenny, R.A.; Romero-Ortuno, R. Comparison of Gait Speed Reserve, Usual Gait Speed, and Maximum Gait Speed of Adults Aged 50+ in Ireland Using Explainable Machine Learning. Front. Netw. Physiol. 2021, 1. [Google Scholar] [CrossRef]
  9. Kumar, S.; Du, C.; Graham, S.; Nguyen, T. Using Machine Learning to Predict Frailty from Cognitive Assessments. Annu. Int. Conf. IEEE Eng. Med. Biol. Soc. 2021, 2021, 1648–1652. [Google Scholar]
  10. Moguilner, S.; Knight, S.P.; Davis, J.R.C.; O’Halloran, A.M.; Kenny, R.A.; Romero-Ortuno, R. The Importance of Age in the Prediction of Mortality by a Frailty Index: A Machine Learning Approach in the Irish Longitudinal Study on Ageing. Geriatrics 2021, 6, 84. [Google Scholar] [CrossRef]
  11. Nowak, A.; Hubbard, R.E. Falls and frailty: Lessons from complex systems. J. R. Soc. Med. 2009, 102, 98–102. [Google Scholar] [CrossRef]
  12. Arrieta, A.B.; Díaz-Rodríguez, N.; Ser, J.D.; Bennetot, A.; Tabik, S.; Barbado, A.; Garcia, S.; Gil-Lopez, S.; Molina, D.; Benjamins, R.; et al. Explainable Artificial Intelligence (XAI): Concepts, taxonomies, opportunities and challenges toward responsible AI. Inf. Fusion 2020, 58, 82–115. [Google Scholar] [CrossRef]
  13. Loyola-González, O. Black-Box vs. White-Box: Understanding Their Advantages and Weaknesses From a Practical Point of View. IEEE Access 2019, 7, 154096–154113. [Google Scholar] [CrossRef]
  14. Adadi, A.; Berrada, M. Peeking Inside the Black-Box: A Survey on Explainable Artificial Intelligence (XAI). IEEE Access 2018, 6, 52138–52160. [Google Scholar] [CrossRef]
  15. Pawar, U.; O’Shea, D.; Rea, S.; O’Reilly, R. Incorporating explainable artificial intelligence (XAI) to aid the understanding of machine learning in the healthcare domain. In Proceedings of the 8th Irish Conference on Artificial Intelligence and Cognitive Science 2020, Dublin, Ireland, 7–8 December 2020; pp. 1–12. [Google Scholar]
  16. Chico, V. The impact of the General Data Protection Regulation on health research. Br. Med. Bull. 2018, 128, 109–118. [Google Scholar] [CrossRef] [PubMed]
  17. Kearney, P.M.; Cronin, H.; O’Regan, C.; Kamiya, Y.; Savva, G.M.; Whelan, B.; Kenny, R. Cohort profile: The Irish Longitudinal Study on Ageing. Int. J. Epidemiol. 2011, 40, 877–884. [Google Scholar] [CrossRef]
  18. Brignole, M.; Moya, A.; de Lange, F.J.; Deharo, J.-C.; Elliott, P.M.; Fanciulli, A.; Fedorowski, A.; Furlan, R.; Kenny, R.A.; Martín, A.; et al. 2018 ESC Guidelines for the diagnosis and management of syncope. Eur. Heart J. 2018, 39, 1883–1948. [Google Scholar] [CrossRef] [PubMed]
  19. Alam, M.Z.; Rahman, M.S.; Rahman, M.S. A Random Forest based predictor for medical data classification using feature ranking. Inform. Med. Unlocked 2019, 15, 100180. [Google Scholar] [CrossRef]
  20. Saenz-Cogollo, J.F.; Agelli, M. Investigating Feature Selection and Random Forests for Inter-Patient Heartbeat Classification. Algorithms 2020, 13, 75. [Google Scholar] [CrossRef]
  21. Louppe, G.; Wehenkel, L.; Sutera, A.; Geurts, P. Understanding variable importances in forests of randomized trees. In Proceedings of the 26th International Conference on Neural Information Processing Systems—Volume 1, Lake Tahoe, NV, USA, 5–10 December 2013; Curran Associates Inc.: Lake Tahoe, NV, USA, 2013; pp. 431–439. [Google Scholar]
  22. Podgorelec, V.; Kokol, P.; Stiglic, B.; Rozman, I. Decision Trees: An Overview and Their Use in Medicine. J. Med. Syst. 2002, 26, 445–463. [Google Scholar] [CrossRef]
  23. Lundberg, S.M.; Lee, S.-I. A unified approach to interpreting model predictions. In Proceedings of the 31st International Conference on Neural Information Processing Systems, Long Beach, CA, USA, 4–9 December 2017; Curran Associates Inc.: Long Beach, CA, USA, 2017; pp. 4768–4777. [Google Scholar]
  24. Bhuiya, M.M.R.; Hasan, M.M.U.; Keellings, D.J.; Mohiuddin, H. Application of Machine Learning Classifiers for Mode Choice Modeling for Movement-Challenged Persons. Future Transp. 2022, 2, 328–346. [Google Scholar] [CrossRef]
  25. Donoghue, O.A.; Hernandez, B.; O’Connell, M.D.L.; Kenny, R.A. Using conditional inference forests to examine predictive ability for future falls and syncope in older adults: Results from The Irish Longitudinal Study on Ageing. J. Gerontol. Ser. A 2022, glac156. [Google Scholar] [CrossRef]
  26. Gade, G.V.; Jorgensen, M.G.; Ryg, J.; Riis, J.; Thomsen, K.; Masud, T.; Andersen, S. Predicting falls in community-dwelling older adults: A systematic review of prognostic models. BMJ Open 2021, 11, e044170. [Google Scholar] [CrossRef]
  27. Lindberg, D.S.; Prosperi, M.; Bjarnadottir, R.I.; Thomas, J.; Crane, M.; Chen, Z.; Shear, K.; Solberg, L.M.; Snigurska, U.A.; Wu, Y.; et al. Identification of important factors in an inpatient fall risk prediction model to improve the quality of care using EHR and electronic administrative data: A machine-learning approach. Int. J. Med. Inform. 2020, 143, 104272. [Google Scholar] [CrossRef]
  28. Fuller, G.F. Falls in the elderly. Am. Fam. Physician 2000, 61, 2159–2168. [Google Scholar]
  29. Rubenstein, L.Z. Falls in older people: Epidemiology, risk factors and strategies for prevention. Age Ageing 2006, 35, ii37–ii41. [Google Scholar] [CrossRef]
  30. Chang, V.C.; Do, M.T. Risk factors for falls among seniors: Implications of gender. Am. J. Epidemiol. 2015, 181, 521–531. [Google Scholar] [CrossRef] [PubMed]
  31. Dai, W.; Tham, Y.C.; Chee, M.L.; Tan, N.Y.Q.; Wong, K.H.; Majithia, S.; Sabanayagam, C.; Lamoureux, E.; Wong, T.Y.; Cheng, C.Y. Falls and Recurrent Falls among Adults in A Multi-ethnic Asian Population: The Singapore Epidemiology of Eye Diseases Study. Sci. Rep. 2018, 8, 7575. [Google Scholar] [CrossRef] [PubMed]
  32. Treves, N.; Perlman, A.; Kolenberg Geron, L.; Asaly, A.; Matok, I. Z-drugs and risk for falls and fractures in older adults—A systematic review and meta-analysis. Age Ageing 2018, 47, 201–208. [Google Scholar] [CrossRef] [PubMed]
  33. Young, W.R.; Mark Williams, A. How fear of falling can increase fall-risk in older adults: Applying psychological theory to practical observations. Gait Posture 2015, 41, 7–12. [Google Scholar] [CrossRef] [PubMed]
  34. Yeung, S.S.Y.; Reijnierse, E.M.; Pham, V.K.; Trappenburg, M.C.; Lim, W.K.; Meskers, C.G.M.; Maier, A.B. Sarcopenia and its association with falls and fractures in older adults: A systematic review and meta-analysis. J. Cachexia Sarcopenia Muscle 2019, 10, 485–500. [Google Scholar] [CrossRef]
  35. Gold, T.; Williams, S.A.; Weiss, R.J.; Wang, Y.; Watkins, C.; Carroll, J.; Middleton, C.; Silverman, S. Impact of fractures on quality of life in patients with osteoporosis: A US cross-sectional survey. J. Drug Assess. 2019, 8, 175–183. [Google Scholar] [CrossRef]
  36. Borgstrom, F.; Karlsson, L.; Ortsater, G.; Norton, N.; Halbout, P.; Cooper, C.; Lorentzon, M.; McCloskey, E.V.; Harvey, N.C.; Javaid, M.K.; et al. International Osteoporosis, F. Fragility fractures in Europe: Burden, management and opportunities. Arch. Osteoporos. 2020, 15, 59. [Google Scholar] [CrossRef]
  37. Rivasi, G.; Rafanelli, M.; Mossello, E.; Brignole, M.; Ungar, A. Drug-Related Orthostatic Hypotension: Beyond Anti-Hypertensive Medications. Drugs Aging 2020, 37, 725–738. [Google Scholar] [CrossRef] [PubMed]
  38. de Jong, M.R.; Van der Elst, M.; Hartholt, K.A. Drug-related falls in older patients: Implicated drugs, consequences, and possible prevention strategies. Ther Adv Drug Saf 2013, 4, 147–154. [Google Scholar] [CrossRef] [PubMed] [Green Version]
  39. Sink, K.M.; Evans, G.W.; Shorr, R.I.; Bates, J.T.; Berlowitz, D.; Conroy, M.B.; Felton, D.M.; Gure, T.; Johnson, K.C.; Kitzman, D.; et al. Syncope, Hypotension, and Falls in the Treatment of Hypertension: Results from the Randomized Clinical Systolic Blood Pressure Intervention Trial. J. Am. Geriatr. Soc. 2018, 66, 679–686. [Google Scholar] [CrossRef] [PubMed]
  40. Sexton, D.J.; Canney, M.; O’Connell, M.D.L.; Moore, P.; Little, M.A.; O’Seaghdha, C.M.; Kenny, R.A. Injurious Falls and Syncope in Older Community-Dwelling Adults Meeting Inclusion Criteria for SPRINT. JAMA Intern. Med. 2017, 177, 1385–1387. [Google Scholar] [CrossRef]
  41. O’Donoghue, P.; O’Halloran, A.; Kenny, R.; Romero-Ortuno, R. Older adults identified as frail by Frailty Index and FRAIL scale who were intensively treated for hypertension were at increased risk of 2-year adverse health outcomes in The Irish Longitudinal Study on Ageing (TILDA) [version 2; peer review: 1 approved with reservations, 1 not approved]. HRB Open Research 2022, 5, 45. [Google Scholar]
  42. Mcintosh, S.; Costa, D.D.; Kenny, R.A. Outcome of an Integrated Approach to the Investigation of Dizziness, Falls and Syncope, in Elderly Patients Referred to a ‘Syncope’ Clinic. Age Ageing 1993, 22, 53–58. [Google Scholar] [CrossRef]
  43. Freiberger, E.; de Vreede, P. Falls recall—Limitations of the most used inclusion criteria. Eur. Rev. Aging Phys. Act. 2011, 8, 105–108. [Google Scholar] [CrossRef]
  44. Delbaere, K.; Close, J.C.; Kochan, N.A.; Sachdev, P.S.; Lord, S.R. Good memory as a predictor of falls: Fact or artefact. Age Ageing 2012, 41, 404–408. [Google Scholar] [CrossRef]
  45. O’Dwyer, C.; Bennett, K.; Langan, Y.; Fan, C.W.; Kenny, R.A. Amnesia for loss of consciousness is common in vasovagal syncope. Europace 2011, 13, 1040–1045. [Google Scholar] [CrossRef]
  46. Hsiao, W.-C.; Shih, Y.-S. Splitting variable selection for multivariate regression trees. Stat. Probab. Lett. 2007, 77, 265–271. [Google Scholar] [CrossRef]
  47. Dey, A. Machine Learning Algorithms: A Review. Int. J. Comput. Sci. Inf. Technol. 2016, 7, 1174–1179. [Google Scholar]
  48. Price, W.N. Big data and black-box medical algorithms. Sci. Transl. Med. 2018, 10, 471. [Google Scholar] [CrossRef] [PubMed]
  49. Mazurowski, M.A.; Habas, P.A.; Zurada, J.M.; Lo, J.Y.; Baker, J.A.; Tourassi, G.D. Training neural network classifiers for medical decision making: The effects of imbalanced datasets on classification performance. Neural Netw. 2008, 21, 427–436. [Google Scholar] [CrossRef] [PubMed]
  50. Shaikhina, T.; Khovanova, N.A. Handling limited datasets with neural networks in medical applications: A small-data approach. Artif. Intell. Med. 2017, 75, 51–63. [Google Scholar] [CrossRef]
Figure 1. All falls and syncope SHAP summary plot. Fall in the last year is at the top of the y axis, which is followed by sex (female = red; male = blue) and being afraid of falling. This suggests that a fall in the last year has, amongst the other features, the biggest contribution towards the prediction of a future fall (all falls and syncope). Within each feature, every point across the x axis represents the SHAP value of the feature for each participant. As observed, a fall in the last year contributes positively towards a future fall, and most positively in some participants, compared to other features, but the wide distribution of the points suggests the variability of this positive contribution amongst participants. In comparison, not falling in the last year has a more consistent contribution towards having no future fall prediction. The only two dichotomous features whose presence has negative contributions to the model are being a frequent fainter when they were young, and more notably, having chronic obstructive pulmonary disease (COPD). In regards age, higher values tend to contribute positively to the model, with the opposite being generally true, but with there being a degree of heterogeneity (i.e., some red dots can be seen as having a negative impact and some blue dots have a positive impact).
Algorithms 15 00353 g001
Figure 2. All falls and syncope SHAP bar plot.
Algorithms 15 00353 g002
Figure 3. Simple falls SHAP summary plot.
Algorithms 15 00353 g003
Figure 4. Simple falls SHAP bar plot.
Algorithms 15 00353 g004
Figure 5. Complex falls SHAP summary plot.
Algorithms 15 00353 g005
Figure 6. Complex falls SHAP bar plot.
Algorithms 15 00353 g006
Figure 7. Syncope SHAP summary plot.
Algorithms 15 00353 g007
Figure 8. Syncope SHAP bar plot.
Algorithms 15 00353 g008
Table 1. Forty-six input features.
FeaturesType of Variable (Continuous, Binary)Feature Value
  • Polypharmacy
Polypharmacy0 = Absent, 1 = Present
2.
Antihypertensives
Binary0 = Absent, 1 = Present
3.
Anticholinergics
Binary0 = Absent, 1 = Present
4.
Benzodiazepines
Binary0 = Absent, 1 = Present
5.
Z-drugs
Binary0 = Absent, 1 = Present
6.
Antidepressants
Binary0 = Absent, 1 = Present
7.
Weight loss
Binary0 = Absent, 1 = Present
8.
Poor eyesight
Binary0 = Absent, 1 = Present
9.
Poor hearing
Binary0 = Absent, 1 = Present
10.
Poor smell
Binary0 = Absent, 1 = Present
11.
Poor taste
Binary0 = Absent, 1 = Present
12.
Hypertension
Binary0 = Absent, 1 = Present
13.
Angina
Binary0 = Absent, 1 = Present
14.
Myocardial infarction
Binary0 = Absent, 1 = Present
15.
Congestive cardiac failure
Binary0 = Absent, 1 = Present
16.
Heart murmur
Binary0 = Absent, 1 = Present
17.
Abnormal heart rhythm
Binary0 = Absent, 1 = Present
18.
Diabetes mellitus
Binary0 = Absent, 1 = Present
19.
Stroke
Binary0 = Absent, 1 = Present
20.
Transient ischemic attack
Binary0 = Absent, 1 = Present
21.
Grip weakness
Binary0 = Absent, 1 = Present
22.
Leg ulcers
Binary0 = Absent, 1 = Present
23.
Protein in urine
Binary0 = Absent, 1 = Present
24.
Leg numbness
Binary0 = Absent, 1 = Present
25.
Diabetic retinopathy
Binary0 = Absent, 1 = Present
26.
Diabetic nephropathy
Binary0 = Absent, 1 = Present
27.
Chronic obstructive pulmonary disease (COPD)
Binary0 = Absent, 1 = Present
28.
Asthma
Binary0 = Absent, 1 = Present
29.
Osteoarthritis
Binary0 = Absent, 1 = Present
30.
Osteoporosis
Binary0 = Absent, 1 = Present
31.
Cancer
Binary0 = Absent, 1 = Present
32.
Psychiatric problems
Binary0 = Absent, 1 = Present
33.
Alcohol or substance abuse
Binary0 = Absent, 1 = Present
34.
Cognitive impairment
Binary0 = Absent, 1 = Present
35.
Gastric ulcers
Binary0 = Absent, 1 = Present
36.
Feels unsteady on standing
Binary0 = Absent, 1 = Present
37.
Unsteady getting up from chair
Binary0 = Absent, 1 = Present
38.
Varicose ulcers
Binary0 = Absent, 1 = Present
39.
Liver cirrhosis
Binary0 = Absent, 1 = Present
40.
Urine incontinence
Binary0 = Absent, 1 = Present
41.
Age
Continuous65–80
42.
Sex
Binary0 = Male, 1 = Female
43.
Falls in last year
Binary0 = Absent, 1 = Present
44.
Any history of blackout/faint
Binary0 = Absent, 1 = Present
45.
Frequent fainter when young
Binary0 = Absent, 1 = Present
46.
Afraid of fall
Binary0 = Absent, 1 = Present
Table 2. Dataset size of each model.
ModelNumber of Events
in the Original Dataset
Number or Events in the Training Dataset after Rebalance
All Falls and Syncope0: 1549
1: 1351
0: 1098
1: 1070
Simple Falls0: 2683
1: 217
0: 1888
1: 1868
Complex Falls0: 1823
1: 1077
0: 1302
1: 1250
Syncope0: 2715
1: 185
0: 1899
1: 1902
Table 3. Precision, recall, and F1 score for each model.
Model (Class)PrecisionRecallF1-Score
Falls and Syncope (0)0.580.650.61
Falls and Syncope (1)0.630.560.59
Simple Falls (0)0.900.630.75
Simple Falls (1)0.720.930.82
Complex Falls (0)0.570.690.62
Complex Falls (1)0.650.520.58
Syncope (0)0.810.880.84
Syncope (1)0.870.790.83
Table 4. Top 20 features (by feature importance coefficient) in the all falls and syncope model.
All Falls and Syncope ModelFeature Importance Coefficient
Fall in last year0.140
Age0.108
Afraid of fall0.070
Sex0.060
Osteoarthritis0.046
Osteoporosis0.040
Hypertension0.036
Urine incontinence0.031
Frequent fainter when young0.030
Polypharmacy0.029
Grip weakness0.026
History of blackout/faint0.025
Abnormal heart rhythm0.024
Antihypertensives0.024
Unsteady getting up from chair0.022
Z-drugs0.020
Anticholinergics0.020
Angina0.020
Asthma0.019
Antidepressants0.017
Table 5. Top 20 features (by feature importance coefficient) in the simple falls model.
Simple Falls ModelFeature Importance Coefficient
Age0.138
Sex0.041
Weight loss0.039
Hypertension0.035
Fall in last year0.034
Myocardial infarction0.034
Polypharmacy0.033
Urine incontinence0.030
Afraid of fall0.030
Unsteady on standing0.028
Unsteady getting up from chair0.027
MMSE less than 240.027
COPD0.027
Asthma0.026
Grip weakness0.026
Frequent fainter when young0.025
Osteoarthritis0.024
Abnormal heart rhythm0.024
Angina0.023
History of blackout/faint0.021
Table 6. Top 20 features (by feature importance coefficient) in the complex falls model.
Complex Falls Top FeaturesFeature Importance
Fall in last year0.135
Age0.110
Afraid of fall0.081
Osteoporosis0.045
Sex0.042
Grip weakness0.039
Osteoarthritis0.034
Unsteady getting up from chair0.034
Urine incontinence0.028
Frequent fainter when young0.028
Hypertension0.023
Polypharmacy0.023
Feels unsteady on standing0.022
Antidepressants0.021
Antihypertensives0.020
Anticholinergics0.019
Psychiatric problems0.019
Abnormal heart rhythm0.017
History of blackout/faint0.016
Diabetes0.016
Table 7. Top 20 features (by feature importance coefficient) in the syncope model.
Syncope ModelFeature Importance
Age0.118
Frequent fainter when young0.043
Polypharmacy0.041
Fall in last year0.040
MI0.039
Unsteady getting up from chair0.038
Sex0.033
Osteoporosis0.031
Angina0.030
Grip weakness0.029
Abnormal heart rhythm0.029
Antihypertensives0.029
Varicose ulcers0.027
Cancer0.027
Osteoarthritis0.026
Afraid of fall0.025
Hypertension0.024
Urine incontinence0.023
Poor smell0.022
History of blackout/faint0.021
Publisher’s Note: MDPI stays neutral with regard to jurisdictional claims in published maps and institutional affiliations.

