Abstract
Optical and magneto-optical properties of amorphous Gd22Fe78 (GdFe) thin films prepared by direct current (DC) sputtering on thermally oxidized substrates were characterized by the combination of spectroscopic ellipsometry and magneto-optical spectroscopy in the photon energy range from 1.5 to 5.5 eV. Thin SiNx and Ru coatings were used to prevent the GdFe surface oxidation and contamination. Using advanced theoretical models spectral dependence of the complete permittivity tensor and spectral dependence of the absorption coefficient were deduced from experimental data. No significant changes in the optical properties upon different coatings were observed, indicating reliability of used analysis.
1. Introduction
Considerable attention has been paid to magnetic and magneto-optical (MO) properties of amorphous ferrimagnetic thin films composed of rare-earth and transition metals because of their useful technological applications [1,2,3,4]. As one of the important magneto-optical storage materials, GdFe has significant advantages, such as large magnetization density, and possibility to adjust its compensation temperature, coercive and saturation magnetization by changing the composition [5,6,7]. Because of these properties, GdFe has a substantial impact on modern micro- and nanoelectronic research, where it is often used in domain wall junctions or MO memories [1,3,4].
The GdFe shows perpendicular anisotropy when the Fe concentration is about the compensation concentration, which is for this material about 75% [8]. This composition is often used for MO applications such as MO disk storage or MO spatial light modulator driven by spin transfer torque (spin spatial light modulator (SLM)) [2]. It is very important to control the GdFe composition precisely, since it significantly affects the GdFe magnetic switching property. Coercivity shows maxima when the composition is the compensation one, and it gets smaller when the composition becomes Fe rich (compared to the compensation composition). Spin-torque switching current of the spin-SLM is significantly reduced with an increase in Fe concentration and it shows very small switching current when composition is slightly Fe richer (such as Gd20-22Fe78-80) than the compensation one [9,10]. Therefore it is meaningful to investigate optical properties of the GdFe material with the Fe concentration around 78%.
The main purpose of our investigation was to fully determine the dielectric permittivity tensor of the GdFe thin film. Knowledge of the permittivity tensor is crucial, since it allows theoretical prediction of complex physical properties of complicated multilayered nanostructures containing GdFe layers without necessity to manufacture multiple samples. This is especially useful for the design of advanced devices as holographic 3D displays based on structures consisting of more than 10 nanolayers [2,11].
Since GdFe is very easy to oxidize [12], it is usually covered by a protecting layer, which complicates its analysis. The main reason is that the optical properties of protecting layer materials (here Ru, SiNx) may slightly differ in dependence on material they are deposited on. This is usually caused by the lattice mismatch between the film and the substrate, which induces strains of various kinds [13,14,15]. In this work, we have dealt with this problem by using two different coating layer materials which allowed more precise determination of GdFe permittivity tensor. Spectroscopic ellipsometry showed very similar optical properties of GdFe for both coatings, which allowed us to fit the optical constants from experimental data simultaneously.
We used spectroscopic ellipsometry at energies 1.2–6 eV and MO spectral measurements at energies 1.5–5.5 eV. From ellipsometric data we derived spectra of the real, ε1r, and imaginary, ε1i, part of diagonal permittivity tensor elements and the absorption coefficient spectra of the GdFe thin films. Magneto-optical properties were examined by polar magneto-optical Kerr effect (MOKE) rotation and ellipticity measurements. From these data we determined the spectral dependence of the real, ε2r, and imaginary, ε2i, part of off-diagonal GdFe permittivity tensor elements.
2. Results and Discussion
To obtain the GdFe dielectric permittivity tensor we analyzed optical and magneto-optical properties of two samples with structural compositions and nominal thicknesses listed in the Table 1.

Table 1.
Structural compositions and nominal thicknesses of examined samples.
| Sample | Substrate | Layer 1 | Layer 2 | Layer 3 |
|---|---|---|---|---|
| Ru coated | Si | SiO2 (300 nm) | Gd22Fe78 (100 nm) | Ru (3 nm) |
| SiNx coated | Si | SiO2 (300 nm) | Gd22Fe78 (100 nm) | SiNx (20 nm) |
2.1. Spectroscopic Ellipsometry
Figure 1 shows spectroscopic ellipsometry experimental data of studied samples. Since the measurements were performed under large incident angles, the difference between the ellipsometry data of two samples reflects not only the different optical parameters of coatings, but also the Fabry-Perot type resonance in much thicker SiNx layer with respect to Ru. The GdFe optical constants and layer thicknesses were fitted to the theoretical models (based on structural compositions) and experimental data. We used the “Multi Sample Analysis” mode to derive the GdFe optical constants from the experimental data of both samples simultaneously (It is an advanced mode in CompleteEase software that allows multiple samples to be fitted simultaneously with some of the fit parameters common to all samples (GdFe optical constants) and other allowed to vary (coating layer material, thicknesses) [16] (p. 169)). This could be done because the GdFe optical constants obtained from the individual sample analysis were very similar. Therefore this mode allowed, suppressing the fit error and so more precise analysis. Obtained optical functions were afterwards parameterized to ensure Kramers-Kronig consistent results. Optical functions of the GdFe thin film were parameterized by the linear summation of two Lorentz, two Gaussian oscillators and one Drude term in the spectral range 1.5–6 eV. Gaussian oscillators have been used due to their ability to rapidly approach zero beyond the FWHM positions which makes them suitable for the parametrization of the steeper regions of the optical spectra. Drude term has been used because GdFe is an amorphous alloy; therefore, we also had to consider the free carrier effect on the optical response. Parameters of used oscillators are listed in the Table 2. Derived thicknesses are listed in the Table 3. Optical constants of Si, SiO2, Ru and SiNx were determined from the ellipsometry measurements on individual samples. As we can see from Figure 1, the experimental and theoretical values correspond well. Since the GdFe has large absorption coefficient, the average penetration depth of this material in measured spectral region is around 24 nm, which allows consider the GdFe layer as semi-infinite. Therefore, we also theoretically modeled optical constants for structures where GdFe was used as semi-infinite substrate. However, no significant changes in results given by full and semi-infinite model structures were observed, since the full structure model also includes the high absorption of GdFe. In this work we present results obtained with the full model structure.
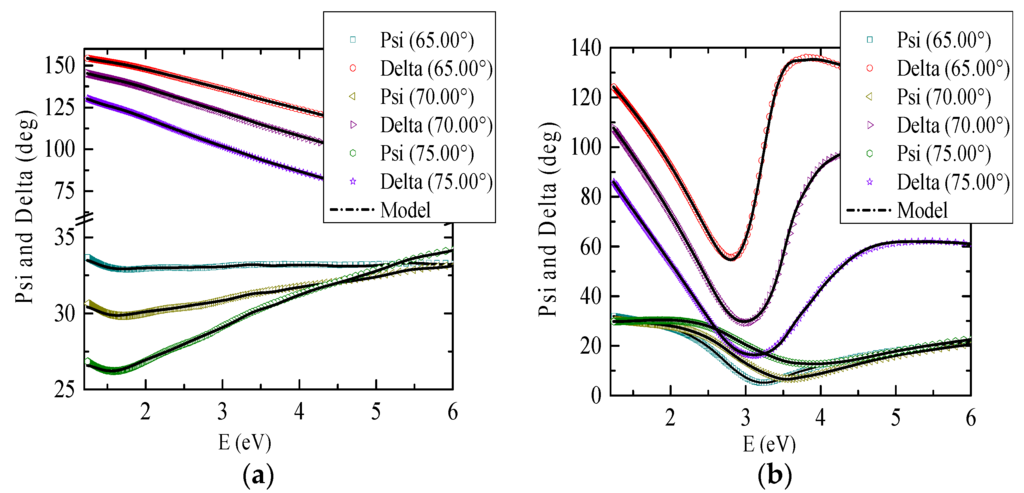
Figure 1.
Measured variable angle spectroscopic ellipsometric data of (a) Ru coated sample and (b) SiNx coated sample are compared with theoretical calculations (lines). Dark cyan, olive and green symbols correspond to Psi measurements at angles 65°, 70°, 75° respectively. Red, purple and violet symbols correspond to Delta measurements at angles 65°, 70°, 75° respectively.
Table 2.
Parameters of oscillators for model of GdFe layer for 1.5–6 eV spectral range. In here, E stands for central energies of oscillators; Amp represents amplitudes of oscillators and Br broadenings. For Drude term, N represents carrier concentration, μ carrier mobility and m* carrier effective mass.
| Oscillator Type | E (eV) | Amp | Br (eV) |
|---|---|---|---|
| Lorentz | 1.89 | 5.66 | 1.87 |
| Lorentz | 2.57 | 3.34 | 1.04 |
| Gaussian | 3.75 | 0.60 | 0.39 |
| Gaussian | 4.03 | 0.75 | 0.50 |
| - | N (cm−3) | μ (cm2·V−1s−1) | m* |
| Drude | 1.11 × 10²³ | 0.36 | 0.53 |
Table 3.
Thicknesses used to model GdFe layer for 1.5–6 eV spectral range. In here, t stands for thickness and r for roughness on top.
| Sample | (nm) | tGdFe (nm) | tRu (nm) | tSiN (nm) | r (nm) |
|---|---|---|---|---|---|
| Ru coated | 304 | 105 | 3.3 | - | 2 |
| SiNx coated | 304 | 105 | - | 21 | 3 |
Figure 2 shows obtained spectra of the real, ε1r, and imaginary part, ε1i, of diagonal permittivity tensor elements. Figure 3 shows the calculated absorption coefficient spectra of the GdFe thin film. The ε1r spectrum is characteristic by one global minimum at 2.9 eV while the ε1i decreases its value with increasing energy in the whole measured spectral range. The spectra show similar behavior to Fe and Gd [17] (p. 394), [18] and also to previously reported results on GdFe films with different compositions [6,19]. The behavior in the spectral range 1.5–3 eV, where ε1r decreases its value for higher energies is similar to the behavior of some transitions metals (including Cr, Ru, Ti, Gd [17] (p. 377), [20] (pp. 245, 259), [18]) and it was previously explained by intra-band transitions, which for some transition metals, are not negligible in a measured spectral region [17] (p. 375).
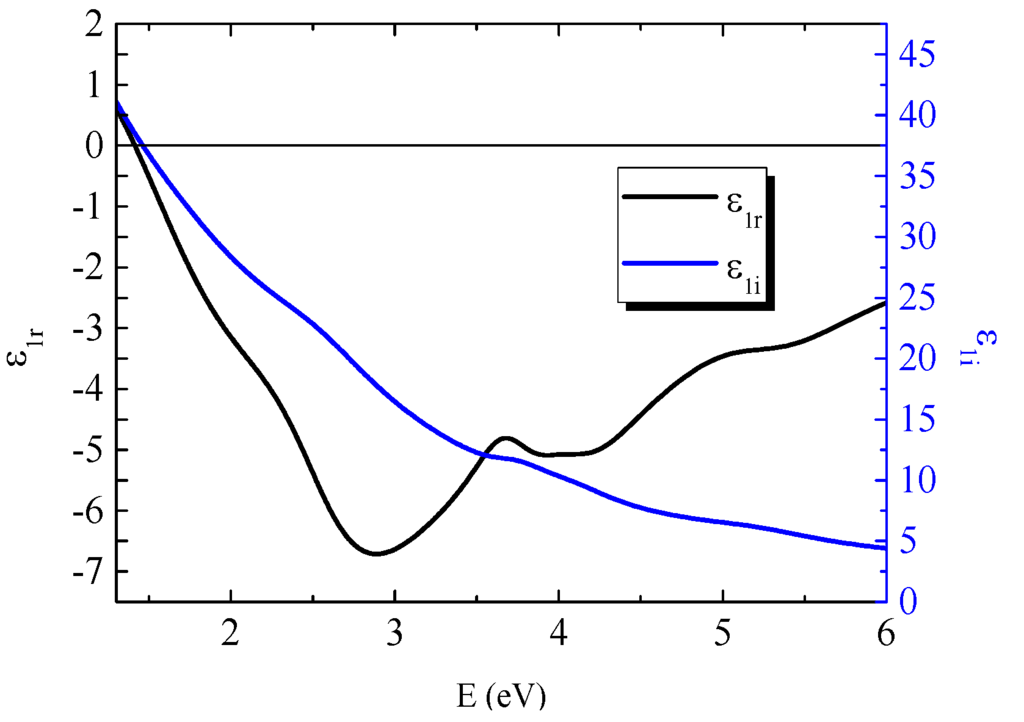
Figure 2.
Real and imaginary part of diagonal permittivity tensor elements of GdFe. Black line corresponds to the real part ε1r and blue line to the imaginary part ε1i respectively.

Figure 3.
Calculated absorption coefficient of GdFe.
2.2. Magneto-Optical Kerr Effect (MOKE) Spectroscopy
Figure 4 shows experimental polar MOKE rotation and ellipticity spectra of the Ru and SiNx coated samples. The MOKE spectra of the Ru coated sample are characteristic by increasing rotation and ellipticity amplitudes toward to smaller energies. The rotation spectrum of the SiNx coated sample is characteristic by one global maximum at 2.6 eV and the ellipticity spectrum by one global maximum at 2 eV. We can also observe that the sample with SiNx coating is, especially in the spectral range 1.5–3.5 eV, giving much higher MO signal than the sample with Ru coating. This is probably caused by the multiple reflections inside SiNx coating layer, which results in Fabry-Perot like resonance causing the enhancement of the MOKE in this energy region. We used MOKE spectra to calculate the off-diagonal elements of the GdFe dielectric permittivity tensor.
For the off-diagonal elements calculations we used the diagonal elements of the GdFe dielectric permittivity tensor and thicknesses determined by the spectroscopic ellipsometry. The real and imaginary parts of off-diagonal elements, ε2r and ε2i were calculated from the MOKE spectra in the spectral range 1.5–5.5 eV. Figure 5 shows the spectra of the real and imaginary parts of off-diagonal permittivity tensor elements calculated from the MOKE spectra of the Ru and SiNx coated samples As one can see, the difference between the samples is rather small. Resulted values of the off-diagonal GdFe permittivity tensor elements ε2r and ε2i were obtained by averaging these two results and they are also shown in Figure 5. The ε2r spectrum is characteristic by one global minimum around 2.5 eV while ε2i is positive and decreases its amplitude with energy in the whole measured spectral range. The obtained spectra revealed a similar shape as off-diagonal permittivity elements of iron and also previously reported spectra of GdFe with different composition [19,21]. Amplitudes of GdFe off-diagonal permittivity elements spectra are smaller than amplitudes for Fe, which is most probably caused by the presence of the Gd.

Figure 4.
Polar magneto-optical Kerr effect (MOKE) rotation and ellipticity spectra of (a) Ru coated sample and (b) SiNx coated sample. Black symbols correspond to Kerr rotation; red symbols correspond to Kerr ellipticity.
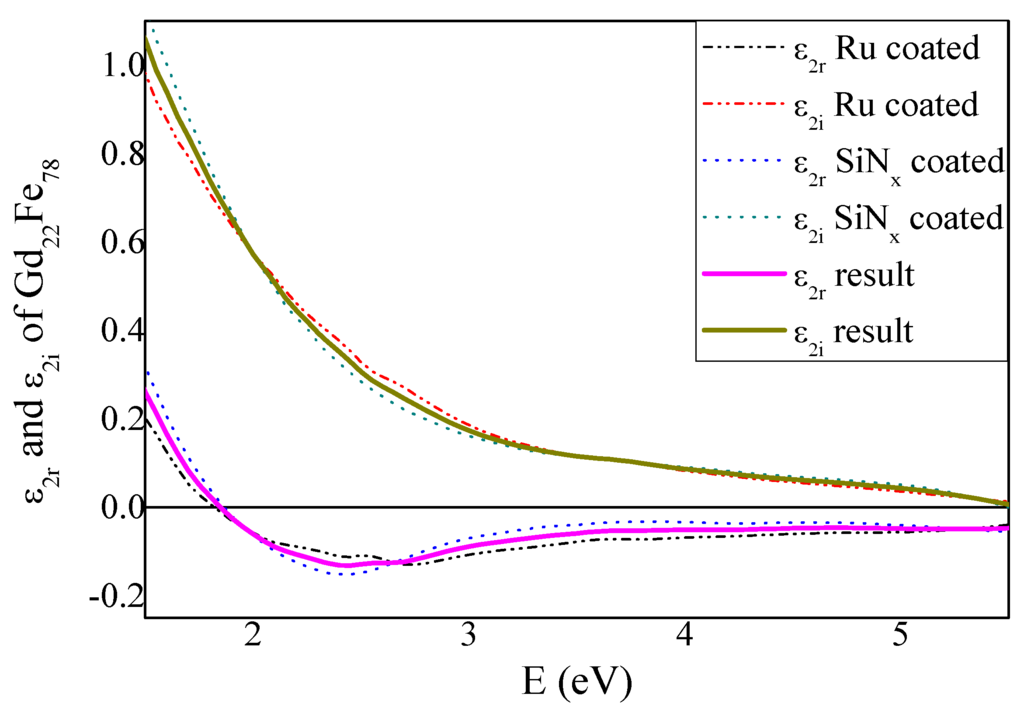
Figure 5.
Real and imaginary part of off-diagonal permittivity tensor elements of GdFe. Dash-dot lines correspond to calculations from the Ru coated sample MOKE spectra, dotted lines correspond to calculations from the SiNx coated sample MOKE spectra. Pink line corresponds to the averaged real part ε2r and green line to the averaged imaginary part ε2i respectively.
3. Materials and Methods
3.1. Theory
The material response on electromagnetic waves in the presence of an external magnetic field can be described by the dielectric permittivity tensor. If the magnetization vector is parallel to the z-axis of the Cartesian coordinate system (the magnetic film-ambient interface is normal to the z-axis, light is propagating along the z-axis) and if we restrict ourselves to linear MO effects, the dielectric permittivity tensor simplifies to the form [22]:
All elements of the tensor have real and imaginary parts:
The optical behavior of the sample upon light reflection can be in Cartesian representation with the base of s and p polarizations described by the Jones matrix of reflection [23] (p. 170):
Matrix elements are amplitude reflection coefficients for the s and p waves. The change in the polarization state of the reflected beam can be then expressed by the ellipsometric parameters Psi (ψ) and Delta (Δ), which are defined as:
Where tanψ is the magnitude of the reflectivity ratio and Δ is the phase change between s and p polarized light. The rpp and rss are measured from the AC signal (dual rotating compensator ellipsometer configuration) [16] (p. 34). Analyzing the experimental ellipsometric data, one can derive the diagonal elements of the permittivity tensor. The important step in the spectroscopic ellipsometry analysis is the proper parametrization of the dispersion of the unknown optical functions. In this work we used Kramers-Kronig (KK) consistent Lorentz, Gaussian and Drude models. Classic version of Lorentz oscillator model can be mathematically described as:
Parameters E0, Amp, Br denote the center energy, amplitude and the broadening parameter respectively [16] (p. 343), [24]. Gaussian line shape in ε1i is defined as:
where
The function Γ is a convergence series that produces a Kramers-Kronig consistent line shape for ε1r [16] (p. 344), [25]. In order to describe the free carrier effect on the dielectric response, Drude model is commonly used:
Parameters N, μ, m* denote the carrier concentration, carrier mobility and carrier effective mass respectively. The physical constants are ħ (Planck constant/2π), q (electron charge), ε0 (the vacuum dielectric constant) and me (the electron mass) [16] (p. 344) [26].
Spectroscopic MOKE can be used to derive off-diagonal elements of the permittivity tensor. In here we used the Yeh matrix formalism for anisotropic multilayers to theoretically calculate the MOKE effect in studied samples [23] (p. 344), [22,27]. The change in the polarization state of the reflected beam in the polar MOKE experiment can be expressed by the complex MO Kerr angle ΦK, which is for p-polarization and small angles of incidence defined as follows:
In this equation θk is the Kerr rotation, ek is the Kerr ellipticity. Let us consider the case of the three layered medium prepared on a bulk substrate. We will work in Cartesian coordinates where the sample interface is perpendicular to the z-axis, the wave vector of the incident light is perpendicular to the x-axis and each layer is characterized by the complex permittivity tensor and the thickness. In this case the Yeh Matrix Formalism allows to express the relationship between the electric field amplitudes on the substrate/film interface (E0(0)(z)) and the electric field amplitudes on the coating ambient interface (E0(4)(z3)) as:
Here M stands for transfer matrix (related to reflection coefficients) between substrate/film interface and coating ambient interface. Superscripts in brackets, n = 0, 1, 2, 3 and 4 are markers of the substrate (0), three layers and ambient half space (4). P stands for propagation matrix
and D for dynamical matrix defined as:
where tn, Nzj and Ny are the thickness of the n-th layer, z components of the reduced wave vector and y components of the reduced wave vector respectively [23] (p. 151).
The structural composition and nominal thicknesses used for the theoretical analysis of ellipsometric and MOKE experimental data are described in the Table 1. The model structure consisted of Si semi-infinite substrate followed by 300 nm thick buffer layer of SiO2 and 100 nm thick layer of GdFe. Finally, it was followed by a coating which was 3 nm thick Ru layer for Ru coated sample and 20 nm thick SiNx layer in the case of SiNx coated sample. Surface roughness was also considered. We used the Bruggeman Effective Medium Approximation formula of the mixture of hosting material (ε) with void to simulate surface roughness as a thin layer with permittivity εeff defined as follows [28]:
In this formula f denotes the volume fraction of the void in the mixture (we fixed this value to 50%).
3.2. Experimental Details
In this work we analyzed two samples with structural compositions and nominal thicknesses listed in the Table 1. The GdFe and Ru layers were deposited by direct current sputtering technique in Kr gas of pressure 8.7 × 10⁻² Pa with a deposition rate of 3.6 nm/min. The SiNx film was prepared by RF ion beam sputtering technique in Kr gas of pressure 7.8 × 10⁻² Pa with the deposition rate of 3.9 nm/min.
3.2.1. Spectroscopic Ellipsometry Measurements
Spectroscopic Ellipsometry measurements were performed by a Mueller matrix ellipsometer Woollam RC2 (J.A. Woollam Co. Inc., Lincoln, NE, USA). We measured ellipsometric Psi and Delta parameters of the reflected light in the spectral range from 1.3 to 6 eV for incident angles 65°, 70° and 75°. Obtained experimental data were analyzed using CompleteEase software in “Multi Sample Analysis” mode.
3.2.2. Magneto-Optical Measurements
Magneto-optical properties of samples were measured by the MOKE spectroscopy. The MOKE rotation and ellipticity spectra were measured in the polar configuration using a method of generalized magneto-optical ellipsometry with rotating analyzer, allowing the determination of the rotation angles with high accuracy. The spectra of polar Kerr rotation and ellipticity were acquired at the room temperature for nearly normal light incidence. Applied magnetic field was 1.2 T, which was enough for magnetic saturation of the samples. Incident light was p-polarized. The data were recorded in the photon energy range from 1.4 to 5.5 eV.
4. Conclusions
In this paper we presented systematic optical and magneto-optical study of the GdFe thin films prepared by DC sputtering technique. Since GdFe is easy to oxidize it was protected by the coating layers. Here Ru or SiNx layers were chosen. We used the assumption that optical and MO properties of the GdFe material will not change regardless of whether Ru or SiNx is deposited on its top. In experimental part, we performed spectroscopic ellipsometry and MOKE spectroscopy. Significant enhancement of MOKE was observed for the sample with SiNx coating, which was ascribed to the multiple reflections in SiNx layer. Combination of ellipsometric and MOKE spectroscopy allowed us to successfully determine the full dielectric permittivity tensor and the absorption coefficient spectra of the GdFe thin film prepared on the SiO2 buffer layer. Optical constants of Si, SiO2, Ru and SiNx used in our analysis were determined from the ellipsometry measurements on individual samples. The knowledge of the permittivity tensor is crucial, since it allows theoretical prediction of complex physical properties of complicated multilayered nanostructures containing GdFe layers without necessity to manufacture multiple samples.
Acknowledgments
This research was supported by the National Institute of Information and Communications Technology (NICT). Financial support of Czech Grant Agency (grant No. 13-30397S) is also acknowledged.
Author Contributions
Takayuki Ishibashi, Martin Veis and Ken-ichi Aoshima conceived and designed the experiments; Kiyoshi Kuga and Ken-ichi Aoshima performed the composition analysis for the fabricated films and analysis equipment set up; Martin Veis co-wrote the paper; Kenji Machida set up sample deposition system; Hidekazu Kinjo and Takahiro Hashinaka fabricated samples; Lukáš Beran performed MOKE measurements; Ján Dušek performed spectroscopic ellipsometry measurements; Roman Antoš contributed to theoretical modeling; Eva Jesenská performed theoretical analysis of the data and wrote the paper.
Conflicts of Interest
The authors declare no conflict of interest.
References
- Imamura, N.; Ota, C. Experimental study on magneto-optical disk exerciser with the laser diode and amorphous magnetic thin films. Jpn. J. Appl. Phys. 1980, 19, L731–L734. [Google Scholar] [CrossRef]
- Aoshima, K.; Machida, K.; Kato, D.; Mishina, T.; Wada, K.; Cai, Y.-F.; Kinjo, H.; Kuga, K.; Kikuchi, H.; Ishibashi, T.; et al. A magneto-optical spatial light modulator driven by spin transfer switching for 3D holography applications. J. Disp. Technol. 2015, 11, 129–135. [Google Scholar] [CrossRef]
- Mangin, S.; Marchal, G.; Bellouard, C.; Wernsdorfer, W.; Barbara, B. Magnetic behavior and resistivity of the domain-wall junction GdFe (1000 Å)/TbFe/GdFe (500 Å). Phys. Rev. B 1998, 58, 2748–2757. [Google Scholar] [CrossRef]
- Nishimura, N.; Hirai, T.; Koganei, A.; Ikeda, T.; Okano, K.; Sekiguchi, Y.; Osada, Y. Magnetic tunnel junction device with perpendicular magnetization films for high-density magnetic random access memory. J. Appl. Phys. 2002, 91. [Google Scholar] [CrossRef]
- Urner-Wille, M.; Witter, K. Compensation point switching in homogeneous amorphous GdFe-films. J. Magn. Magn. Mater. 1979, 13, 77–80. [Google Scholar] [CrossRef]
- Shen, Z.; Li, J.; Wang, S.; Zhou, S.; Chen, L. Magneto-optical and optical properties of GdFe films. In Proceedings of the Fifth International Symposium on Optical Storage, Shanghai, China, 22–26 May 2000.
- Sugano, S.; Kojima, N. Magneto-Optics; Springer: Tokyo, Japan, 2011; p. 282. [Google Scholar]
- Boernstein, L. Magnetic Properties of Metals; Springer-Verlag: Tokyo, Japan, 1986; p. 172. [Google Scholar]
- Aoshima, K.; Hashimoto, Y.; Funabashi, N.; Machida, K.; Kuga, K.; Kikuchi, H.; Shimidzu, N.; Ishibashi, T. Spin transfer switching of current-perpendicular-to-plane giant magnetoresistance with various Gd-Fe free-layer compositions. J. Appl. Phys. 2012, 111. [Google Scholar] [CrossRef]
- Kinjo, H.; Machida, K.; Matsui, K.; Aoshima, K.-i.; Kato, D.; Kuga, K.; Kikuchi, H.; Shimidzu, N. Low-current-density spin-transfer switching in Gd22Fe78-MgO magnetic tunnel junction. J. Appl. Phys. 2014, 115. [Google Scholar] [CrossRef]
- Goto, S.; Machida, K.; Aoshima, K.; Kuga, K.; Kikuchi, H.; Shimidzu, N.; Ishibashi, T. Magneto-optical Properties of (Pt/Co)/X/IZO (X = Ta, Au, Pt, Ru and Ag) Structures for Magneto-optical Spatial Light Modulators. EPJ Web Conf. 2013, 40. [Google Scholar] [CrossRef]
- Terzieff, P.; Lee, K. Electron spectroscopy studies on amorphous GdFe and GdCo alloys. J. Appl. Phys. 1979, 50, 3565–3569. [Google Scholar] [CrossRef]
- Henein, G.E.; Wagner, W.R. Stresses induced in GaAs by TiPt ohmic contacts. J. Appl. Phys. 1983, 54, 6395–6400. [Google Scholar] [CrossRef]
- Greer, J.R.; Oliver, W.C.; Nix, W.D. Size dependence of mechanical properties of gold at the micron scale in the absence of strain gradients. Acta Mater. 2005, 53, 1821–1830. [Google Scholar] [CrossRef]
- Nix, W.D. Mechanical properties of thin films. Metall. Tran. A 1989, 20A, 2217–2245. [Google Scholar] [CrossRef]
- CompleteEASE Data Analysis Manual. Available online: https://crn2.3it.usherbrooke.ca/guide_sb/appareils/Ellipsometre/CompleteEASE%20Manual.pdf (accessed on 24 December 2015).
- Palik, E.D. Handbook of Optical Constants of Solids, 2nd ed.; Academic Press: Waltham, MA, USA, 1991. [Google Scholar]
- Quemerais, A.; Loisel, B.; Jezequel, G.; Thomas, J.; Lemonnier, J.C. Optical spectra of gadolinium and dysprosium: Study of the 5p thresholds. J. Phys. F Met. Phys. 1981, 11, 293–303. [Google Scholar]
- Ferguson, P.E.; Romagnoli, R.J. Transverse Kerr magneto-optic effect and optical properties of transition-rare-earth Alloys. J. Appl. Phys. 1969, 40, 1236–1238. [Google Scholar] [CrossRef]
- Palik, E.D. Handbook of Optical Constants of Solids, 3rd ed.; Academic Press: Waltham, MA, USA, 1998. [Google Scholar]
- Visnovsky, S.; Lopusnik, R.; Nyvlt, M.; Das, A.; Krishnan, R.; Tessier, M.; Frait, Z.; Aitchison, P.; Chapman, J.N. Magneto-optic studies of Fe/Au multilayers. J. Magn. Magn. Mater. 1999, 198, 480–482. [Google Scholar] [CrossRef]
- Višňovský, Š. Magneto-optical effects in crystals at the normal incidence. Czech. J. Ph. 1987, 37, 218–231. [Google Scholar]
- Višňovský, Š. Optics in Magnetic Multilayers and Nanostructures; Taylor & Francis: Abingdon, VA, USA, 2006. [Google Scholar]
- Wooten, F. Optical Properties of Solids; Academinc Press, Inc.: New York, NY, USA, 1972; p. 52. [Google Scholar]
- Meneses, D.D.S.; Malki, M.; Echegut, P. Structure and lattice dynamics of binary lead silicate glasses investigated by infrared spectroscopy. J. Non-Cryst. Solids 2006, 352, 769–776. [Google Scholar] [CrossRef]
- Tiwald, T.E.; Thompson, D.W.; Woollam, J.A.; Paulson, W.; Hance, R. Application of IR variable angle spectroscopic ellipsometry to the determination of free carrier concentration depth profiles. Thin Solid Films 1998, 313–314, 661–666. [Google Scholar] [CrossRef]
- Yeh, P. Optics of anisotropic layered media: A new 4 × 4 matrix algebra. Surf. Sci. 1979, 96, 41–53. [Google Scholar] [CrossRef]
- Halagačka, L.; Postava, K.; Vanwolleghem, M.; Vaurette, F.; Ben Youssef, J.; Dagens, B.; Pištora, J. Mueller matrix optical and magneto-optical characterization of Bi-substituted gadolinium iron garnet for application in magnetoplasmonic structures. Opt. Mater. Express 2014, 4, 1903–1919. [Google Scholar] [CrossRef]
© 2016 by the authors; licensee MDPI, Basel, Switzerland. This article is an open access article distributed under the terms and conditions of the Creative Commons by Attribution (CC-BY) license (http://creativecommons.org/licenses/by/4.0/).