Microstructure of Haynes® 282® Superalloy after Vacuum Induction Melting and Investment Casting of Thin-Walled Components

Abstract
:1. Introduction
2. Material and Experimental Procedure
2.1. Material for Investigation

| Chemical element | Chemical composition in wt % of Haynes® 282® | |
|---|---|---|
| As received | As-cast | |
| C | 0.0598 | 0.0563 |
| Si | 0.066 | 0.073 |
| S | 0.0036 | 0.0025 |
| P | 0.006 | 0.006 |
| Mn | 0.038 | 0.027 |
| Cr | 20.27 | 20.11 |
| Mo | 8.21 | 8.06 |
| V | 0.032 | 0.03 |
| W | 0.08 | 0.07 |
| Ti | 2.32 | 2.25 |
| Co | 10.02 | 9.95 |
| Al | 1.74 | 1.68 |
| B | 0.003 | 0.003 |
| Nb | 0.06 | 0.06 |
| Ta | 0.03 | 0.03 |
| Mg | 0.006 | 0.003 |
| Fe | 1.21 | 1.17 |
| Zr | 0.00137 | 0.00098 |
| N | 55 ppm | 79 ppm |
| Ni | Balance | Balance |
2.2. Investment Casting
2.3. Microstructure Characterization of As-Cast Haynes® 282®
3. Results and Discussion
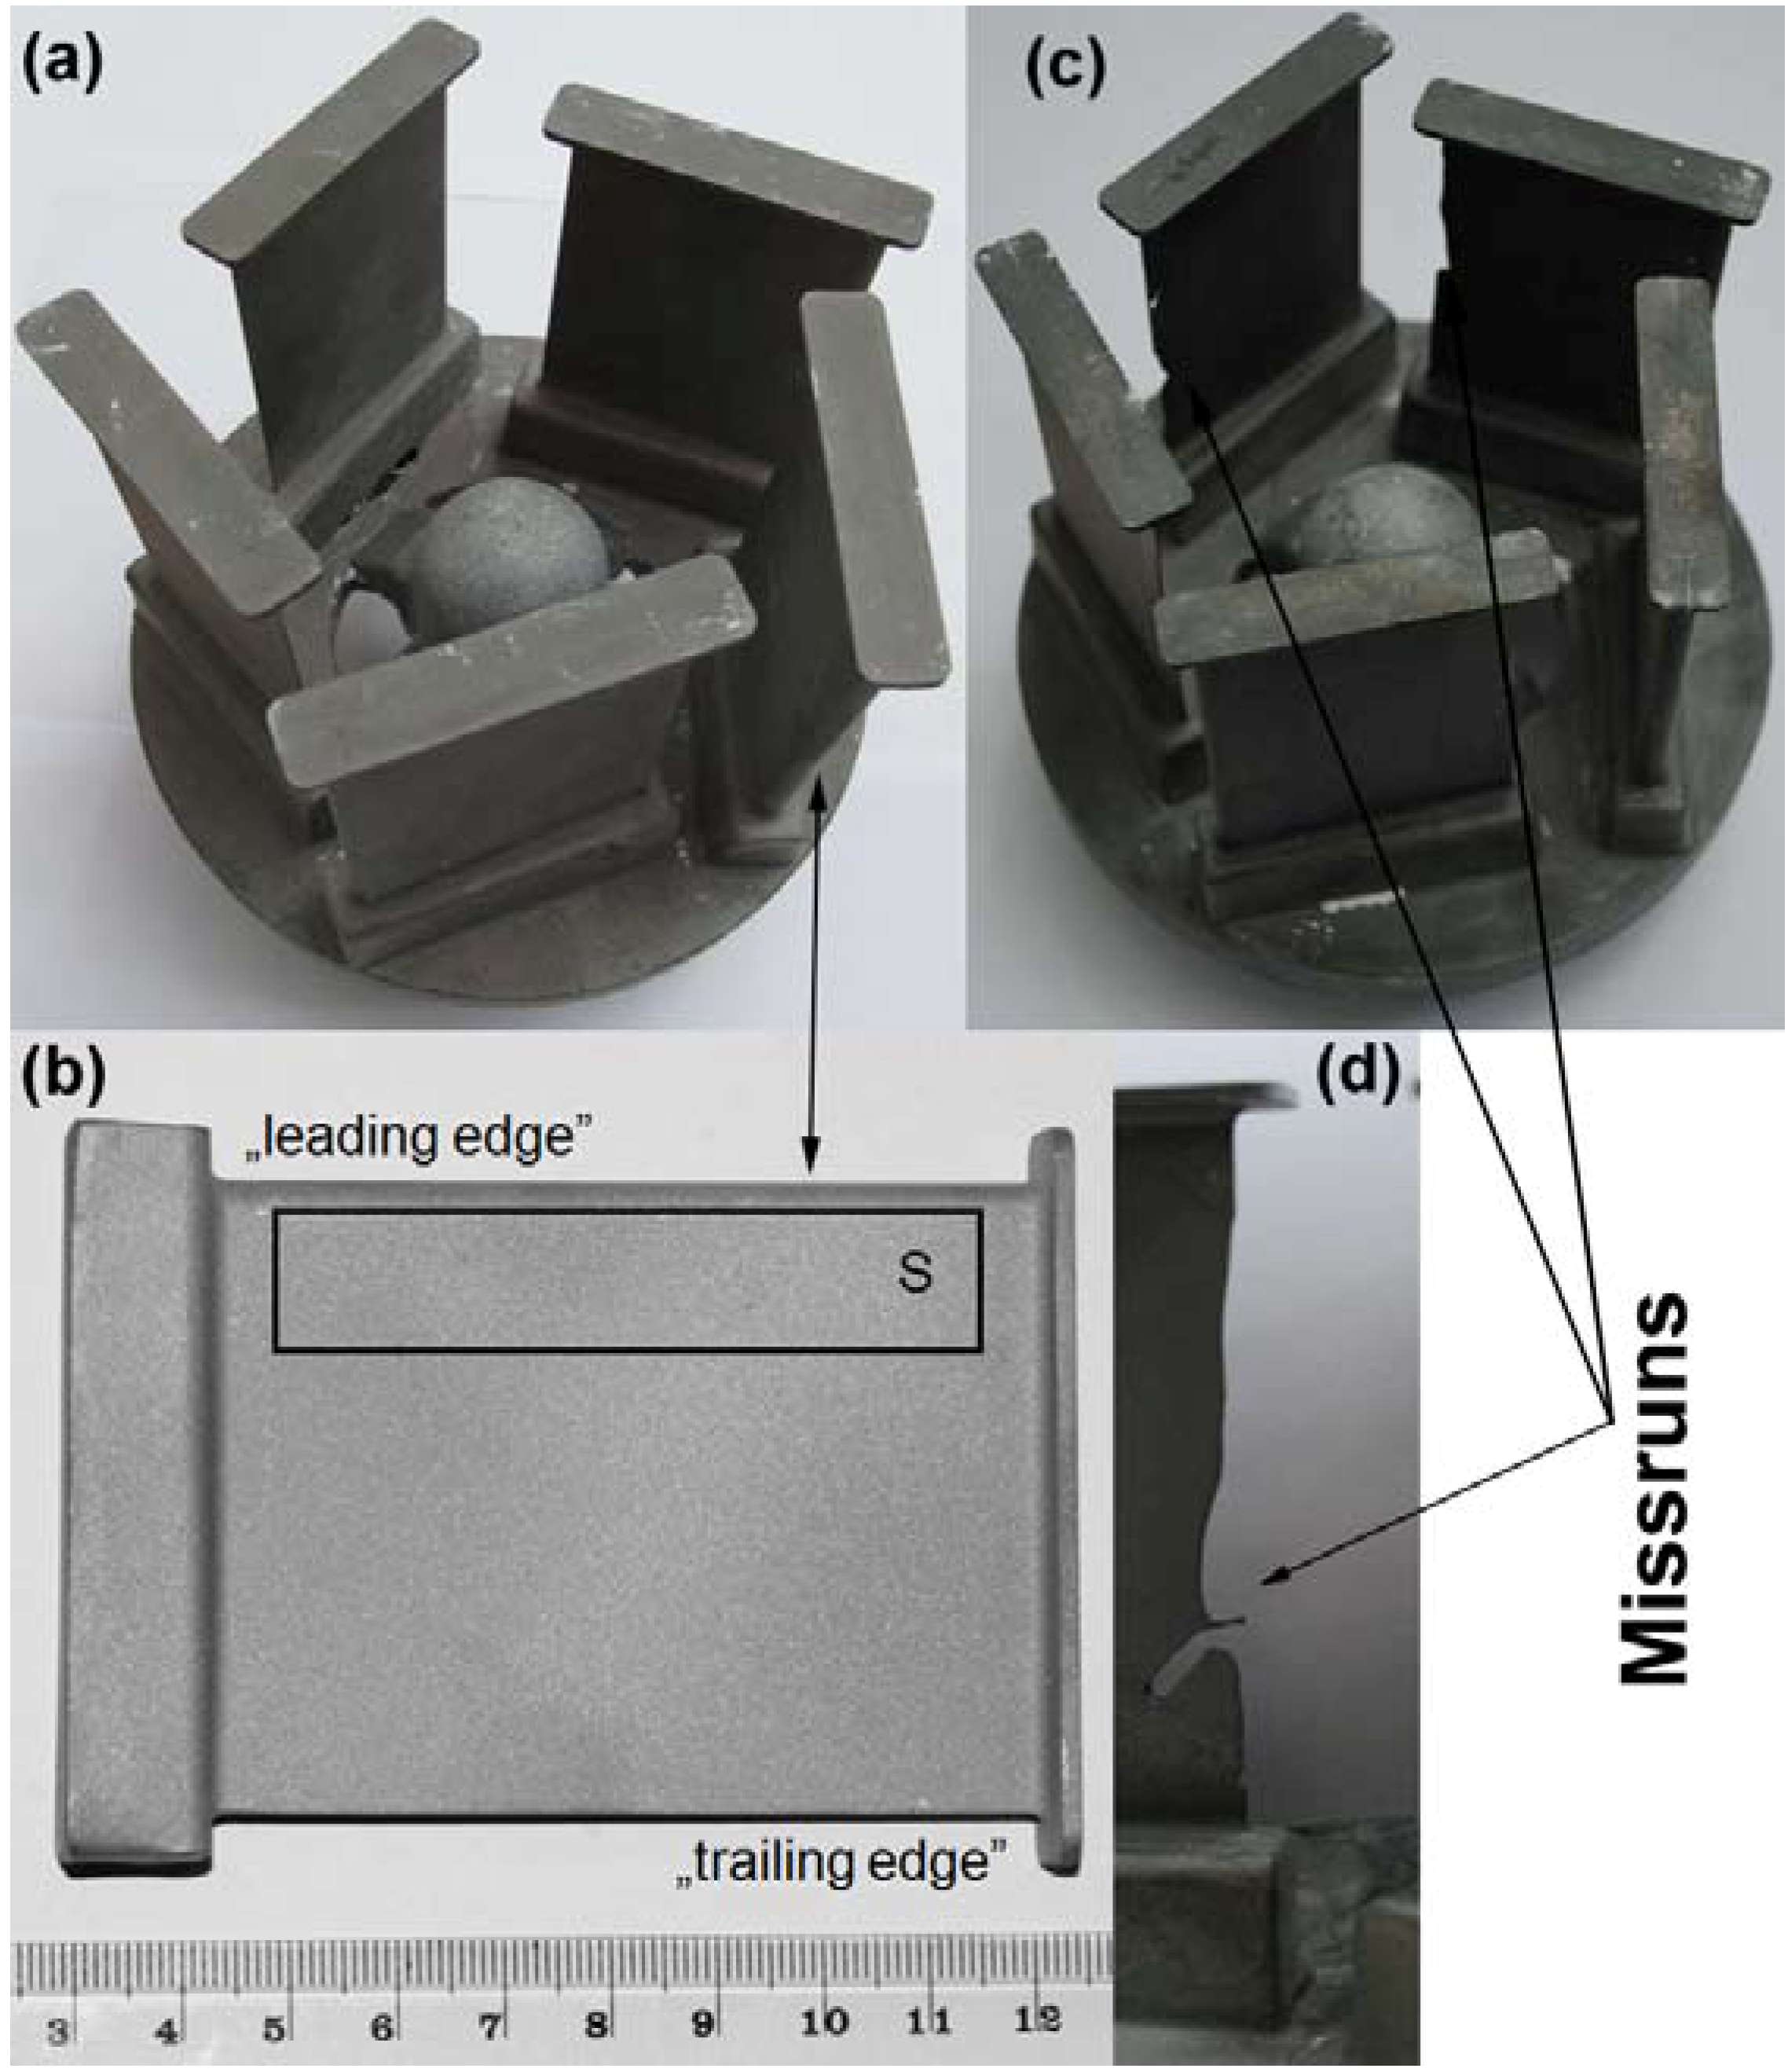
3.1. Investment Casts
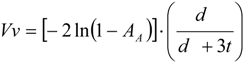
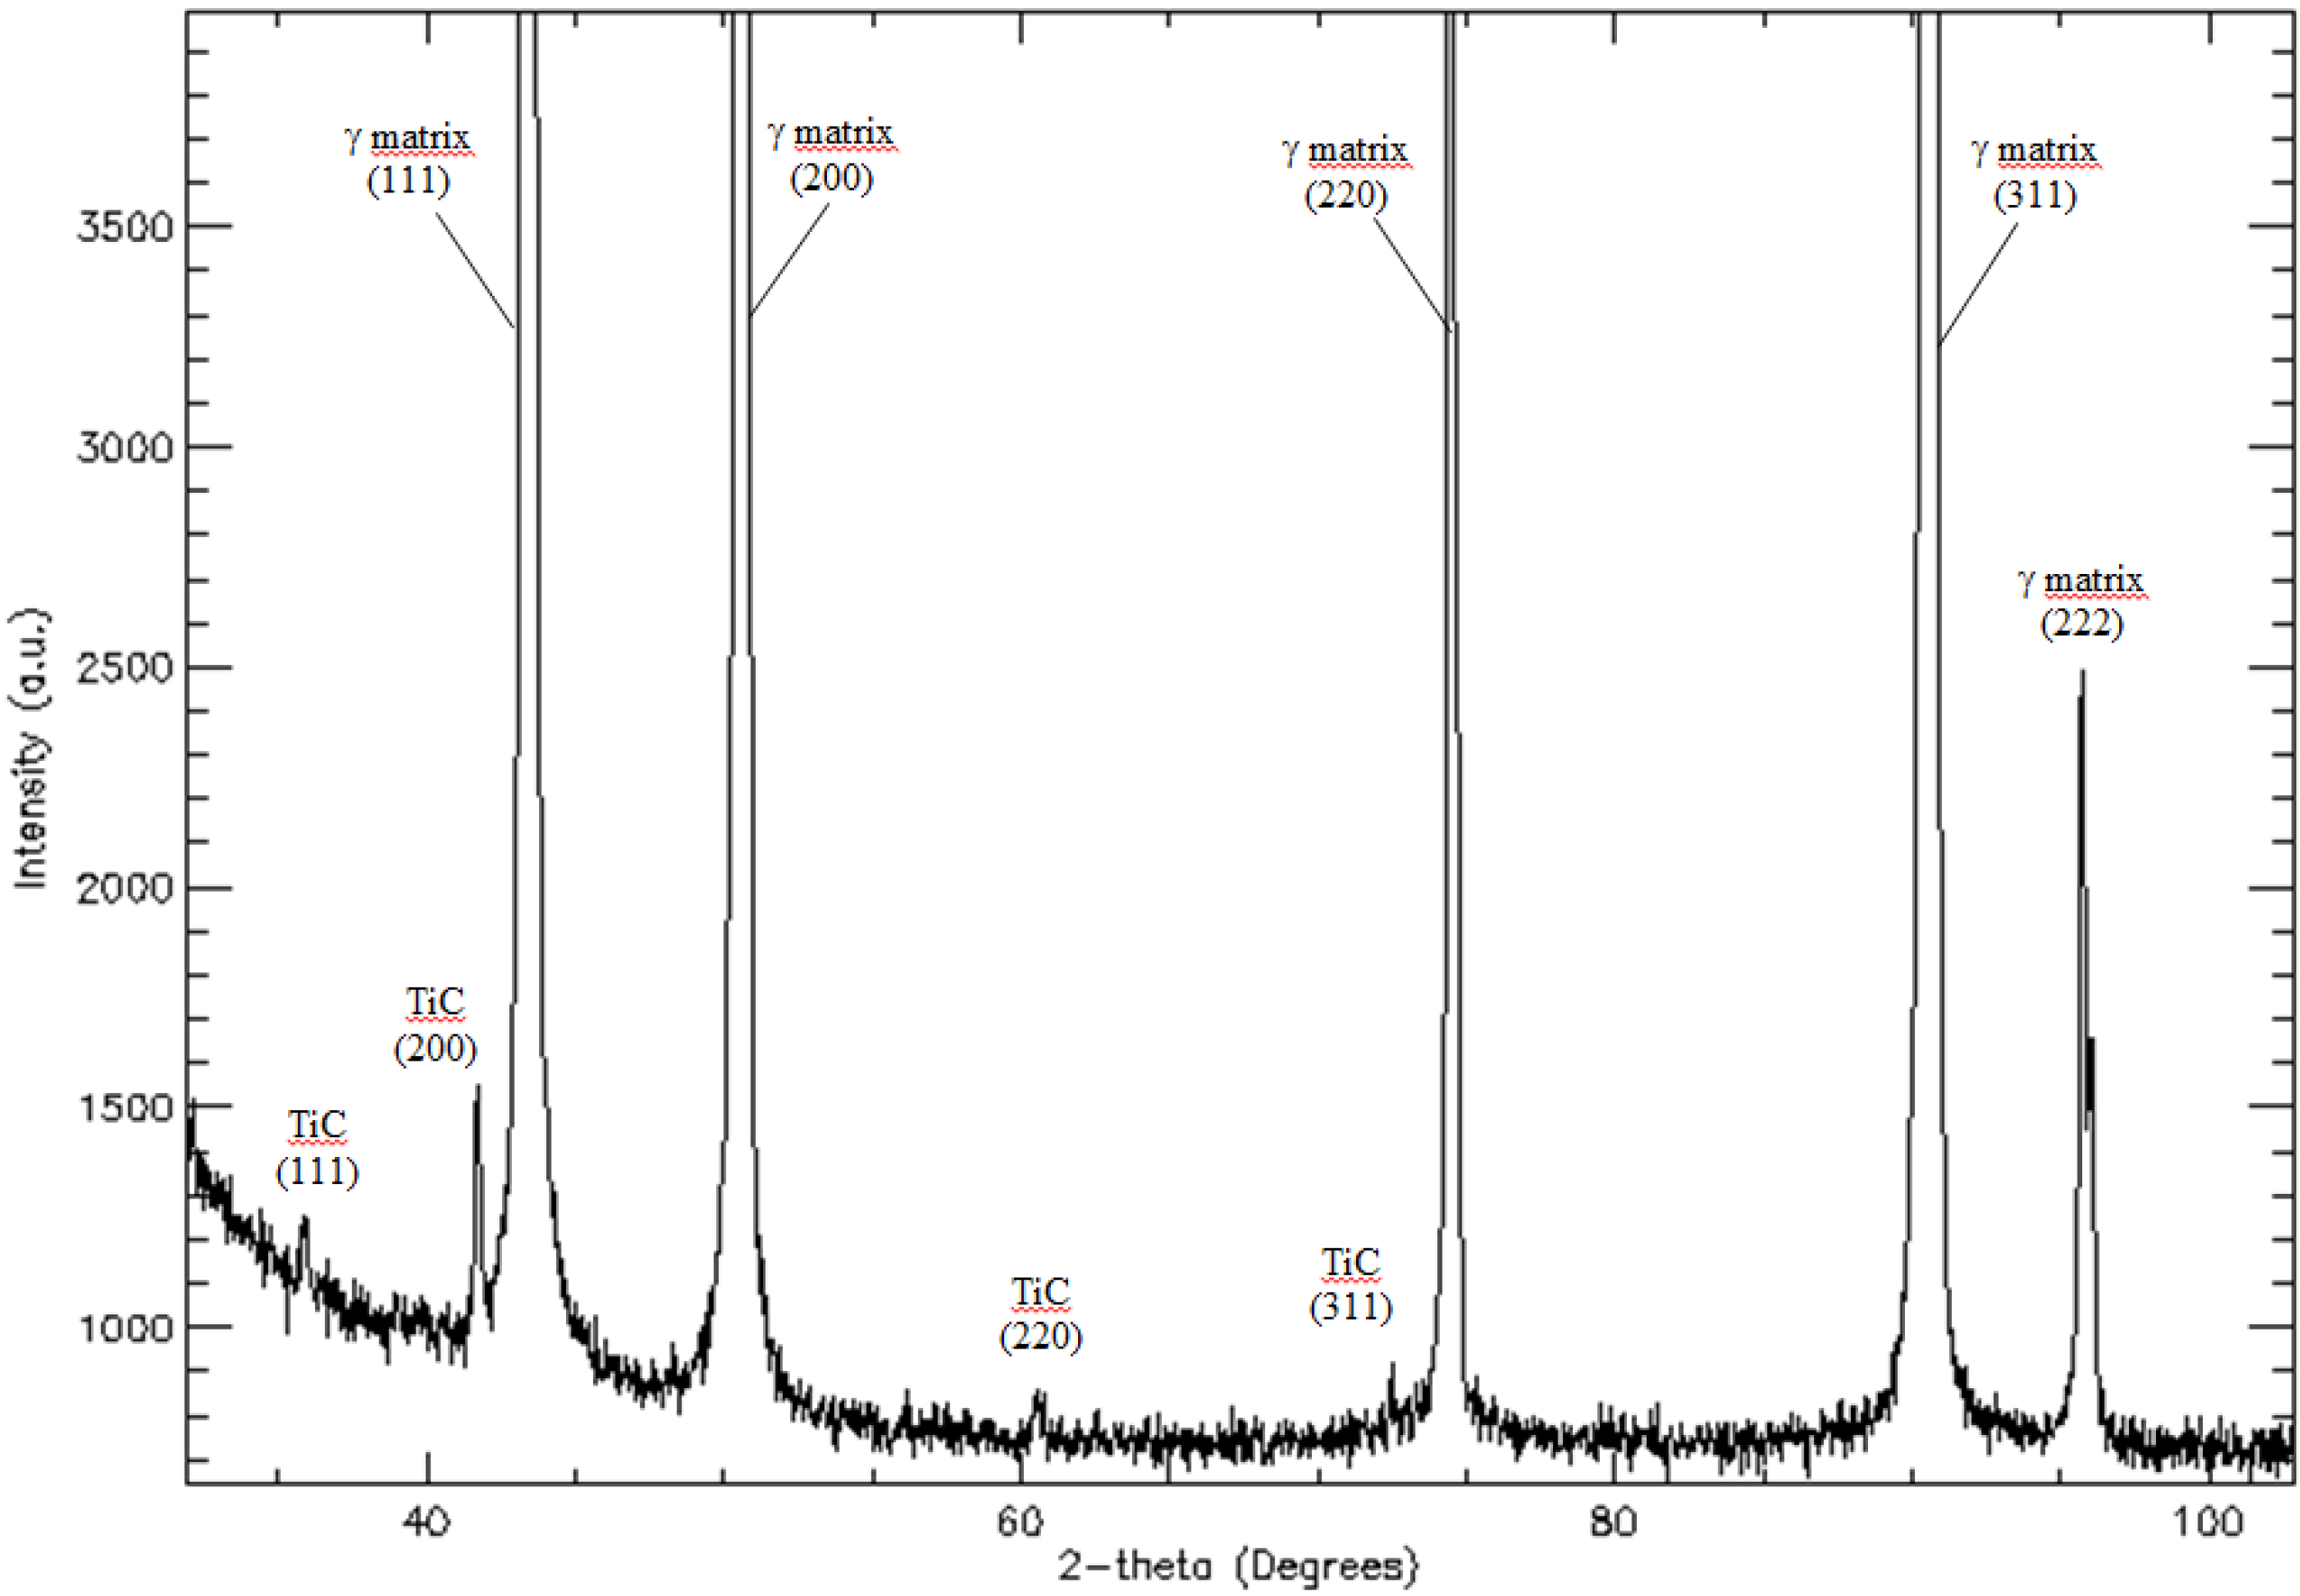
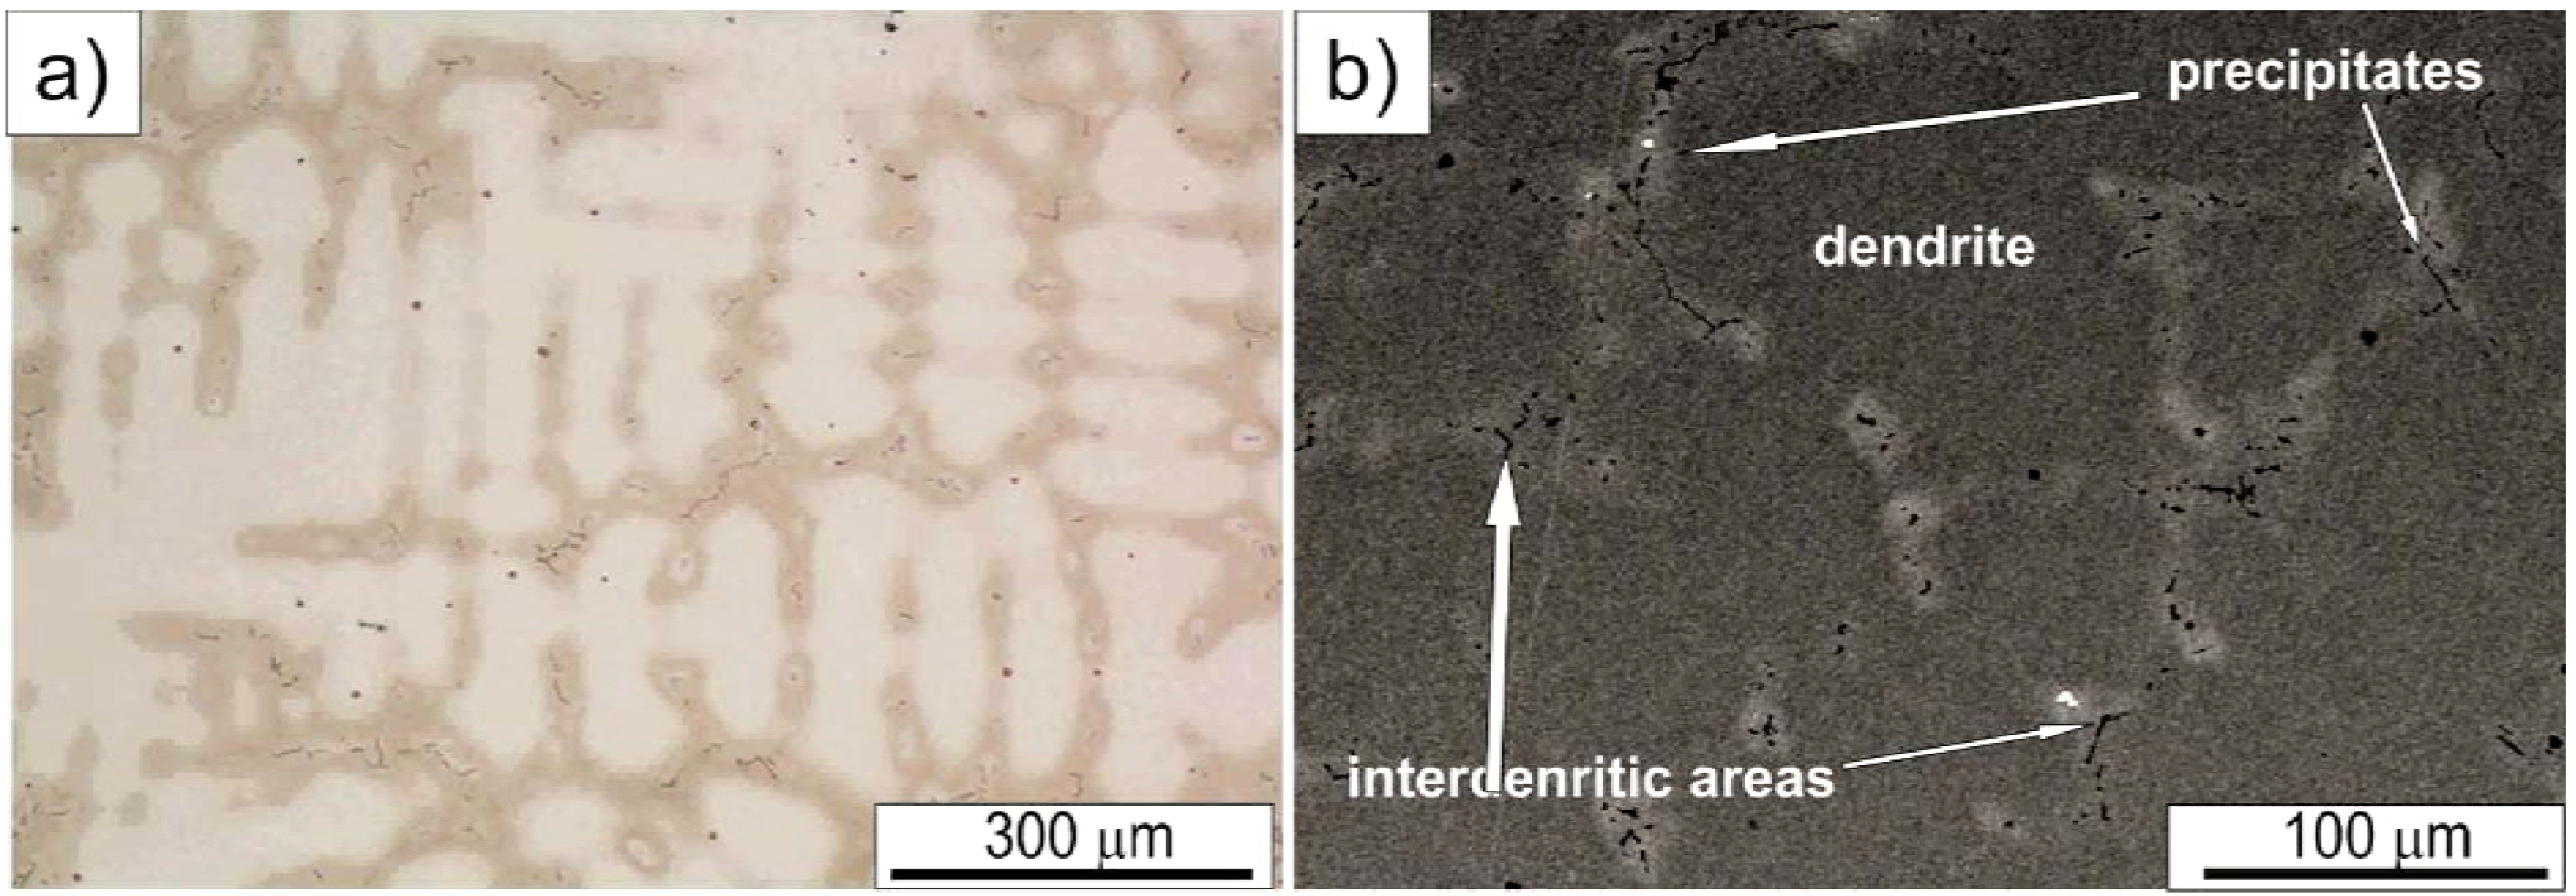
3.2. Microstructure of As-Cast Haynes® 282®
| (hkl) | d(hkl) [Å] | a0 [Å] | d(hkl) [Å] | a0 [Å] |
|---|---|---|---|---|
| Measurement: TEM *; XRD ** | Powder diffraction file | |||
| γ matrix FCC Fm3m (225) | PDF No. 47-1417 | |||
| (111) | 2.08 *; 2.08 ** | 3.61 *; 3.61 ** | 2.079 | 3.601 |
| (200) | 1.79 *; 1.80 ** | 3.58 *; 3.61 ** | 1.800 | 3.600 |
| (311) | 1.08 *; 1.09 ** | 3.57 *; 3.60 ** | 1.085 | 3.599 |
| (222) | 1.04 *; 1.04 ** | 3.60 *; 3.60 ** | 1.038 | 3.596 |
| (400) | 0.89 *; – ** | 3.56*; – ** | 0.900 | 3.600 |
| (331) | 0.83 *; – ** | 3.61*; – ** | 0.826 | 3.601 |
| γʹ FCC ordered L12 | PDF No. 09-0097 | |||
| (100) | 3.57 *; – ** | 3.57 *; – ** | 3.600 | 3.600 |
| (111) | 2.08 *; – ** | 3.61 *; – ** | 2.074 | 3.593 |
| (200) | 1.79 *; – ** | 3.58 *; – ** | 1.799 | 3.598 |
| (211) | 1.47 *; – ** | 3.60 *; – ** | 1.461 | 3.579 |
| (311) | 1.08 *; – ** | 3.57 *; – ** | 1.078 | 3.575 |
| (222) | 1.04 *; 1.02 ** | 3.60 *; 3.53 ** | 1.032 | 3.575 |
| (400) | 0.89 *; – ** | 3.56 *; – ** | 0.893 | 3.572 |
| (331) | 0.83 *; – ** | 3.61 *; – ** | 0.819 | 3.570 |
| MC (TiC) FCC Fm3m (225) | PDF No. 32-1383 | |||
| (111) | 2.46 *; 2.50 ** | 4.26 *; 4.33 ** | 2.499 | 4.328 |
| (200) | 2.14 *; 2.17 ** | 4.28 *; 4.17 ** | 2.164 | 4.164 |
| (220) | 1.49 *; 1.53 ** | 4.23 *; 4.32 ** | 1.530 | 4.328 |
| (311) | 1.29 *; 1.30 ** | 4.28 *; 4.32 ** | 1.305 | 4.327 |
| Secondary carbides: M23C6 FCC Fm3m (225)/M6C FCC Fd3m (227) | PDF No. 85-1281/PDF No. 47-1192 | |||
| (111) | 6.19 *; – ** | 10.72 *; – ** | 6.154 /6.429 | 10.659 /11.130 |
| (200) | 5.40 *; – ** | 10.79 *; – ** | 5.330 /5.569 | 10.659 /11.130 |
| (220) | 3.79 *; – ** | 10.71 *; – ** | 3.769 /3.939 | 10.660 /11.130 |
| (311) | 3.30 *; – ** | 10.96 *; – ** | 3.214 /3.359 | 10.660 /11.130 |
| Precipitation | MN | MC | σ and lamellar constituent | M2SC | γʹ dendrite | γʹ interdendritic |
|---|---|---|---|---|---|---|
| d [μm] | 4.04 | 2.48 | 2.87 | 0.76 | 0.074 | 0.113 |
| NA [L/mm2] | 55 | 550 | 19 | 6 | – | – |
| NV [L/mm3] | 14 × 103 | 222 × 103 | 7 × 10³ | 8 × 10³ | – | – |
| VV [%] | – | – | – | – | 9.6 | 8.5 |

| Phase | Chemical composition in at % | |||
|---|---|---|---|---|
| MC | MN | σ | secondary carbide/γ lamellar constituent | |
| N | – | 56.7 ± 0.5 | – | – |
| C | 52.7 ± 2.4 | – | – | 20.7 ± 7.9 |
| Si | – | – | 1.0 ± 0.4 | 0.7 ± 0.1 |
| Ti | 30.7 ± 1.8 | 42.5 ± 0.9 | 1.0 ± 0.3 | – |
| Cr | 1.7 ± 0.5 | 0.3 ± 0.1 | 29.0 ± 0.7 | 22.4 ± 3.4 |
| Co | – | – | 9.5 ± 0.7 | 8.0 ± 1.3 |
| Ni | 1.4 ± 0.7 | 0.7 ± 0.1 | 27.8 ± 0.8 | 23.7 ± 6.0 |
| Mo | 13.6 ± 0.8 | – | 31.0 ± 0.6 | 24.1 ± 0.7 |
| Al | MC | MN | 0.5 ± 0.1 | – |

| (hkl) | d(hkl) [Å] | a0 [Å] | c0 [Å] | a0 [Å] | c0 [Å] |
|---|---|---|---|---|---|
| Measurement | Powder diffraction data | ||||
| σ phase-Tetragonal, P42/mnm (136) | |||||
| (110) | 6.14 | – | – | – | – |
| (001) | 4.66 | – | – | – | – |
| (111) | 3.73 | – | – | 9.170 * | 4.741 * |
| (221) | 2.57 | – | – | 8.810 ** | 4.560 ** |
| (112) | 2.20 | 8.68 | 4.66 | 8.790 *** | 4.544 *** |


3.3. Solidification of Haynes® 282® Superalloy
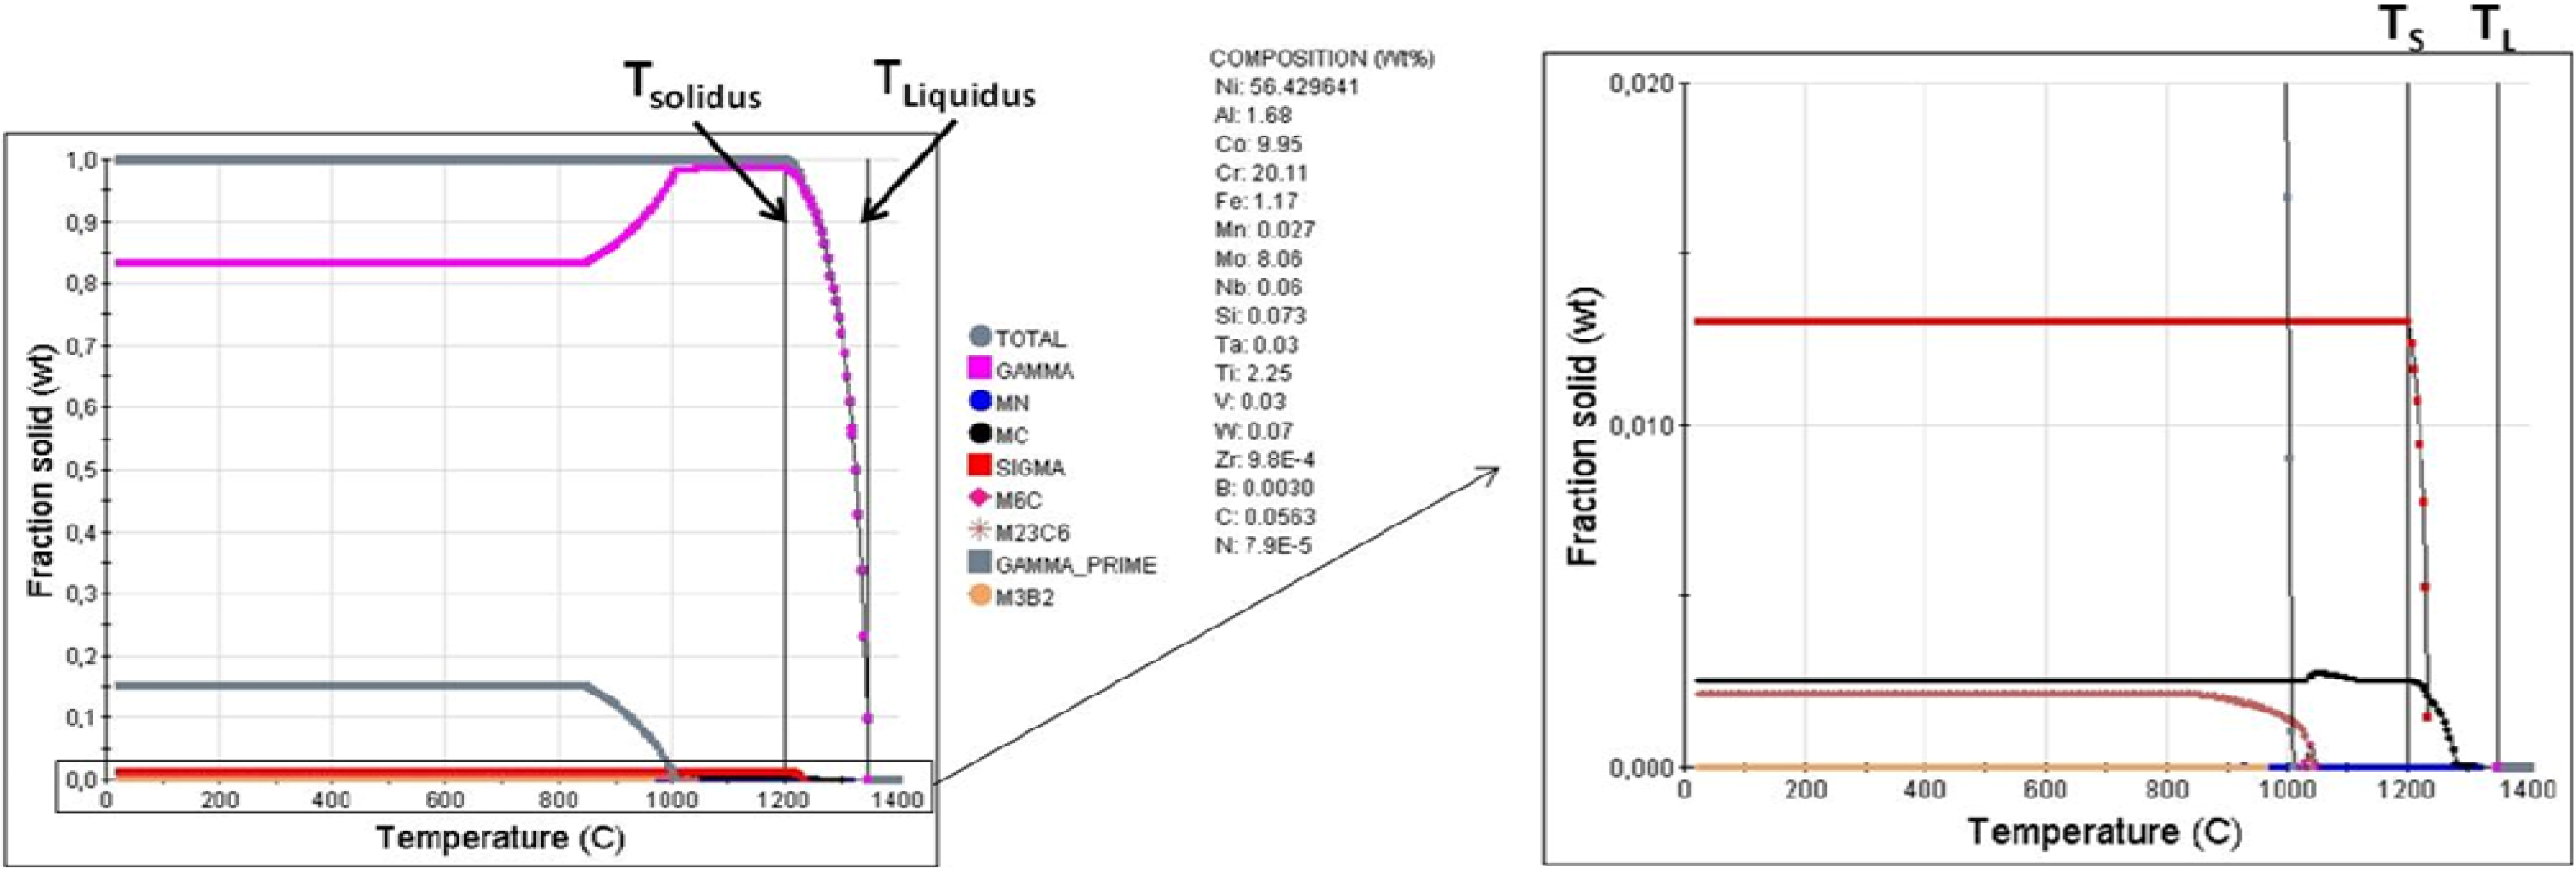
3.3.1. Solidification Characteristics

| Start nucleation temperature [°C] | TLiquidus | γ | MN | MC | σ | TSolidus | M6C | M23C6 | γ' | M3B2 |
| 1345 | 1345 | 1315 | 1310 | 1235 | 1200 | 1046 | 1040 | 1010 | 960 |
4. Conclusions
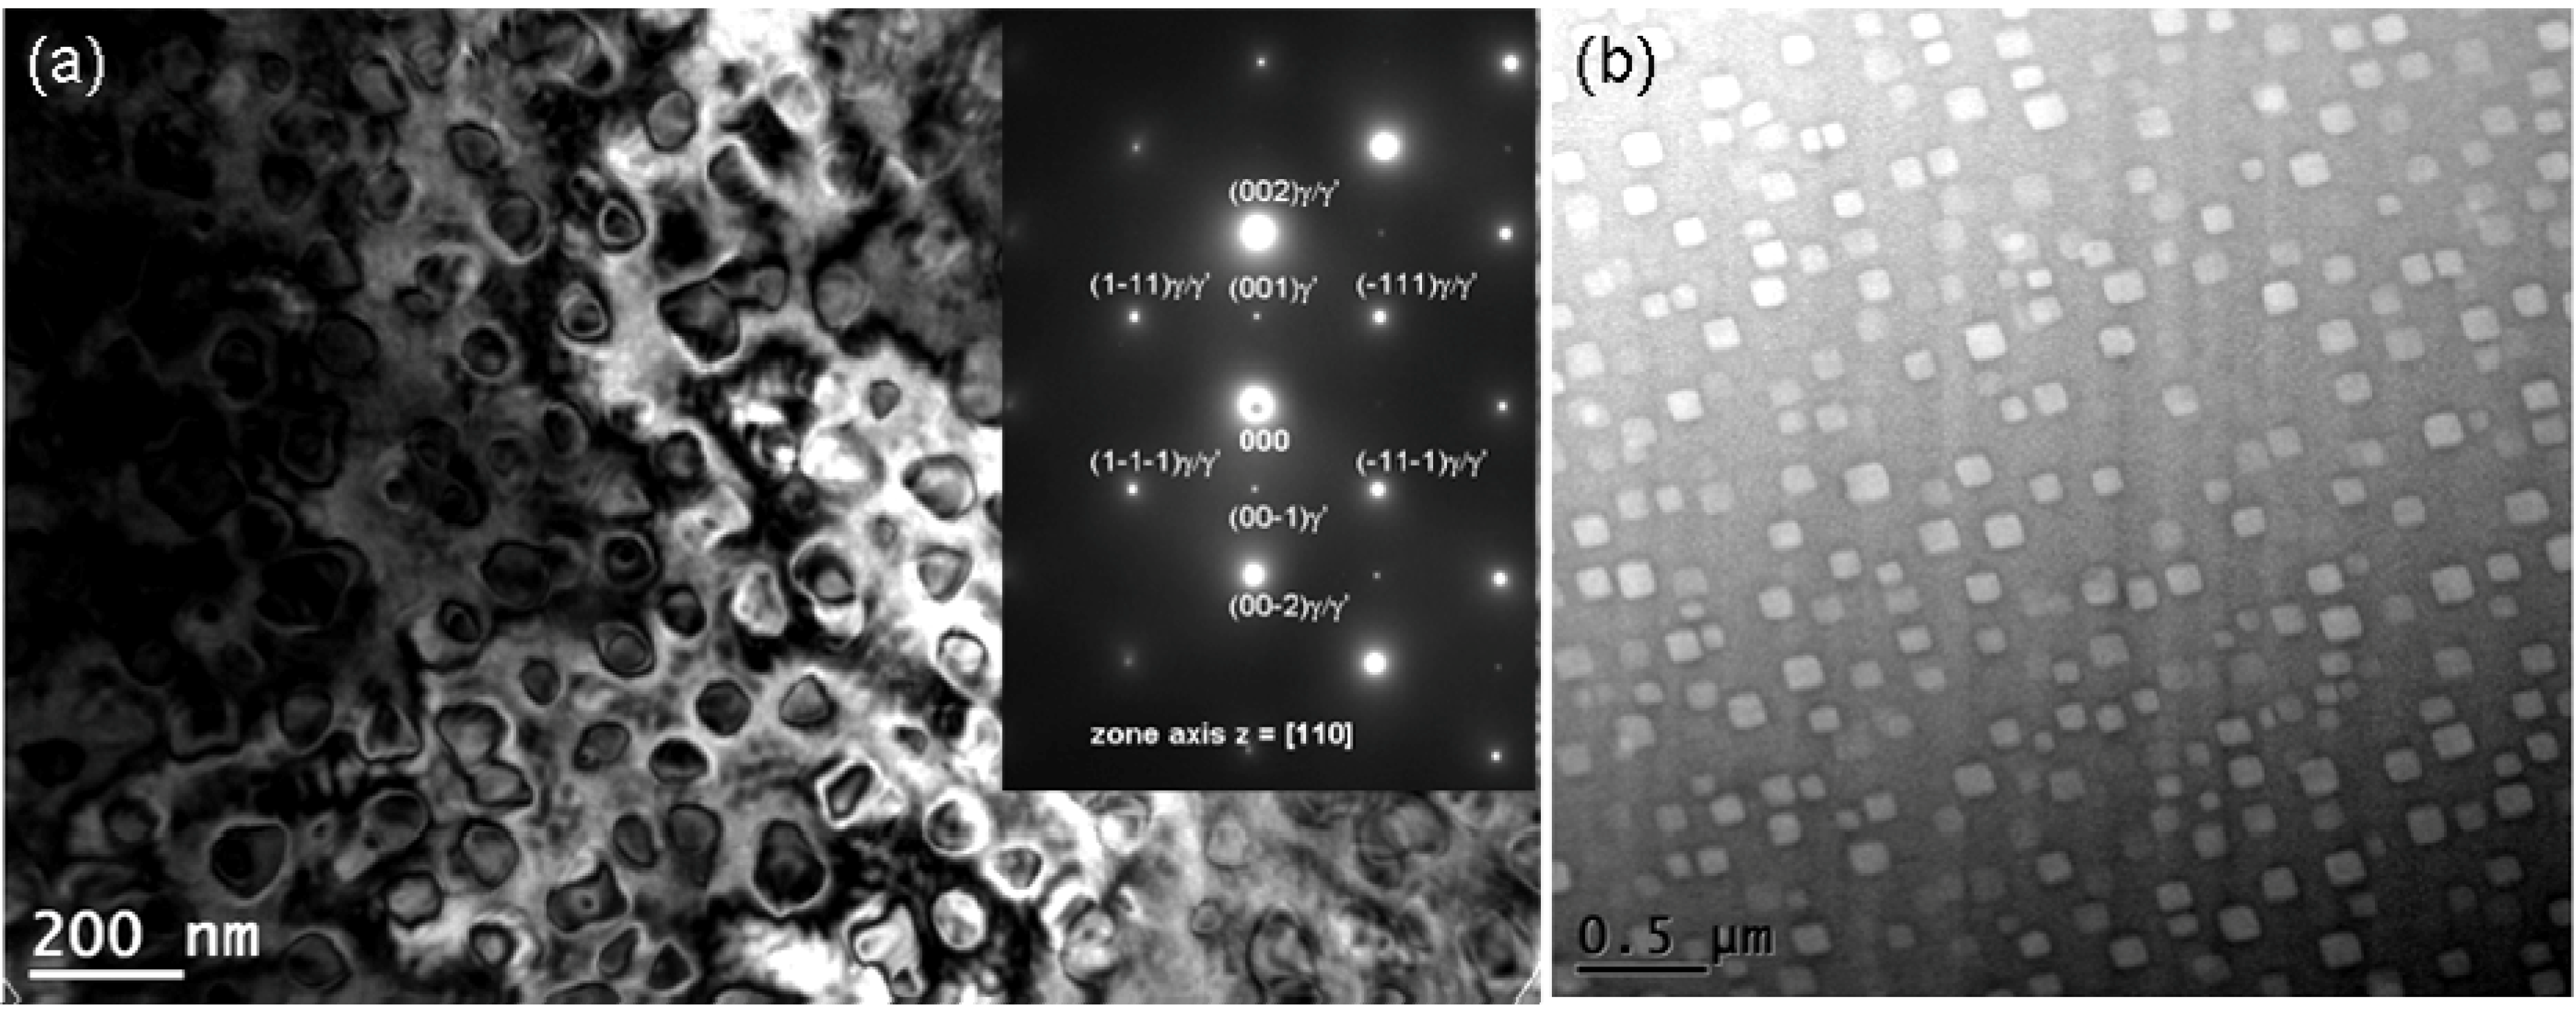
- The FCC A1 matrix (γ- Ni-Cr-Co-Mo based solid solution) is precipitation strengthened by coherent, ordered Ni3(Al,Ti) γʹ phase (FCC ordered L12 crystal structure). Variation in the nature (size, shape and volume content) of γʹ precipitates is observed due to the effects of microsegregation and local cooling rates during cast solidification.
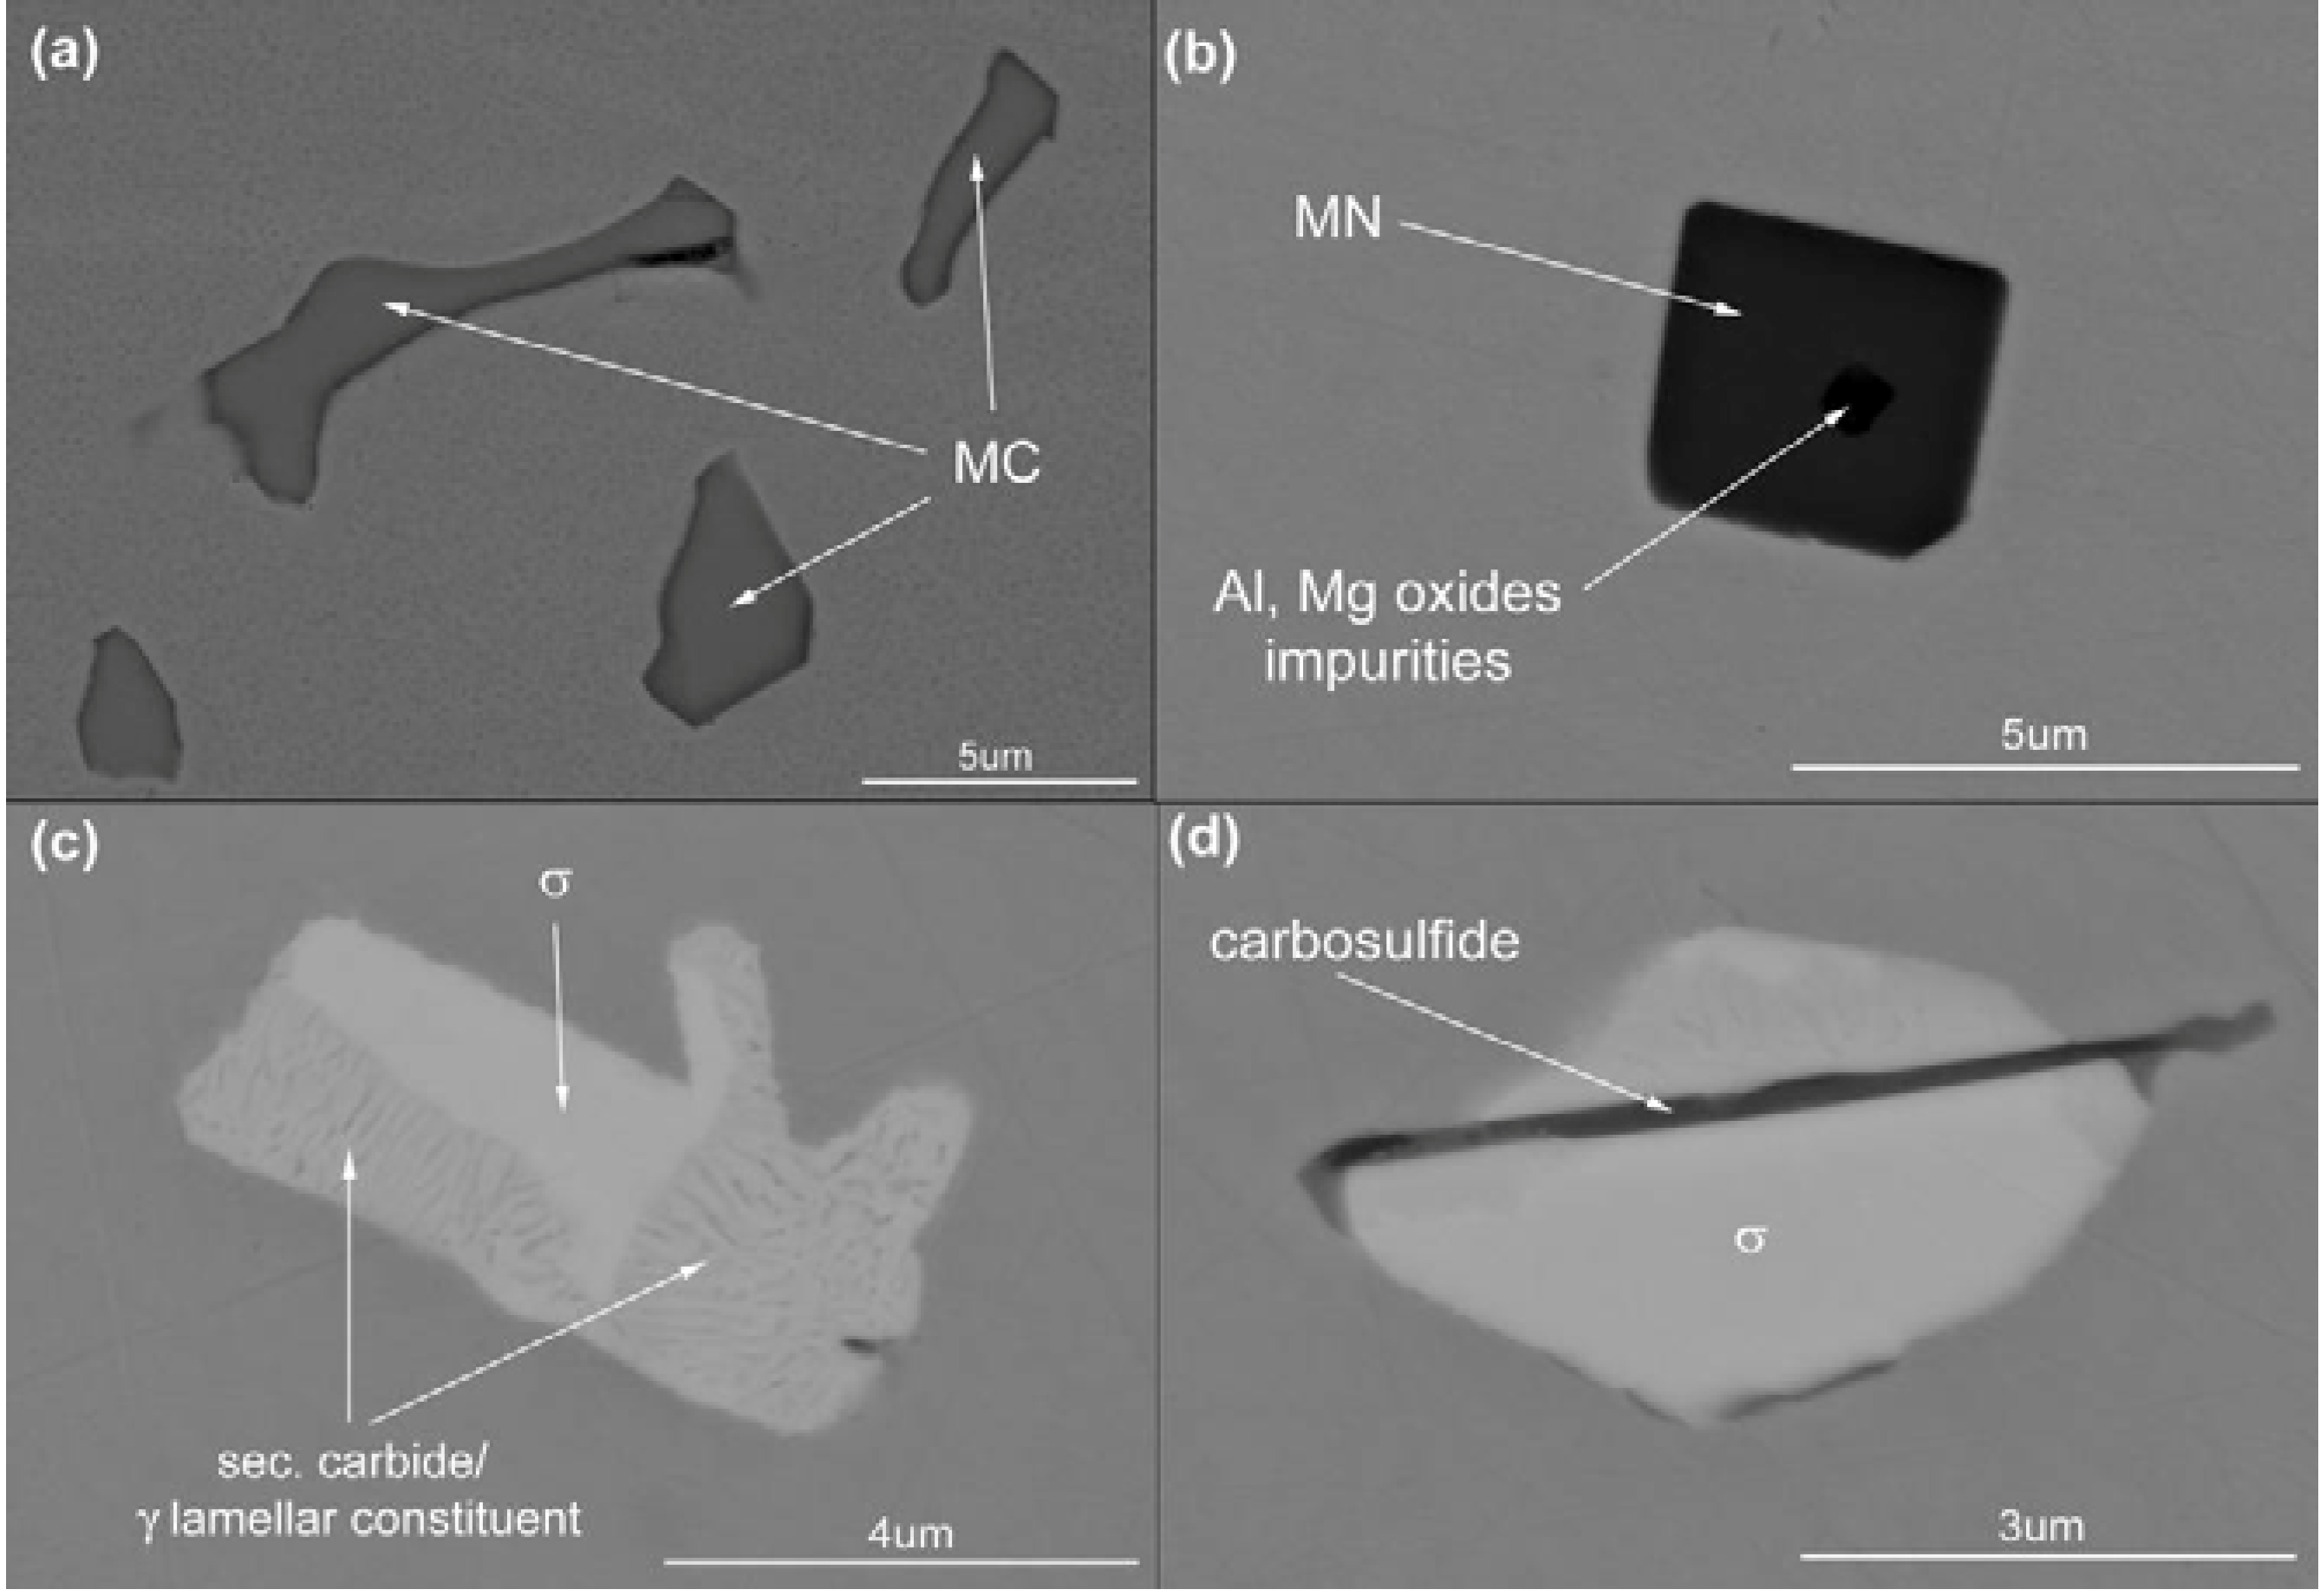
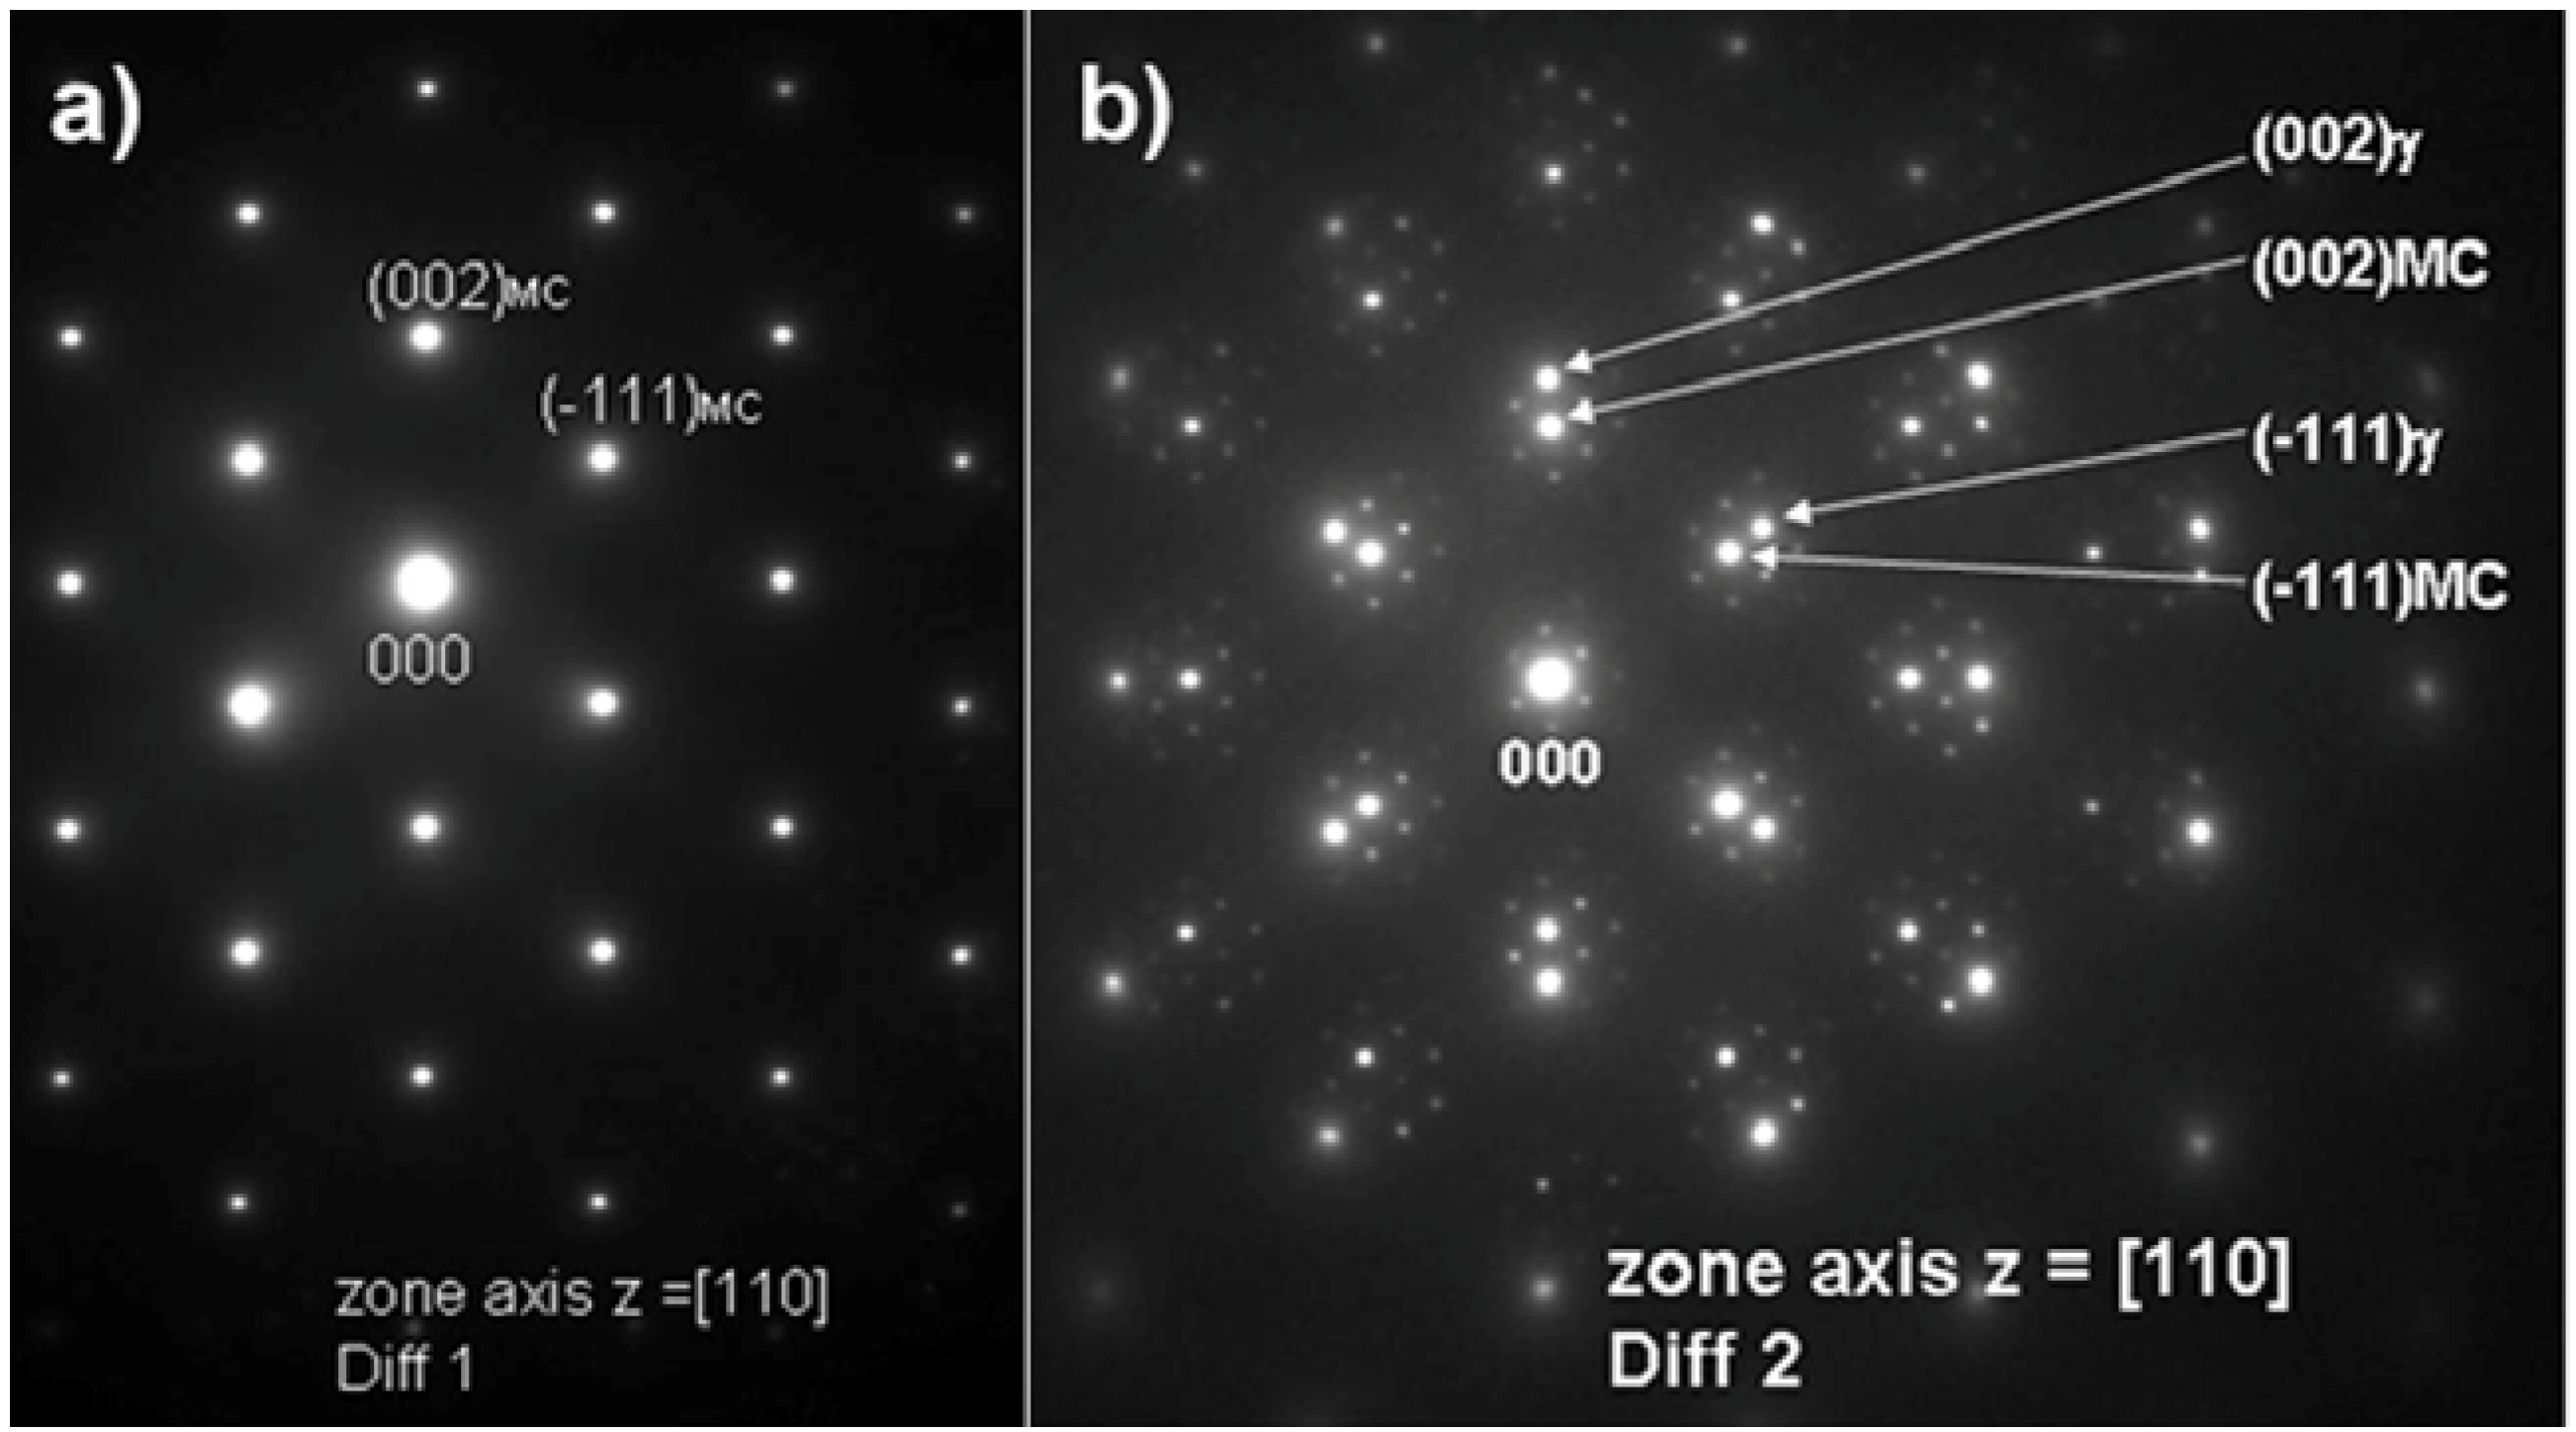
- Primary carbides MC (where M = Ti, Mo and Cr), of irregular shape and TiC-like FCC B1 crystal structure, are preferentially precipitated in the interdendritic areas.
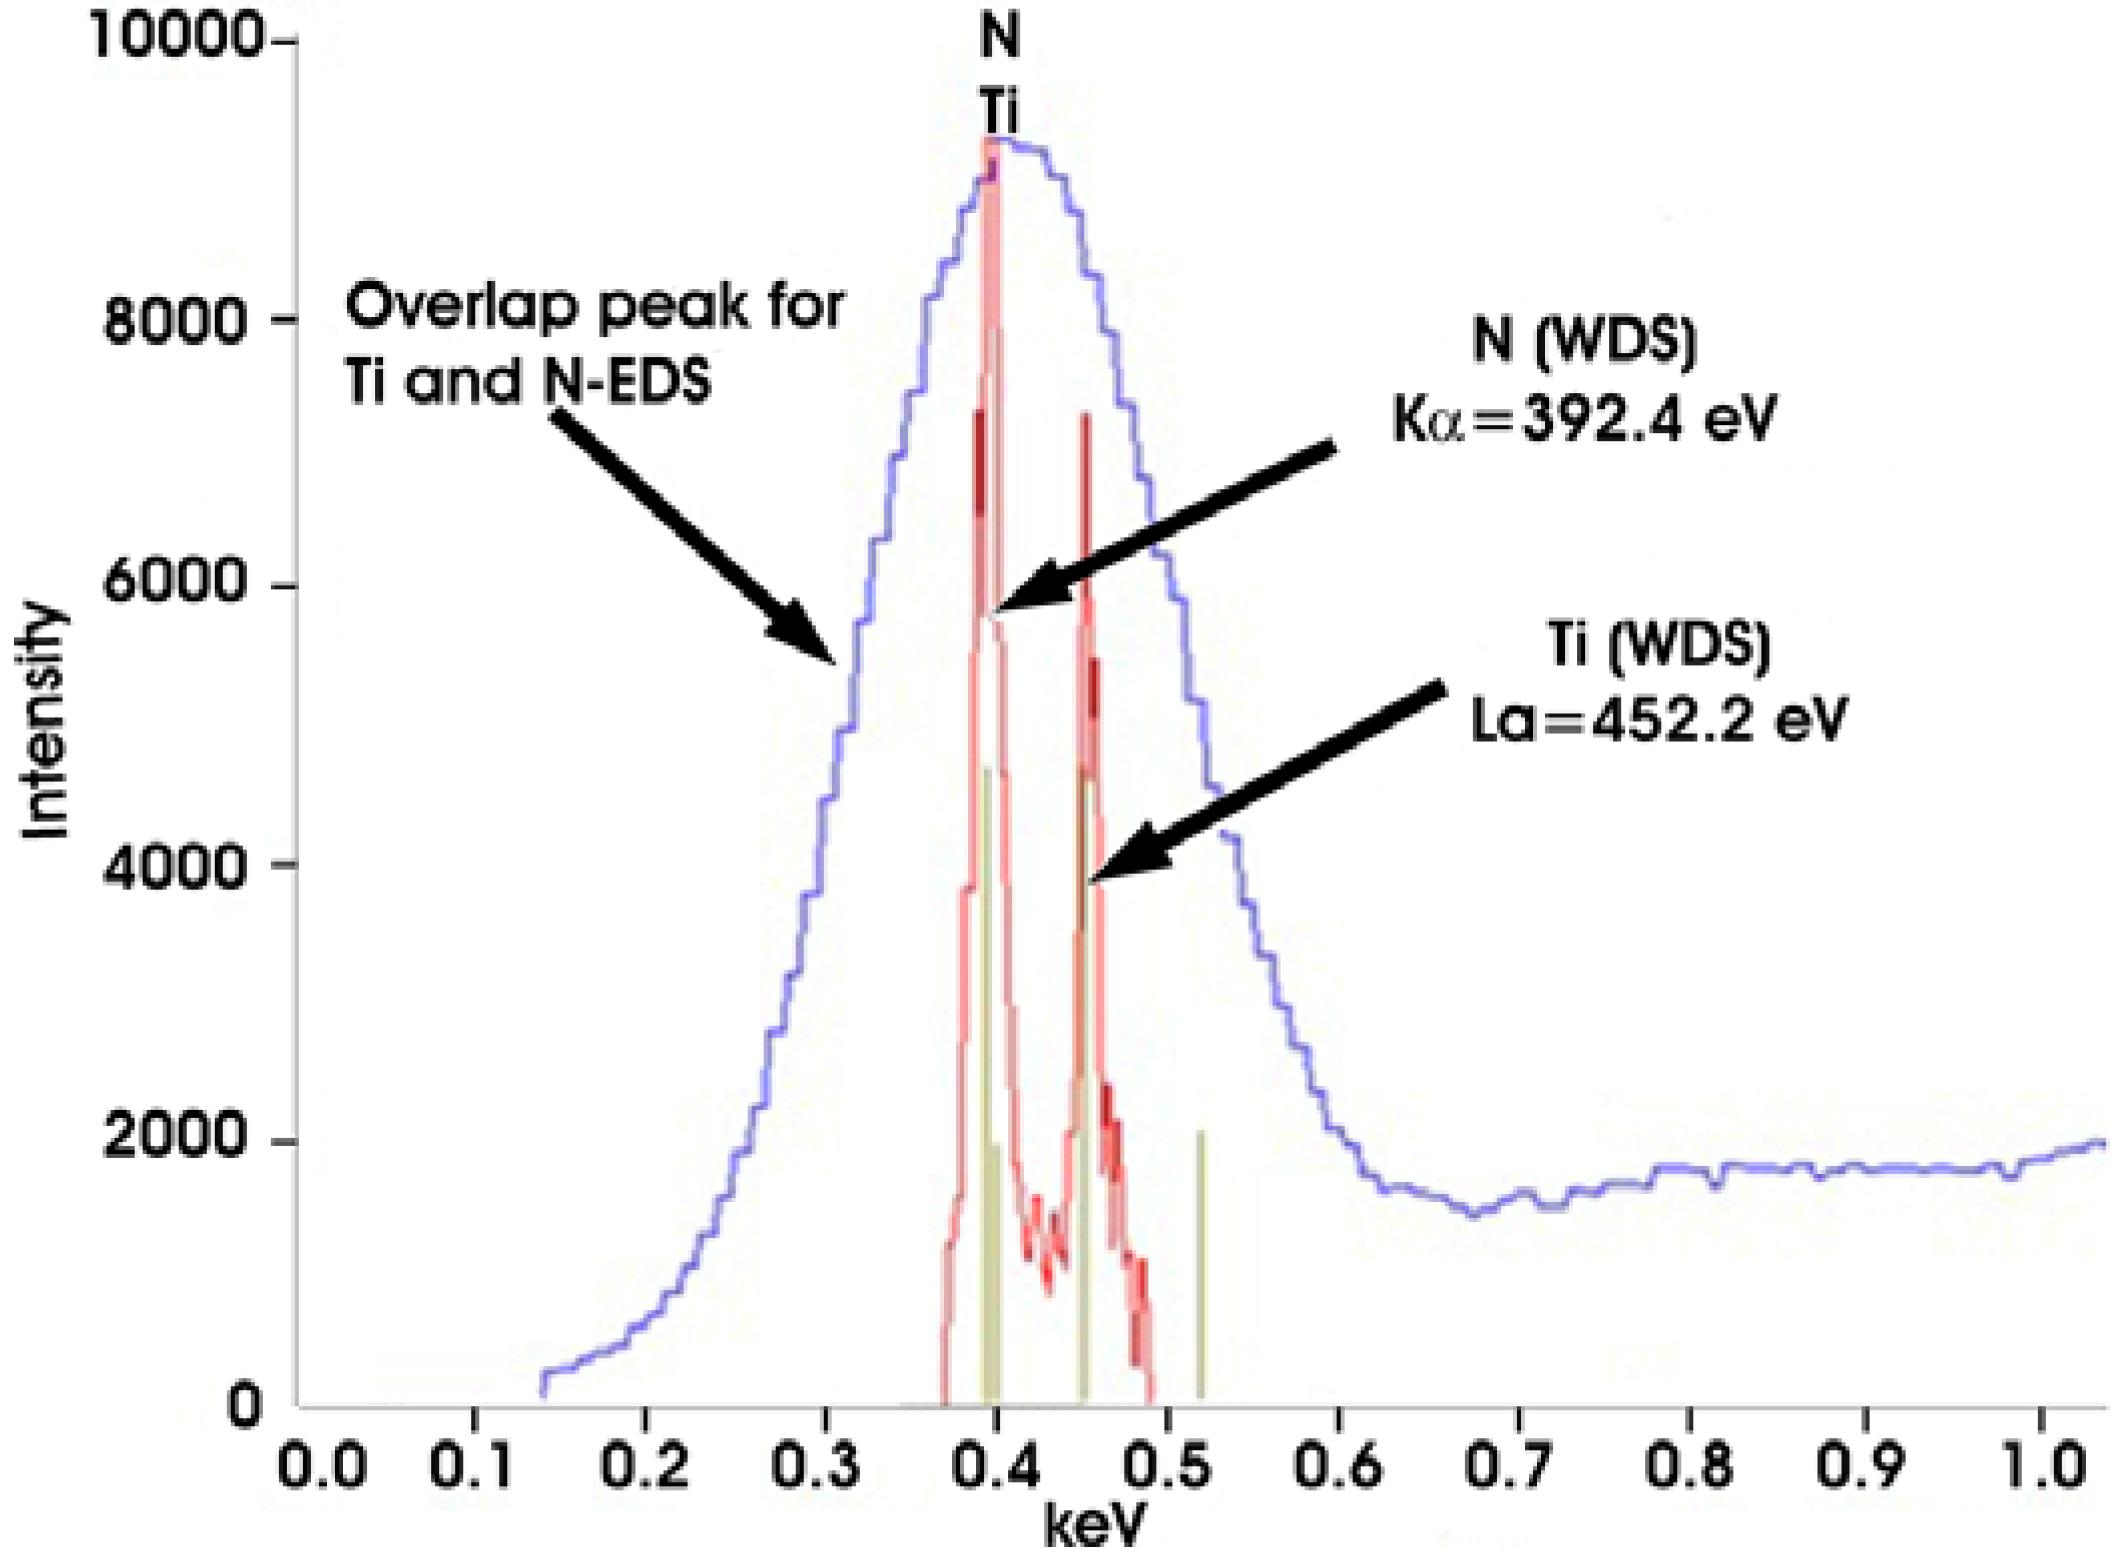
- Primary nitrides MN, identified as TiN, are homogeneously dispersed in the entire volume.
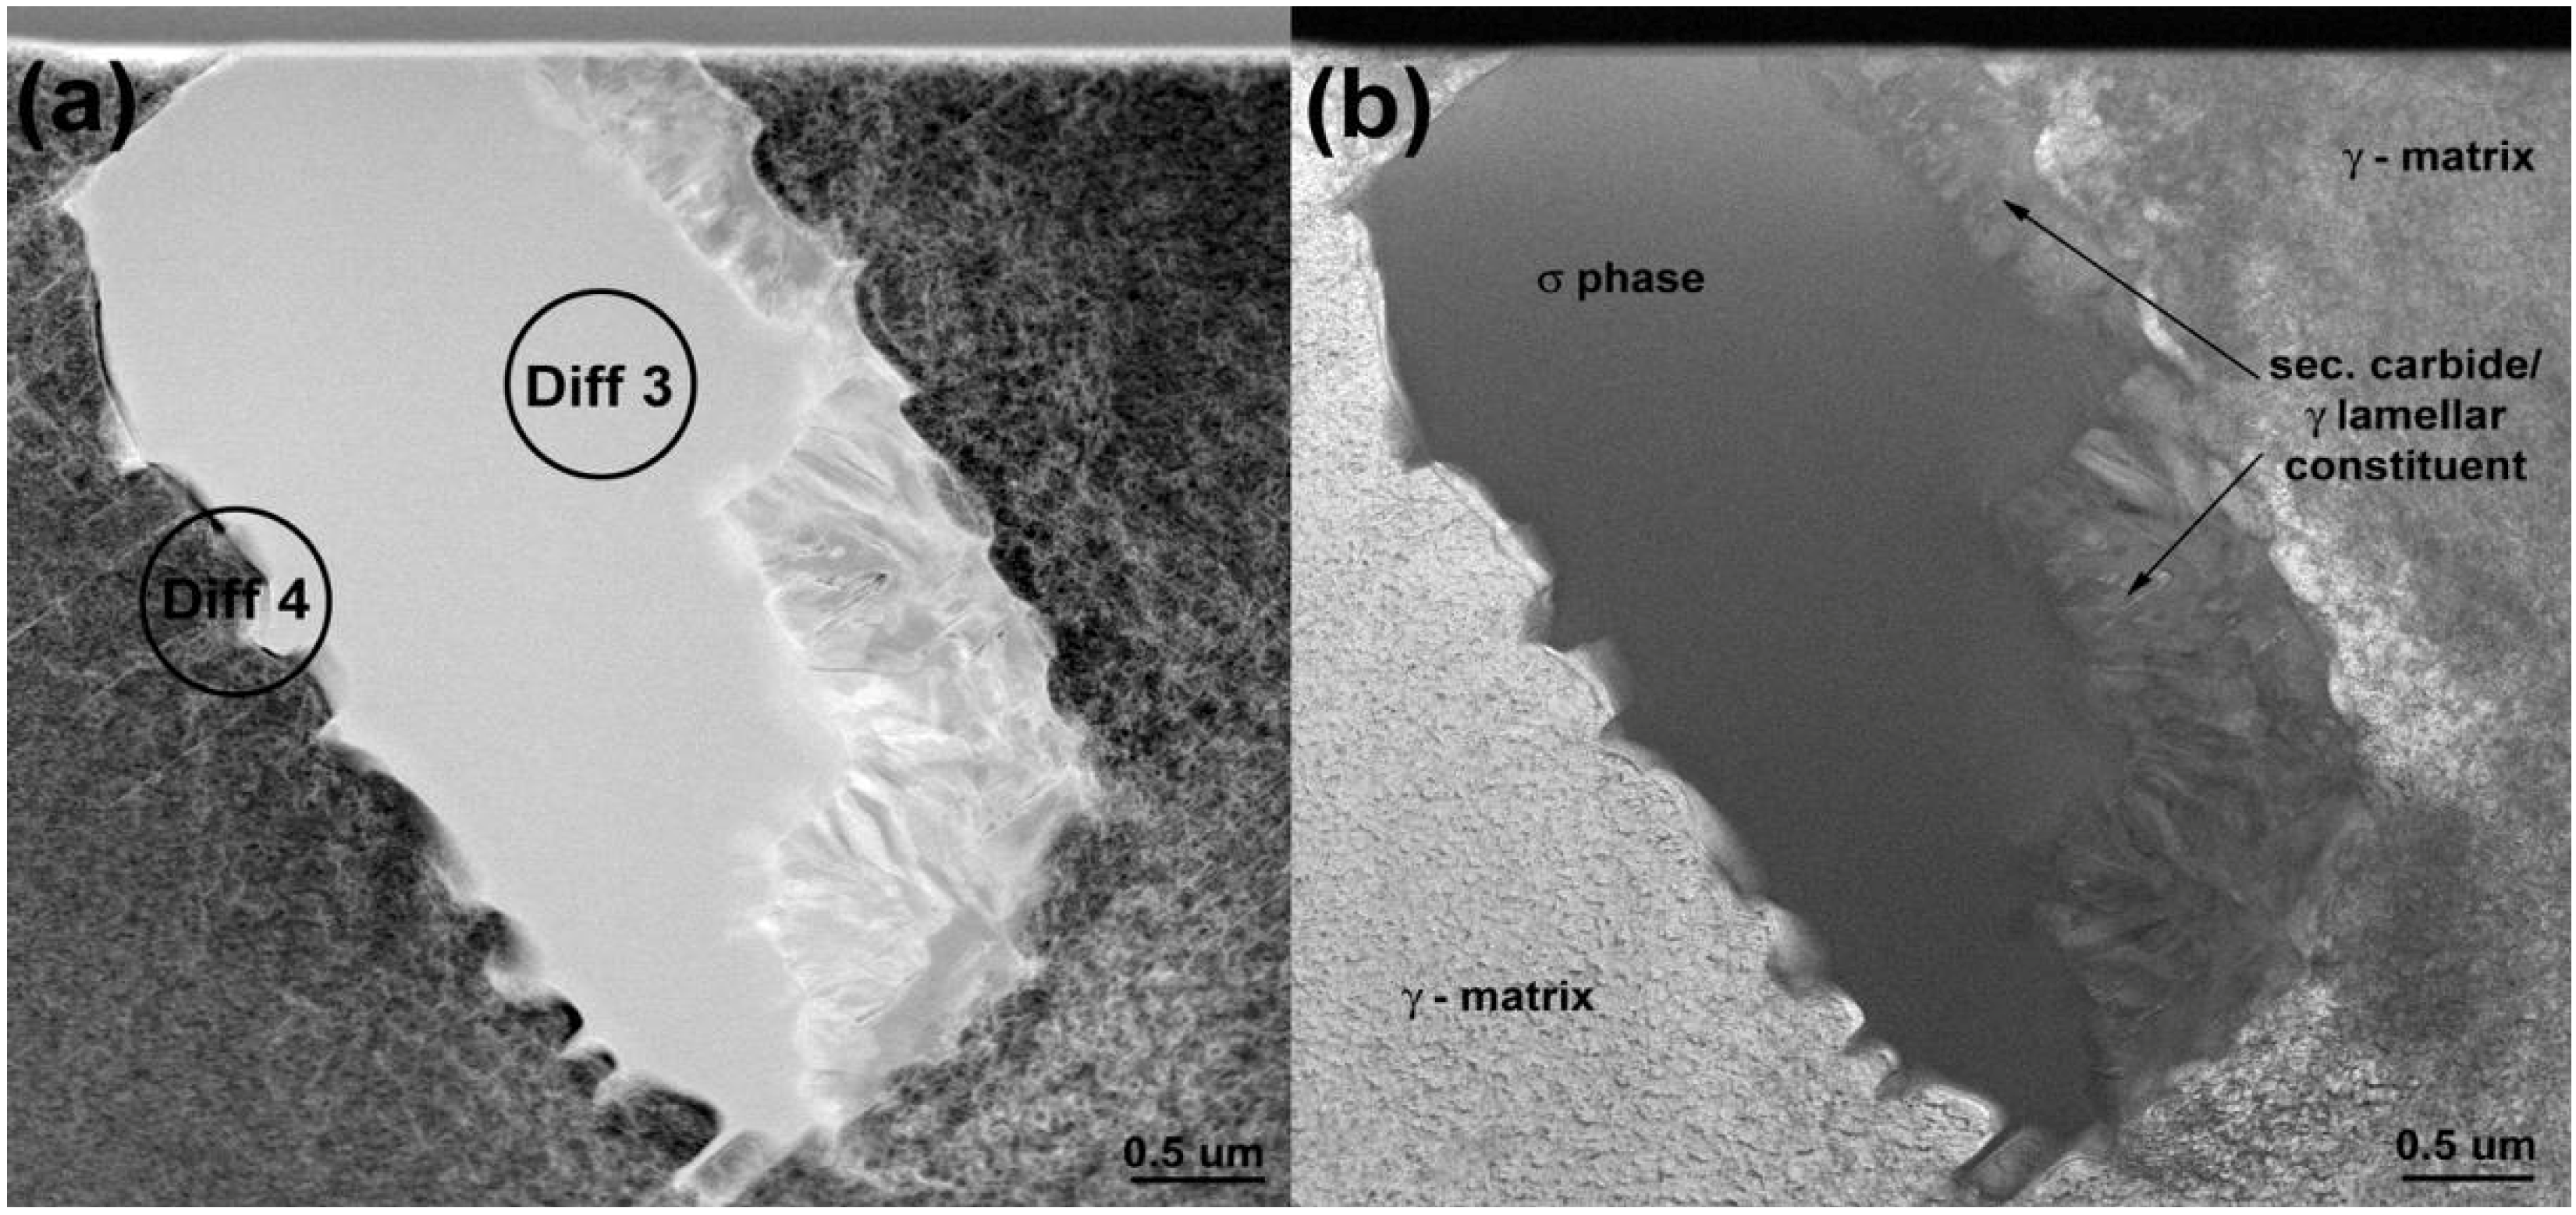
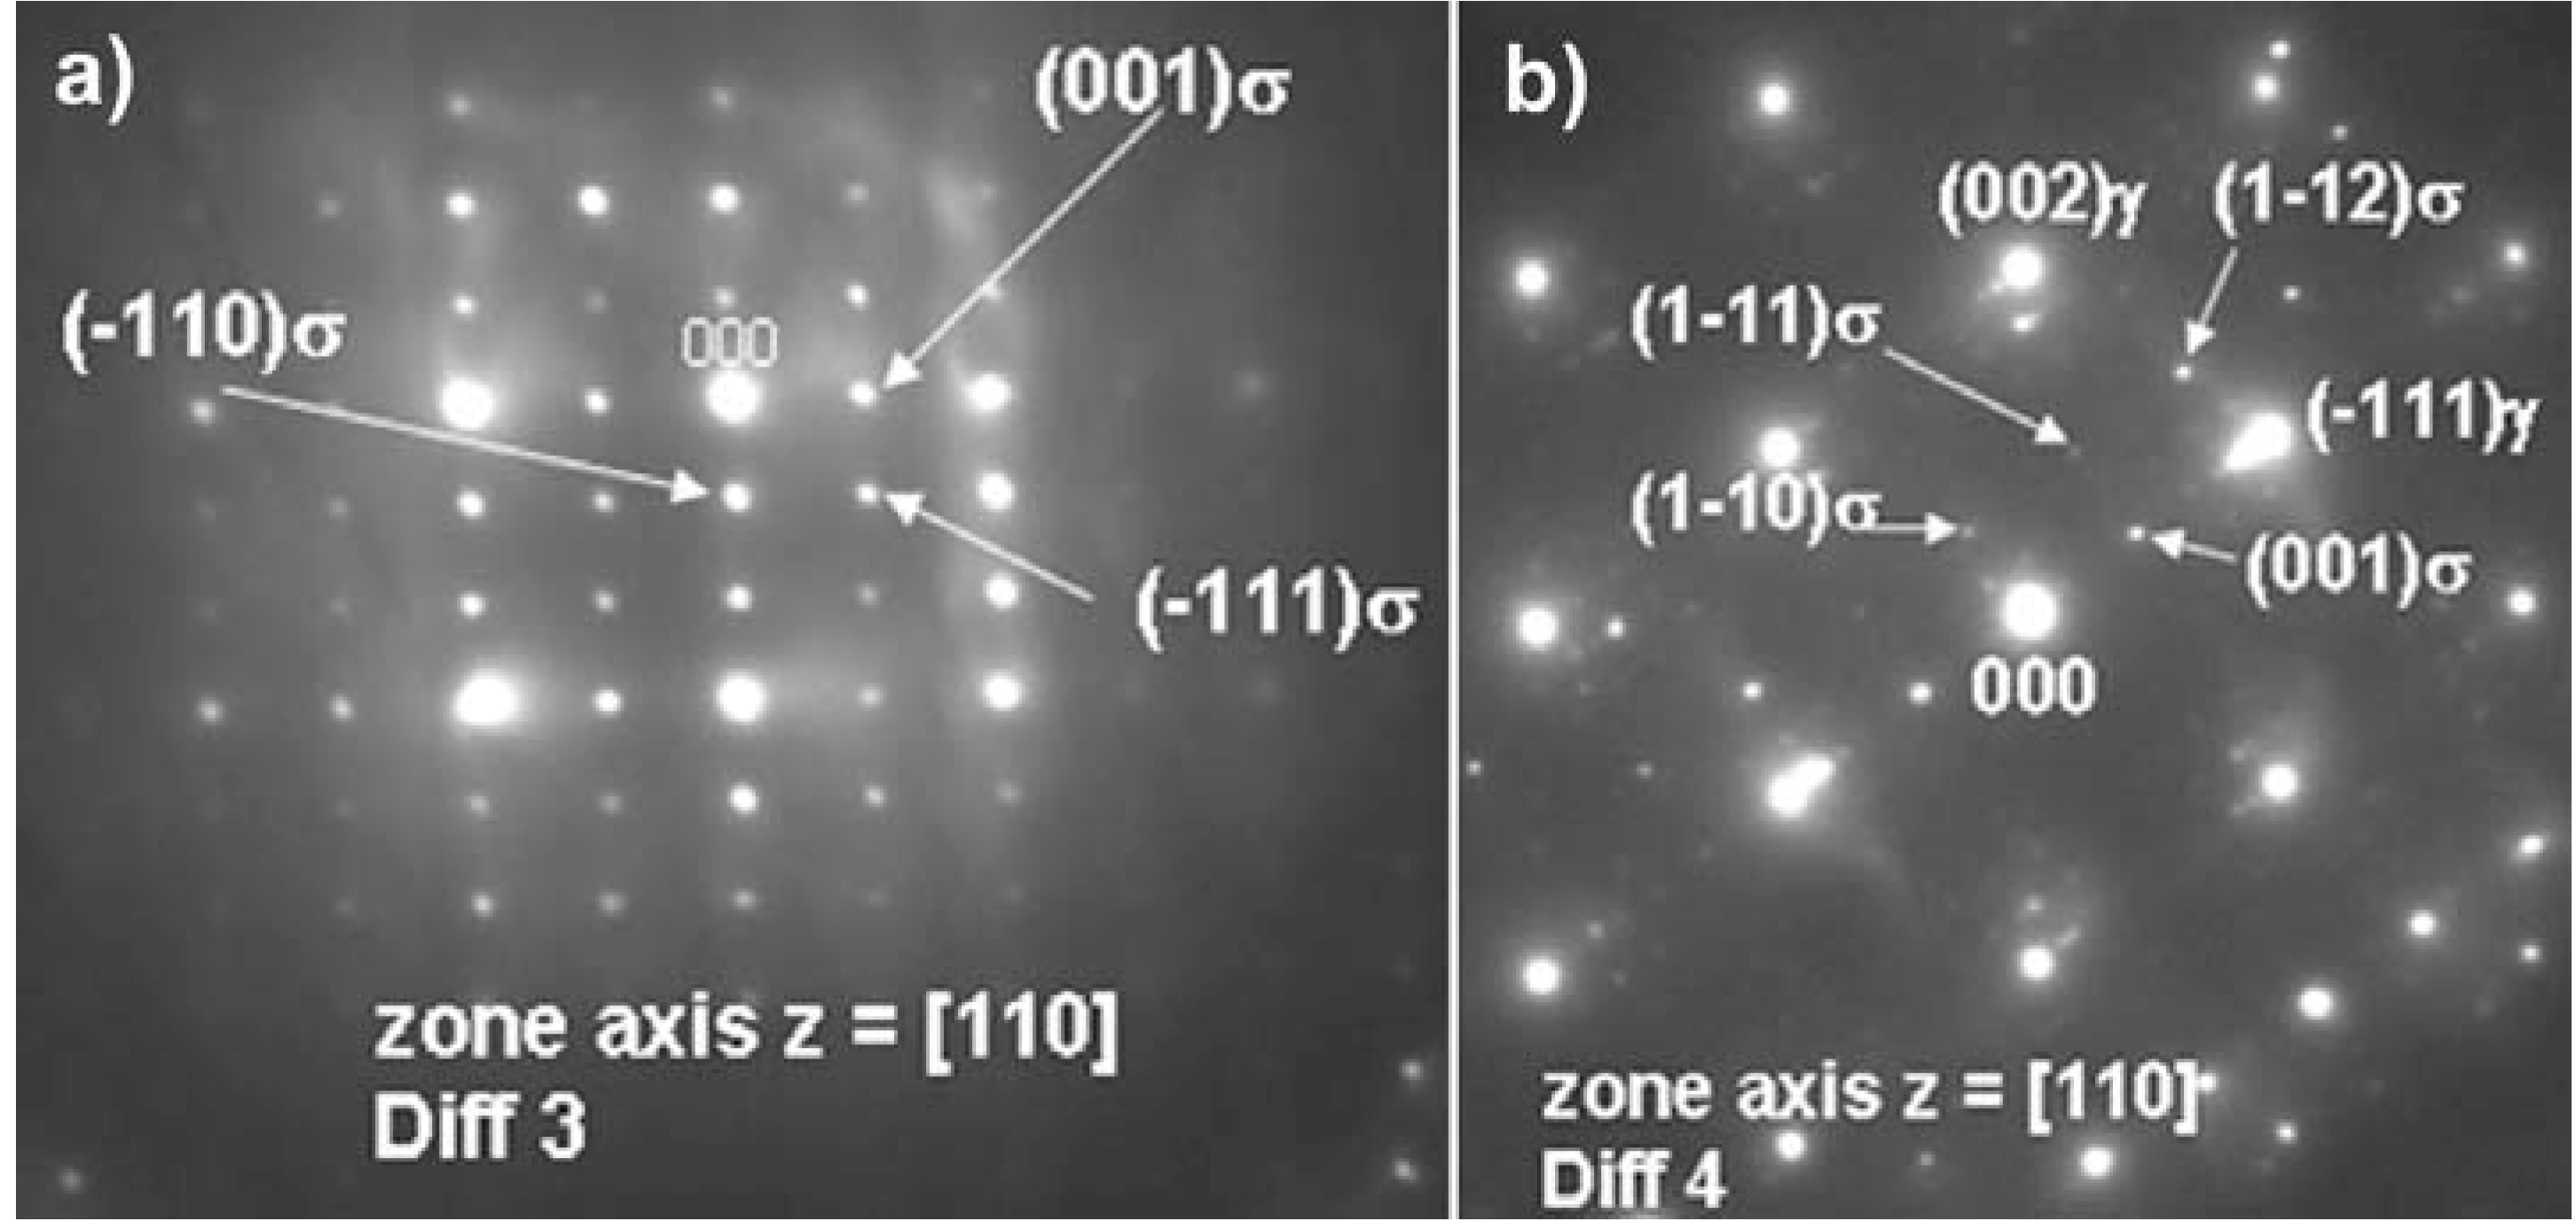
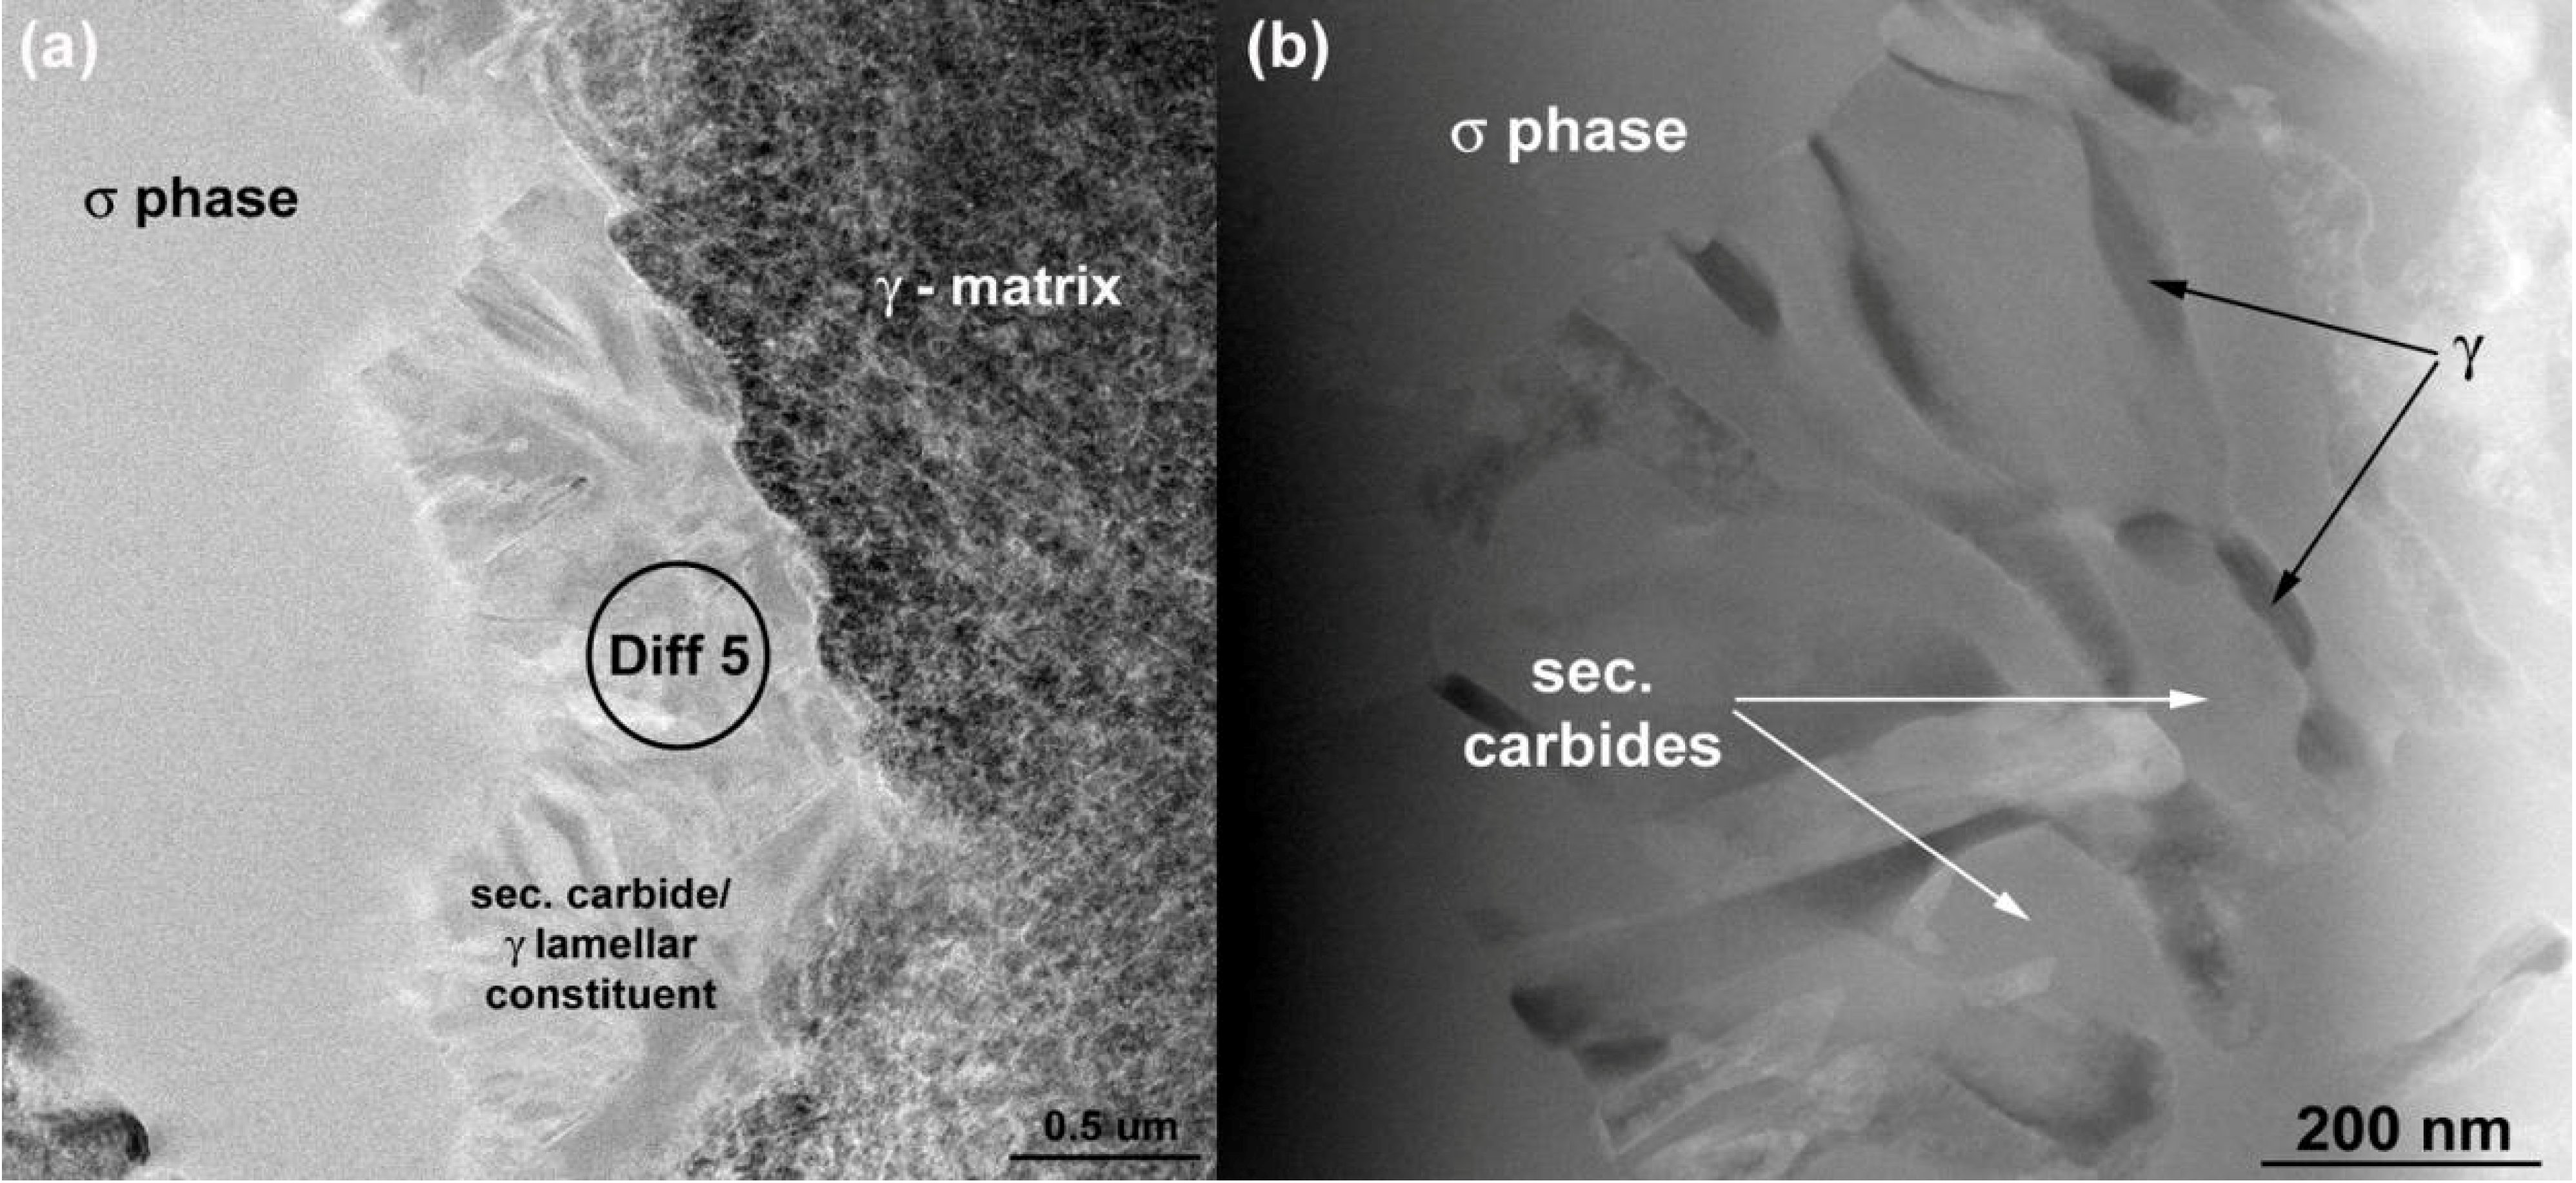
- The σ phase precipitates have tetragonal P42/mnm crystal structure and globular form. They are preferentially precipitated in the interdendritic areas. They contain 30 at % Cr, Ni and Mo and 10 at % Co (small concentrations of Ti, Si and Al were also detected).
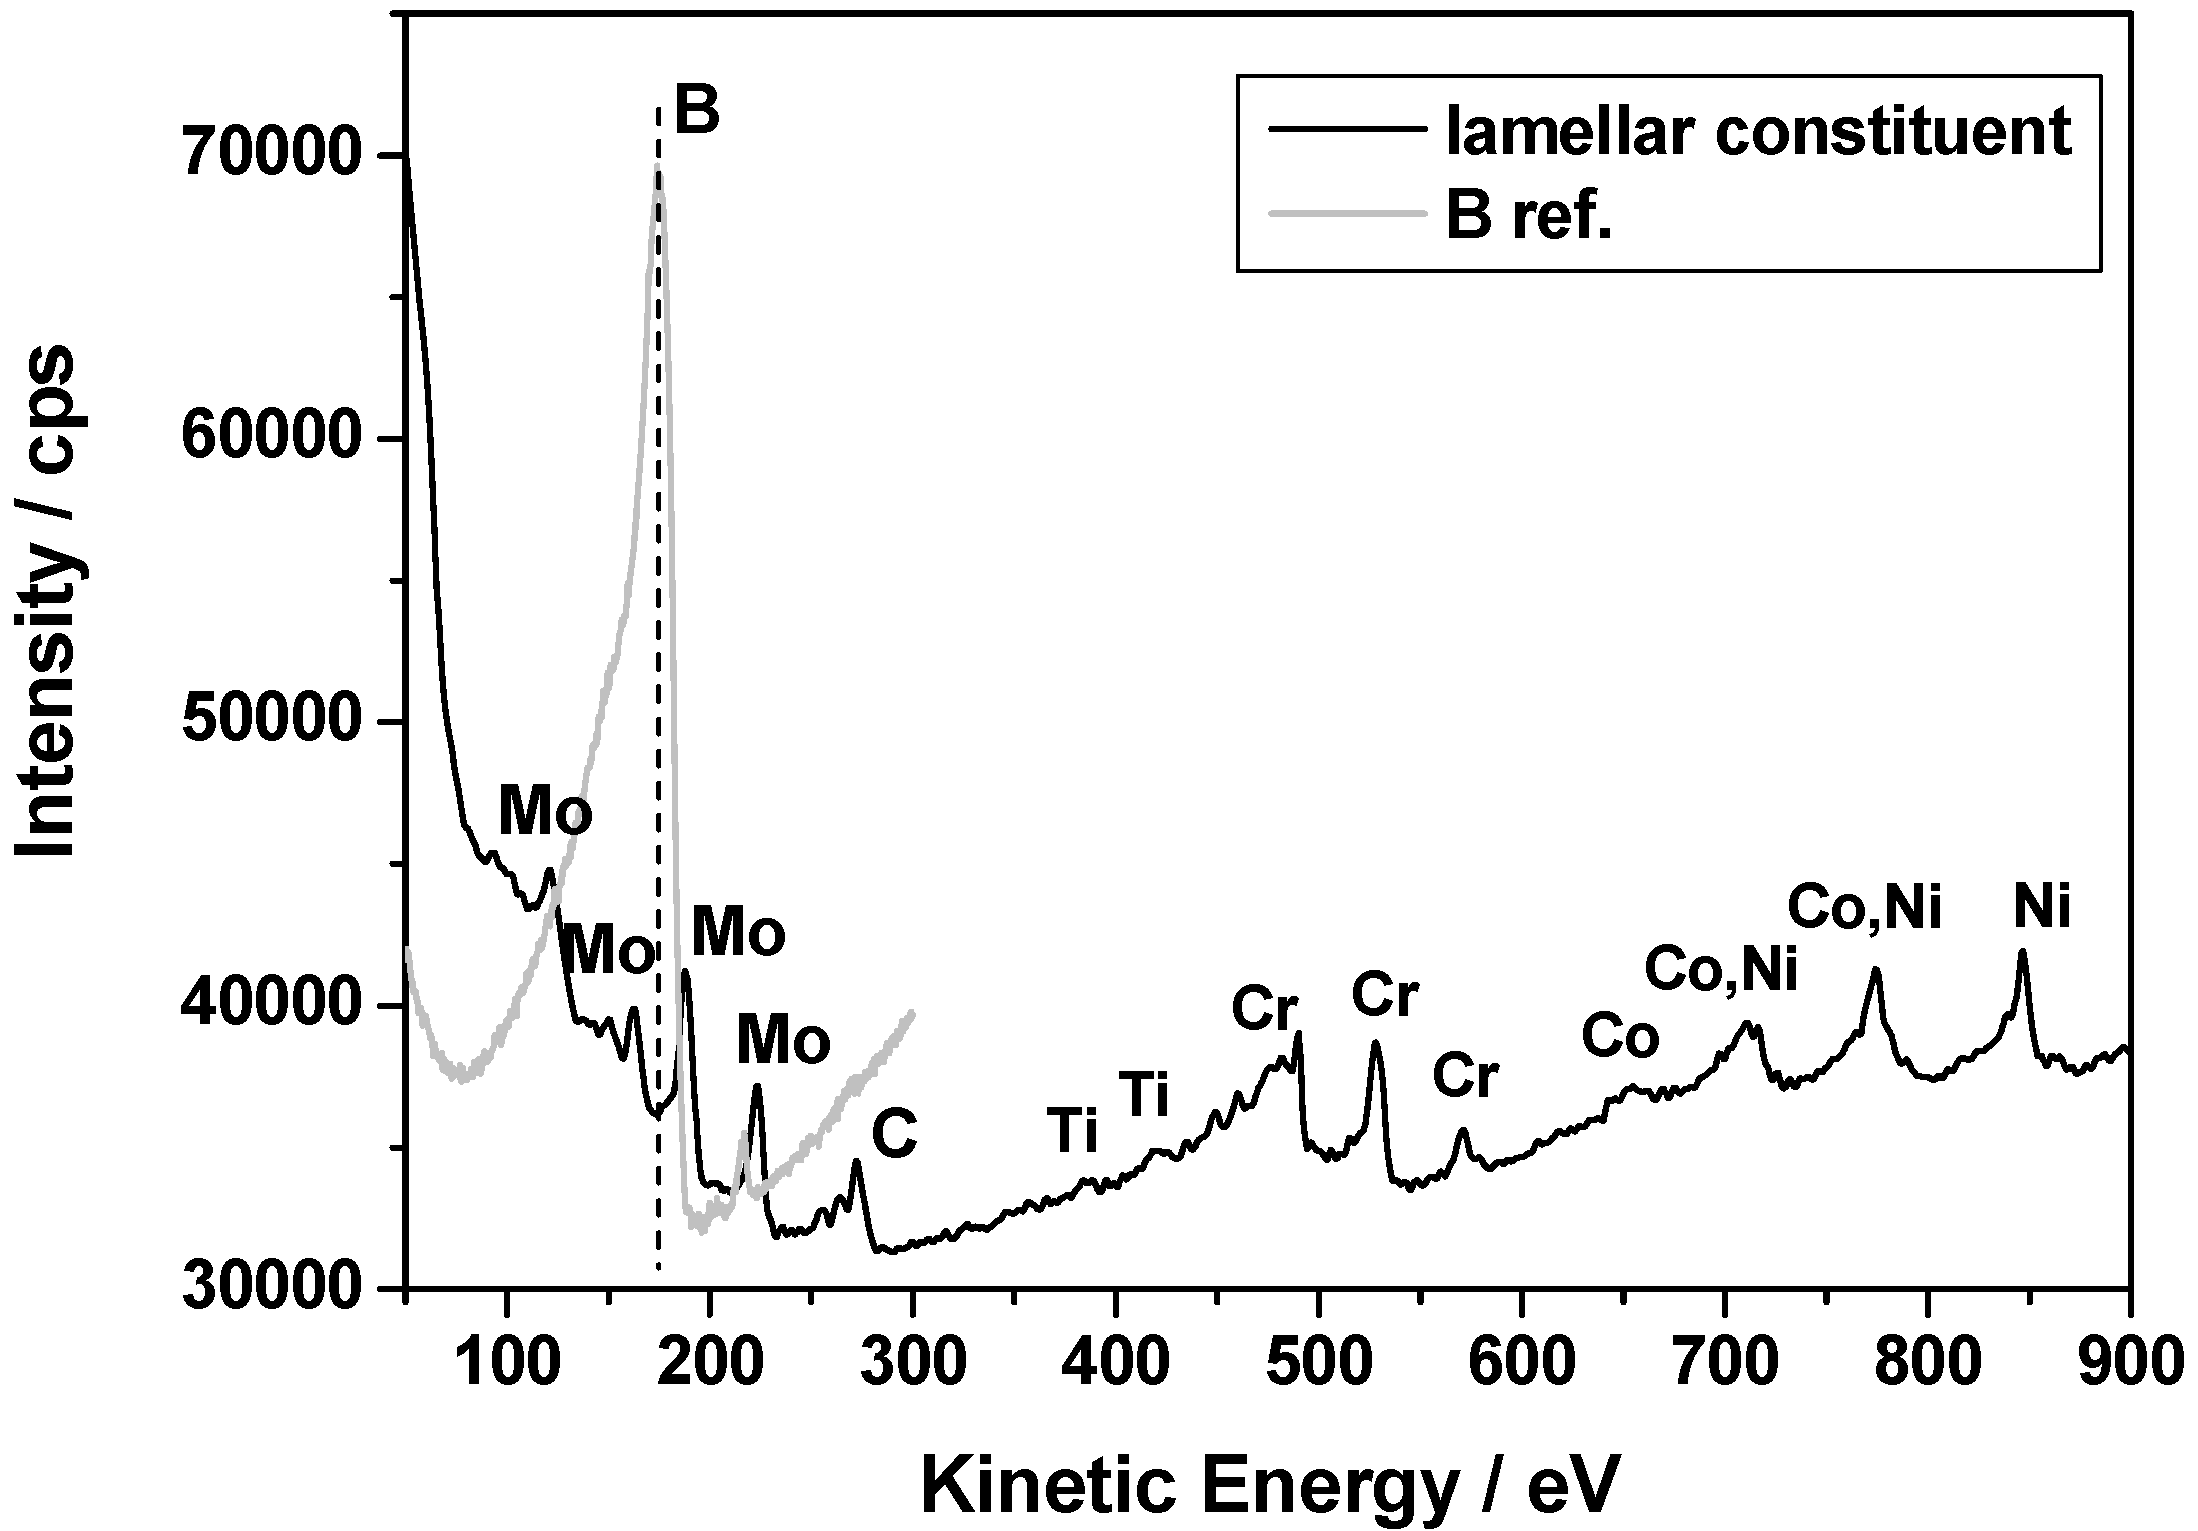
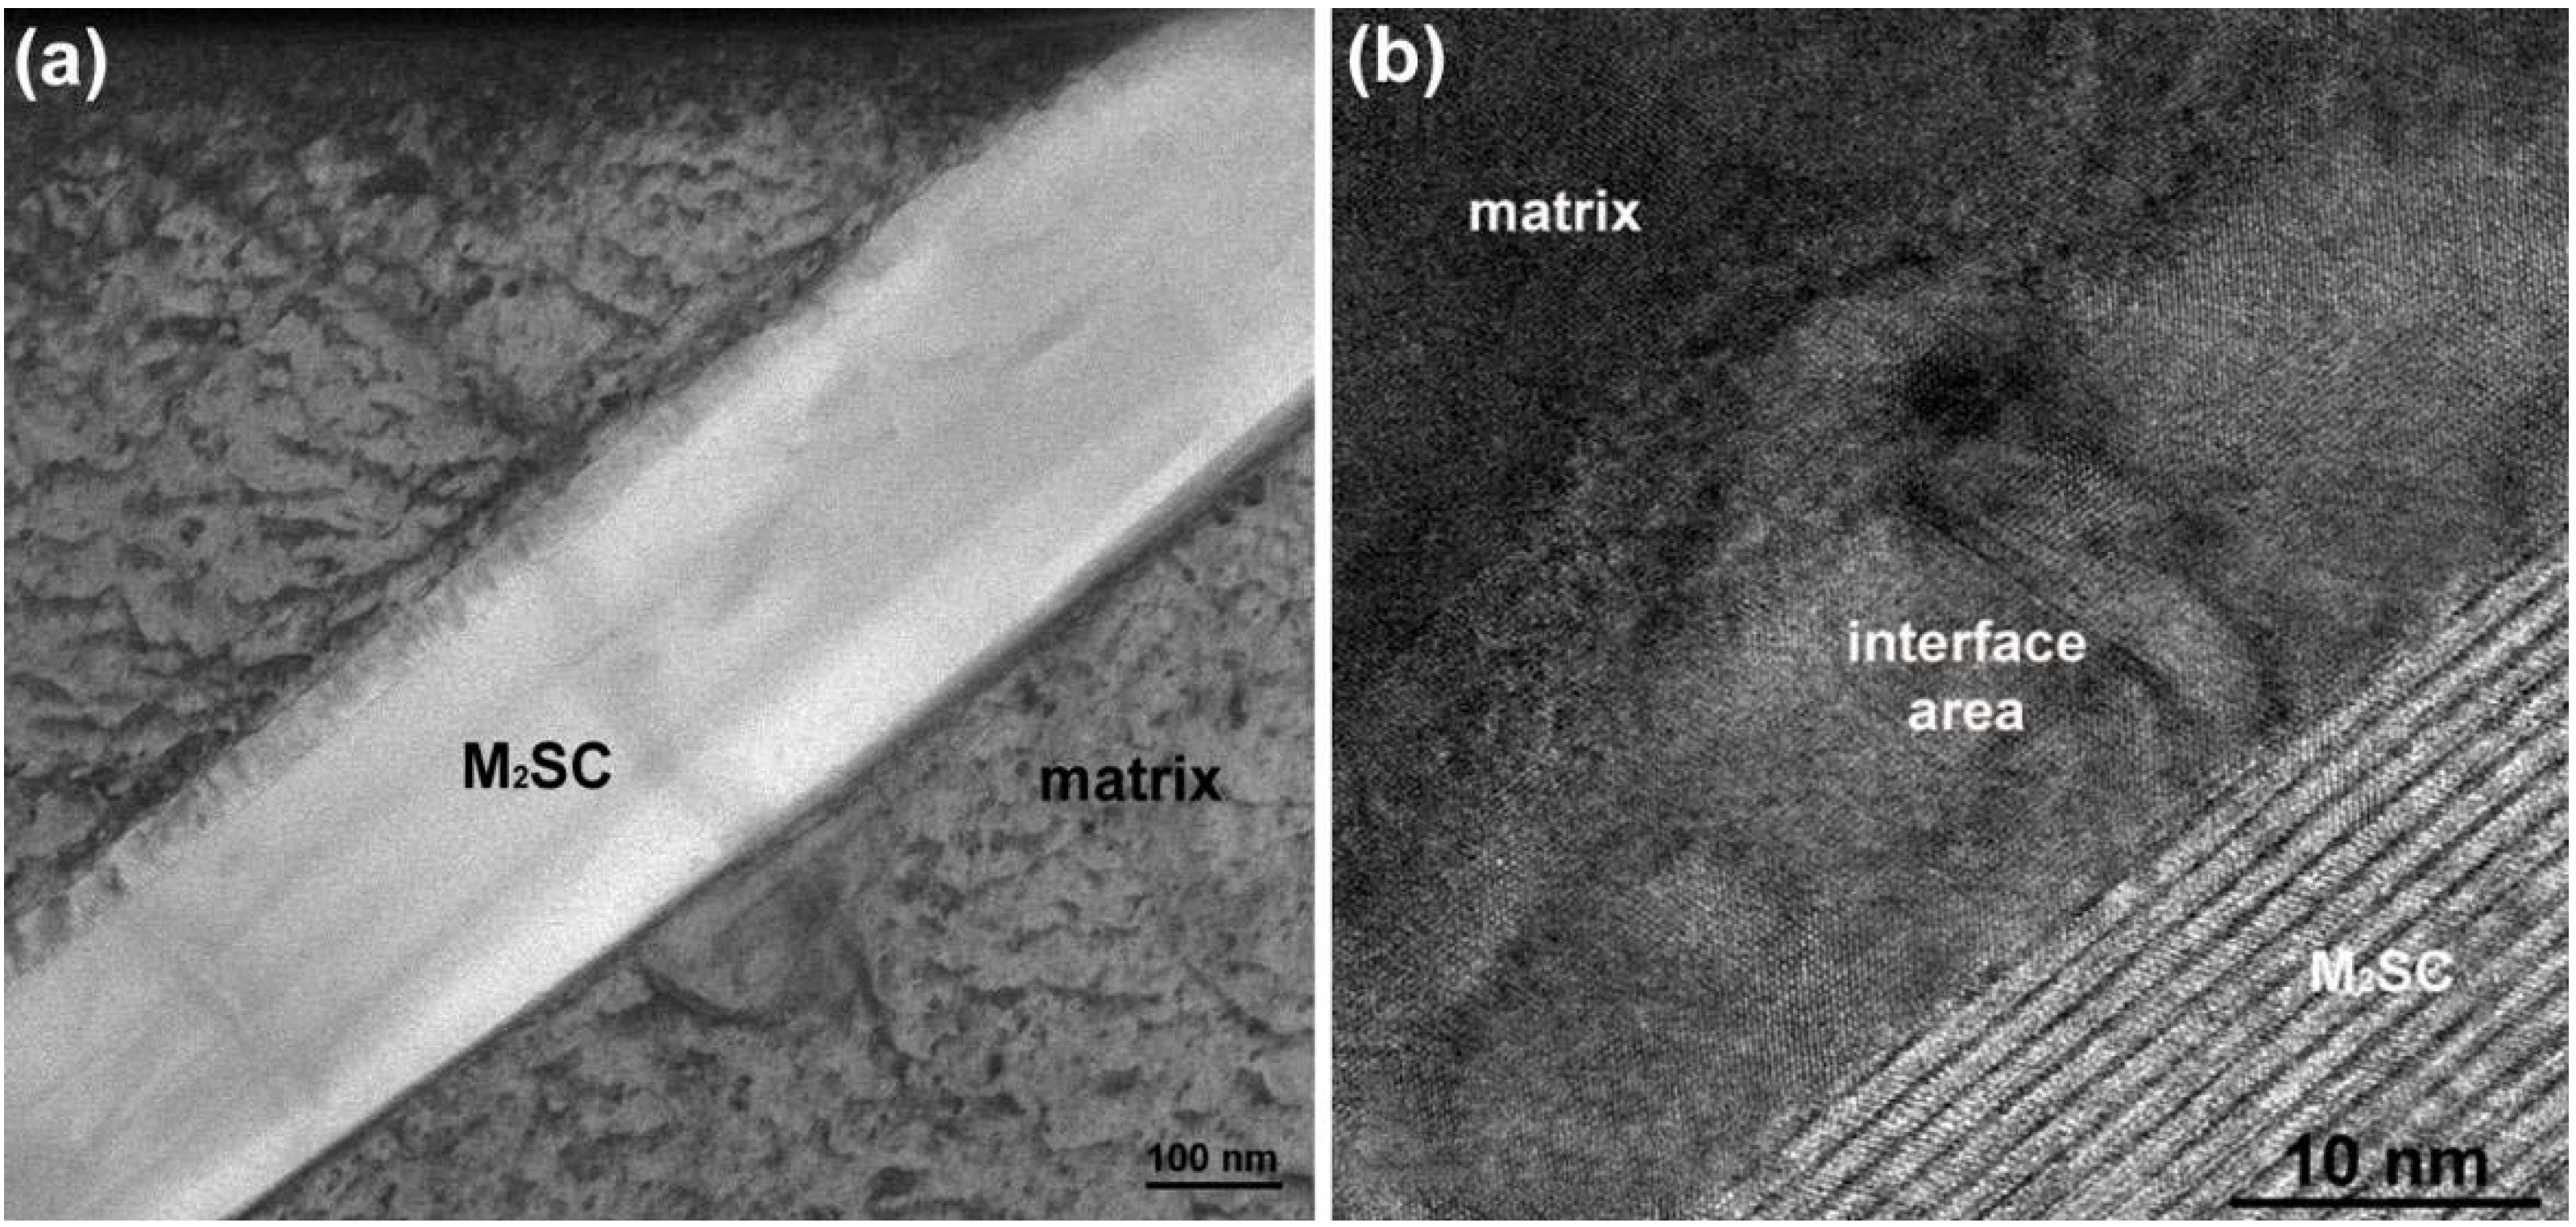
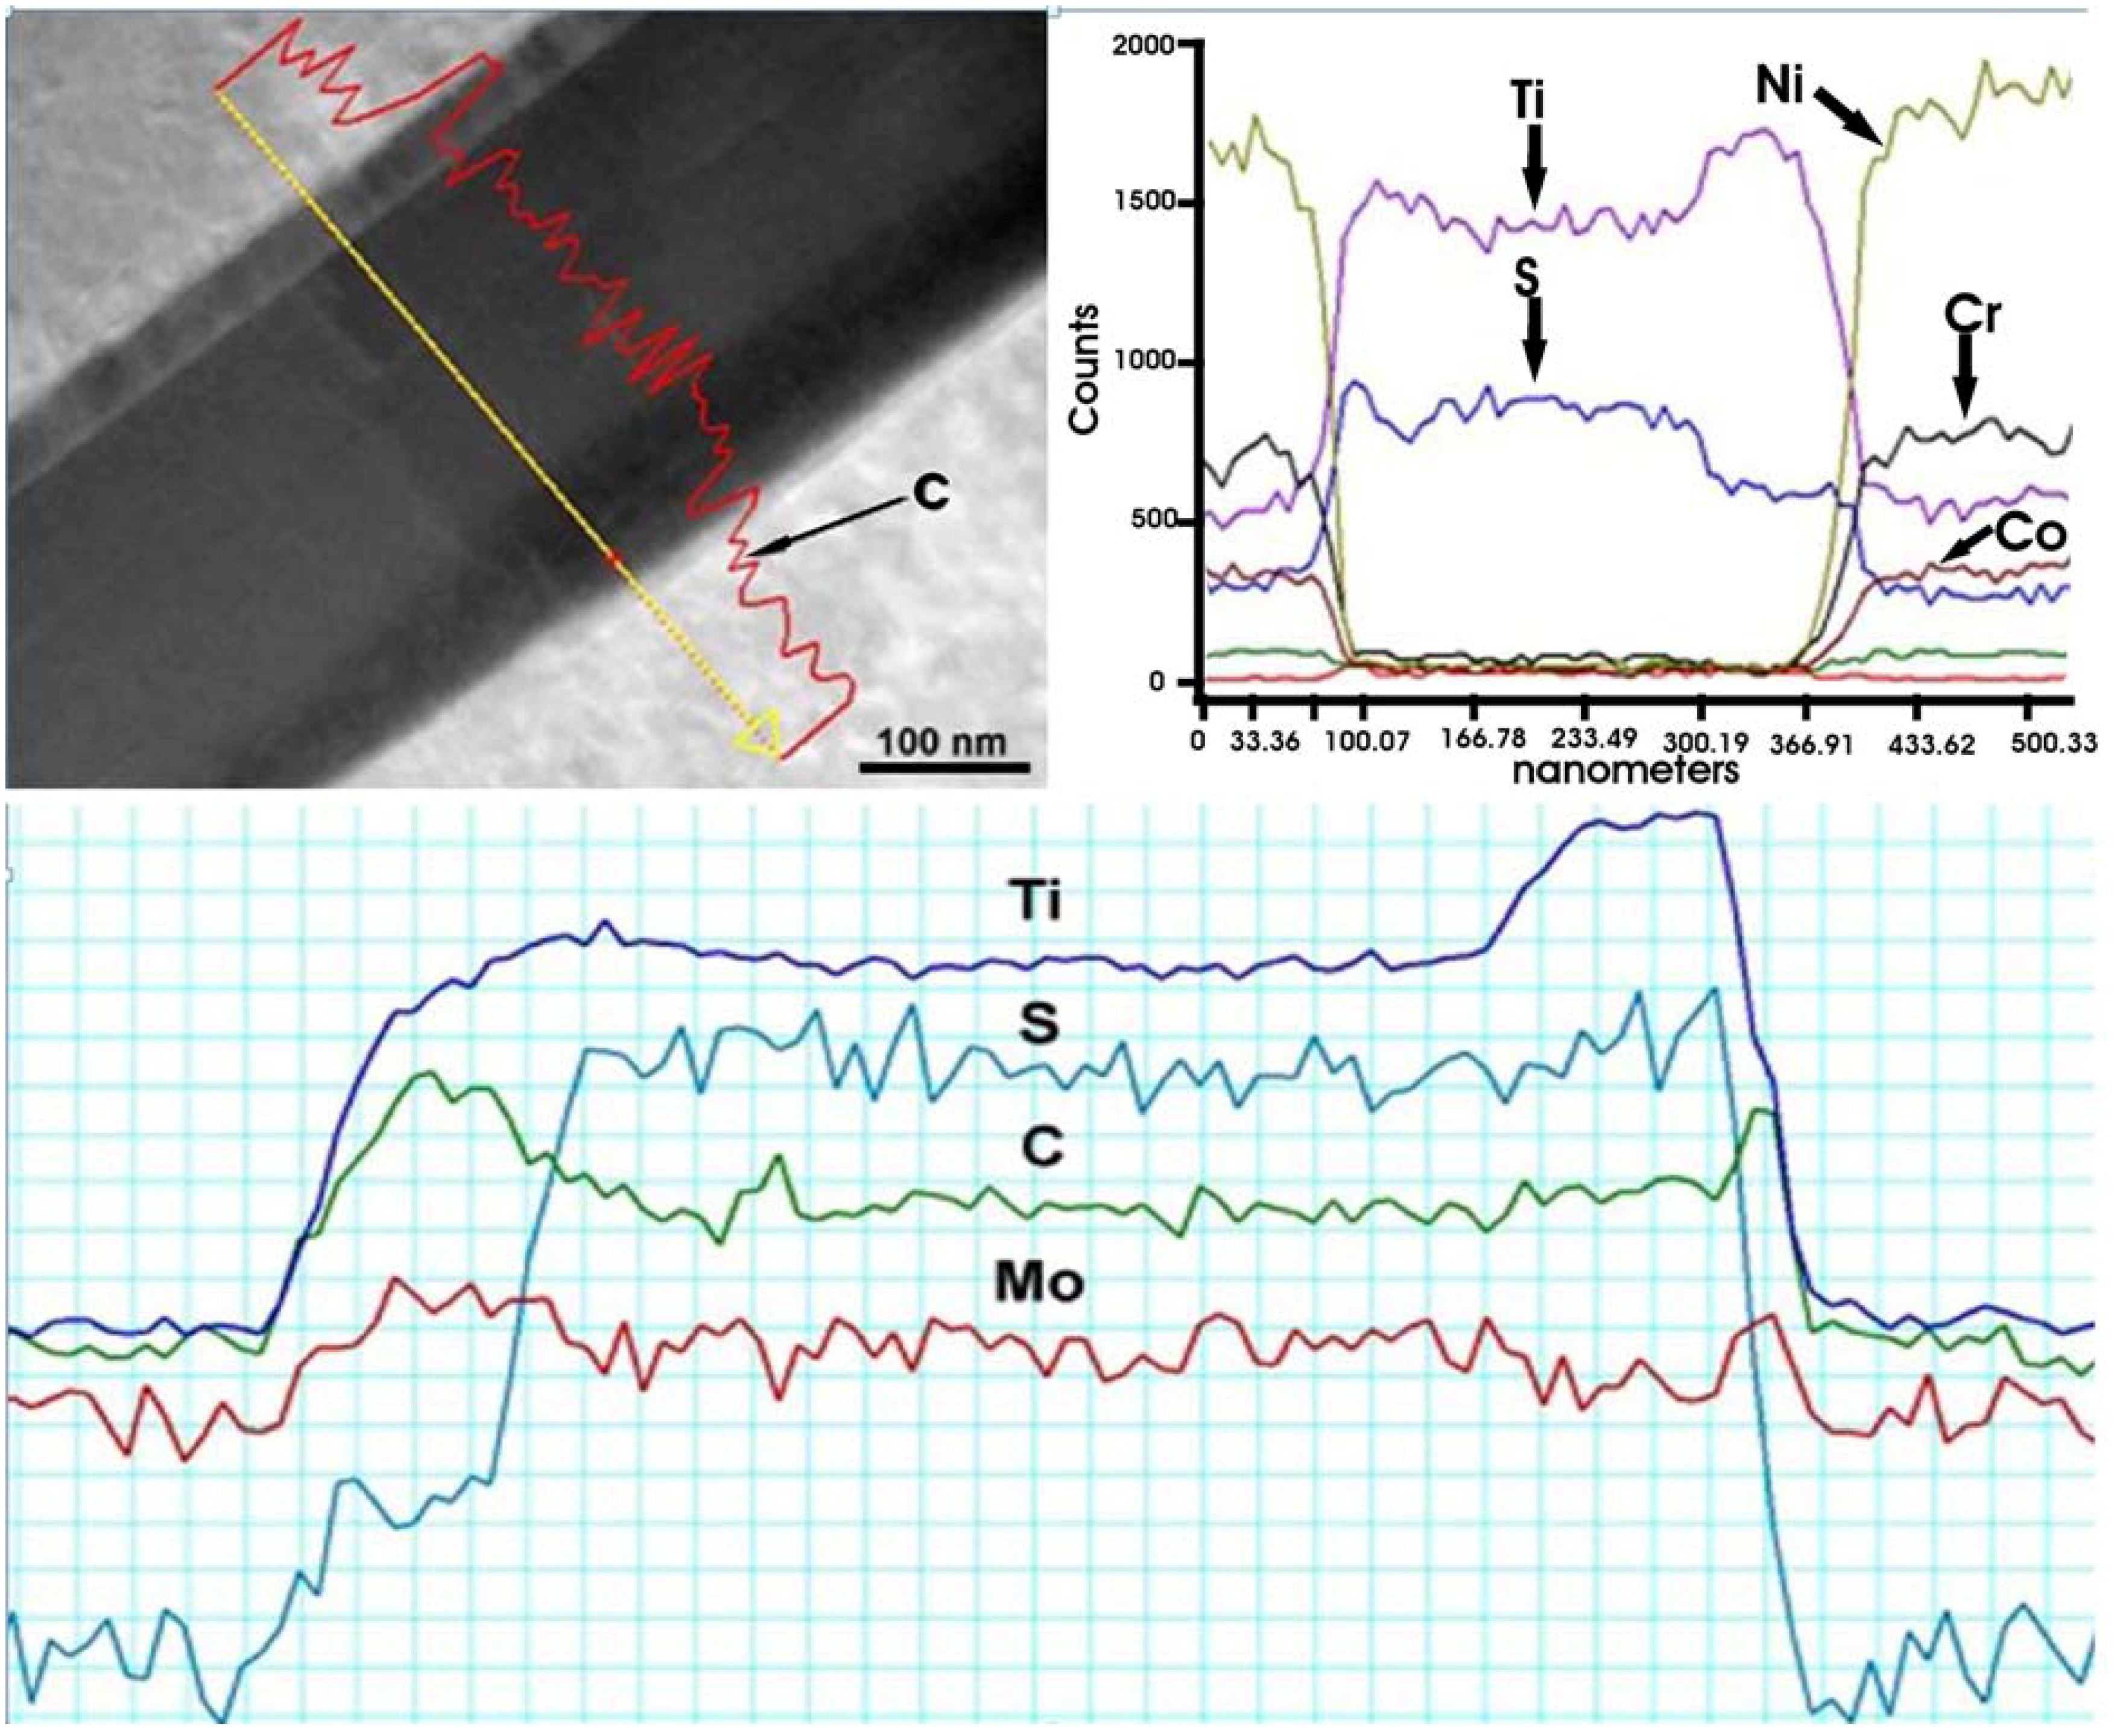
- Lamellar eutectoid and carbosulfide phases were always observed in close proximity to the σ phase precipitates. The Lamellar eutectoid constituent consists of: (a) chromium/molybdenum-rich secondary carbide and (b) γ phase. Carbosulfides are described by the general formula M2SC (M = Ti and Mo).
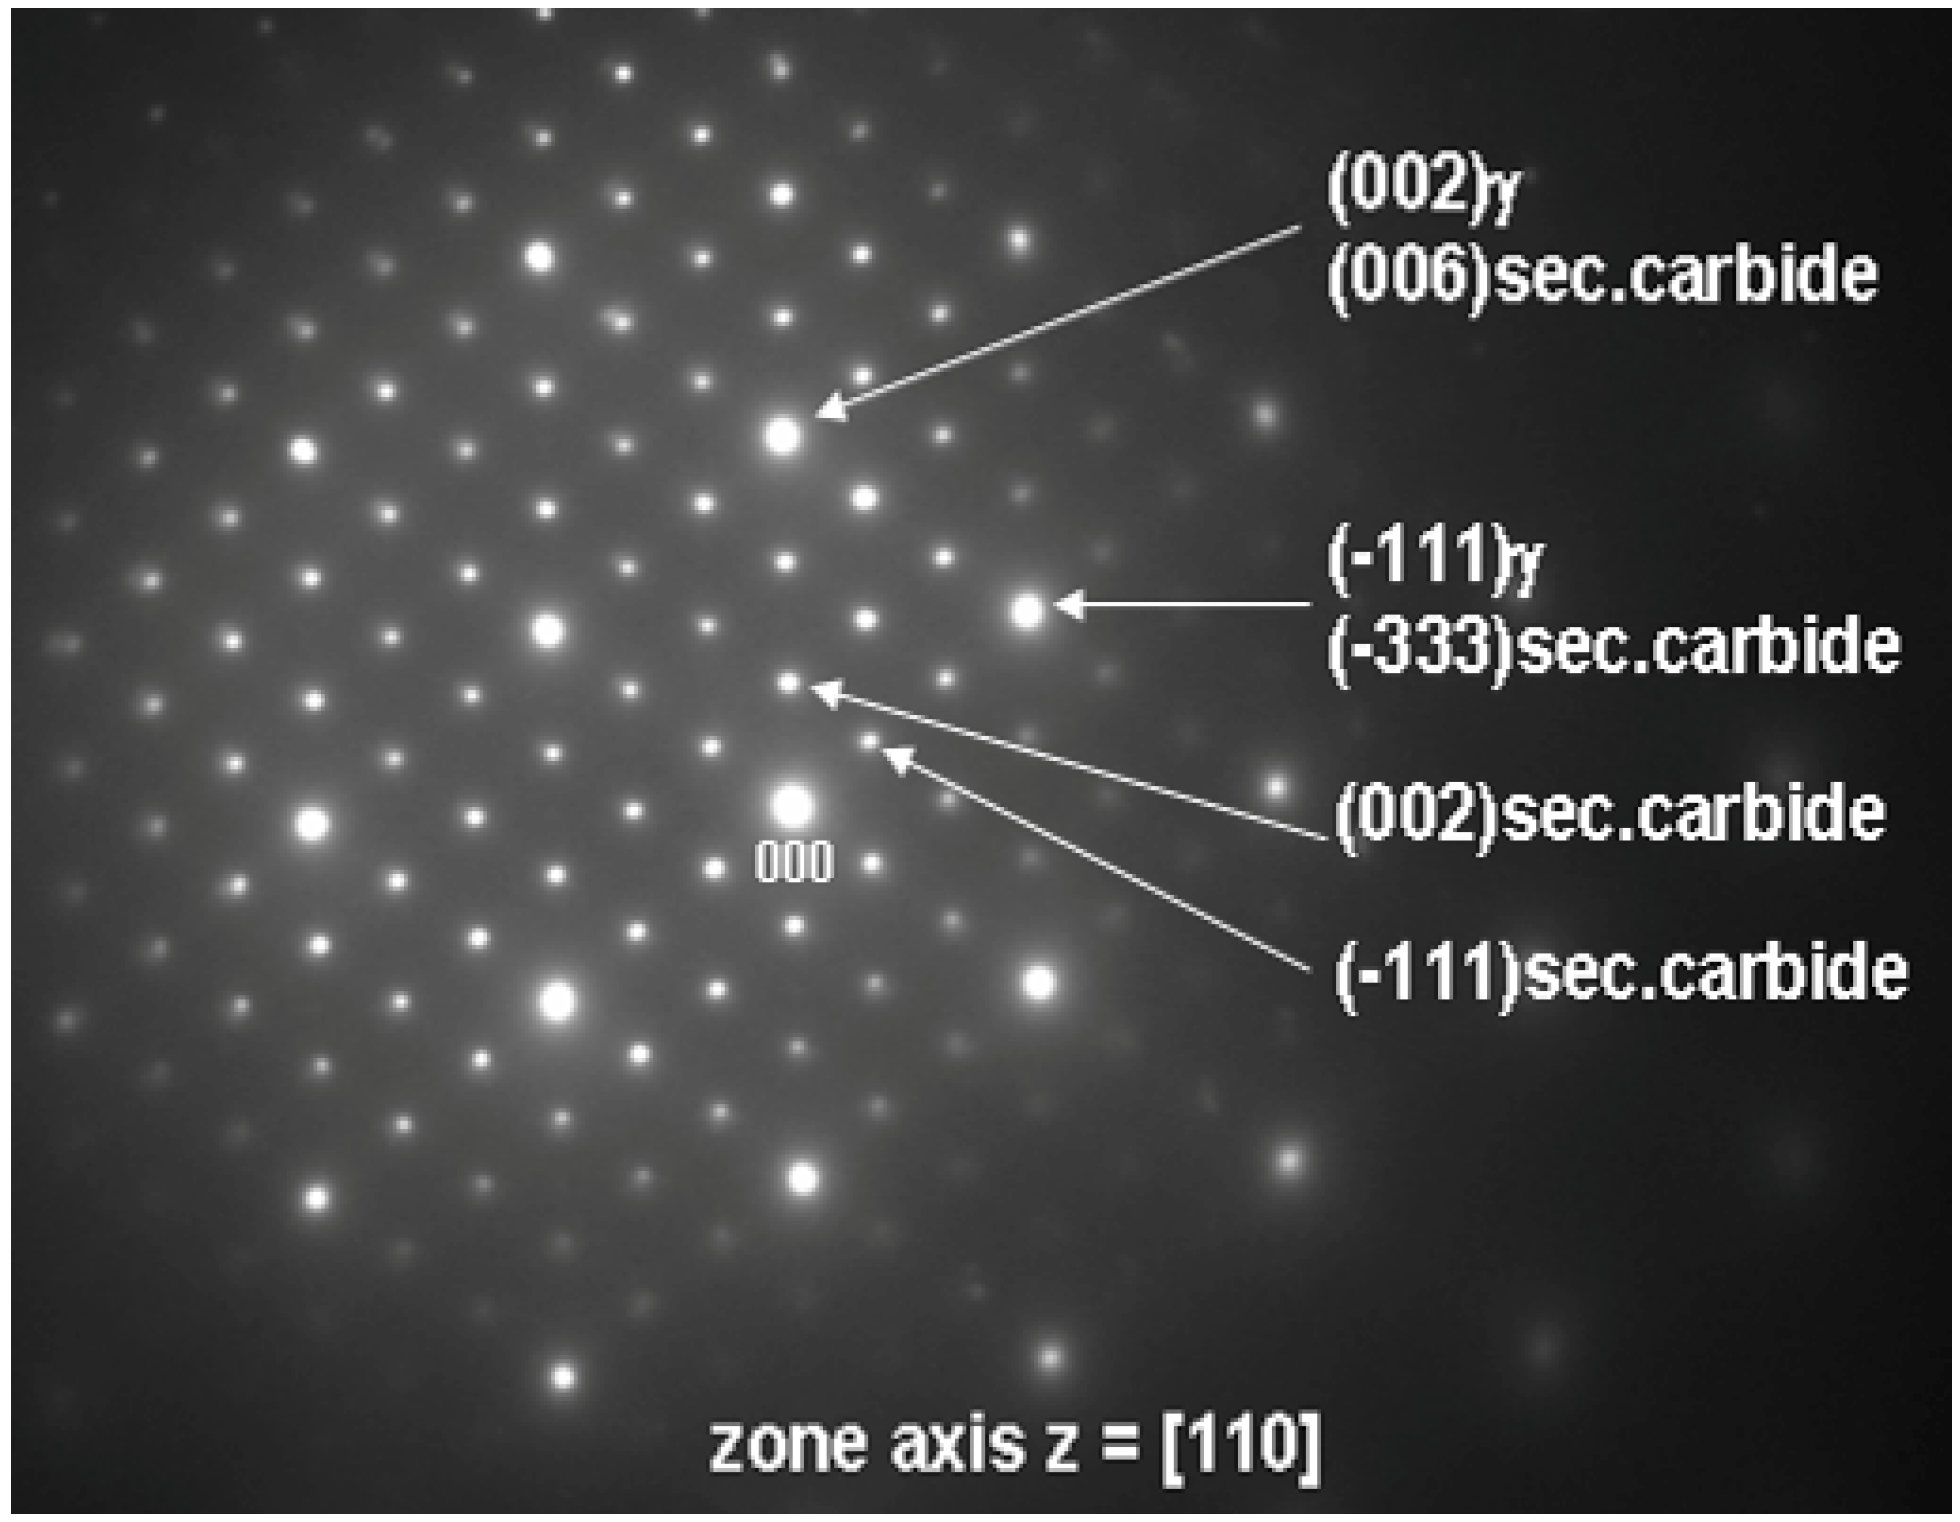
- The phases identified in the samples revealed the following crystallographic orientation relationships:[110]MC//[110] sec.carbide//[110]σ//[110]γʹ//[110]γ(−111)MC//(−111) sec.carbide//(001)σ//(−111)γʹ//(−111)γ
Acknowledgments
Conflicts of Interest
References
- Andersson, J. Weldability of Precipitation Hardening Superalloys—Influence of Microstructure. Ph.D. Dissertation, Chalmers University of Technology Göteborg, Göteborg, Sweden, 2011. [Google Scholar]
- Pike, L.M. Long Term Thermal Exposure of Haynes 282 Alloy. In Proceedings of the 7th International Symposium on Superalloy 718 and Derivatives, Pittsburgh, PA, USA, 10–13 October 2010; Ott, E.A., Groh, J.R., Banik, A., Dempster, I., Gabb, T.P., Helmink, R., Liu, X., Mitchell, A., Sjöberg, G.P., Wusatowska-Sarnek, A., Eds.; The Minerals, Metals and Materials Society: Warrendale, PA, USA, 2010; pp. 645–660. [Google Scholar]
- Pike, L.M. Development of a Fabricable Gamma-prime (γ') Strengthened Superalloy. In Proceedings of The 11th International Symposium on Superalloys, Champion, PA, USA, 14–18 September 2008; Reed, R.C., Green, K.A., Caron, P., Gabb, T.P., Fahrmann, M.G., Huron, E.S., Woodard, S.A., Eds.; The Minerals, Metals and Materials Society: Warrendale, PA, USA, 2008; pp. 191–200. [Google Scholar]
- Sobczak, N.; Pirowski, Z.; Purgert, R.M.; Uhl, W.; Jaskowiec, K.; Sobczak, J.J. Castability of HAYNES 282 Alloy. In Proceeding of Workshop “Advanced Ultrasupercritical Coal-Fired Power Plants”, Vienna, Austria, 19–20 September 2012.
- Jablonski, P.D.; Hawk, J.A.; Cowen, C.J.; Maziasz, P.J. Processing of advanced cast alloys for A-USC steam turbine applications. J. Miner. Metals Mater. Soc. 2012, 64, 271–279. [Google Scholar] [CrossRef]
- Holcomb, G.R.; Jablonski, P.D.; Wang, P. Cast Alloys for Advanced Ultra Supercritical Steam Turbines. In Proceedings of the 7th International Symposium on Superalloy 718 and Derivatives, Pittsburgh, PA, USA, 10–13 October 2010; Ott, E.A., Groh, J.R., Banik, A., Dempster, I., Gabb, T.P., Helmink, R., Liu, X., Mitchell, A., Sjöberg, G.P., Wusatowska-Sarnek, A., Eds.; The Minerals, Metals and Materials Society: Warrendale, PA, USA, 2010; pp. 947–960. [Google Scholar]
- Andersson, J.; Sjöberg, G.; Chaturvedi, M. Hot Ductility Study of HAYNES® 282® Superalloy. In Proceedings of the 7th International Symposium on Superalloy 718 and Derivatives, Pittsburgh, PA, USA, 10–13 October 2010; Ott, E.A., Groh, J.R., Banik, A., Dempster, I., Gabb, T.P., Helmink, R., Liu, X., Mitchell, A., Sjöberg, G.P., Wusatowska-Sarnek, A., Eds.; The Minerals, Metals and Materials Society: Warrendale, PA, USA, 2010; pp. 539–554. [Google Scholar]
- Haynes International, Inc. HAYNES® 282® ALLOY, material data sheet. Available online: http://www.christianberner.se/$-1/file/filarkiv/cbab/dokument/legeringar-pdf-dokument/haynes-282-alloy.pdf (accessed on 22 September 2005).
- Ghoneim, A.; Ojo, O.A. Microstructure and mechanical response of transient liquid phase joint in Haynes 282 superalloy. Mater. Charact. 2011, 62, 1–7. [Google Scholar] [CrossRef]
- Jablonski, P.D.; Cowen, C.J.; Hawk, J.A. Effects of Al and Ti on Haynes 282 with Fixed Gamma Prime Content. In Proceedings of the 7th International Symposium on Superalloy 718 and Derivatives, Pittsburgh, PA, USA, 10–13 October 2010; Ott, E.A., Groh, J.R., Banik, A., Dempster, I., Gabb, T.P., Helmink, R., Liu, X., Mitchell, A., Sjöberg, G.P., Wusatowska-Sarnek, A., Eds.; The Minerals, Metals and Materials Society: Warrendale, PA, USA, 2010; pp. 617–628. [Google Scholar]
- Osoba, L.O.; Ojo, O.A. Influence of laser welding heat input on HAZ cracking in newly developed Haynes 282 superalloy. Mater. Sci. Technol. 2012, 28, 431–436. [Google Scholar] [CrossRef]
- Osoba, L.O.; Ding, R.G.; Ojo, O.A. Microstructural analysis of laser weld fusion zone in Haynes 282 superalloy. Mater. Charact. 2012, 65, 93–99. [Google Scholar] [CrossRef]
- Longanbach, S.C.; Boehlert, C.J. The Creep and Fatigue Behaviour of Haynes 282 at Elevated Temperatures. In Proceedings of the 7th International Symposium on Superalloy 718 and Derivatives, Pittsburgh, PA, USA, 10–13 October 2010; Ott, E.A., Groh, J.R., Banik, A., Dempster, I., Gabb, T.P., Helmink, R., Liu, X., Mitchell, A., Sjöberg, G.P., Wusatowska-Sarnek, A., Eds.; The Minerals, Metals and Materials Society: Warrendale, PA, USA, 2010; pp. 555–557. [Google Scholar]
- Ghoneim, A.; Ojo, O.A. Transient Liquid Phase Bonding of Newly Developed Haynes 282 Superalloy. In Proceedings of the 7th International Symposium on Superalloy 718 and Derivatives, Pittsburgh, PA, USA, 10–13 October 2010; Ott, E.A., Groh, J.R., Banik, A., Dempster, I., Gabb, T.P., Helmink, R., Liu, X., Mitchell, A., Sjöberg, G.P., Wusatowska-Sarnek, A., Eds.; The Minerals, Metals and Materials Society: Warrendale, PA, USA, 2010; pp. 427–438. [Google Scholar]
- Zeytin, H.K.; Kaya, A.A.; Tekín, A. Microstructural evolution in a Ni-Cr-Co based superalloy during cooling from the melt. Mater. Charact. 2006, 57, 86–93. [Google Scholar] [CrossRef]
- Darolia, R.; Lahrman, D.F.; Field, R.D. Formation of Topologically Closed Packed Phases in Nickel Base Single Crystal Superalloys. In Proceedings of the Sixth International Symposium of Superalloys 1988,Seven Springs Mountain Report, Champion, PA, USA, 18–22 September 1988; Reichman, S., Duhl, D.N., Maurer, G., Antolovich, S., Lund, C., Eds.; The Metallurgical Society: Warrendale, PA, USA, 1988; pp. 255–264. [Google Scholar]
- Long, F.; Yoo, Y.S.; Jo, C.Y.; Seo, S.M.; Jeong, H.W.; Song, Y.S.; Jin, T.; Hu, Z.Q. Phase transformation of and σ phases in an experimental nickel-based superalloy. J. Alloy. Compd. 2009, 478, 181–187. [Google Scholar] [CrossRef]
- Liu, L.R.; Jin, T.; Zhao, N.R.; Wang, Z.H.; Sun, X.F.; Guan, H.R.; Hu, Z.Q. Microstructural evolution of a single crystal nickel-base superalloy during thermal exposure. Mater. Lett. 2003, 57, 4540–4546. [Google Scholar] [CrossRef]
- Yang, J.X.; Zheng, Q.; Sun, X.F.; Guan, H.R.; Hu, Z.Q. Topologically close-packed phase precipitation in a nickel-base superalloy during thermal exposure. Mater. Sci. Eng. A 2007, 465, 100–108. [Google Scholar] [CrossRef]
- Srinivasan, D. Effect of long-time exposure on the evolution of minor phases in Alloy 718. Mater. Sci. Eng. A 2004, 364, 27–34. [Google Scholar] [CrossRef]
- Sun, F.; Zhang, J.; Liu, P.; Feng, Q.; Han, X.; Mao, S. High resolution transmission electron microscopy studies of R phase in Ni-based single crystal superalloys. J. Alloy. Compd. 2012, 536, 80–84. [Google Scholar] [CrossRef]
- Acharya, M.V.; Fuchs, G.E. The effect of long-term thermal exposures on the microstructure and properties of CMSX-10 single crystal Ni-base superalloys. Mater. Sci. Eng. A 2004, 381, 143–153. [Google Scholar] [CrossRef]
- Miao, Z.J.; Shan, A.D.; Wu, Y.B.; Lu, J.; Xu, W.L.; Song, H.W. Quantitative analysis of homogenization treatment of INCONEL718 superalloy. Trans. Nonferrous Met. Soc. China 2011, 21, 1009–1017. [Google Scholar] [CrossRef]
- Underwood, E.E. “The Mathematical Foundations of Quantitative Stereology”,Stereology and Quantitative Metallography; ASTM STP 504; American Society for Testing and Materials: Easton, PA, USA, 1972; pp. 3–38. [Google Scholar]
- Lvov, G.; Levit, V.I.; Kaufman, M.J. Mechanism of primary MC carbide decomposition in Ni-base superalloys. Metall. Mater. Trans. A 2004, 35, 1669–1679. [Google Scholar] [CrossRef]
- Davis, J.R. Nickel, Cobalt and Their Alloys; ASM International: Almere, The Netherlands, 2000. [Google Scholar]
- Geddes, B.; Leon, H.; Huang, X. Superalloys Alloying and Performance; ASM International: Almere, the Netherlands, 2010. [Google Scholar]
- Donachie, M.J.; Donachie, S.J. Superalloys A Technical Guide; ASM International: Almere, the Netherlands, 2002. [Google Scholar]
- Zhang, H.R.; Ojo, O.A.; Chaturvedi, M.C. Nanosize boride particles in heat-treated nickel base superalloys. Scr. Mater. 2008, 58, 167–170. [Google Scholar] [CrossRef]
- Osoba, L.O.; Ding, R.G.; Ojo, O.A. Improved resistance to laser weld heat-affected zone microfissuring in a newly developed superalloy HAYNES 282. Metall. Mater. Trans. A 2012, 43, 4281–4295. [Google Scholar]
- Du, Y.L.; Sun, Z.M.; Hashimoto, H.; Tian, W.B. First-principles study on electronic structure and elastic properties of Ti2SC. Phys. Lett. A 2008, 372, 5220–5223. [Google Scholar] [CrossRef]
- Sun, W.R.; Guo, S.R.; Lu, D.Z.; Hu, Z.O. Effect of sulfur on the solidification and segregation in Inconel 718 alloy. Mater. Lett. 1997, 31, 195–200. [Google Scholar] [CrossRef]
- Sidhu, R.K.; Ojo, O.A.; Chaturvedi, M.C. Sub-solidus melting of directionally solidified Rene 80 superalloy during solution heat treatment. J. Mater. Sci. 2008, 43, 3612–3617. [Google Scholar] [CrossRef]
- Sims, C.T. A contemporary view of cobalt-base alloys. J. Met. 1969, 21, 27–42. [Google Scholar]
- Sims, C.T. A contemporary view of nickel-base superalloys. J. Met. 1966, 18, 1119–1130. [Google Scholar]
- Na, Y.S.; Park, N.K.; Reed, R.C. Sigma morphology and precipitation mechanism in Udimet 720Li. Scr. Mater. 2000, 43, 585–590. [Google Scholar] [CrossRef]
- Wallwork, G.; Croll, J. Reviews of High Temperature Materials; Freund Publishing House: London, UK, 1976. [Google Scholar]
- Jackson, K.A.; Hunt, J.D. Lamellar and rod eutectic growth. Trans. Metall. Soc. AIME 1966, 236, 1129–1142. [Google Scholar]
- Elliot, R. Eutectic Solidification Processing—Crystalline and Glassy Alloys; Butterworths: London, UK, 1983. [Google Scholar]
- Sims, C.T.; Stoloff, N.S.; Hagel, W.C. Superalloys II; John Wiley & Sons: New York, NY, USA, 1987. [Google Scholar]
- Rae, C.M.F.; Reed, R.C. The precipitation of topologically close-packed phases in rhenium-containing superalloys. Acta Mater. 2001, 49, 4113–4125. [Google Scholar] [CrossRef]
- Saunders, N.; Guo, Z.; Li, X.; Miodownik, A.P.; Schillé, J.Ph. Using JMatPro to model materials properties and behavior. J. Manag. 2003, 55, 60–65. [Google Scholar]
© 2013 by the authors; licensee MDPI, Basel, Switzerland. This article is an open access article distributed under the terms and conditions of the Creative Commons Attribution license (http://creativecommons.org/licenses/by/3.0/).
Share and Cite
Matysiak, H.; Zagorska, M.; Andersson, J.; Balkowiec, A.; Cygan, R.; Rasinski, M.; Pisarek, M.; Andrzejczuk, M.; Kubiak, K.; Kurzydlowski, K.J. Microstructure of Haynes® 282® Superalloy after Vacuum Induction Melting and Investment Casting of Thin-Walled Components. Materials 2013, 6, 5016-5037. https://doi.org/10.3390/ma6115016
Matysiak H, Zagorska M, Andersson J, Balkowiec A, Cygan R, Rasinski M, Pisarek M, Andrzejczuk M, Kubiak K, Kurzydlowski KJ. Microstructure of Haynes® 282® Superalloy after Vacuum Induction Melting and Investment Casting of Thin-Walled Components. Materials. 2013; 6(11):5016-5037. https://doi.org/10.3390/ma6115016
Chicago/Turabian StyleMatysiak, Hubert, Malgorzata Zagorska, Joel Andersson, Alicja Balkowiec, Rafal Cygan, Marcin Rasinski, Marcin Pisarek, Mariusz Andrzejczuk, Krzysztof Kubiak, and Krzysztof J. Kurzydlowski. 2013. "Microstructure of Haynes® 282® Superalloy after Vacuum Induction Melting and Investment Casting of Thin-Walled Components" Materials 6, no. 11: 5016-5037. https://doi.org/10.3390/ma6115016
APA StyleMatysiak, H., Zagorska, M., Andersson, J., Balkowiec, A., Cygan, R., Rasinski, M., Pisarek, M., Andrzejczuk, M., Kubiak, K., & Kurzydlowski, K. J. (2013). Microstructure of Haynes® 282® Superalloy after Vacuum Induction Melting and Investment Casting of Thin-Walled Components. Materials, 6(11), 5016-5037. https://doi.org/10.3390/ma6115016