Article

Optimization of Dosage for Asphalt Volatile Harmful Gas Inhibitor Using Multi-Response Satisfaction Function and Nonlinear Regression

1
Shandong Key Laboratory of Technologies and Systems for Intelligent Construction Equipment, Shandong Jiaotong University, Jinan 250357, China
2
School of Highway and Construction Engineering, Yunnan Communications Vocational and Technical College, Kunming 650500, China
3
Jining Jizou Expressway Co., Ltd., Jining 272067, China
4
Shandong Pengcheng Road and Bridge Group Co., Ltd., Jining 272499, China
5
Jinan Urban Construction Group, Jinan 250031, China
6
Department of Civil and Industrial Engineering, University of Pisa, Largo Lucio Lazzarino 1, 56126 Pisa, Italy
*
Authors to whom correspondence should be addressed.
Materials 2026, 19(9), 1871; https://doi.org/10.3390/ma19091871
Submission received: 24 March 2026 / Revised: 24 April 2026 / Accepted: 29 April 2026 / Published: 1 May 2026
(This article belongs to the Special Issue Material Characterization, Design and Modeling of Asphalt Pavements)

Abstract

To achieve synergistic, efficient degradation of volatile, harmful gases in asphalt and to scientifically quantify inhibitor dosage, this study proposes a dosage optimization method that integrates nonlinear regression with a multi-response satisfaction function. Focusing on a proprietary composite volatile gas suppressant, we systematically measured the concentration trends of ammonia, nitrogen oxides, sulfur dioxide, and hydrogen sulfide emitted from three asphalt systems: base asphalt, SBS modified asphalt (Styrene-Butadiene-Styrene modified asphalt), and rubber modified asphalt under different suppressant dosages (0%, 0.02%, 0.04%, 0.06%, 0.08%, and 0.10%). First, high-precision prediction models (R2 > 0.95) were established using nonlinear regression to relate different inhibitor dosages to corresponding gas concentrations. Based on a satisfaction function, the multi-objective degradation effects were normalized into a comprehensive satisfaction index, and the optimal dosage was then determined. The results indicate: (1) the constructed models can accurately predict the concentrations of volatile harmful gases at various dosages; (2) the predicted optimal blending ratios vary by asphalt type, specifically 0.082% for base asphalt, 0.079% for SBS modified asphalt, and 0.080% for rubber modified asphalt; and (3) at the optimal blending ratios, all four gases achieve high and balanced degradation levels, resulting in the best overall degradation performance. At the same time, road performance tests confirmed that this blending ratio has no significant negative impact on the high-temperature and low-temperature stability or water stability of the asphalt mixture. Compared with traditional single-factor empirical methods, this approach represents a methodological upgrade from qualitative description to quantitative prediction, and from single-objective comparison to multi-objective synergistic optimization, providing data and theoretical support for the precise, efficient, and engineering-applicable use of asphalt volatile gas inhibitors.

1. Introduction

Asphalt fumes released during the production and construction of hot-mix asphalt contain various volatile organic compounds and irritating harmful gases, severely polluting the environment and endangering the health of construction workers [1,2,3]. Adding volatile gas inhibitors is one effective method to suppress harmful gas emissions at the source. Current research primarily focuses on developing novel inhibitors [4,5,6,7] and verifying their degradation effects [8,9,10]. However, current research has not yet achieved a balance between the degree of degradation of harmful fumes generated during the mixing of asphalt mixtures and their road performance. It thus cannot provide effective guidance on the appropriate dosage of inhibitors. When determining optimal dosage levels, single-factor experiments are commonly employed. This involves comparing trends in single or multiple gas concentrations across different dosages and establishing a dosage range based on engineering experience. While this method is simple and intuitive, it has significant limitations: First, it relies on discrete experimental data points for trend analysis, lacking quantitative models capable of continuous prediction [11]. Second, when dealing with multiple harmful gases that need to be controlled simultaneously, the optimal concentration ranges for achieving the best degradation efficiency may not overlap [12]. Simple observational methods make it difficult to scientifically weigh the merits of multiple targets and cannot accurately determine the optimal concentration.
Therefore, there is an urgent need to introduce more systematic and precise mathematical methods to advance the optimization of inhibitor dosages. Response surface methodology [13,14] is a powerful tool for solving multi-factor, multi-response optimization problems, but its full application typically requires at least two continuous independent variables. When the core objective is to optimize a single factor (dosage), combining nonlinear regression with multi-response optimization algorithms provides an efficient and accurate alternative. Therefore, compared to traditional empirical methods (such as single-factor equal-step trial-and-error methods or equal-weighting methods), the use of nonlinear regression combined with a multi-response satisfaction function can more accurately describe continuous dose–response relationships and provide optimal dosage decisions when balancing the trade-offs among the degradation effects of various gases. Nonlinear regression establishes precise quantitative relationship models between variables. At the same time, multi-response optimization algorithms (such as the satisfaction function method [15]) integrate multiple competing or correlated objectives into a single comprehensive metric for optimization.
Based on this, this paper takes a composite inhibitor independently developed by our team as an example. First, experimental data were obtained on how the concentrations of four major harmful gases (NH3, NOx, SO2, and H2S) in three typical asphalt systems vary with the amount of inhibitor added. Subsequently, a high-precision nonlinear prediction model was established to address the technical challenges involved in continuous quantitative prediction. Finally, using the satisfaction function method, the degradation effects of the four gases were comprehensively and synergistically optimized to determine the precise dosage that maximizes overall satisfaction. This study aims to achieve the following objectives: (1) achieve a comprehensive satisfaction rate of over 85% in each asphalt system; (2) ensure that the degradation rates of all four harmful gases are no less than 40%; and (3) predict the inhibitor dosage as accurately as possible to provide clear dosage guidelines for engineering applications. This study aims to develop precise, quantitative, and scientifically rigorous guidelines for the application of inhibitors to minimize emissions of harmful asphalt fumes without compromising the performance of asphalt pavements, thereby advancing the development of asphalt pavement materials toward greater environmental sustainability and precision [16,17].

2. Materials and Test Methods

2.1. Materials

(1)
Base asphalt
This study used Qilu brand 70# asphalt (Shandong Hi-Speed New Materials Group Co., Ltd., Jinan, China) as the base asphalt. It was tested in accordance with the “Standard Test Methods for Asphalt and Asphalt Mixtures in Highway Engineering” (JTG 3410–2025) [18], and all technical indicators met the relevant requirements of the “Technical Specifications for Construction of Highway Asphalt Pavements” (JTG F40-2004) [19]. The test results are shown in Table 1.
(2)
SBS modified asphalt
The SBS modified asphalt selected for this study is Type I-D SBS modified asphalt supplied by Shandong Hi-Speed New Materials Group Co., Ltd. (Jinan, China). As shown in Table 2, all performance indicators meet the requirements of the Technical Specifications for Construction of Highway Asphalt Pavements (JTG F40-2004) [19].
(3)
Rubber modified asphalt
The rubber modified asphalt selected for this study is rubber powder modified asphalt supplied by Shandong Hi-Speed New Materials Group Co., Ltd. (Jinan, China). As shown in Table 3, all of its performance indicators meet the requirements of the Technical Standard for Rubberized Asphalt Pavement (CJJ/T 273-2019) [23].
(4)
Inhibitor
The inhibitor used in this study is a composite asphalt fume suppressant developed in-house by our research group. It is a pale yellow, transparent liquid with a density (at 25 °C) of 0.95 g/cm3, a flash point (open cup) of 178 °C, and a neutral pH. Adding this inhibitor during the production of hot-mixed asphalt mixtures effectively removes harmful volatile gases from the asphalt.
(5)
Mineral aggregate and mix proportion
This study employed limestone coarse aggregate, fine aggregate, and limestone powder, with key technical indicators including crush value, abrasion value, bulk density, water absorption rate, sand equivalent, and hydrophilic coefficient, all meeting the relevant requirements for mineral aggregates specified in the Technical Specifications for Construction of Highway Asphalt Pavements (JTG F40-2004) [19]. The mixture gradation adopts the AC-13 type, with a synthetic gradation designed based on the standard median value. The pass rates for all key sieve openings fall within the specified requirements.
Using the Marshall test method, the optimal binder-to-aggregate ratios for 70# asphalt, SBS modified asphalt, and rubber modified asphalt mixtures were determined to be 4.8%, 5.1%, and 6.2%, respectively, and these ratios were used for the uniform preparation of all subsequent test specimens.

2.2. Sample Preparation and Gas Collection Detection

Heat the asphalt to the specified temperature (160 °C for base asphalt, 180 °C for modified asphalt). Place the asphalt with different admixture dosages (0%, 0.02%, 0.04%, 0.06%, 0.08%, 0.10%) in a high-speed shear mixer. The mixture is pre-mixed at 1200 r/min for 5 min, followed by high-speed shearing at 4000 r/min for 25 min to produce a homogeneous sample [24]. The optimum binder-to-aggregate ratio for three asphalt mixtures was determined using the AC-13 gradation and Marshall design method, and specimens were molded.
A laboratory simulation apparatus (see Figure 1) was employed to collect gases released from asphalt mixtures during high-temperature mixing [25]. A specified mass of mixture (12,000 g) was heated and mixed in a sealed mixing pot. The generated gases were drawn through a conduit by a vacuum pump into a series-connected flue gas sampler (Ly-3072 Intelligent Dual-Channel Flue Gas Sampler; Qingdao Laoshan Applied Technology Research Institute, Qingdao, China). Ammonia (NH3), nitrogen oxides (NOx, expressed as NO2), and sulfur dioxide (SO2) were collected using dilute sulfuric acid absorption solution, hydrochloric acid-naphthylenediamine absorption solution, and formaldehyde buffer absorption solution, respectively. Hydrogen sulfide (H2S) is collected in gas sampling bags and absorbed using a cadmium hydroxide-polyvinyl alcohol ammonium phosphate solution [26]. (1) For NH3, a diluted sulfuric acid solution was used as the absorption solution. According to HJ 533-2009 [27] (Ambient air and exhaust gas—Determination of ammonia—Nessler’s reagent spectrophotometry), the absorption solution is 0.05 mol/L sulfuric acid(H2SO4). (2) For NOx(calculated as NO2), the absorption solution was prepared according to HJ 479-2009 [28] (Ambient air—Determination of nitrogen oxides—N-(1-Naphthyl) ethylenediamine dihydrochloride spectrophotometric method). The absorption solution typically consists of glacial acetic acid, sulfanilic acid, and N-(1-Naphthyl) ethylenediamine dihydrochloride. (3) For SO2, a formaldehyde buffer absorption solution was used. According to HJ 482-2009 [29] (Ambient air—Determination of sulfur dioxide—Formaldehyde absorption—pararosaniline spectrophotometry), the formaldehyde buffer stock solution is diluted 100 times with pure water before use to prepare the formaldehyde buffer absorption solution. (4) For H2S, an absorption solution containing cadmium hydroxide-polyvinyl alcohol-ammonium phosphate was used. According to the methylene blue spectrophotometric method specified in the fourth edition of the “Air and Exhaust Gas Monitoring and Analysis Methods”, the absorption solution is prepared by dissolving 4.3 g of cadmium sulfate (3CdSO4·8H2O), 0.3 g of sodium hydroxide (NaOH), and 10 g of polyvinyl alcohol-ammonium phosphate in water, mixing thoroughly, and diluting to 1000 mL, resulting in a milky white suspension. All gas concentrations are measured using a UV-visible spectrophotometer (Qingdao Laoshan Applied Technology Research Institute, Qingdao, China) in accordance with the corresponding national environmental protection standard methods [30]. Finally, the collected data were organized using Origin 2024 software.

2.3. Road Performance Testing of Asphalt Mixtures

To evaluate the effect of composite volatile gas inhibitors on the basic in-service performance of asphalt mixtures, test specimens were prepared for each type of asphalt at the optimal dosage determined through optimization and compared with blank samples (0% dosage) [31,32,33,34]. In accordance with the “Test Procedures for Asphalt and Asphalt Mixtures in Highway Engineering” (JTG 3410-2025) [18], as shown in Table 4, the key in-service performance tests were conducted, with each test performed in at least three parallel runs.

2.4. Principles and Process of Multi-Response Optimization

2.4.1. Establishing Nonlinear Regression Models

For each type of asphalt, a mathematical model was established to describe the relationship between the concentrations of four harmful gases ( y ) and the inhibitor content ( x ) [35]. In this study, quadratic and cubic fitting curves were used to construct a nonlinear regression model, which effectively captures the trend where gas concentrations first decrease rapidly and then stabilize as the inhibitor dosage increases. This is consistent with classical adsorption theory: at low concentrations, the inhibitor provides sufficient active sites, resulting in high degradation efficiency; as the concentration continues to increase, the active sites are gradually occupied by harmful gas molecules, leading to a decrease in degradation efficiency and a flatter curve. The specific model forms are as follows:
Second-order   polynomial   model:   y = β 0 + β 1 x + β 2 x 2 + ϵ
Three-fold   multi-form   model:   y = β 0 + β 1 x + β 2 x 2 + β 3 x 3 + ϵ
Among these, β i represents the regression coefficient, and ϵ denotes the random error. Based primarily on the coefficient of determination (R2) and residual analysis, the model with the best goodness-of-fit is selected.

2.4.2. Satisfaction Function Method

To simultaneously optimize the degradation efficiency of four harmful gases (NH3, NO2, SO2, H2S), the satisfaction function method proposed by Derringer and Suich [36] was adopted. This method converts each response ( y i ) into an individual satisfaction value ( d i ) ranging from 0 to 1.
(1)
Individual Satisfaction ( d i )
For harmful gas concentrations, the goal is “the lower, the better.” A linear decreasing function is used for conversion:
d i = 1 , y i y i m i n y i m a x y i y i m a x y i m i n , y i m i n < y i < y i m a x 0 , y i y i m a x
Among these, y i m i n and y i m a x represent the minimum and maximum concentrations observed for the i-th gas within the experimental dilution range (0–0.10%), respectively.
(2)
Overall Satisfaction (D)
The geometric mean of the satisfaction scores for each gas is calculated to obtain the overall comprehensive satisfaction score D, which serves as the final objective function for multi-response optimization.
D = ( d 1 × d 2 × d 3 × d 4 ) 1 / 4
The closer the overall satisfaction score D is to 1, the more ideal the overall degradation effect of the four gases.

2.4.3. Optimize the Solution Process

(1)
Utilize the established nonlinear regression model to predict gas concentrations at densely spaced blending points (intervals of 0.001%).
(2)
Calculate the individual satisfaction ( d i ) for each gas corresponding to each blending point based on the predicted concentrations and the maximum/minimum values within the experimental range.
(3)
Calculate the comprehensive satisfaction (D) corresponding to each blending point.
(4)
Identify the mixing ratio x* that maximizes the overall satisfaction D, which represents the theoretical optimum mixing ratio for that asphalt type.

3. Results and Discussion

3.1. Establishment and Validation of Nonlinear Regression Models

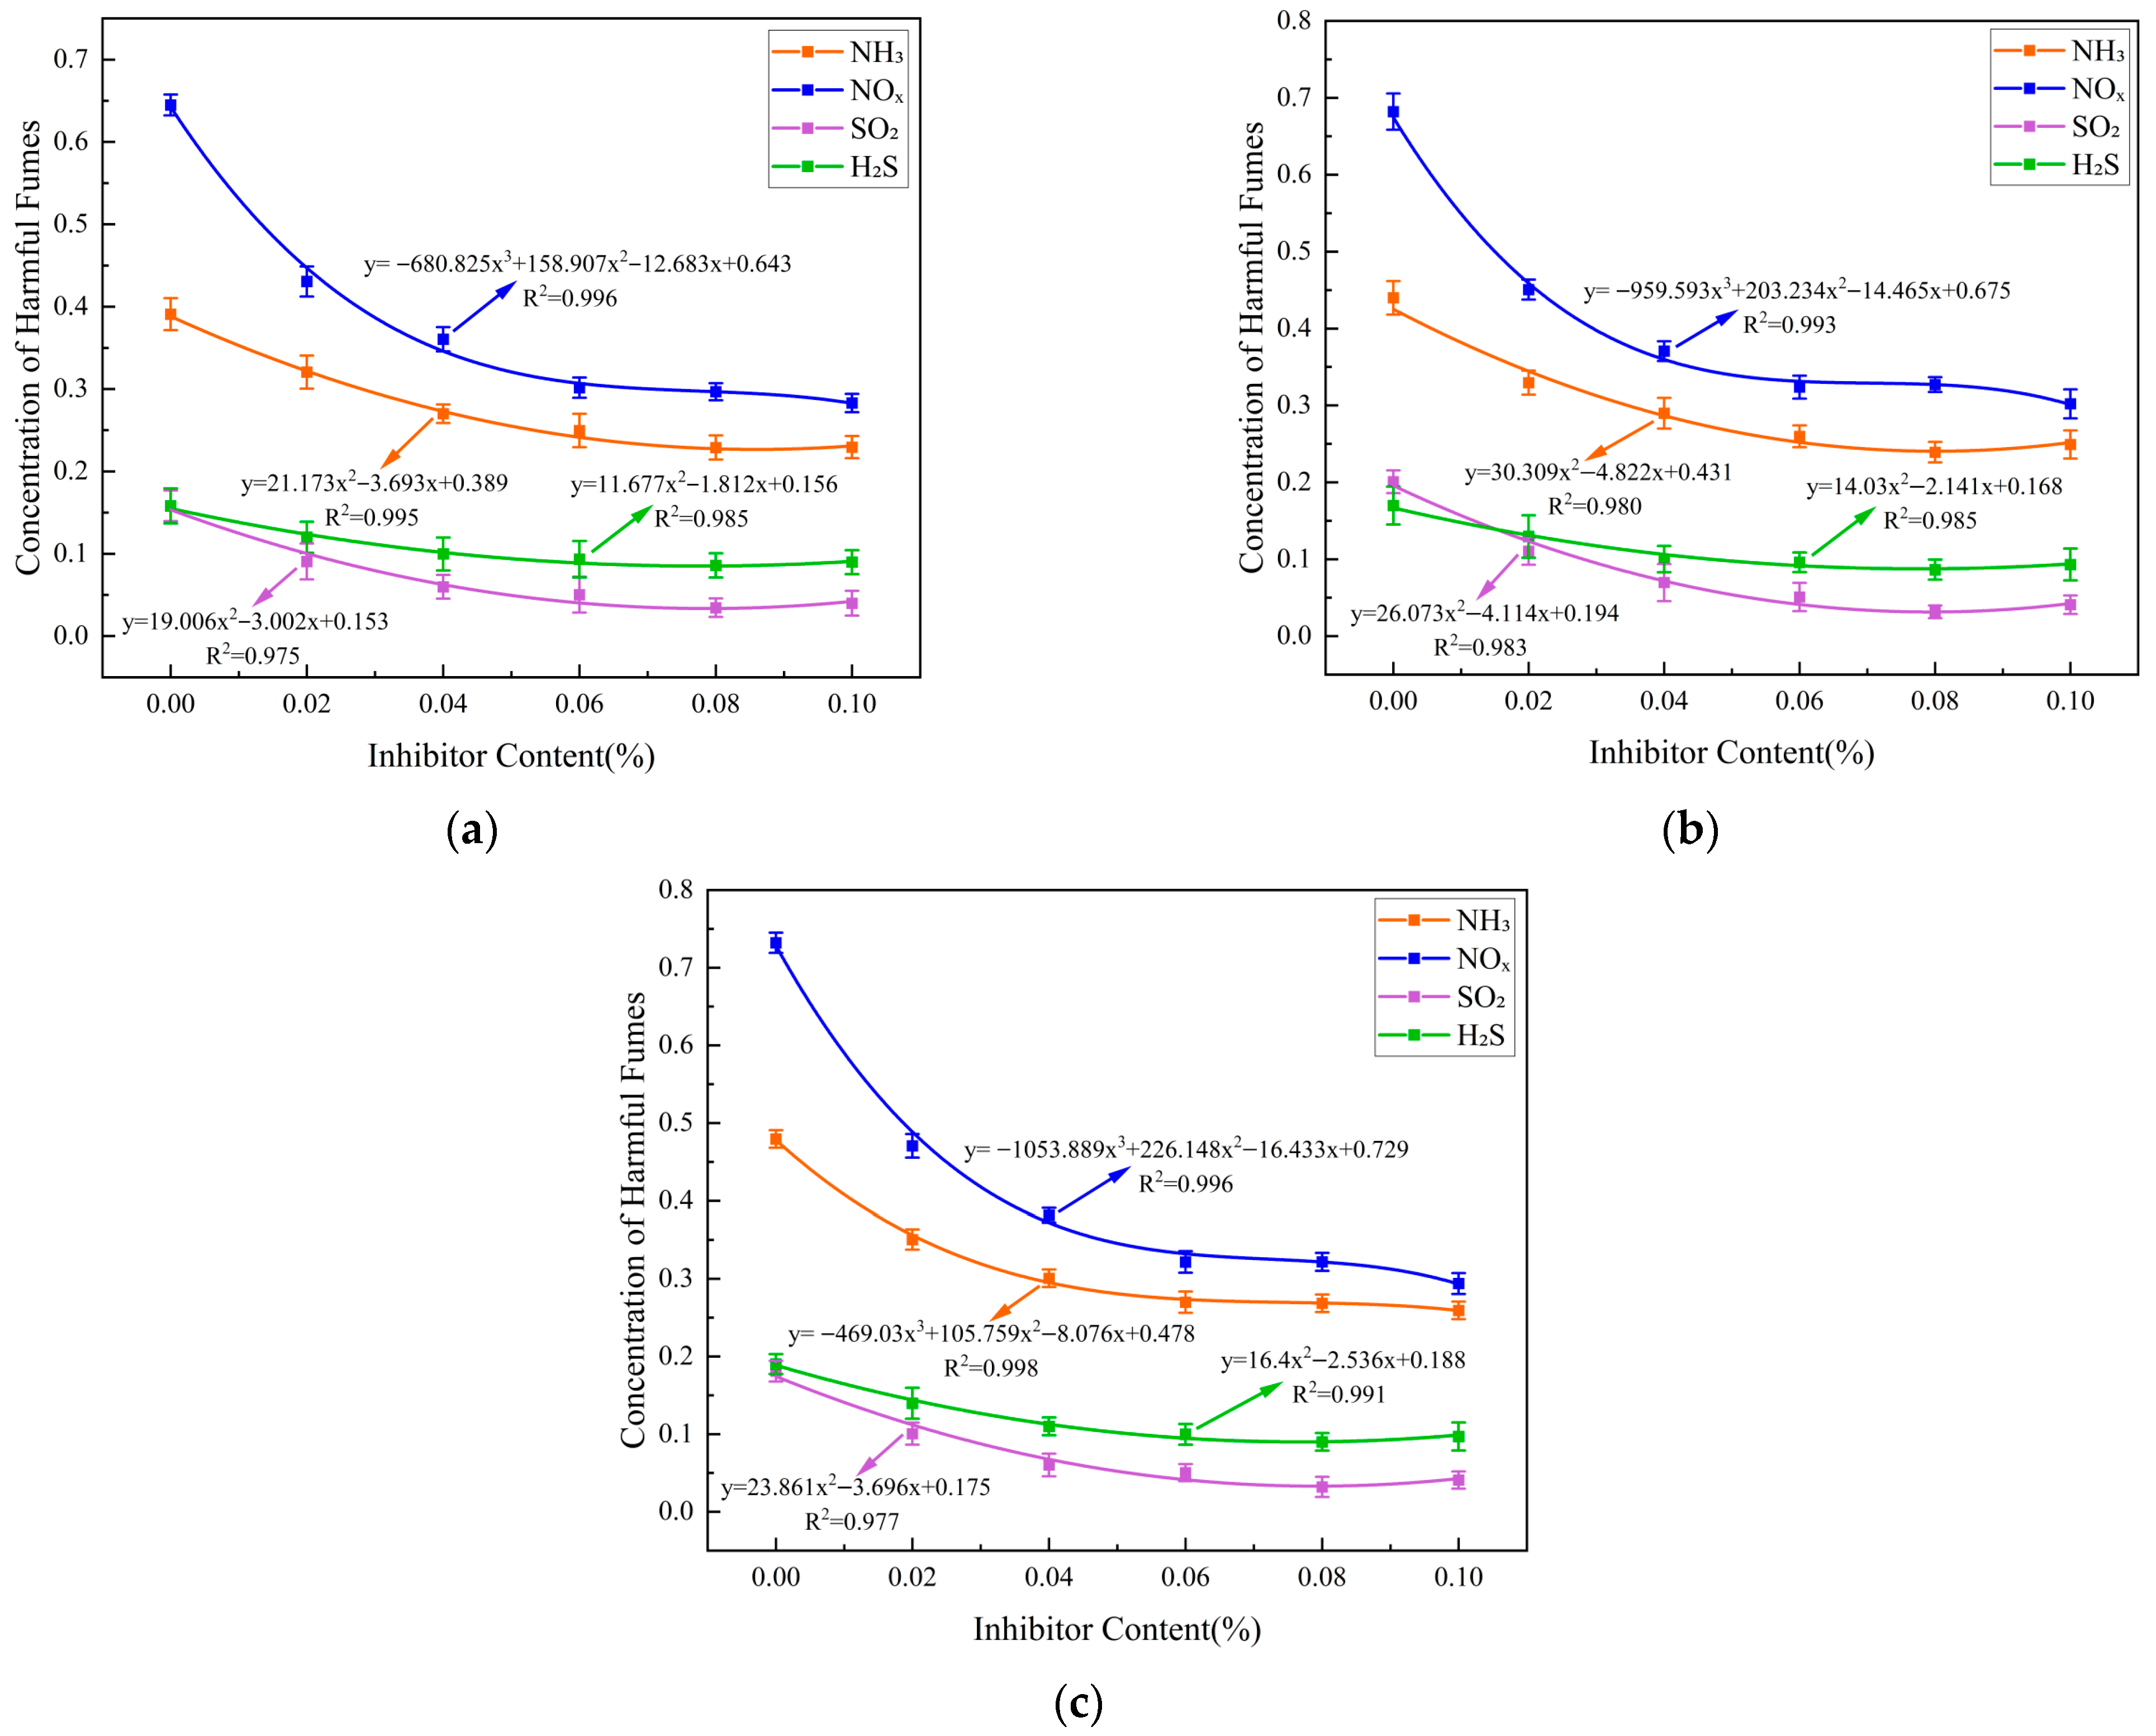
Scatter plots were plotted for the concentrations of four gases collected by the harmful fume simulation collection device, showing the relationship between the concentrations of harmful fumes released by three asphalt systems and the inhibitor dosage. Nonlinear curve fitting was performed using quadratic or cubic polynomials, with the fitted curves shown in Figure 2 below.
A significance analysis was performed on the fitting results for the three asphalt systems shown in the figure above, and the results are summarized in Table 5. All regression models passed the F-test (p < 0.01), indicating that the nonlinear relationship between inhibitor dosage and gas concentration is statistically significant. Furthermore, the coefficient of determination (R2) for all fitted curves was greater than 0.95, indicating high fitting accuracy and suggesting that these equations can be used to predict gas concentration values for the three asphalt systems at different inhibitor ratios. To verify the model accuracy, we conducted a repeat test using a 0.05% additive concentration; the deviation between the measured values and the model predictions did not exceed 5%, ruling out the possibility of overfitting.
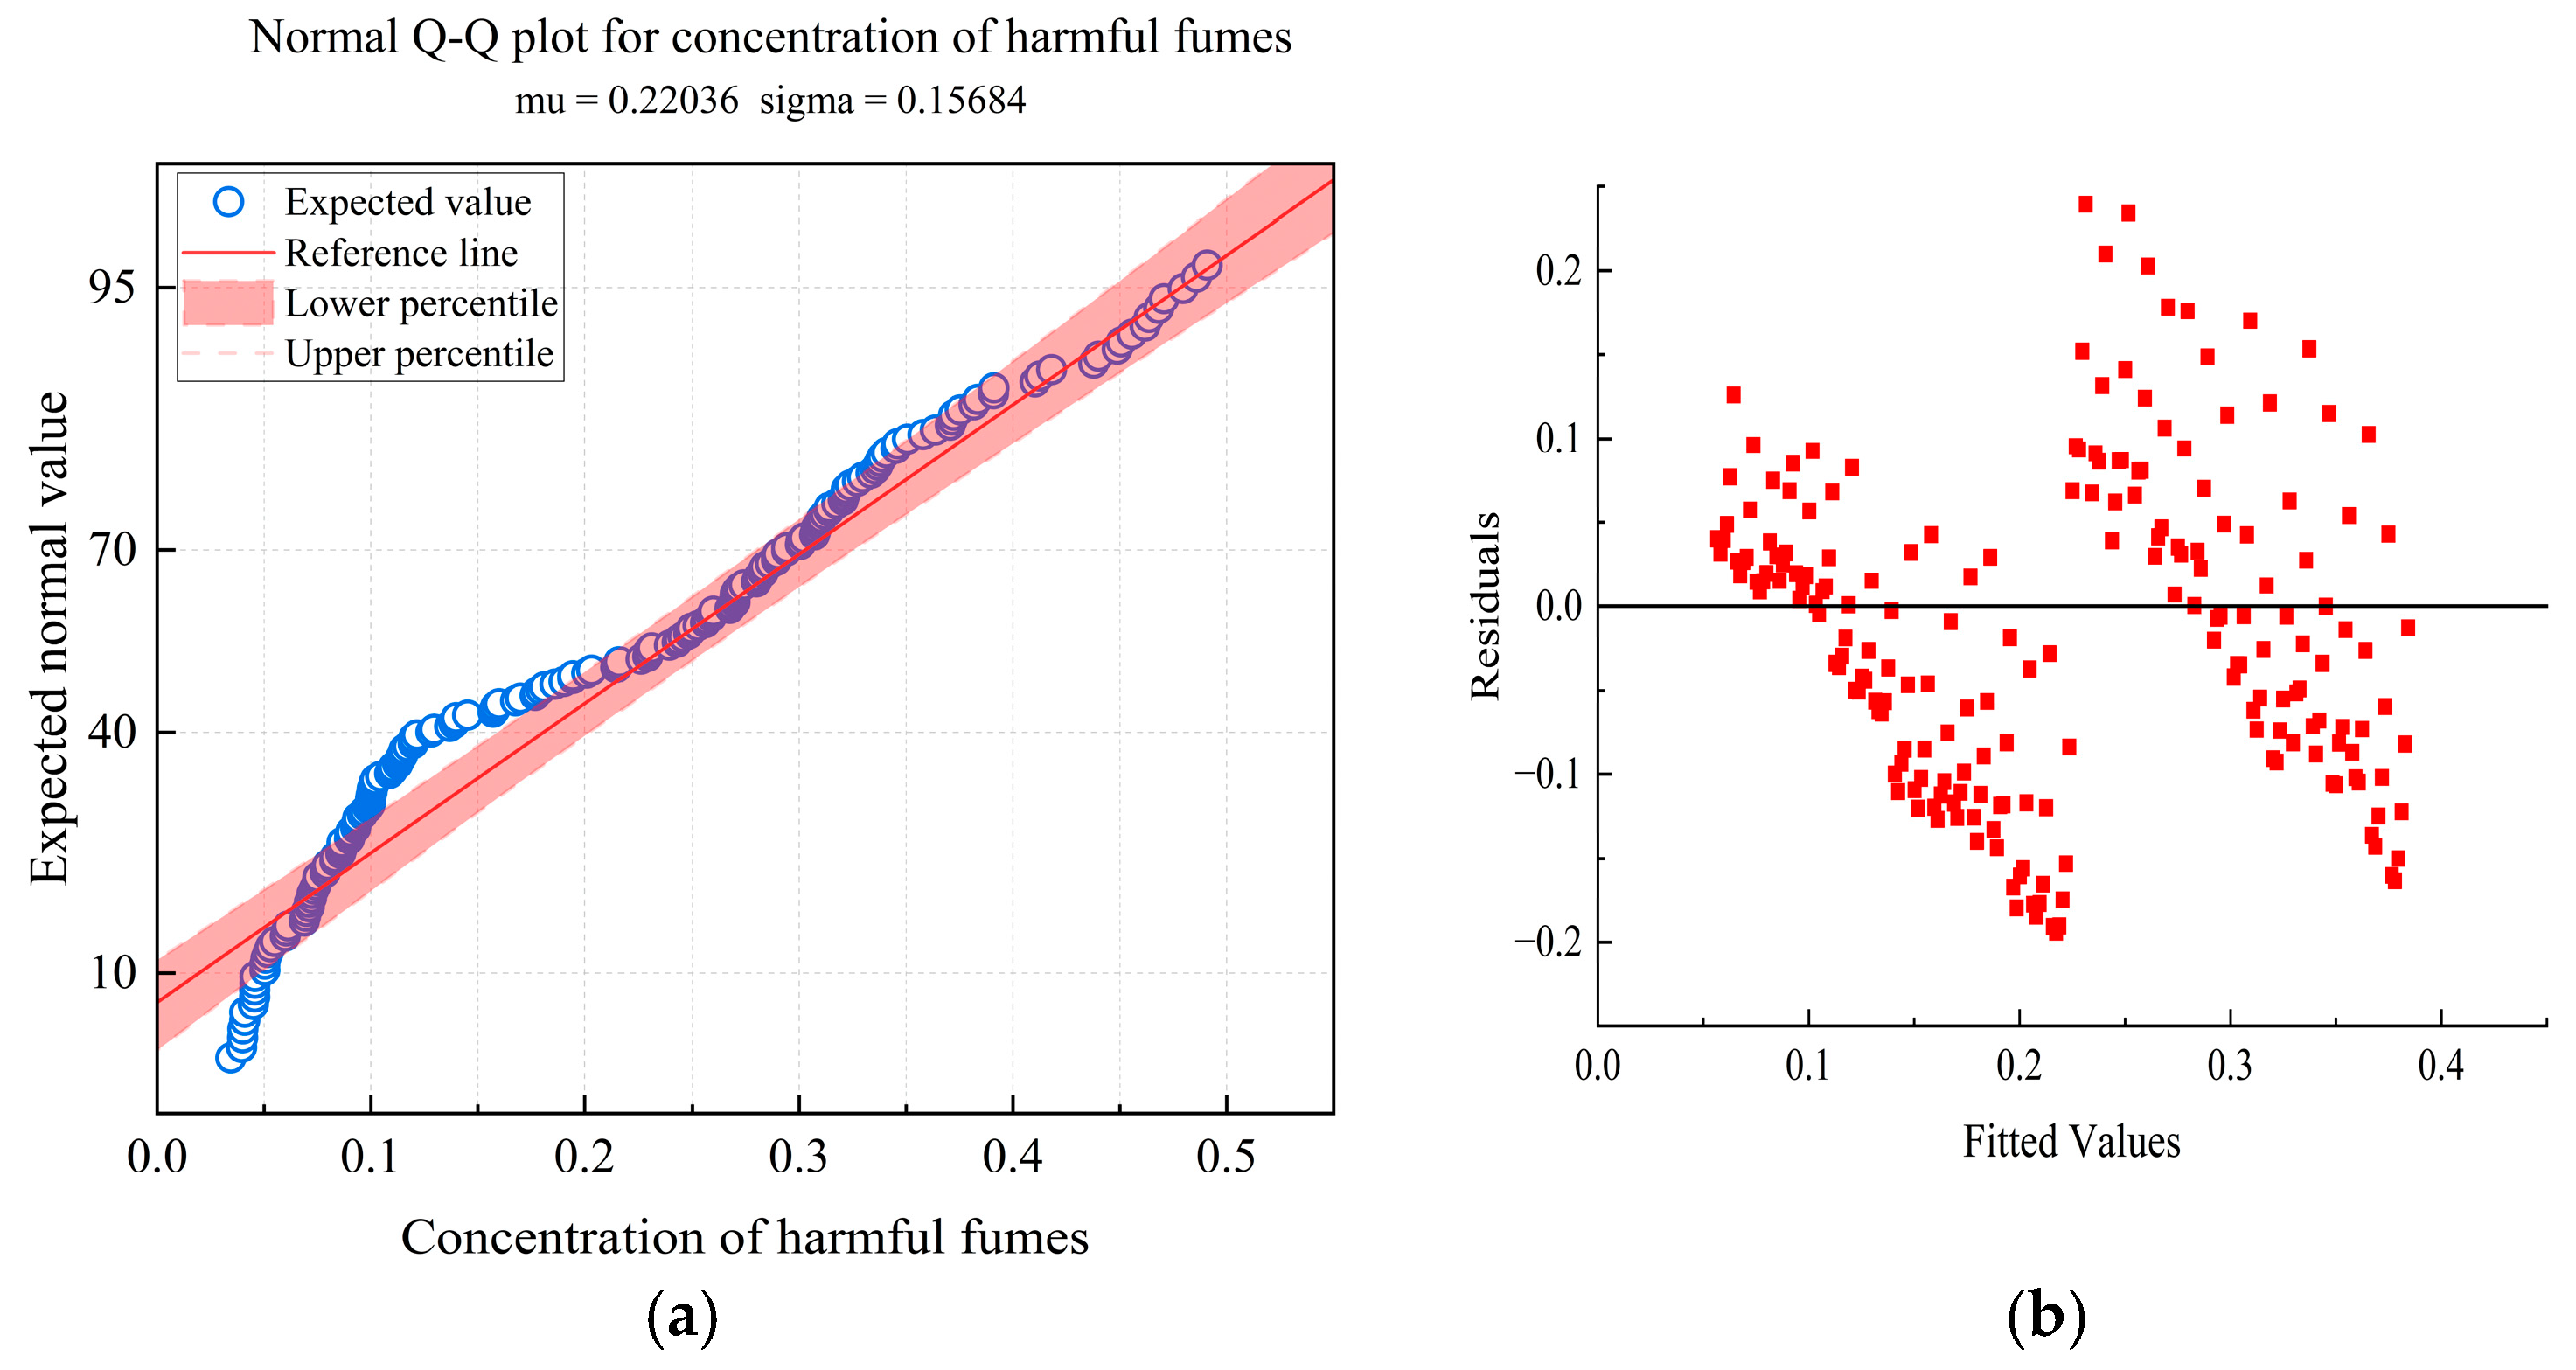
To ensure the reliability of the analysis of variance results, residual diagnostics were conducted. As shown in Figure 3, the standard Q-Q plot for the degree of blending reveals points distributed along the diagonal, indicating that the normality assumption is mainly satisfied. The residuals versus fitted values plot, where the points are randomly scattered around the zero line with no discernible pattern, supports the assumption of homoscedasticity. As experiments were conducted in random order, the independence assumption holds. In summary, the model assumptions are reasonably satisfied, rendering the aforementioned statistical inference reliable.
The models used to fit the emission curves of harmful fumes from the three different asphalt systems all demonstrated strong explanatory power regarding data variability and yielded excellent fitting results, thereby validating the models’ applicability. These high-precision models lay a reliable foundation for subsequent prediction and optimization.

3.2. Comprehensive Optimization Analysis Based on Satisfaction Functions

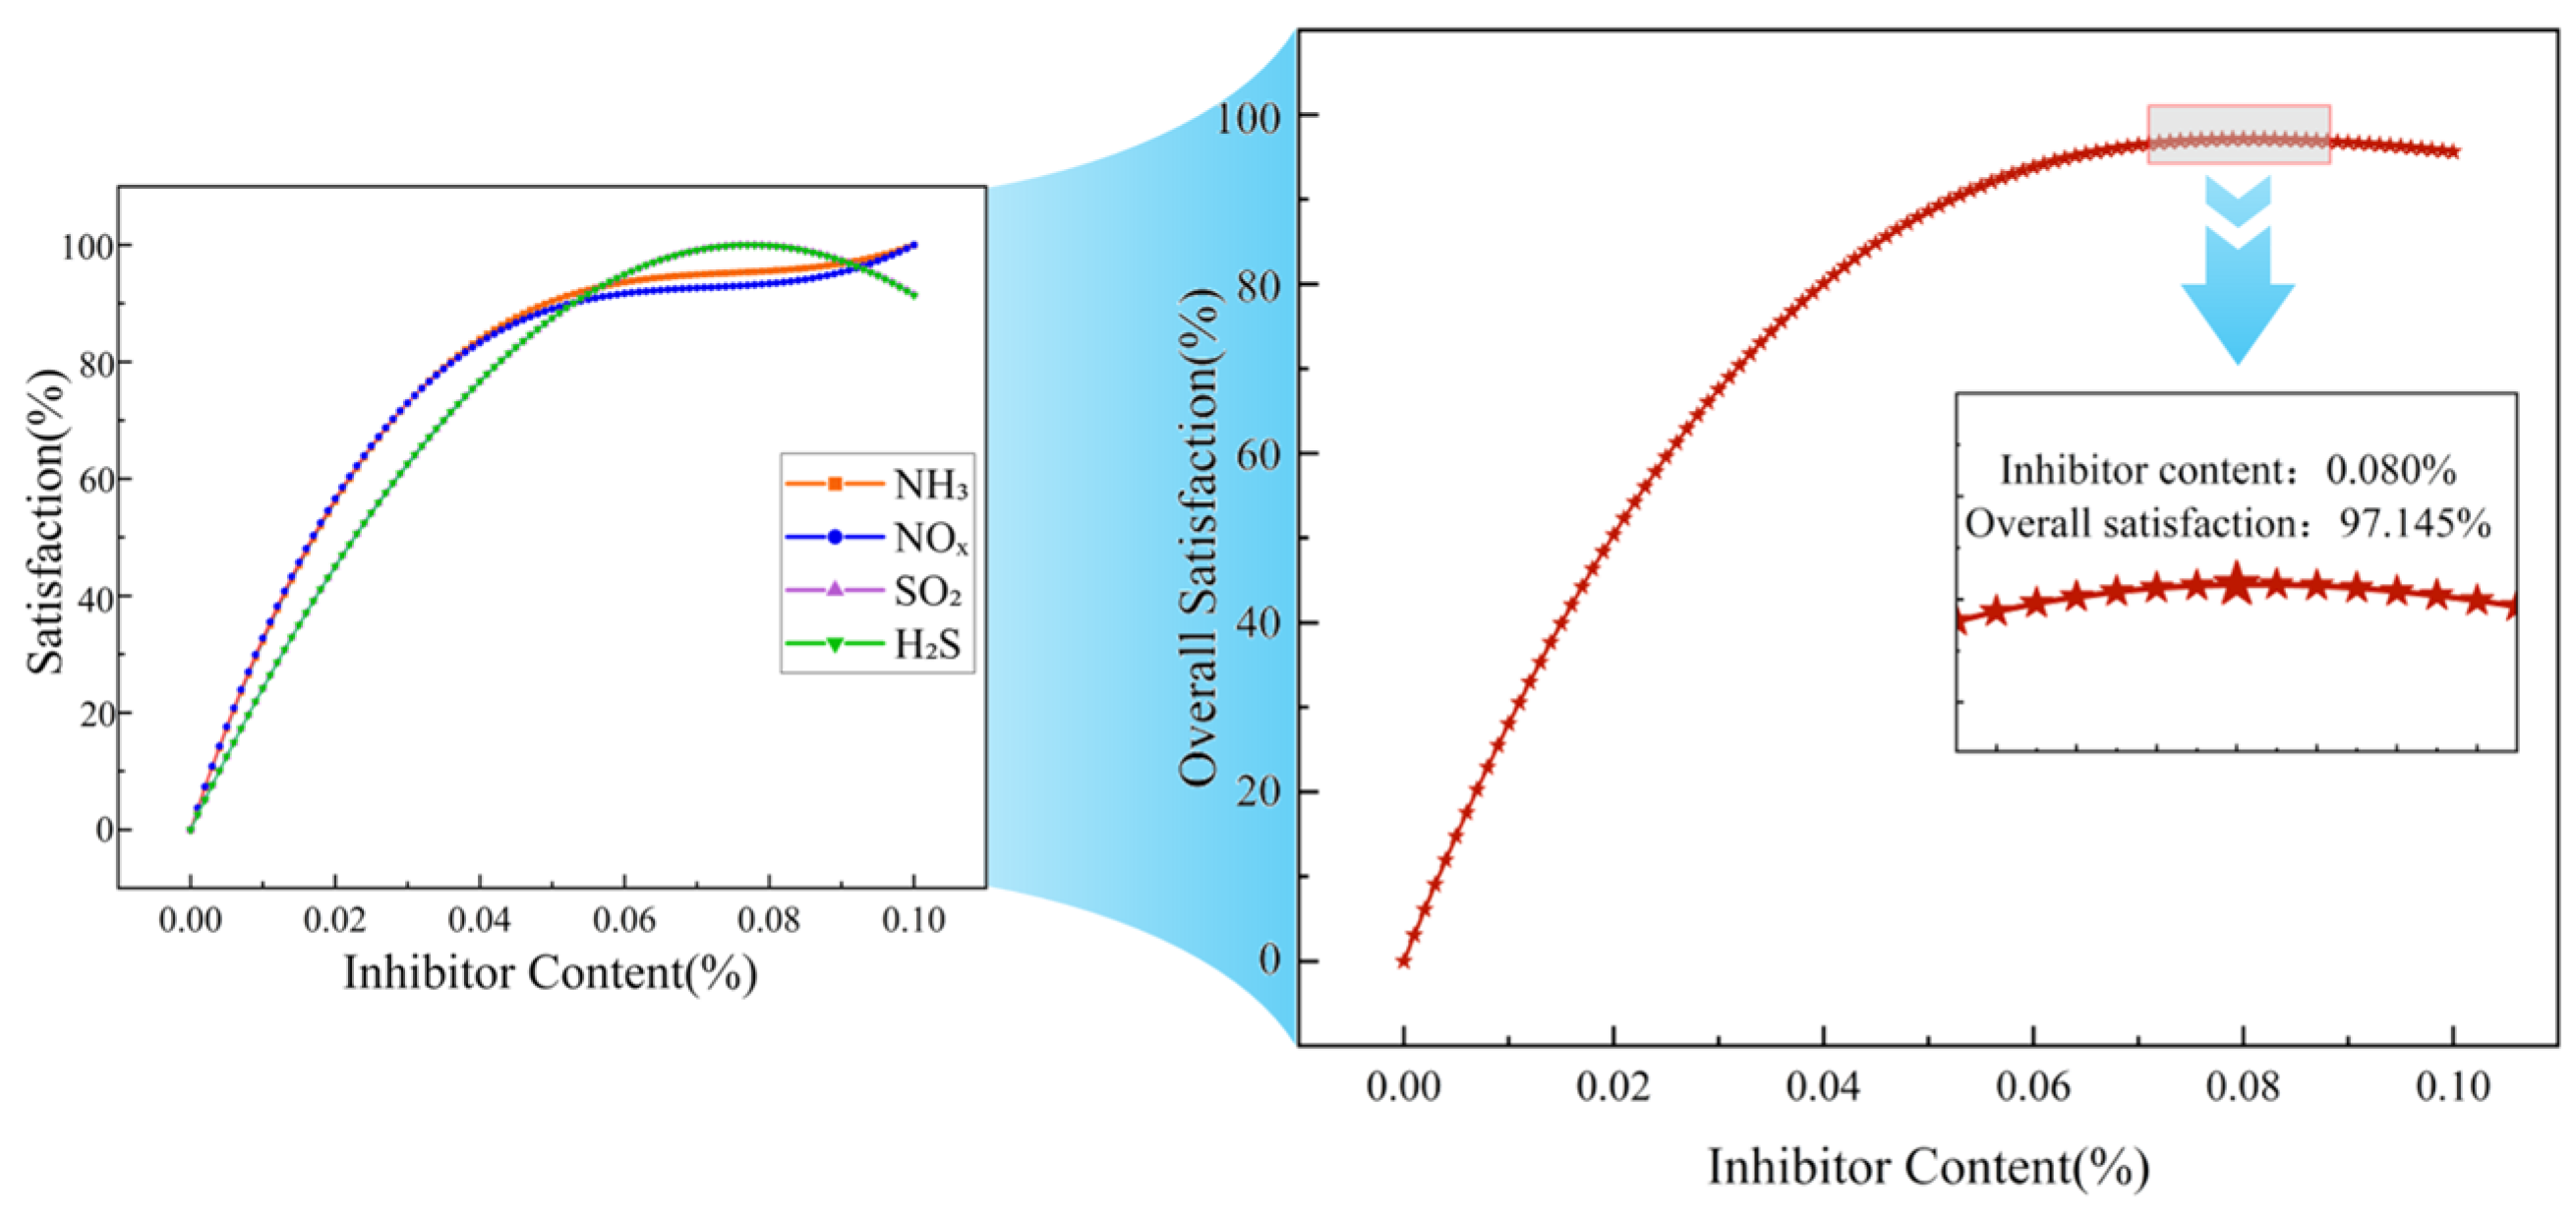
Using the model obtained from the fitted curve, the gas concentration values were predicted for each asphalt system with inhibitor content ranging from 0% to 0.10% (in increments of 0.001%). Subsequently, the individual satisfaction ( d i ) and overall satisfaction (D) corresponding to each dosage point were calculated based on Equations (3) and (4).
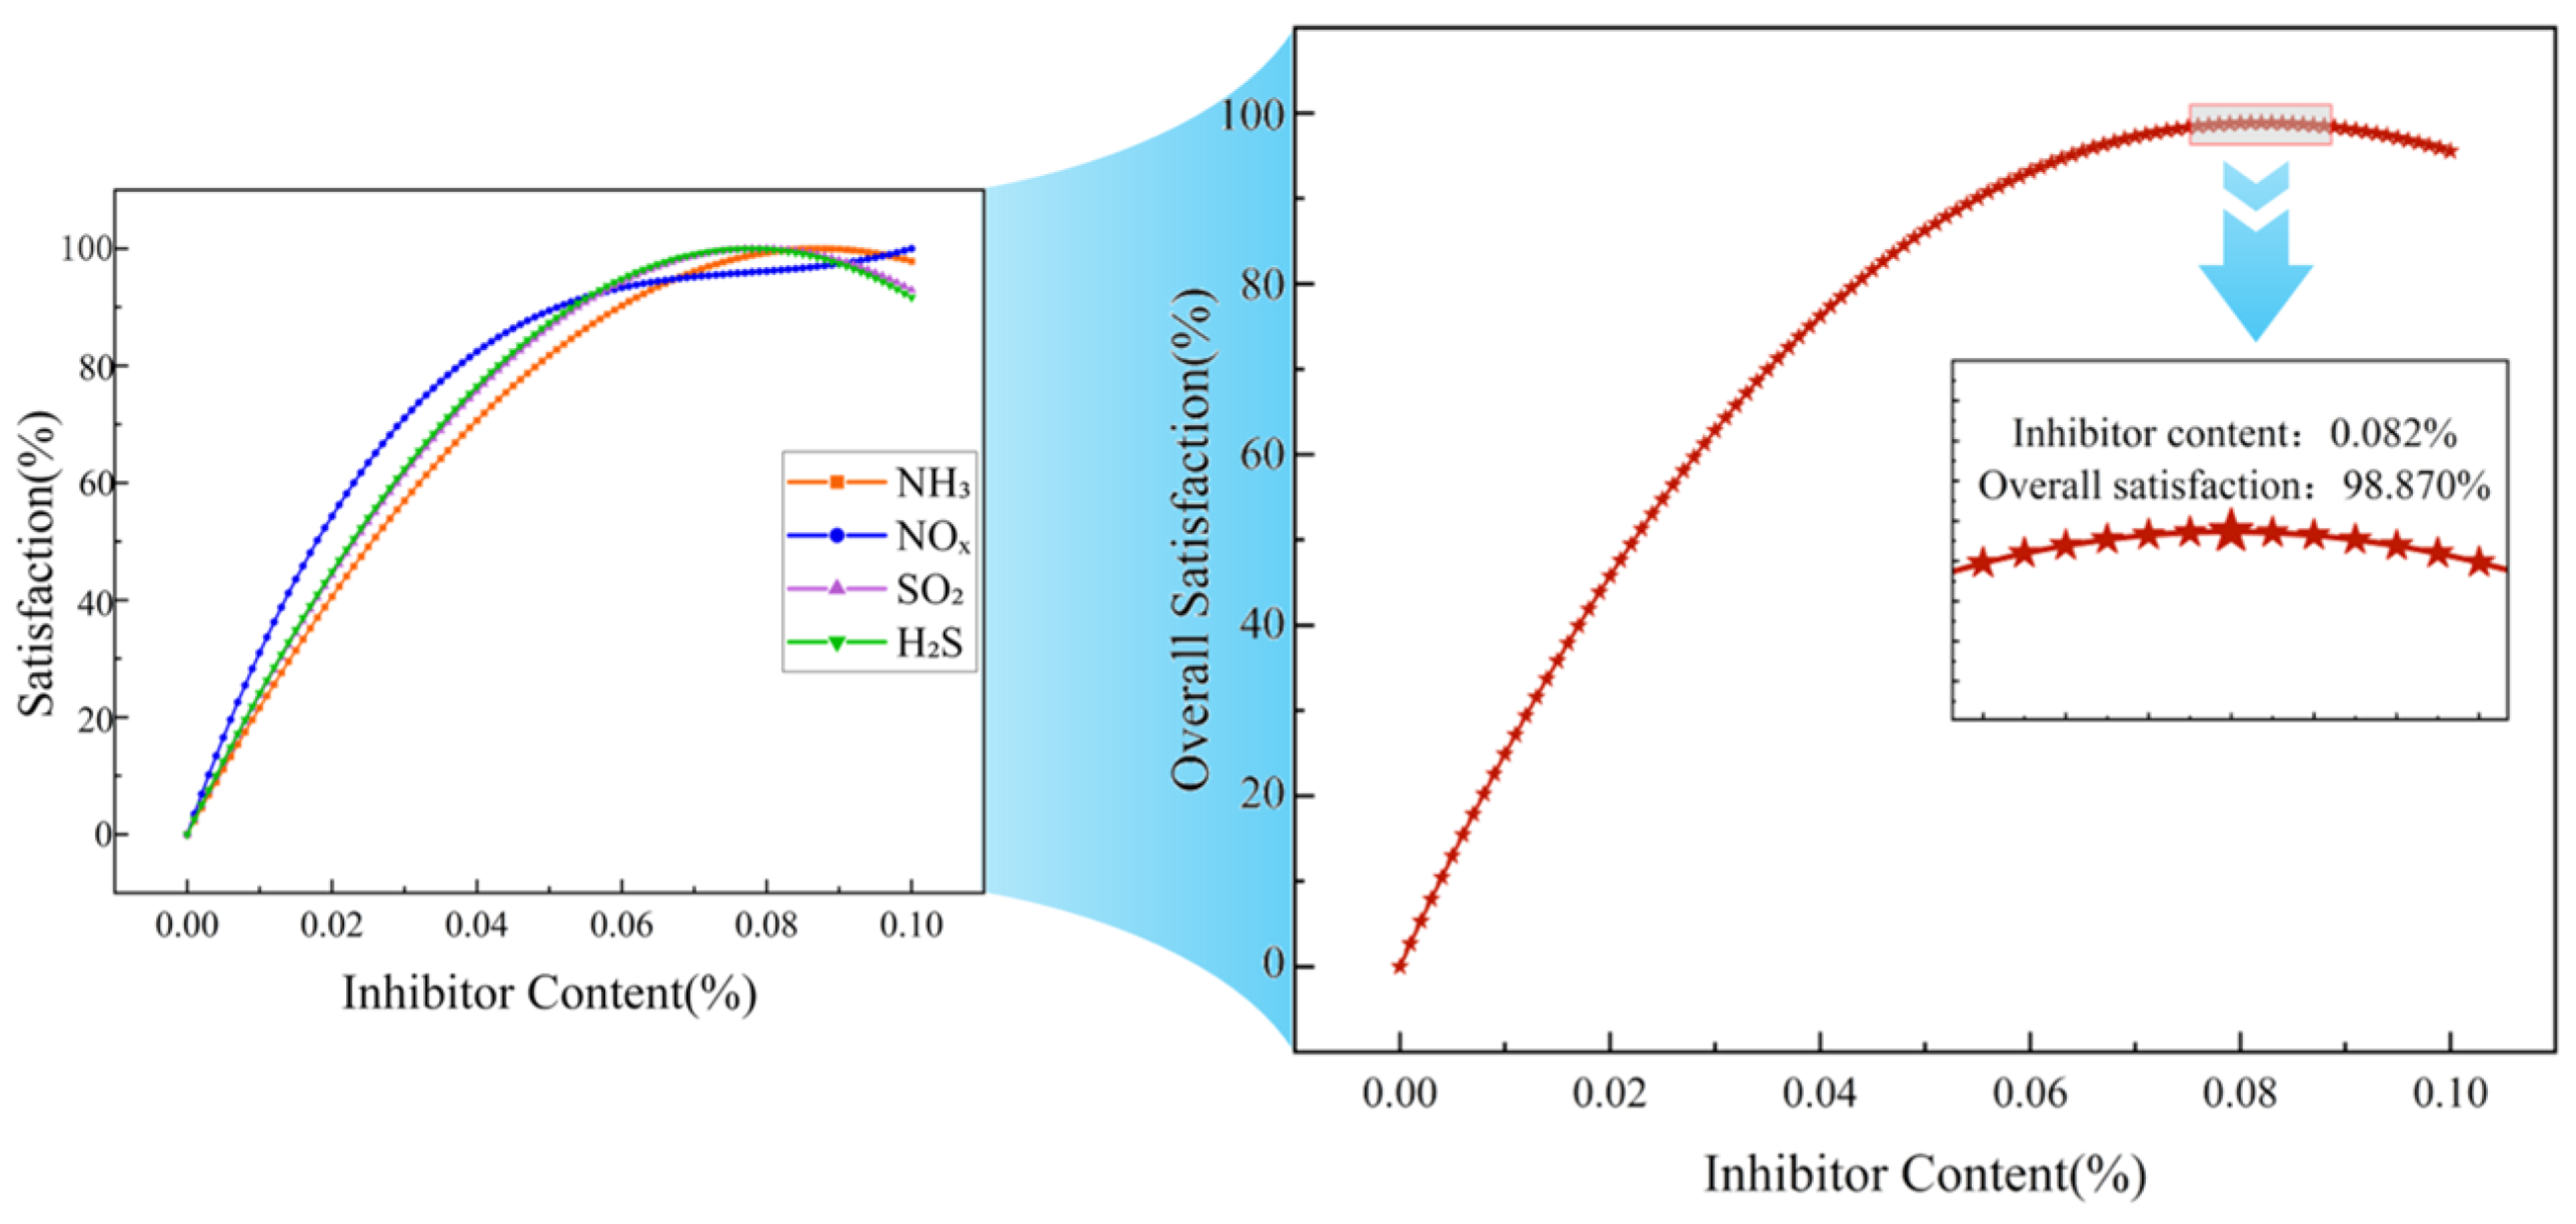
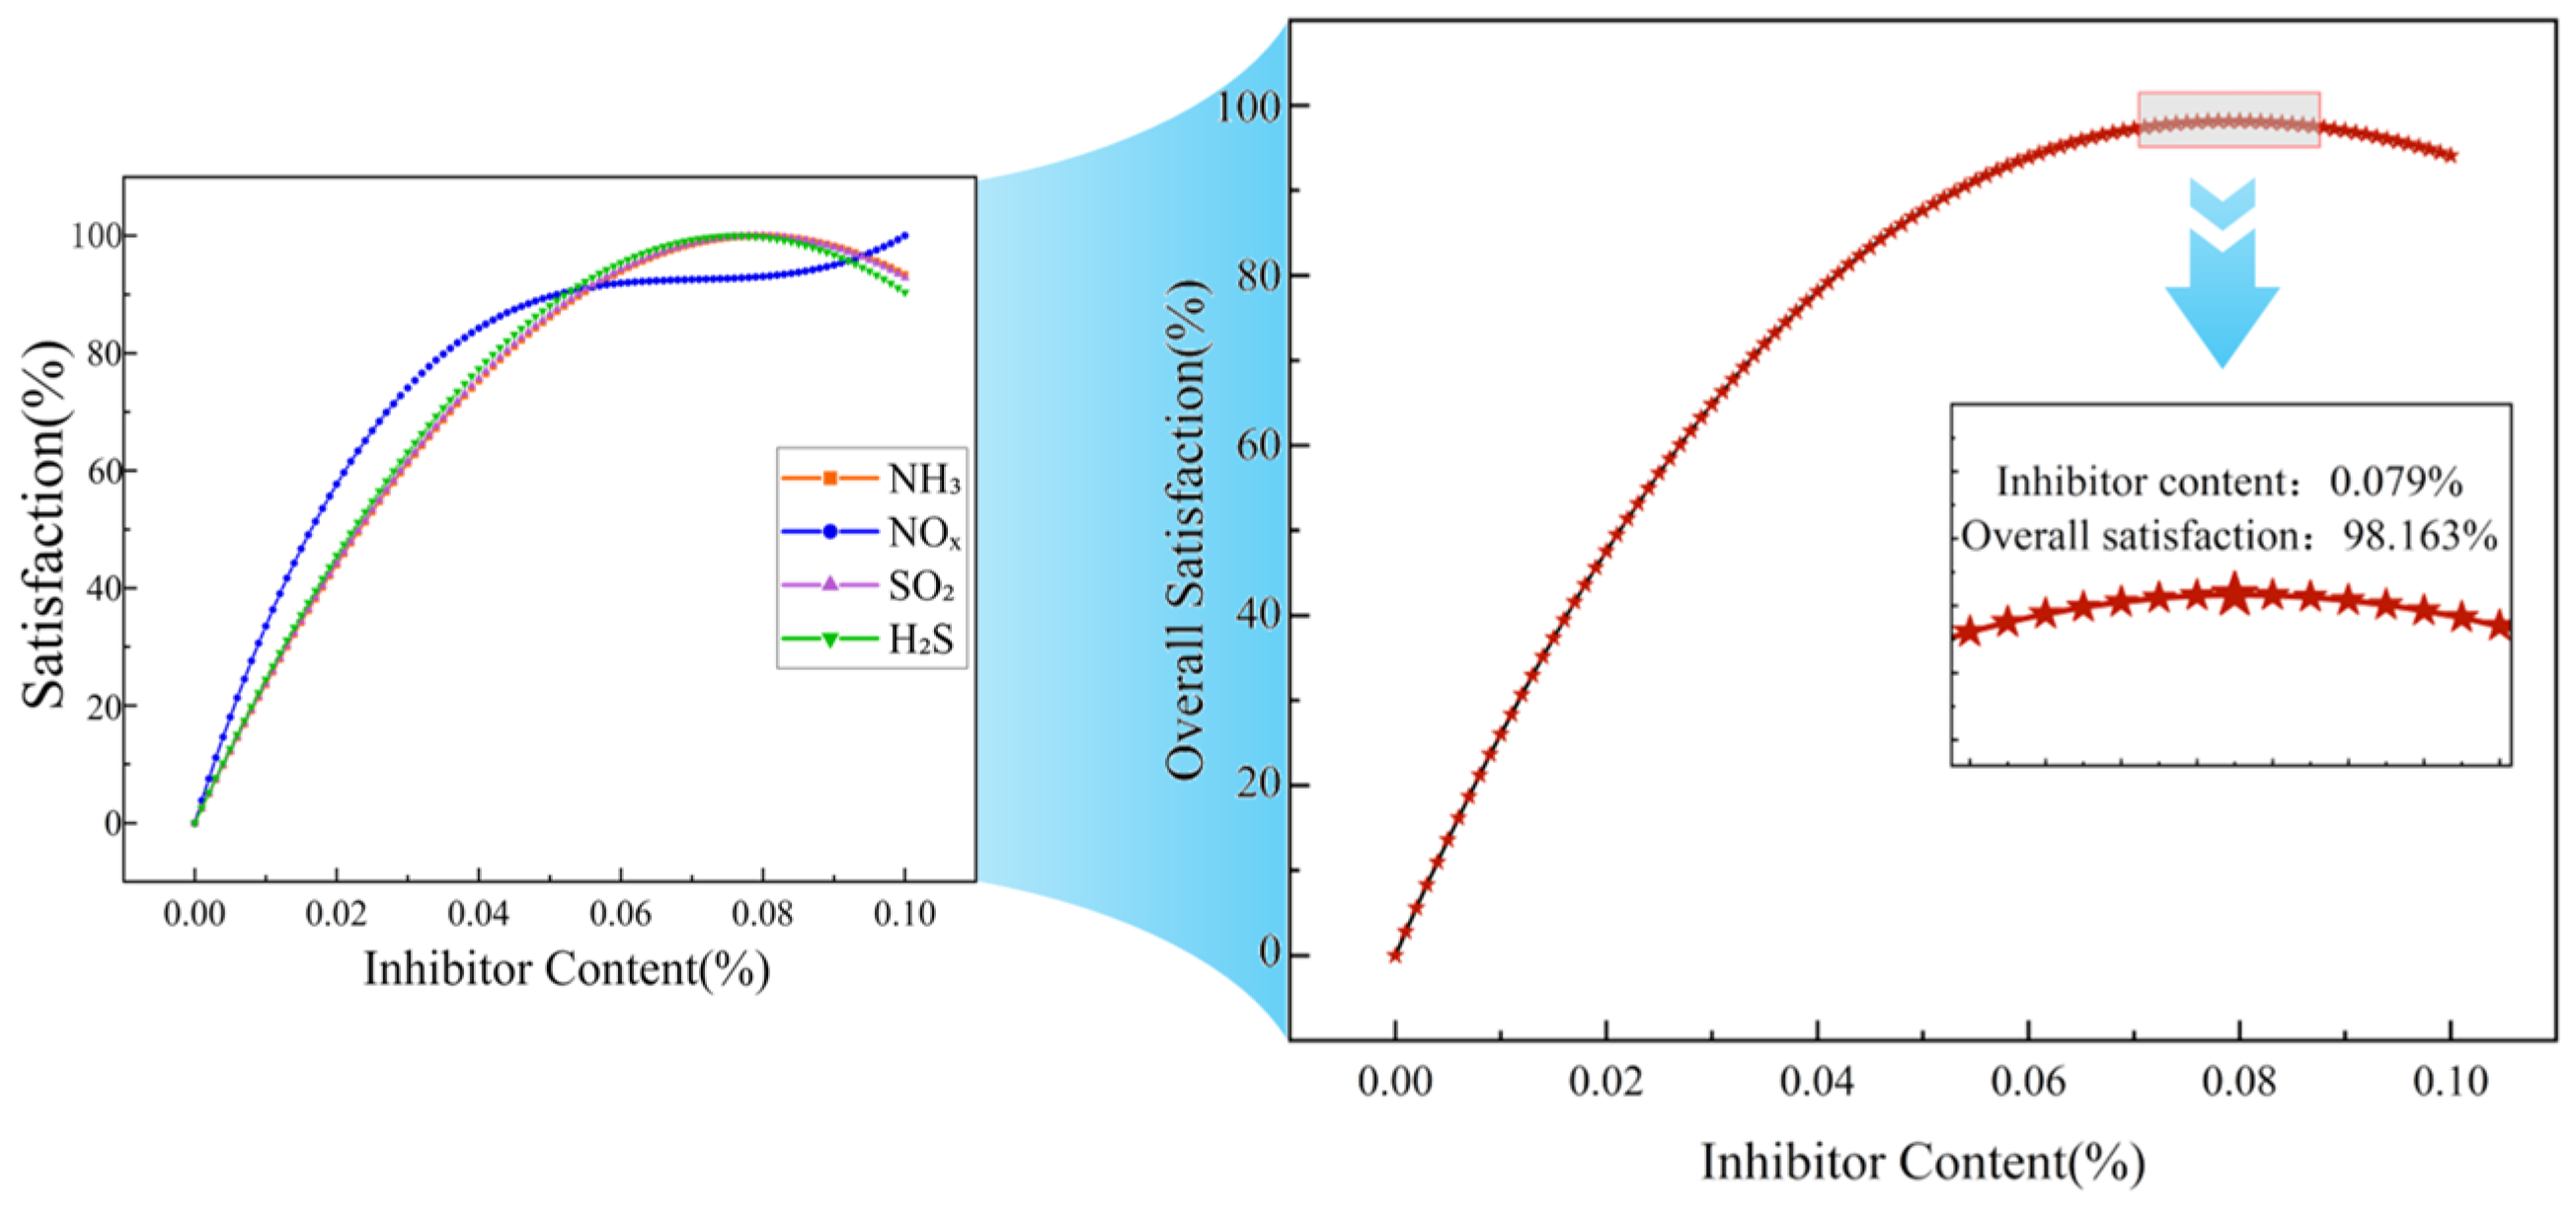
Figure 4, Figure 5 and Figure 6 show the satisfaction change curves for the 70# asphalt, SBS modified asphalt, and rubber modified asphalt systems, respectively.
A comparison of Figure 4, Figure 5 and Figure 6 shows that the trends in individual satisfaction levels for various gases across the three asphalt systems are generally consistent with changes in inhibitor dosage, differing only slightly in specific values.
Regarding NOx, the individual suppression efficiency increased most rapidly in the 70# asphalt and SBS modified asphalt systems, reaching 80% at inhibitor dosages of approximately 0.037% and 0.036%, respectively. Subsequently, the increase slowed, with both systems reaching maximum individual suppression efficiency at a dosage of 0.10%. In the rubber modified asphalt system, the rates of increase for NOx and NH3 were comparable, reaching 80% at an inhibitor dosage of 0.037% and peaking at 0.10%.
The individual satisfaction curves for H2S and SO2 were relatively similar across all systems. In the 70# asphalt system, both reached 80% at inhibitor dosages of 0.043% and 0.044%, respectively, and reached maximum individual satisfaction at 0.078% and 0.079%. In the SBS modified asphalt system, both reached 80% at inhibitor dosages of 0.043% and 0.044%, respectively, and reached maximum individual satisfaction at 0.076% and 0.079%. In the rubber modified asphalt system, both reached 80% at an inhibitor dosage of 0.043%, and simultaneously reached maximum individual satisfaction at 0.077%.
NH3 exhibited the slowest increase in individual satisfaction across all systems. In the 70# asphalt system, it reached 80% at an inhibitor dosage of 0.049% and achieved maximum individual satisfaction at 0.087%; in the SBS modified asphalt system, it reached 80% at an inhibitor dosage of 0.044% and peaked at 0.080%; in the rubber modified asphalt system, it reached 80% at an inhibitor dosage of 0.036% and peaked at 0.10%.
For the four harmful gases in the three asphalt systems, individual satisfaction levels all show an upward trend as the additive dosage increases. However, the rate of increase and the “inflection points” differ. A comparison of the satisfaction curves across the three asphalt systems reveals that different gases exhibit varying sensitivities to the inhibitor [37], and the effects of the inhibitor on different asphalt systems also differ [38].

3.3. Comparison of Optimal Blending Ratios for Three Types of Asphalt

Through optimization calculations, the optimal inhibitor content for maximizing the comprehensive satisfaction of three types of asphalt was determined. The results are summarized in Table 6.
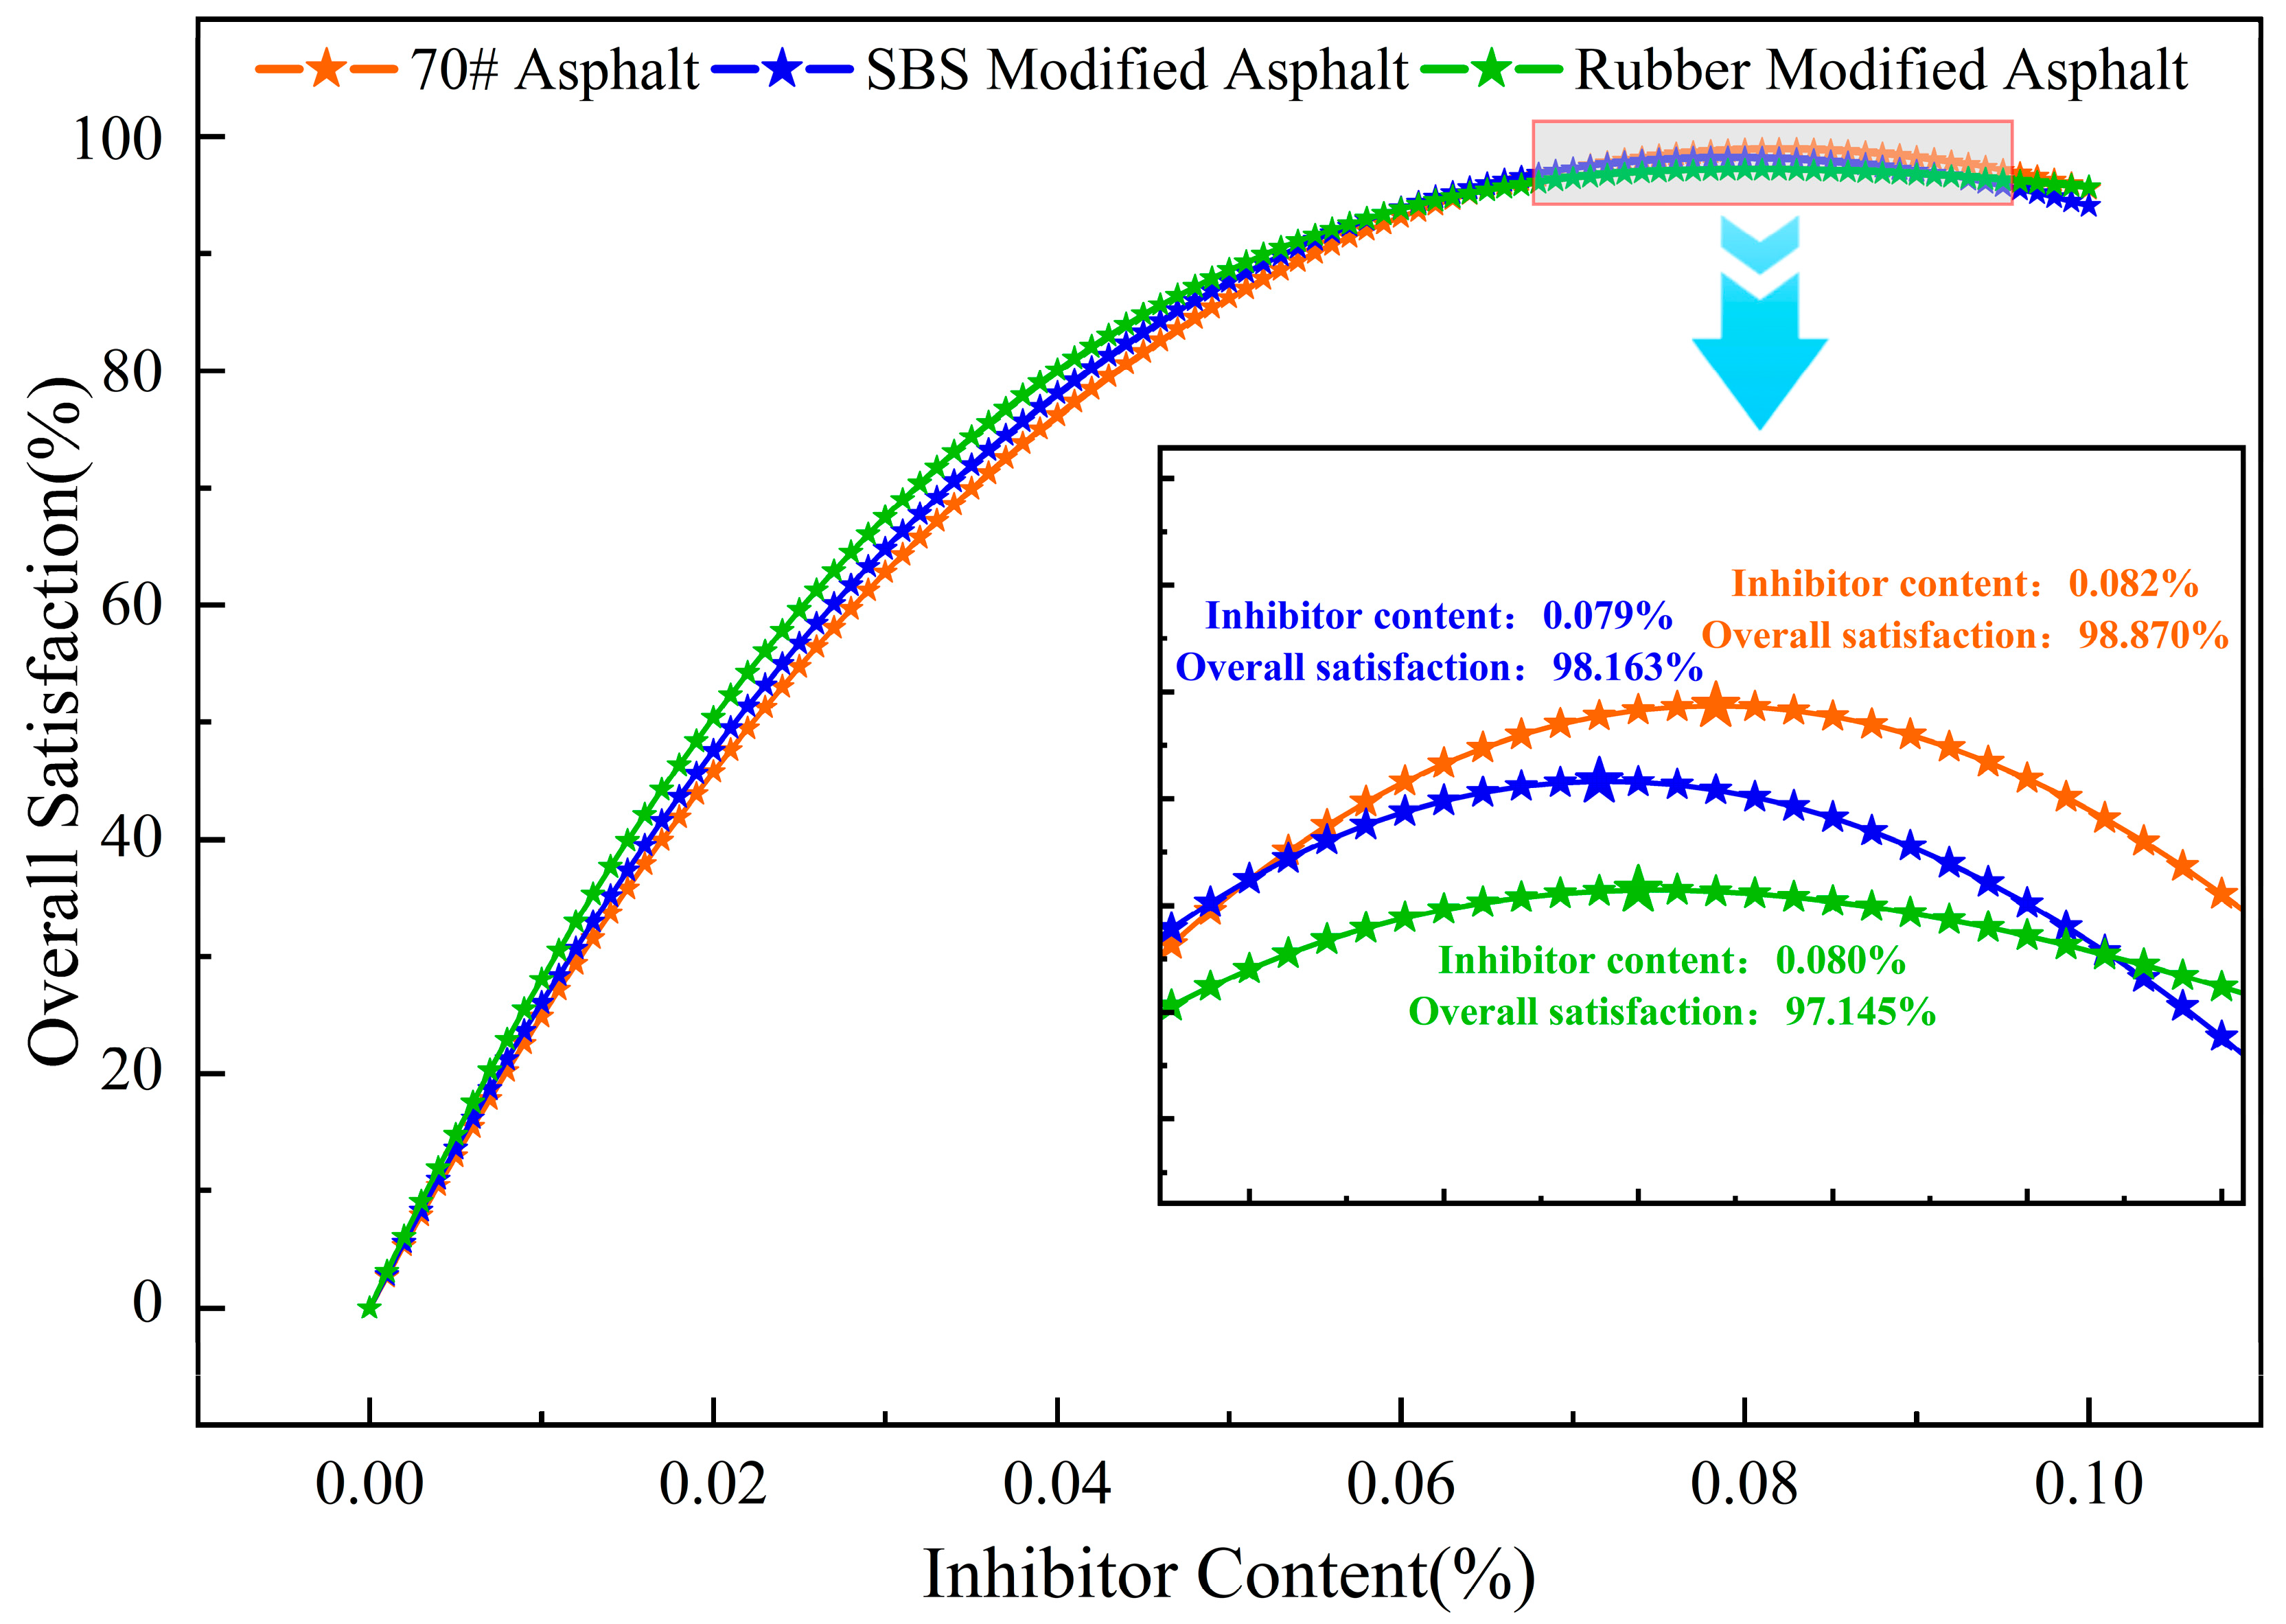
Figure 7 shows a comparison of the overall satisfaction curves for the three types of asphalt. It can be seen that, as the inhibitor dosage varies, all curves exhibit a single peak. The overall satisfaction of the 70# asphalt system reached its maximum value (DMax ≈ 98.870%) at an inhibitor dosage of 0.082%. The SBS modified asphalt system achieved maximum overall satisfaction at an inhibitor dosage of 0.079% (DMax ≈ 98.163%); the rubber modified asphalt system reached maximum overall satisfaction at an inhibitor dosage of 0.080% (DMax ≈ 97.145%). These three inhibitor dosages represent the theoretically optimal levels achieved after balancing the degradation effects of all four gases. At those dosages, it is not that the degradation of any single gas is optimized, but rather that all four gases achieve a high and relatively balanced level of degradation (with individual satisfaction scores all above 0.85), thereby achieving the best overall results.
The peak heights and positions of the overall satisfaction curves for the three asphalt systems differ, reflecting variations in the effectiveness of the inhibitor across different asphalt systems. Since 70# asphalt contains the highest proportion of light fractions, which are more prone to forming smoke during heating [39], the 70# asphalt system actually requires a higher dosage of the inhibitor. In contrast, SBS modified asphalt forms a stable three-dimensional network structure within the asphalt matrix [40]. This structure enhances the viscoelasticity of the asphalt while effectively reducing the migration and volatilization of light fractions. Consequently, the inhibitor in this system can act more precisely on free polar molecules, achieving optimal results at the lowest dosage (0.079%). Although rubber modified asphalt has high viscosity, components such as carbon black in the rubber powder also adsorb harmful gases [41]. However, this adsorption may compete with the inhibitors [42], causing some of the active sites of the inhibitors to be physically masked. Consequently, its optimal dosage (0.080%) falls between those of SBS modified asphalt and 70# asphalt.
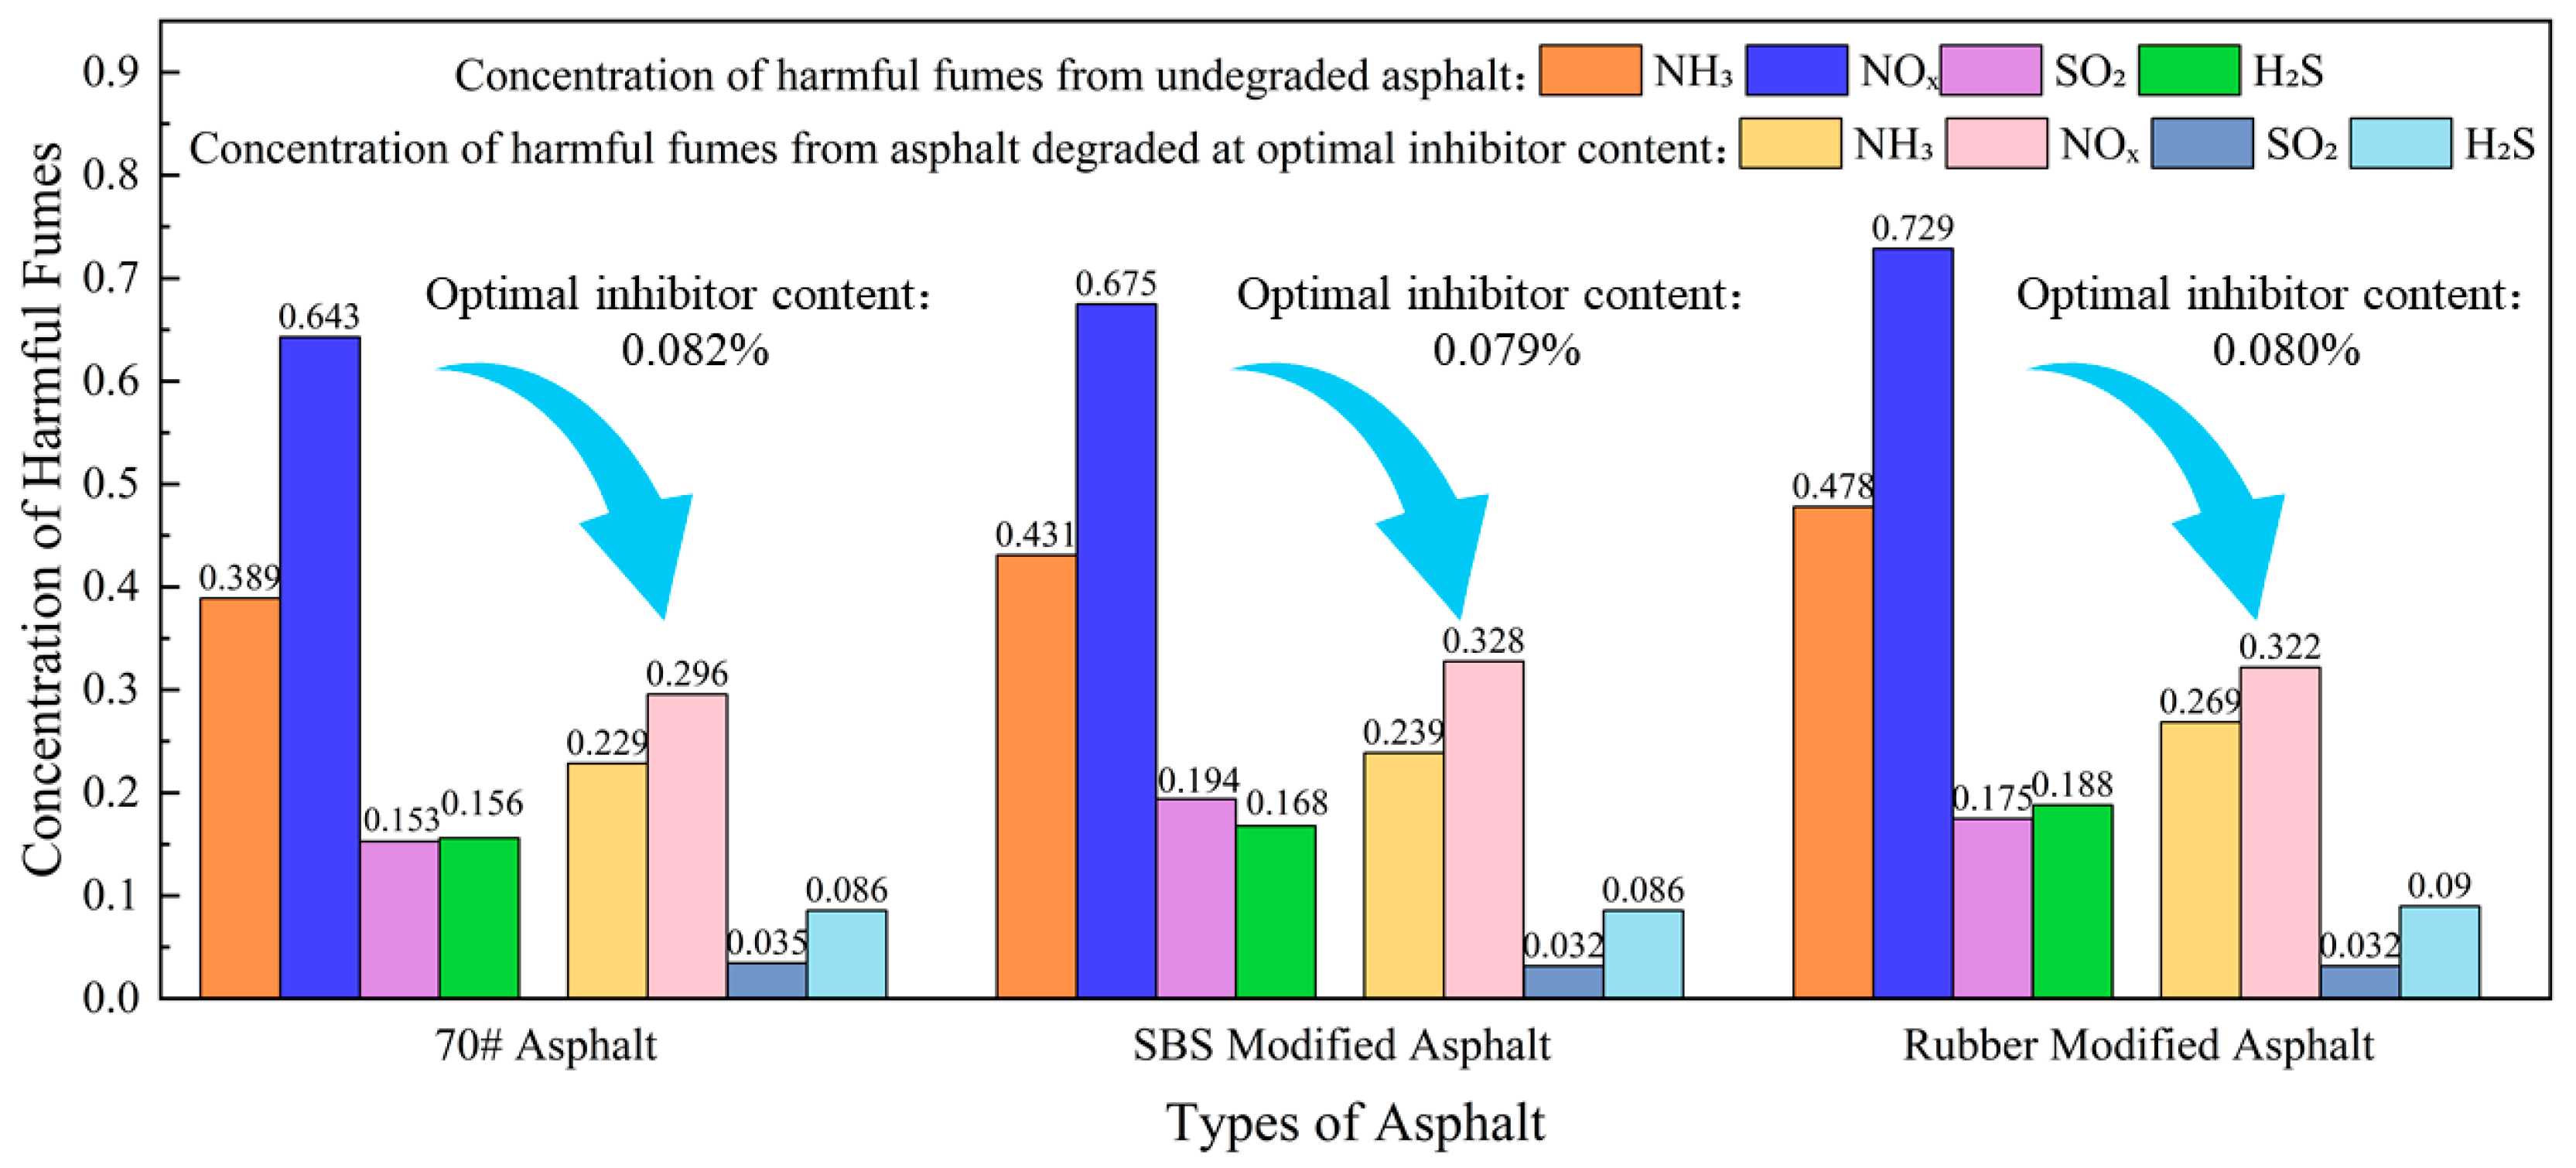
Using the model obtained from the fitted curve, the gas concentration values for the three asphalt systems were predicted at the optimal inhibitor dosage. The degradation rates of each gas at this optimal dosage were calculated for the three asphalt systems, and the results are summarized in Table 7.
Analysis of Figure 8 shows that this inhibitor significantly reduces the harmful gases produced by all three asphalt systems. However, when considering the optimal inhibitor dosage for all three asphalt systems, it was found that although the dosage for 70# asphalt was the highest, its final reduction in most gases was not significantly better than that of the other two asphalt systems. From the perspective of application economics and efficiency, SBS modified asphalt achieves optimal SO2 reduction at the lowest dosage. Rubber modified asphalt exhibits unique inhibitory advantages against H2S. For 70# asphalt, excessive dosage may not yield proportional efficiency gains. Overall, the inhibitor demonstrated higher removal efficiency for sulfur-containing compounds (SO2, H2S) than for nitrogen-containing compounds (NH3, NOx). This suggests the inhibitor’s mechanism of action may preferentially bind to sulfur-containing active sites within the asphalt or exhibit higher affinity for sulfur-based volatiles.

3.4. Analysis of the Influence of Optimal Asphalt Content on the Road Performance of Asphalt Mixtures

Table 8 lists the test results for the key in-service performance properties of the three asphalt mixtures at the optimized inhibitor dosage, along with the percentage change relative to the control group.
As shown in Table 8, at the optimal dosage, the addition of a composite volatile gas inhibitor ensures that all key performance indicators for all asphalt mixture types still meet the technical requirements of the Technical Specifications for Construction of Highway Asphalt Pavements (JTG F40-2004) [19]. Compared with the blank samples, the dynamic stability (DS) of 70# asphalt, SBS modified asphalt, and rubber modified asphalt incorporating the optimal inhibitor dosage decreased by 2.85%, 2.82%, and 2.46%, respectively. The freeze–thaw splitting resistance ratio ( T S R f ) increased by 0.78%, 0.88%, and 0.97%, respectively. At the same time, the maximum flexural strain ε B increased by 3.32%, 3.26%, and 3.12%, respectively. All performance indicator variation rates remained within ±5%, which is within the permissible error range of the test method. This indicates that while achieving efficient gas degradation, the inhibitor did not significantly adversely affect the high-temperature, low-temperature, or water stability properties of the asphalt mixture. This confirms the inhibitor’s excellent material compatibility and engineering applicability [43].

4. Conclusions

(1)
An optimization method combining nonlinear regression with a multi-response satisfaction function was proposed, marking a methodological leap from empirical judgment to scientific quantification and multi-objective coordinated optimization of the dosage of asphalt volatile gas inhibitors.
(2)
For three typical asphalt systems, high-precision prediction models (p < 0.01, R2 > 0.95) were established linking harmful smoke concentrations to suppressant dosage. The optimized dosages are: 0.082% for 70# asphalt, 0.079% for SBS modified asphalt, and 0.080% for rubber modified asphalt. At these dosages, gas degradation achieves a high and balanced overall optimum.
(3)
Road performance tests demonstrated that at the optimized dosage, the inhibitor had no significant adverse effects on the high-temperature, low-temperature, or water stability of the asphalt mixture, confirming the integration of its environmental benefits with engineering applicability.

Author Contributions

Conceptualization, X.R. and M.X.; methodology, Z.L. and M.X.; software, Z.L., M.L. and Z.Z.; validation, Z.L., X.R., M.X. and C.R.; formal analysis, W.D., Q.L. and W.L.; investigation, W.D., Q.L. and C.R.; resources, M.X. and D.G.; data curation, X.R.; writing—original draft preparation, Z.L. and M.X.; writing—review and editing, X.R. and M.X.; visualization, M.L. and Z.Z.; supervision, X.R. and M.X.; project administration, W.L. and D.G.; funding acquisition, M.X. and D.G. All authors have read and agreed to the published version of the manuscript.

Funding

This research received no external funding.

Institutional Review Board Statement

Not applicable.

Informed Consent Statement

Not applicable.

Data Availability Statement

The original contributions presented in this study are included in the article. Further inquiries can be directed to the corresponding authors.

Conflicts of Interest

Authors Wenyao Du was employed by Jining Jizou Expressway Co., Ltd.; Qinghang Li was employed by Shandong Pengcheng Road and Bridge Group Co., Ltd.; and Wei Lu was employed by Jinan Urban Construction Group. The remaining authors declare that the research was conducted in the absence of any commercial or financial relationships that could be construed as a potential conflict of interest.

References

  1. Liu, Y.Y.; Zhou, S.; Yang, Q.L.; Yu, C.B.; Wang, R.; Li, Z. Investigation on the release characteristics and release mechanisms of asphalt fumes. Constr. Build. Mater. 2025, 500, 144087. [Google Scholar] [CrossRef]
  2. Yu, Y.X.; Qi, C.; Kuang, D.L.; Han, S.J.; Chen, H.X.; Wu, Y.C.; Wang, F.; Zhang, H.G.; Zhang, Y.P. Research progress on the release characteristics and inhibition technologies of asphalt volatile organic compounds. Appl. Chem. Ind. 2025, 54, 452–456+461. [Google Scholar] [CrossRef]
  3. Liu, Y.Y.; Zhou, S.; He, Z.Q.; Lv, Y. Research progress on test methods and inhibition strategies of asphalt fumes. Chem. Ind. Eng. Prog. 2025, 44, 1632–1650. [Google Scholar] [CrossRef]
  4. Niu, Y.H.; Zhao, W.H.; Li, X.; He, Z.W.; Ma, X.; Geng, J.G.; Shao, J.G. Inhibition effect of composite deodorants on the sulfidation gases from crumb rubber modified asphalt. Constr. Build. Mater. 2025, 469, 140461. [Google Scholar] [CrossRef]
  5. Xiao, X.; Liu, T.; Zhao, P.; Luo, G.Z.; Deng, Y. Effect of odour-less additive on asphalt flue gas emission and performance of asphalt and asphalt mixture. Case Stud. Constr. Mater. 2024, 20, e03006. [Google Scholar] [CrossRef]
  6. Ning, W.D.; Sun, G.Q.; Qiu, K.X.; Jiang, X.L.; Wang, C.Z.; Zhao, R.Q. Evaluation of Fume Suppression, Viscosity-Retarding, and Rheological Properties of Eco-Friendly High-Viscosity Modified Asphalt. Coatings 2023, 13, 1497. [Google Scholar] [CrossRef]
  7. Feng, H.; Zhao, H.S.; Zhang, D.F.; Zhang, P.Y.; Ding, Y.D.; Liu, Y.P.; Su, C.H.; Han, Q.J.; Li, Y.R. Study on the Volatile Organic Compound Emission Characteristics of Crumb Rubber-Modified Asphalt. Coatings 2025, 15, 1043. [Google Scholar] [CrossRef]
  8. Xie, J.; Ding, Z.Y.; Luo, H.C.; Lu, Z.Z.; Li, S.H.; Zhao, X.C.; Huang, B.; Lin, J.M. Effectiveness of composite fume suppression and deodorizing agents in improving performance and reducing emissions of rubber modified asphalt. J. Clean. Prod. 2024, 485, 144397. [Google Scholar] [CrossRef]
  9. Wang, T.; Bu, W.Y.; Cheng, Z.Q.; Ma, R.; Xie, S.J.; Deng, Z.X.; Zhu, Y.F.; Zhou, Y. Analysis of the Odor Purification Mechanism and Smoke Release of Warm-Mixed Rubber Asphalt. Appl. Sci. 2024, 14, 5640. [Google Scholar] [CrossRef]
  10. Yang, G.; Xu, Y.L.; Jiao, X.L.; Li, Y.M. Study on the releasing regularity of asphalt fume and its suppression technology. PLoS ONE 2025, 20, e0329225. [Google Scholar] [CrossRef]
  11. Chen, K.; Yang, F.Y. Research on Viscosity-temperature Characteristics and Flue Gas Emission of Desulfurization Rubber Powder/SBS Composite Modified Asphalt. Highway 2024, 69, 372–376. Available online: https://link.cnki.net/urlid/11.1668.U.20240510.1453.114 (accessed on 28 April 2026).
  12. Lasne, J.; Lostier, A.; Salameh, T.; Athanasopoulou, E.; Karagiannis, D.; Kakouri, A.; Vassaux, S.; Lesueur, D.; Romanias, M.N. NOx emissions by real-world fresh and old asphalt mixtures: Impact of temperature, relative humidity, and UV-irradiation. Urban Clim. 2023, 49, 101457. [Google Scholar] [CrossRef]
  13. Lou, K.K.; Wang, S.T.; Xiao, P.; Zhang, X. Research on the Optimization of Composite Modified Asphalt Using Response Surface Methodology and its Fume Suppression Mechanism. J. Henan Univ. Sci. Technol. (Nat. Sci.) 2025, 46, 17–25+118. [Google Scholar] [CrossRef]
  14. Li, J.Q.; He, Z.Y.; Yu, L.; He, L.; Shen, Z.Z. Multi-Objective Optimization and Performance Characterization of Asphalt Modified by Nanocomposite Flame-Retardant Based on Response Surface Methodology. Materials 2021, 14, 4367. [Google Scholar] [CrossRef] [PubMed]
  15. Yu, L.J.; Wei, M.; Zheng, Y. Study on Optimal Ratio of New Composite Grouting Materials by Response Surface-Satisfaction Function Method. J. Munic. Technol. 2025, 43, 231–242. [Google Scholar] [CrossRef]
  16. Wang, H.C.; Jin, J.; Liu, S.; Gao, Y.C.; Li, R.; Feng, M.Z.; Xiong, J.P.; Liu, P.F. Research progress and prospect of environment-friendly green road. J. Cent. South Univ. (Sci. Technol.) 2021, 52, 2137–2169. [Google Scholar] [CrossRef]
  17. Rikmann, E.; Mäeorg, U.; Vaino, N.; Pallav, V.; Järvik, O.; Liiv, J. Recycling Bitumen for Composite Material Production: Potential Applications in the Construction Sector. Appl. Sci. 2025, 15, 1313. [Google Scholar] [CrossRef]
  18. JTG 3410-2025; Standard Test Methods of Asphalt and Asphalt Mixture for Highway Engineering. Ministry of Transport of the People’s Republic of China: Beijing, China, 2025.
  19. JTG F40-2004; Technical Specifications for Construction of Highway Asphalt Pavements. Ministry of Transport of the People’s Republic of China: Beijing, China, 2004.
  20. ASTM D5/D5M-20; Standard Test Method for Penetration of Bituminous Materials. American Society for Testing Materials: West Conshohocken, PA, USA, 2020.
  21. ASTM D36/D36M-14; Standard Test Method for Softening Point of Bitumen (Ring-and-Ball Apparatus). American Society for Testing Materials: West Conshohocken, PA, USA, 2020.
  22. ASTM D6373-23; Standard Specification for Performance-Graded Asphalt Binder. American Society for Testing Materials: West Conshohocken, PA, USA, 2023; 22.
  23. CJJ/T 273-2019; Technical Standard for Rubberized Asphalt Pavement. Ministry of Housing and Urban-Rural Development of the People’s Republic of China: Beijing, China, 2019.
  24. Wang, Y.L.; Yi, H.Y.; Cui, Y.; Li, S.J.; Zhou, S.X.; Yan, C.Q. Research on the Preparation Process of SBS-Modified Asphalt Using Early Shearing Instead of High-Speed Shearing of Modifier. Appl. Sci. 2023, 13, 10335. [Google Scholar] [CrossRef]
  25. Nian, T.F.; Li, J.G.; Li, P.; Li, S.W.; Chen, X.L. An Analysis on Fume Enrichment Method and Release Rule for Asphalt Mixture. J. Highw. Transp. Res. Dev. 2024, 41, 11–21. [Google Scholar] [CrossRef]
  26. Guo, M.; Xu, W.C. Study on Functional Validation of Asphalt Fumes and Odor Inhibitors. J. Munic. Technol. 2024, 42, 244–249+255. [Google Scholar] [CrossRef]
  27. HJ 533-2009; Ambient Air and Exhaust Gas-Determination of Ammonia-Nessler’s Reagent Spectrophotometry. Ministry of Ecology and Environment of the People’s Republic of China: Beijing, China, 2009.
  28. HJ 479-2009; Ambient Air-Determination of Nitrogen Oxides-N-(1-Naphthyl) Ethylenediamine Dihydrochloride Spectrophotometric Method. Ministry of Ecology and Environment of the People’s Republic of China: Beijing, China, 2009.
  29. HJ 482-2009; Ambient Air-Determination of Sulfur Dioxide-Formaldehyde Absorption-Pararosaniline Spectrophotometry. Ministry of Ecology and Environment of the People’s Republic of China: Beijing, China, 2009.
  30. Zhu, H.Z.; Su, C.L.; Tang, N.P.; Wei, J.Y.; Sun, H.J. Sampling and quantitative analysis method of emissions from crumb rubber modified asphalt. J. Jilin Univ. (Eng. Technol. Ed.) 2024, 54, 2922–2929. [Google Scholar] [CrossRef]
  31. Wang, C.H.; Zhang, M.; Li, X.G.; Chen, Q.; Liu, S.T. Efficacy evaluation of modified asphalt mixture with high-efficiency smoke suppression and air purification capabilities. Acta Mater. Compos. Sin. 2025, 43, 1–13. [Google Scholar] [CrossRef]
  32. Xu, Y.L.; Fan, H.L.; Yang, J.; Yin, P. Enhancement of Rheological Performance and Smoke Suppression in Sepiolite-Modified Asphalt. Materials 2025, 18, 5627. [Google Scholar] [CrossRef]
  33. Song, S.Y.; Li, S.S.; Wang, M.H.; Shi, P.C.; Guo, F.C.; Zhang, Z.Y. The Road Performance, VOCs Emission Behavior, and Emission Mechanism of Rubber Powder/SBS-Modified Asphalt. Materials 2025, 18, 5260. [Google Scholar] [CrossRef]
  34. Guo, Q.M.; Liu, Y.B.; Liu, S.J. Flame Retardancy and Smoke Suppression of Warm-Mix Asphalt Binder Containing Various Flame Retardants. Coatings 2025, 16, 15. [Google Scholar] [CrossRef]
  35. Wan, Y.P.; Jia, J. Nonlinear dynamics of asphalt–screed interaction during compaction: Application to improving paving density. Constr. Build. Mater. 2019, 202, 363–373. [Google Scholar] [CrossRef]
  36. Derringer, G.; Suich, R. Simultaneous Optimization of Several Response Variables. J. Qual. Technol. 1980, 12, 214–219. [Google Scholar] [CrossRef]
  37. Tian, Y.P.; Liu, Y.Y.; Dong, K.Y.; Zhao, B.; Tang, S.F.; Nie, X.M.; Yan, Y.B. Advances in rapid detection of volatile organic compounds (VOCs): From conventional techniques to surface-enhanced Raman spectroscopy. Results Chem. 2025, 16, 102329. [Google Scholar] [CrossRef]
  38. Liu, J.H.; Qi, C.; Liu, Q.T.; Wang, H.; Wang, C.; Zhang, Y.H.; Wu, S.P.; Li, N. Study on the effects of organic-inorganic composite inhibitor on fume emissions of rubber modified asphalt. Constr. Build. Mater. 2024, 455, 139206. [Google Scholar] [CrossRef]
  39. Zhang, Z.Q.; Han, Y.Z.; Lei, Z.K.; Shi, J.R.; Yang, X.H.; Yang, M. Influencing Factors and Mechanisms of Fume Emission from Crumb Rubber Modified Asphalt. J. Zhengzhou Univ. (Eng. Sci.) 2026, 47, 1–7. [Google Scholar] [CrossRef]
  40. Meng, Y.J.; Fang, G.P.; Hu, Y.R.; Qin, Y.; Xu, R.G.; Yang, F.Y.; Lei, J.C.; Zhang, C.Y. Study on the effect of different aldehyde modifiers on the fume suppression effect, mechanism and road performance of SBS modified asphalt. Sci. Total Environ. 2024, 912, 169162. [Google Scholar] [CrossRef] [PubMed]
  41. Yuan, Y.J.; Chen, L.X.; Zhang, H.L. Research and promotion of whole process highly-efficient pitch fume adsorption technology for carbon and graphite products kneading and forming process. Light Met. 2021, 57–62. [Google Scholar] [CrossRef]
  42. Shi, J.R.; Lei, Z.K.; Yang, X.H.; Yang, M.; Liu, Z.X.; Zhang, Z.Q. Study on smoke degradation method and smoke suppression mechanism of rubber powder modified asphalt. Appl. Chem. Ind. 2025, 54, 2572–2577. [Google Scholar] [CrossRef]
  43. Guo, M.; Wei, L.W.; Fu, Y.; Guan, M.Y. Study on Odor-Reducing Effectiveness and Performance Impacts of Deodorizing Materials on Asphalt Binders. Sustainability 2025, 17, 4491. [Google Scholar] [CrossRef]
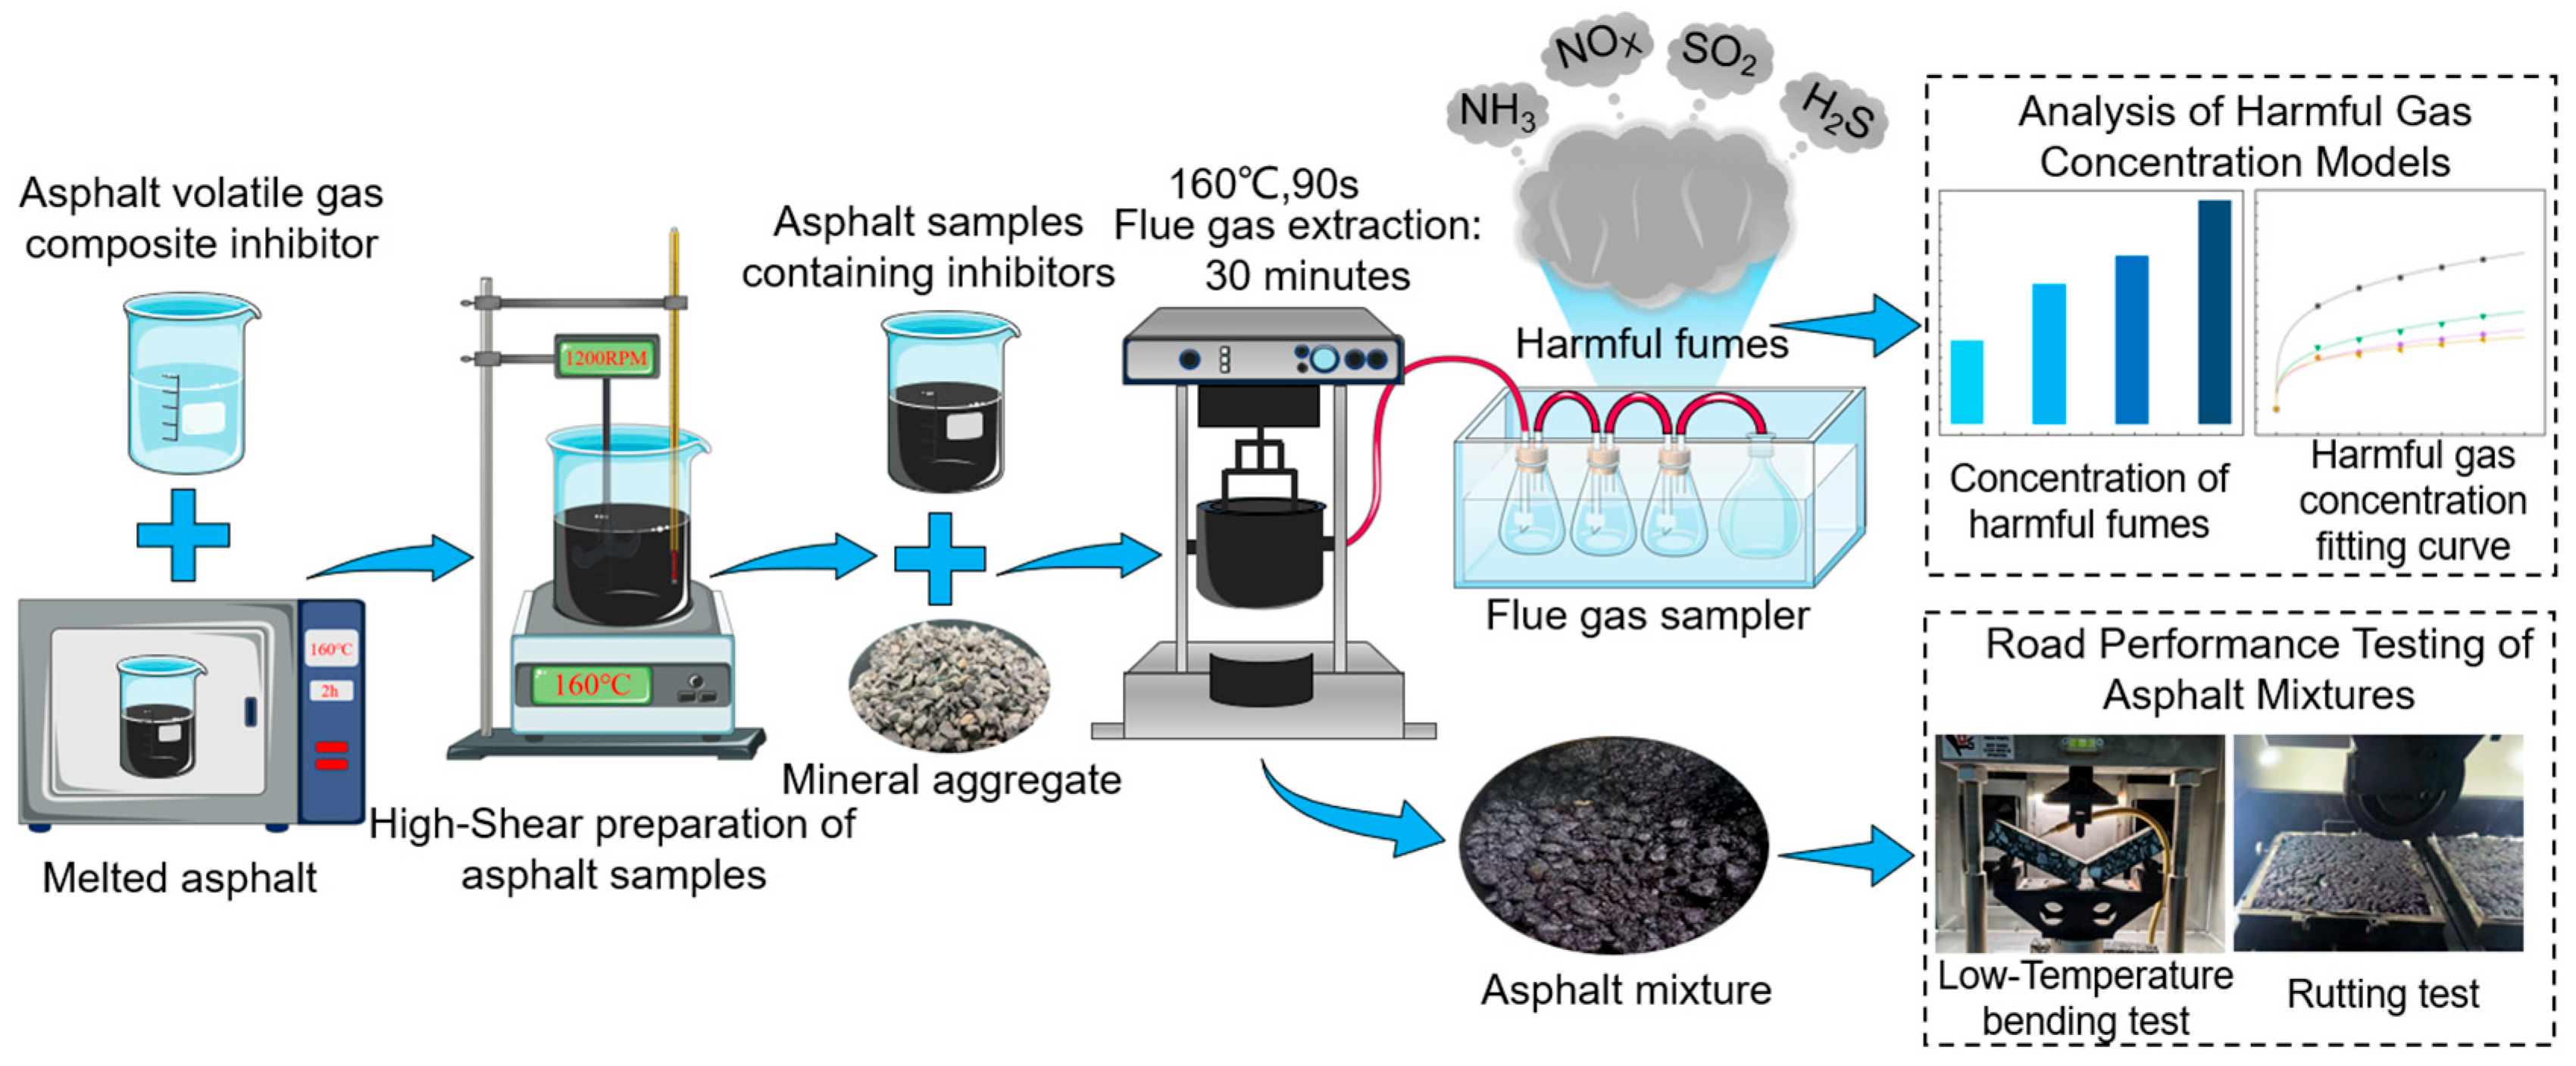
Figure 1. Harmful fumes simulation collection device.
Materials 19 01871 g001
Figure 2. Concentrations of harmful fumes versus inhibitor content and fitting curves for three types of asphalt: (a) 70# asphalt, (b) SBS modified asphalt and (c) rubber modified asphalt.
Materials 19 01871 g002
Figure 3. (a) Normal Q-Q plot for concentration of harmful fumes. (b) Residuals vs. fitted values.
Materials 19 01871 g003
Figure 4. Individual and overall satisfaction curves for harmful fumes from 70# asphalt.
Materials 19 01871 g004
Figure 5. Individual and overall satisfaction curves for harmful fumes from SBS modified asphalt.
Materials 19 01871 g005
Figure 6. Individual and overall satisfaction curves for harmful fumes from rubber modified asphalt.
Materials 19 01871 g006
Figure 7. Comparison of overall satisfaction curves for three types of asphalt.
Materials 19 01871 g007
Figure 8. Comparison of harmful fume concentrations in asphalt before and after degradation.
Materials 19 01871 g008
Table 1. Physical properties of 70# asphalt.
Test MetricsTechnical RequirementsTest ResultsTest Method [18]
Ductility (1 cm/min, 10 °C, cm)≥2029.3T 0605-2011
Softening point (°C)≥4647.6T 0606-2011
Penetration (25 °C, 100 g, 5 s, 0.1 mm)60~8072.1T 0604-2011
Solubility (trichloroethylene, %)≥99.599.6T 0607-2025
Flash point (°C)≥260271.0T 0611-2011
Note: Technical requirements follow JTG F40-2004. Penetration (T0604) and softening point (T0606) were tested per JTG 3410-2025, equivalent to ASTM D5 [20] and ASTM D36 [21], respectively.
Table 2. Physical properties of SBS modified asphalt.
Test MetricsTechnical RequirementsTest ResultsTest Method [18]
Penetration (25 °C, 100 g, 5 s, 0.1 mm)30~6044.5T0604-2011
Ductility (5 cm/min, 5 °C, cm)≥2033.8T0605-2011
Softening point (°C)≥6070.7T0606-2011
Elastic recovery (25 °C, %)≥7586.6T0662-2000
48 h softening point difference (°C)≤2.51.9T0661-2025
Note: PG 76-22 [22] equivalency is based on standard correlations with softening point (required > 60 °C, measured 70.7 °C) and elastic recovery (required > 75%, measured 86.6%) under Chinese industry specifications (JTG F40-2004).
Table 3. Physical properties of rubber modified asphalt.
Test MetricsTechnical RequirementsTest ResultsTest Method [18]
Penetration (25 °C, 100 g, 5 s, 0.1 mm)50~7056T0604-2011
Ductility (5 cm/min, 5 °C, cm)≥1519T0605-2011
Softening point (°C)≥5573T0606-2011
Elastic recovery (25 °C, %)≥6077T0662-2000
Note: Compliance verified against CJJ/T 273-2019. The measured softening point (73 °C) is consistent with a PG 70-22 to PG 76-22 grading based on standard specification correlations [22].
Table 4. Road performance test design.
Types of AsphaltRoad PerformanceTest Methods [18]Test Procedure
70# asphalt,
SBS modified asphalt,
rubber modified asphalt
High-temperature stabilityRutting testT0719-2025
Low-temperature stabilityLow-Temperature bending testT0715-2025
Water stabilityFreeze–Thaw splitting testT0729-2025
Table 5. Significance analysis of the fitting equation for harmful fume concentrations in three types of asphalt.
Types of AsphaltFitting EquationVariance SourceType III SSDFMSFp
70# asphaltNH3Regression63.192231.596348.3060.0002808
Residual0.27230.091//
NOXRegression617.8393205.946205.0450.00486
Residual2.00921.004//
SO2Regression36.800218.400102.0600.00174
Residual0.54130.180//
H2SRegression9.77024.885124.3650.0013
Residual0.11830.039//
SBS modified asphaltNH3Regression75.369237.68466.0300.00331
Residual1.71230.571//
NOXRegression251.938383.979114.2370.00869
Residual1.47020.735//
SO2Regression110.571255.285173.2240.0007954
Residual0.95730.319//
H2SRegression10.13525.06856.8570.00412
Residual0.267430.089//
Rubber modified asphaltNH3Regression269.112389.704364.0510.00274
Residual0.4928120.246//
NOXRegression812.8413270.947177.6650.0056
Residual3.05021.525//
SO2Regression90.370245.18572.2880.0029
Residual1.87530.625//
H2SRegression42.445221.222239.5520.0004909
Residual0.2657830.089//
Table 6. Optimal inhibitor content and maximum overall satisfaction for three types of asphalt obtained through satisfaction function optimization.
Types of AsphaltOptimal Inhibitor Content, x* (%)Maximum Overall Satisfaction, D M a x (%)Types of Asphalt
70# asphalt0.08298.87070# asphalt
SBS modified asphalt0.07998.163SBS modified asphalt
Rubber modified asphalt0.08097.145Rubber modified asphalt
Table 7. Predicted concentrations and degradation rates of each gas at optimal inhibitor content for three types of asphalt.
Types of AsphaltPredicted Concentration of Each Gas (mg/m3)/Degradation Rate (%)
NH3NOxSO2H2S
70# asphalt0.229/41.20.296/54.00.035/77.40.086/44.9
SBS modified asphalt0.239/44.50.328/51.70.032/83.70.086/48.6
Rubber modified asphalt0.269/43.80.322/55.80.032/81.70.090/52.1
Table 8. Test results of road performance for asphalt mixture at optimal admixture content.
Types of AsphaltInhibitor Content (%)Dynamic Stability DS (Times/mm)Freeze–Thaw Crack Resistance Ratio T S R f (%)Maximum Bending Tensile Strain ε B  ( μ ε )
70# asphalt0210378.732321
0.082204379.512398
SBS modified asphalt0428786.132760
0.079416687.012850
Rubber modified asphalt0478889.222821
0.080467090.192909
Disclaimer/Publisher’s Note: The statements, opinions and data contained in all publications are solely those of the individual author(s) and contributor(s) and not of MDPI and/or the editor(s). MDPI and/or the editor(s) disclaim responsibility for any injury to people or property resulting from any ideas, methods, instructions or products referred to in the content.