1. Introduction
Elemental arsenic (As) is an essential material used in the alloy production, medical (such as chemotherapeutic drugs), chemical (such as insecticides and preservatives), and semiconductor manufacturing fields [
1,
2,
3]. As one of the major raw materials used in the production of third-generation semiconductors, the manufacture and purification of elemental As is currently the focus of related research and is of considerable importance to the smooth running of subsequent procedures [
4,
5,
6,
7].
Numerous achievements have been reported on producing elemental As using various kinds of waste from non-ferrous metal production [
8,
9,
10,
11]. In China, most elemental As is produced by the reduction of gaseous arsenic trioxide (As
2O
3) using carbonaceous materials [
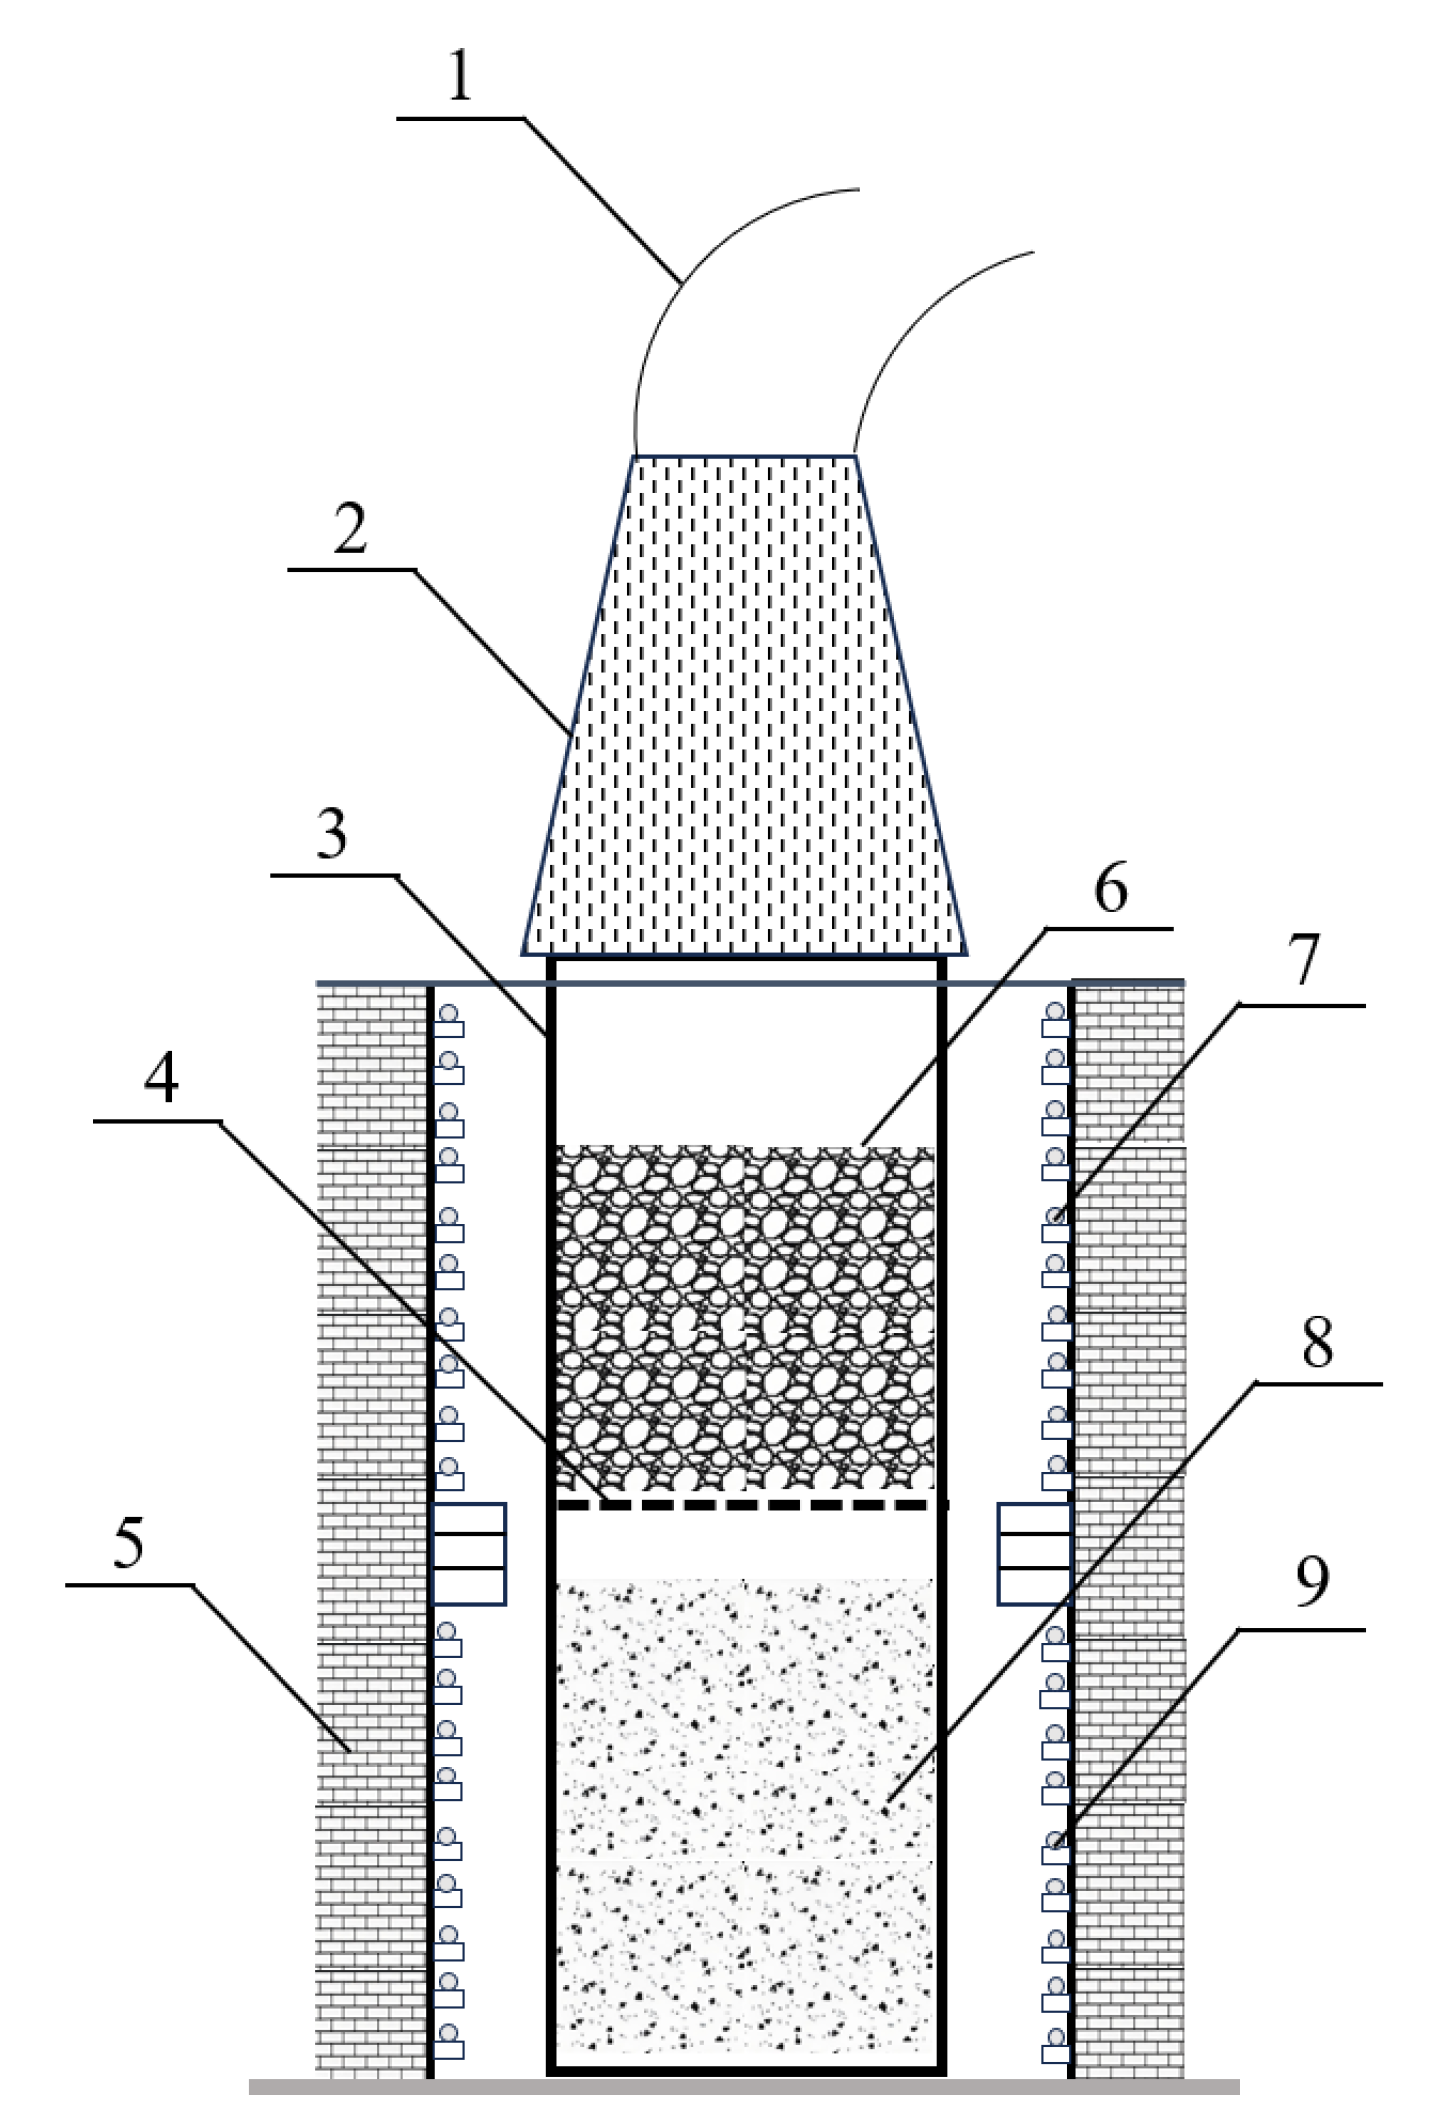
12]. The entire reduction process is conducted in a cylindrical steel reactor (
Figure 1). Solid raw materials containing As
2O
3 for reduction are loaded in the lower part of the reactor, and carbonaceous materials are loaded in the upper part. After sealing and placing the reactor in an induction furnace and then heating it to the reduction temperature at specific velocities, As
2O
3 is vaporized and reacts with the preheated carbonaceous materials to form gaseous elemental As. Finally, α-phase As can be obtained by condensing the generated As vapor at specific temperatures. During the manufacturing of elemental As, owing to the high processing temperature and complicated atmosphere, the corrosion rate and behavior of steel reactors are rapid and complex. Consequently, the average lifespan of steel reactors is extremely short (five to eight production batches) [
12], which poses serious environmental pollution risks because of the increased As-containing steel scrap generation during reactor maintenance or replacement [
13,
14,
15,
16].
To increase the lifespan of reactors, special steels such as stainless steels and heat-resistant steels have been used. Corrosion-resistant coatings have also been tentatively applied. However, commercial applications have shown that these methods do not increase the lifespan of steel reactors but can increase the equipment cost or potentially affect the product quality. It is generally acknowledged that the corrosion of steel reactors in elemental As manufacturing is facilitated by the formation of Fe–As compounds with low melting temperatures. However, the corrosion process and the effects of other components, such as O, C, Sn, Se, and Sb, on the corrosion process remain unclear. As simulating the reduction of gaseous As2O3 in the laboratory can be difficult and involve safety risks (high volatility and high toxicity), few studies have been reported on the thermodynamics and kinetics information of the corrosion process. Elucidating the corrosion process in detail can help in addressing the corrosion problem and enhancing both the product quality and reactor lifespan.
Accordingly, corrosion experiments on steel reactors were conducted, and the corrosion process and the effects of other components (O, C, Sn, Se, and Sb) on the corrosion process were examined and discussed in this study. Results of this study provide references to increase the lifespan of steel reactors for elemental As production.
2. Materials and Methods
2.1. Sample Acquisition
To reveal the corrosion behavior on the inner side of steel reactors, experiments were conducted using As
2O
3 (purity > 98%) and charcoal as raw materials. The reactor (580-mm diameter and 2150-mm length) was fabricated from conventional C steel of 8 mm thickness. The composition of the steel is listed in
Table 1. As the manufacturing process is intermittent, low-purity products, dust, and unspent charcoal from previous batches were also adopted as raw materials. For each batch, the upper charcoal zone was first heated to 720 °C, after which the lower As
2O
3 zone was heated to 700 °C at a rate of 2–3 °C per minute to vaporize the As
2O
3. The main reaction is As
2O
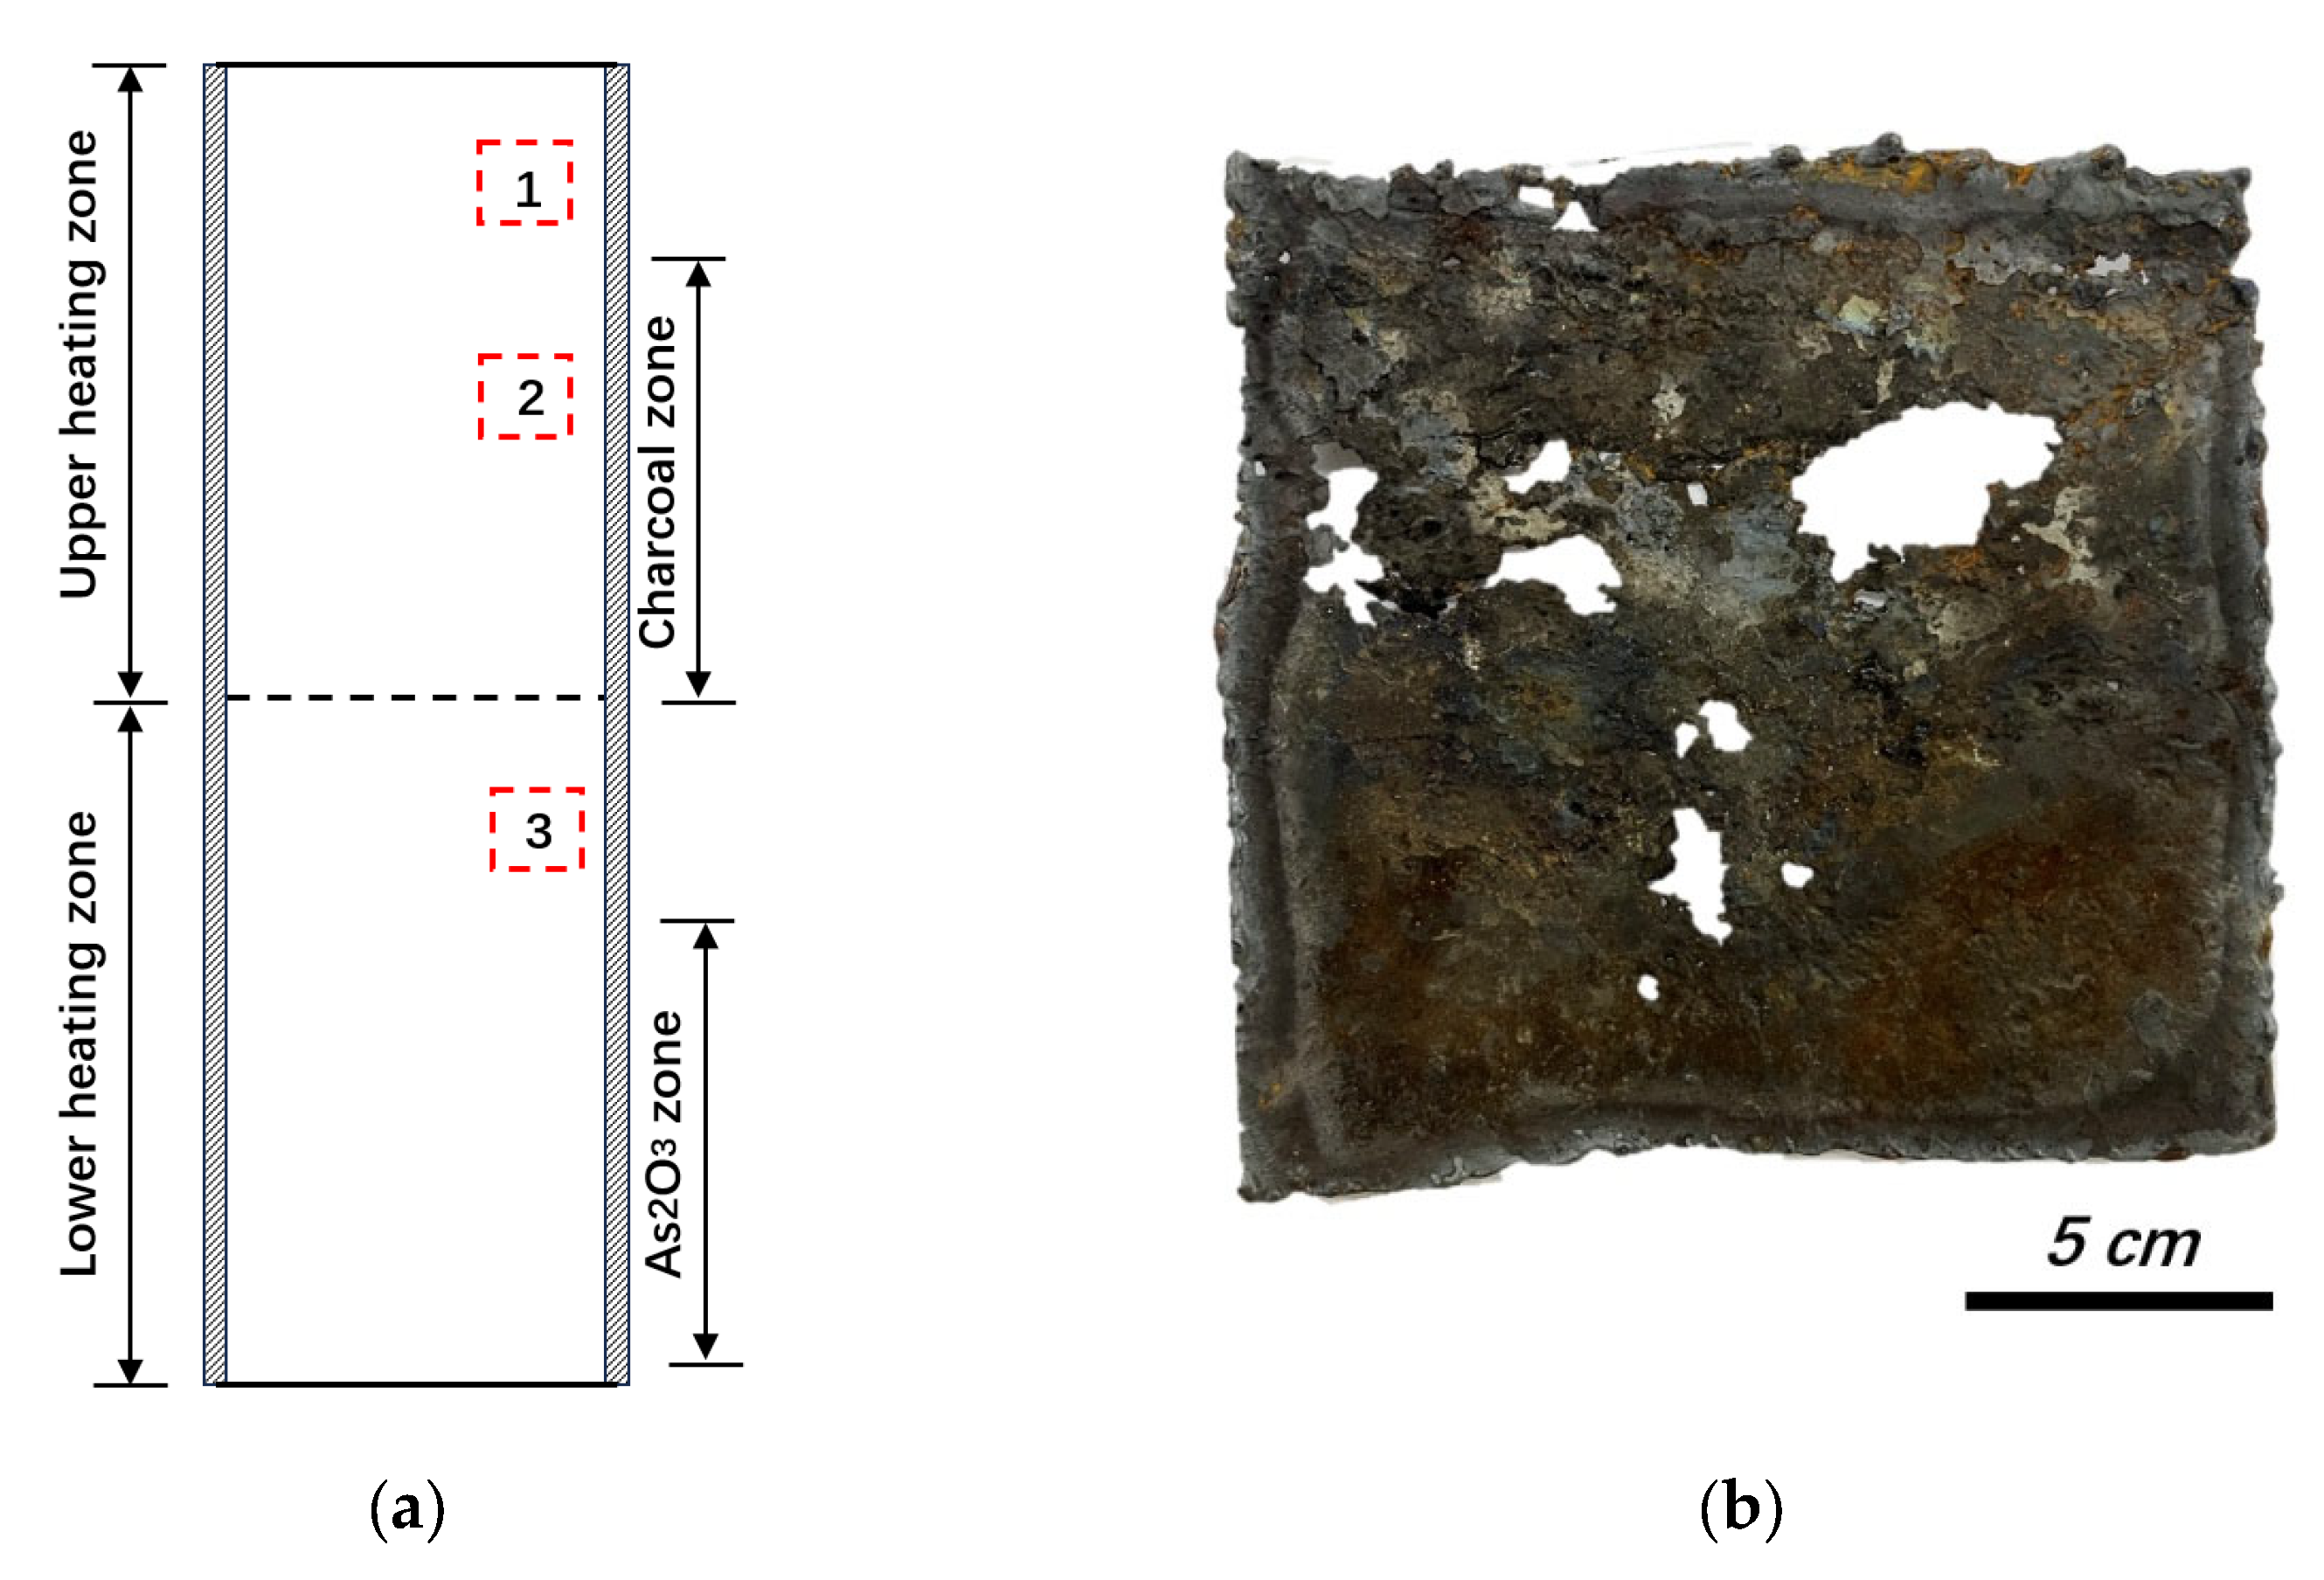
3 (g) + 3C (s) = 2As (g) + 3CO (g). After the reaction was complete, the reactor was cooled to room temperature (25 to 35 °C), and the corrosion products from the inner side of the steel wall were harvested by scraping. When corrosion perforation occurred, samples (steel plates of 150 mm length and 150 mm width) were cut and collected from the steel wall, the sampling location of which is shown in
Figure 2 (labeled with a red dashed line).
2.2. Measurements and Analysis
To determine the corrosion rate of the steel wall, an ultrasonic thickness gauge (Olympus Corporation, 39DL Plus, Tokyo, Japan) was used to measure the thickness of the steel wall after each production batch. The measurement positions were chosen at the charcoal zone, lower heating zone, and upper part of the reactor (near the center of Positions 1, 2, and 3 in
Figure 2). X-ray diffraction (XRD, RIGAKU Corporation, MiniFlex, Tokyo, Japan) was used to identify the major corrosion products and X-ray fluorescence (XRF, RIGAKU Corporation, ZSX Primus III+, Tokyo, Japan) was used to measure their compositions after grinding the corroded parts into fine powders (<75 μm). Scanning electron microscopy (SEM, FEI Company, Nova Nanosem 450, Hillsboro, OR, USA) and energy-dispersive spectroscopy (EDS) were used to inspect the features and elemental distributions of the corroded steel-plate cross-sections. Small samples for SEM-EDS inspection were first mounted on a resin, polished with alumina slurry, and then sputter-coated with gold (Au).
3. Results and Discussion
3.1. Corrosion Rate
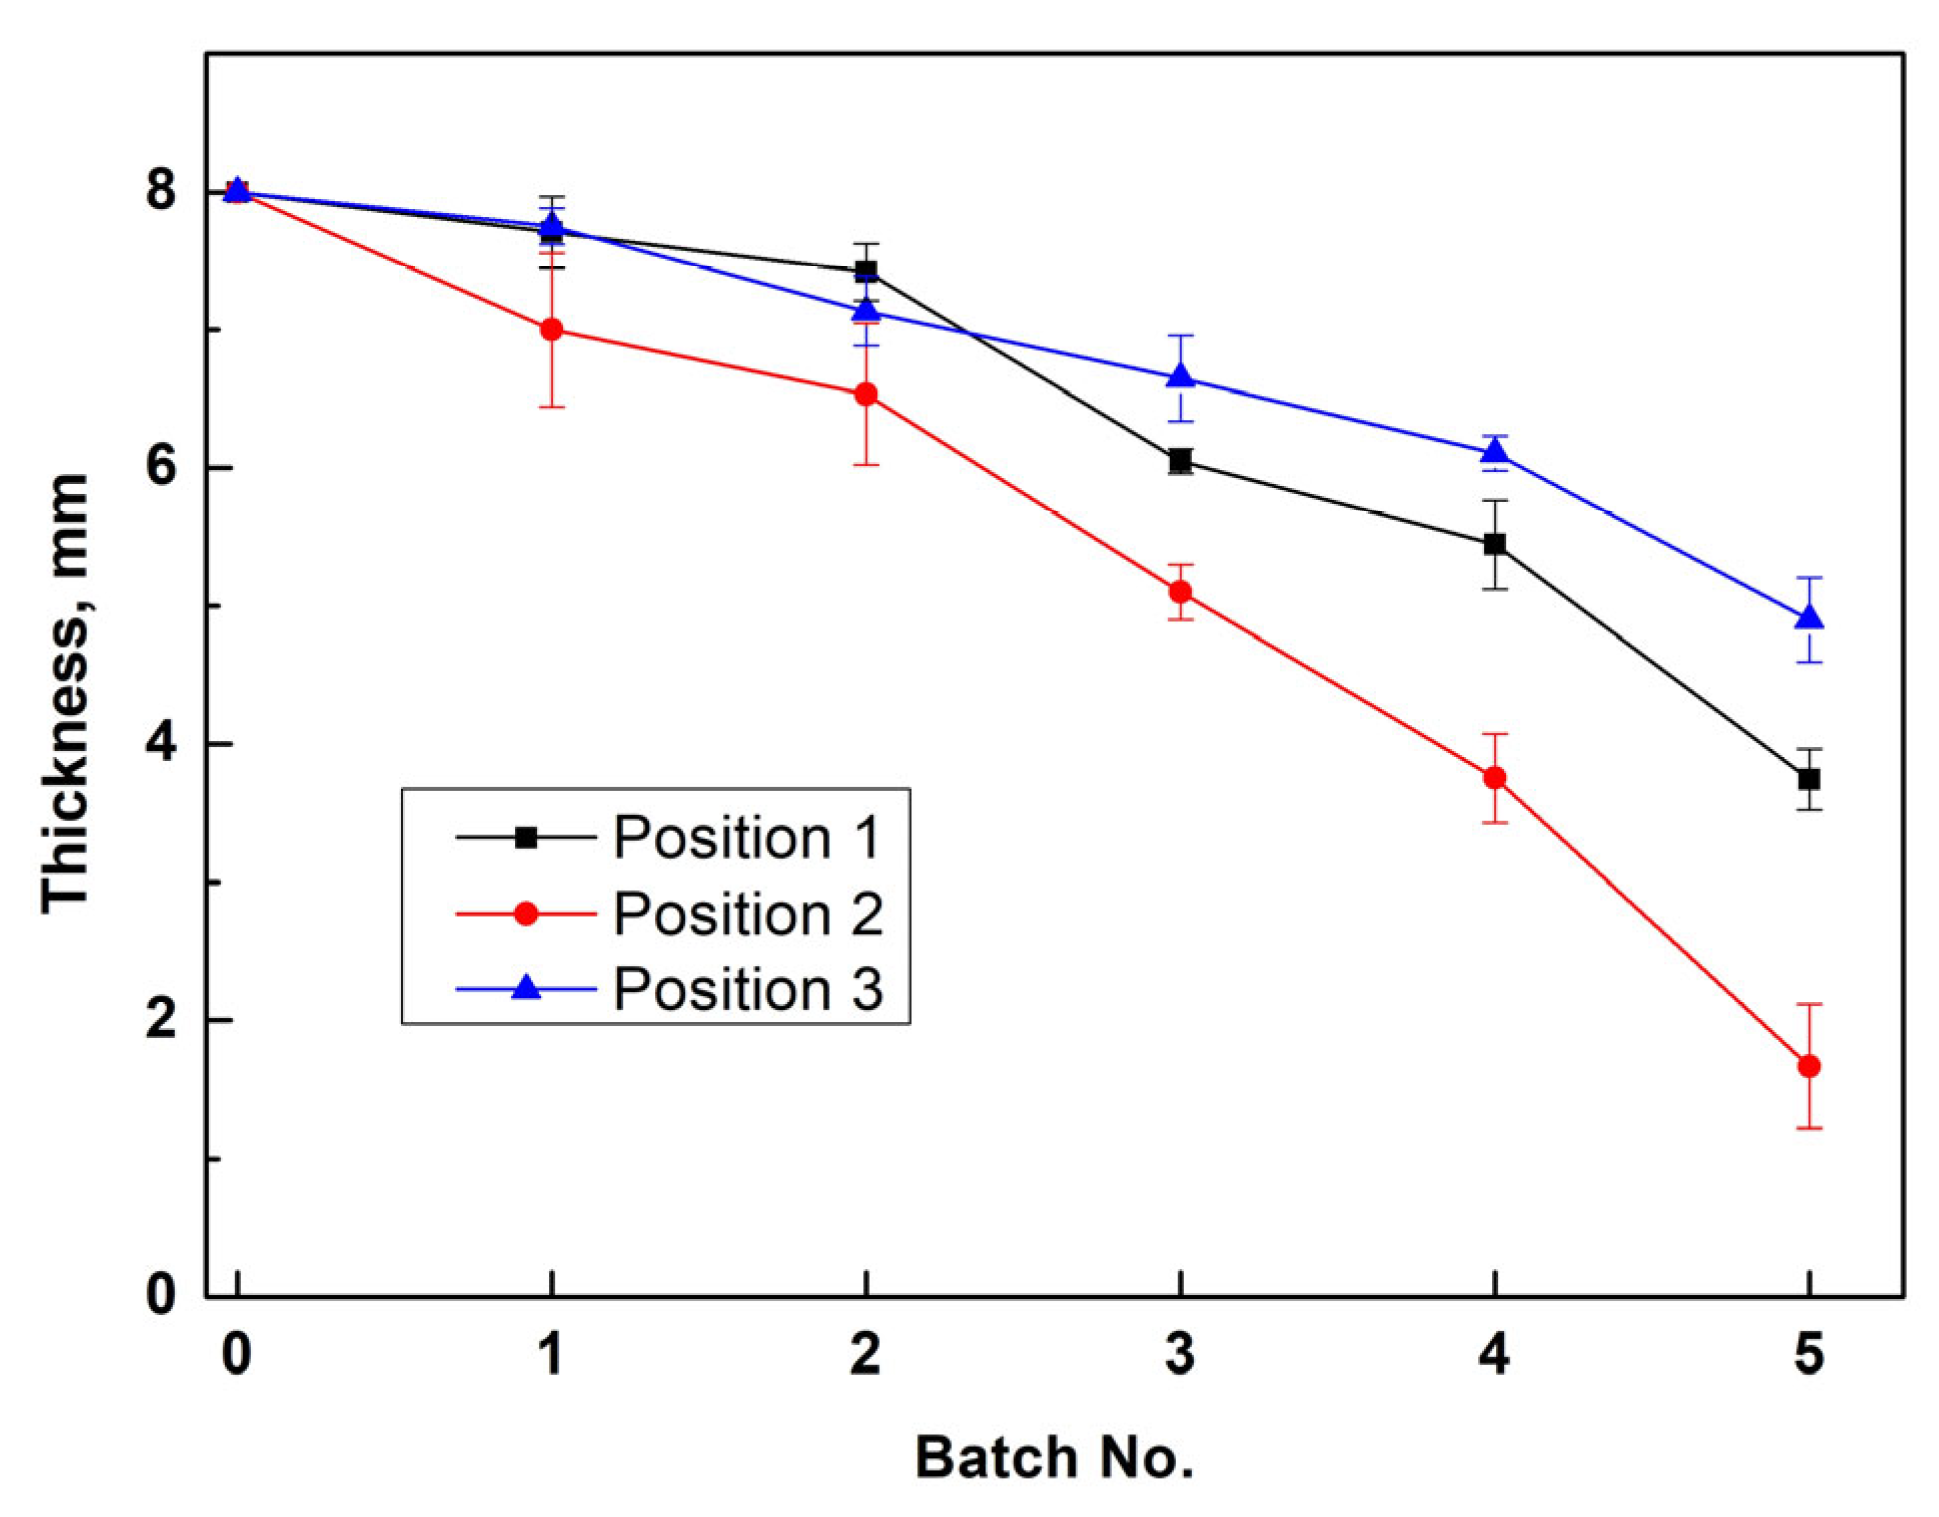
The measured plate thicknesses are shown in
Figure 3. Six production batches were run in the steel reactor. As corrosion perforations occurred near Position 2 during the sixth production batch, the thickness data for batch 6 were not plotted. Based on the thickness data, it can be concluded that the steel wall near Position 2 (charcoal zone) was more likely to be corroded in the first production batch. The corrosion rates of the steel wall at Positions 1 and 3 were lower and similar prior to the third production batch. The reason for the more rapid steel-wall corrosion at Position 2 (charcoal zone) will be discussed in
Section 3.3.
3.2. Corrosion Products
Gaseous elemental As can be expected to react with steel to form metallic compounds with low melting temperatures, resulting in corrosion. However, other impurities within raw materials, such as Sn, Sb, and Se, have also been considered to affect the corrosion process but this has not yet been proven in commercial practice. In this study, XRD and XRF were used to identify the corrosion products and elementary compositions of the acquired samples.
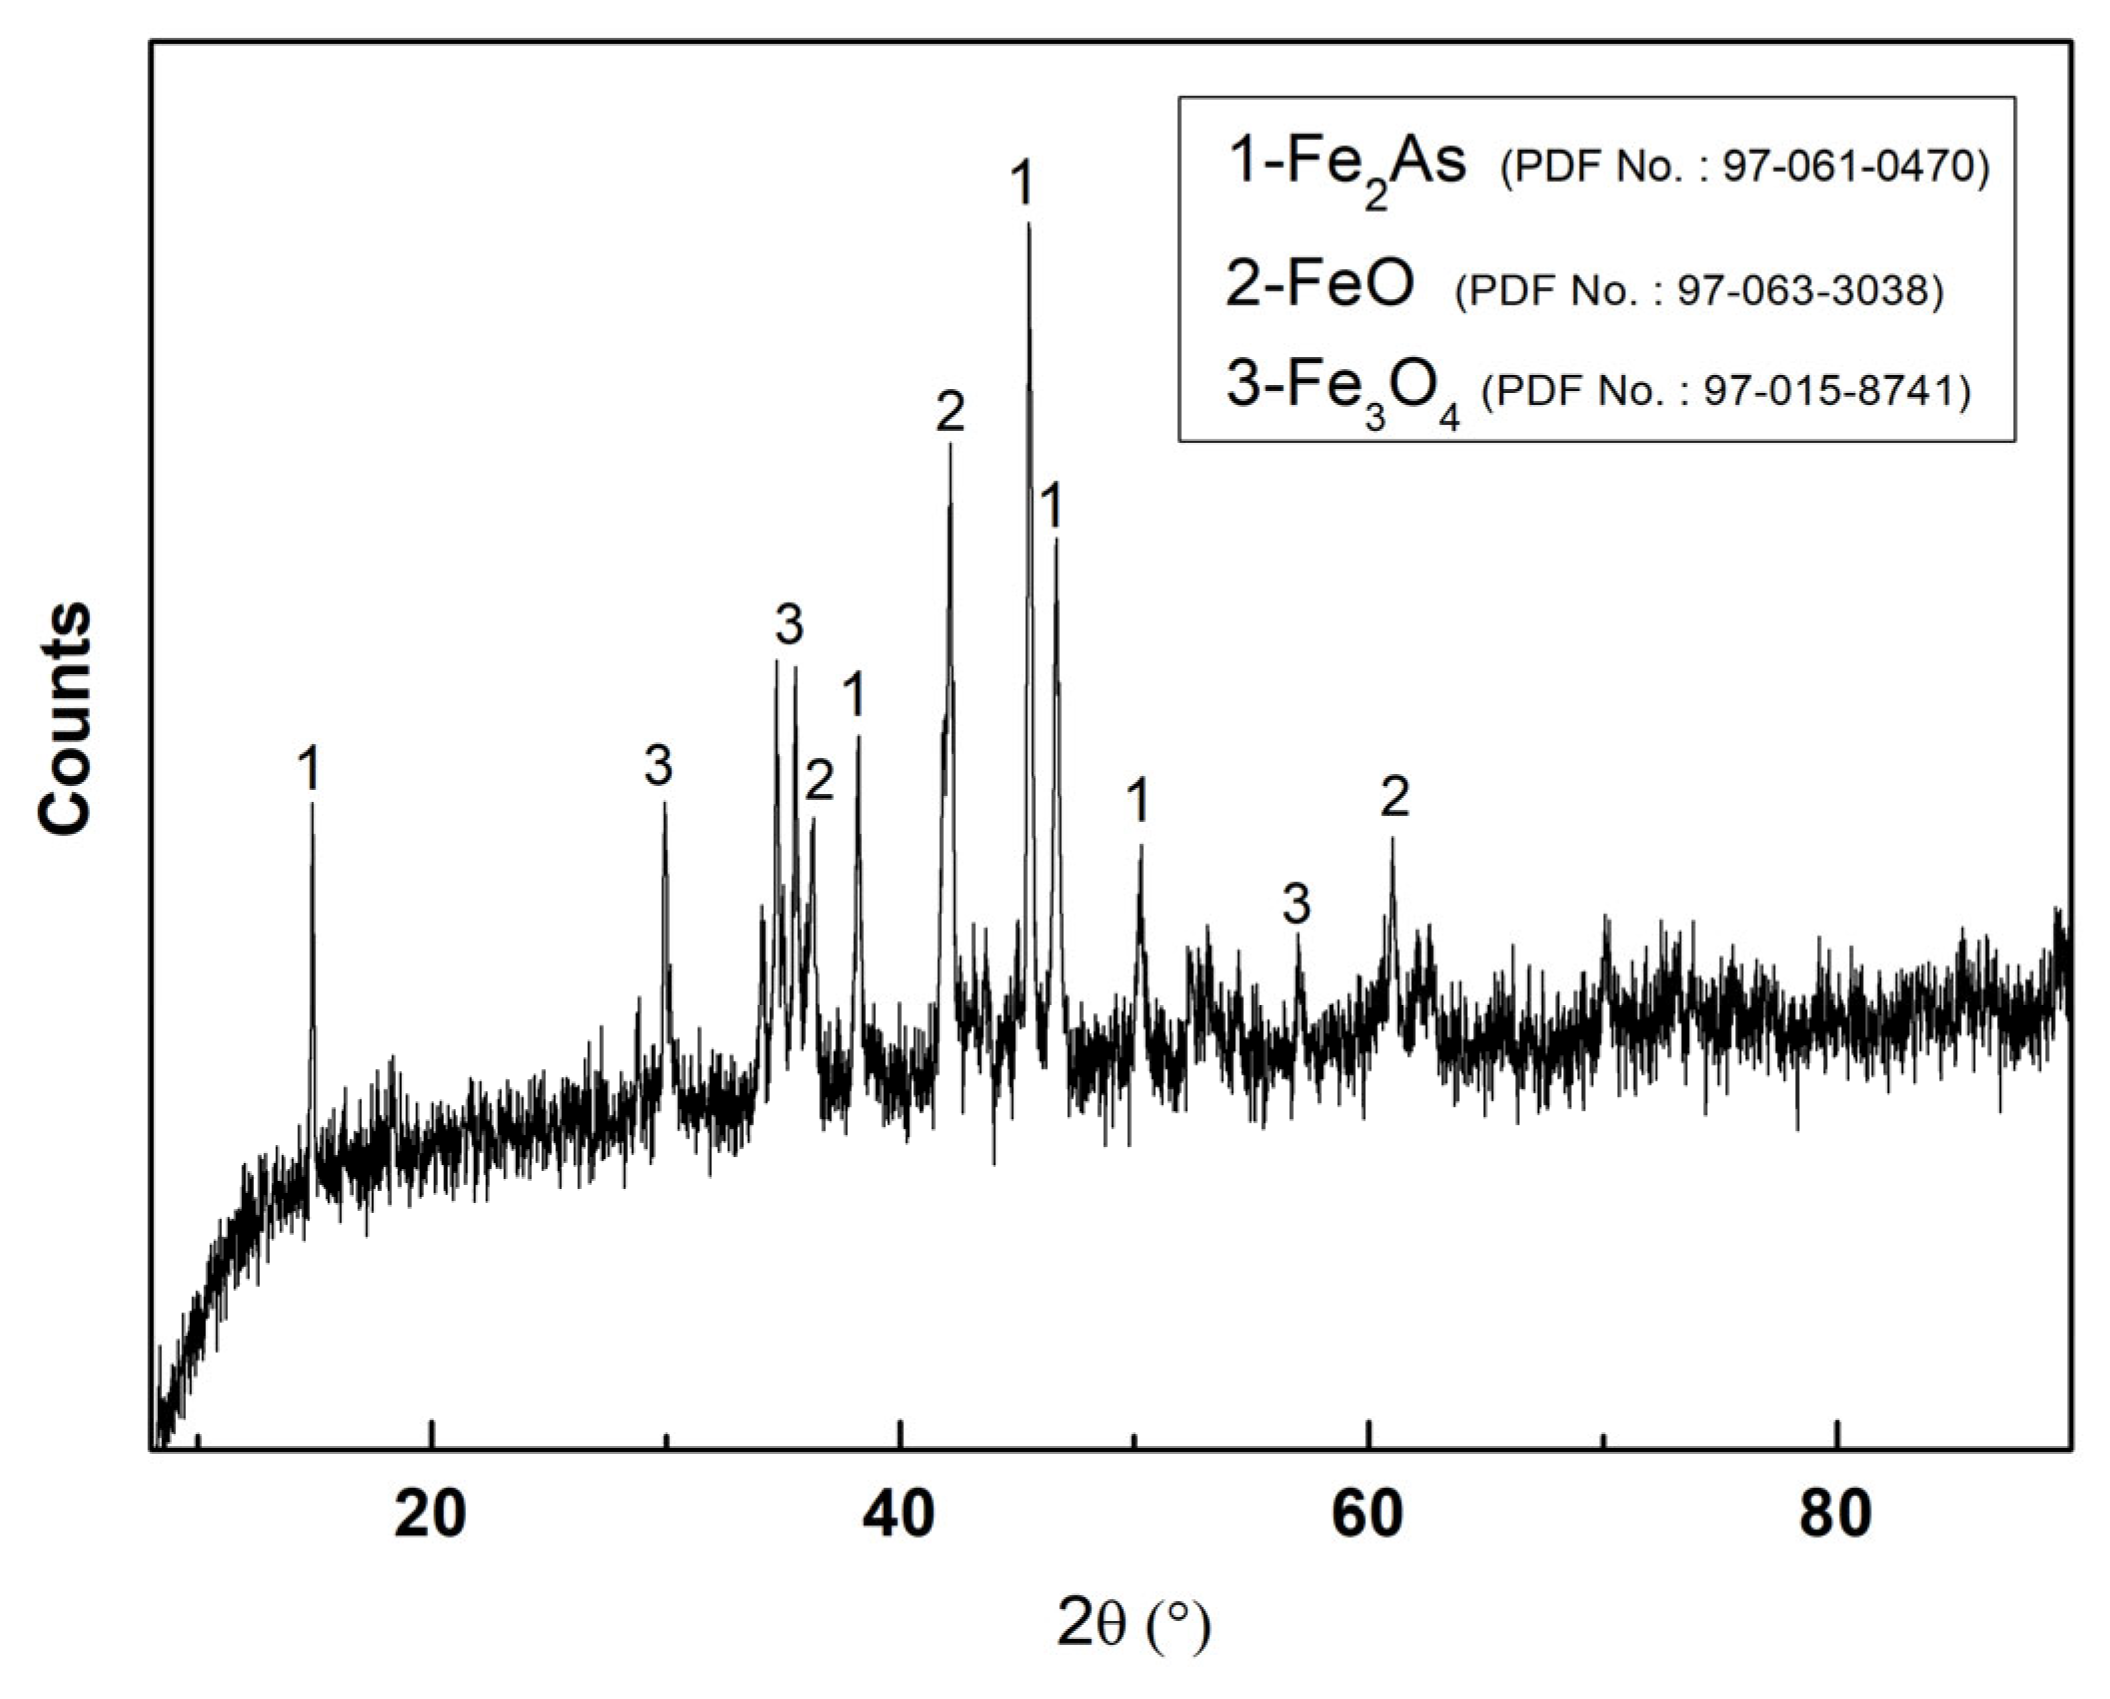
Table 2 lists the typical XRF results of the corroded samples obtained from the different positions, indicates that in addition to Fe and As, the other detected components, Mn and Si, should be originated from the steel material. Sn or Sb were not detected and only a trace quantity of Se was evident (which should have no impact on the corrosion process, the detection limits of Sn, Sb, and Se using XRF are 10 ppm). This is further proven in the next section. The XRD results in
Figure 4 indicate that the main crystal phases formed in the corrosion perforation area (Position 2) were Fe
2As, FeO, and Fe
3O
4, suggesting that oxidation processes from outside the steel reactor could also have had an impact on the corrosion perforations.
3.3. Effects of Carbon and Oxygen on Corrosion Process
To reveal the corrosion process of the steel reactors, cross-sections of the corroded steel wall were inspected using SEM-EDS.
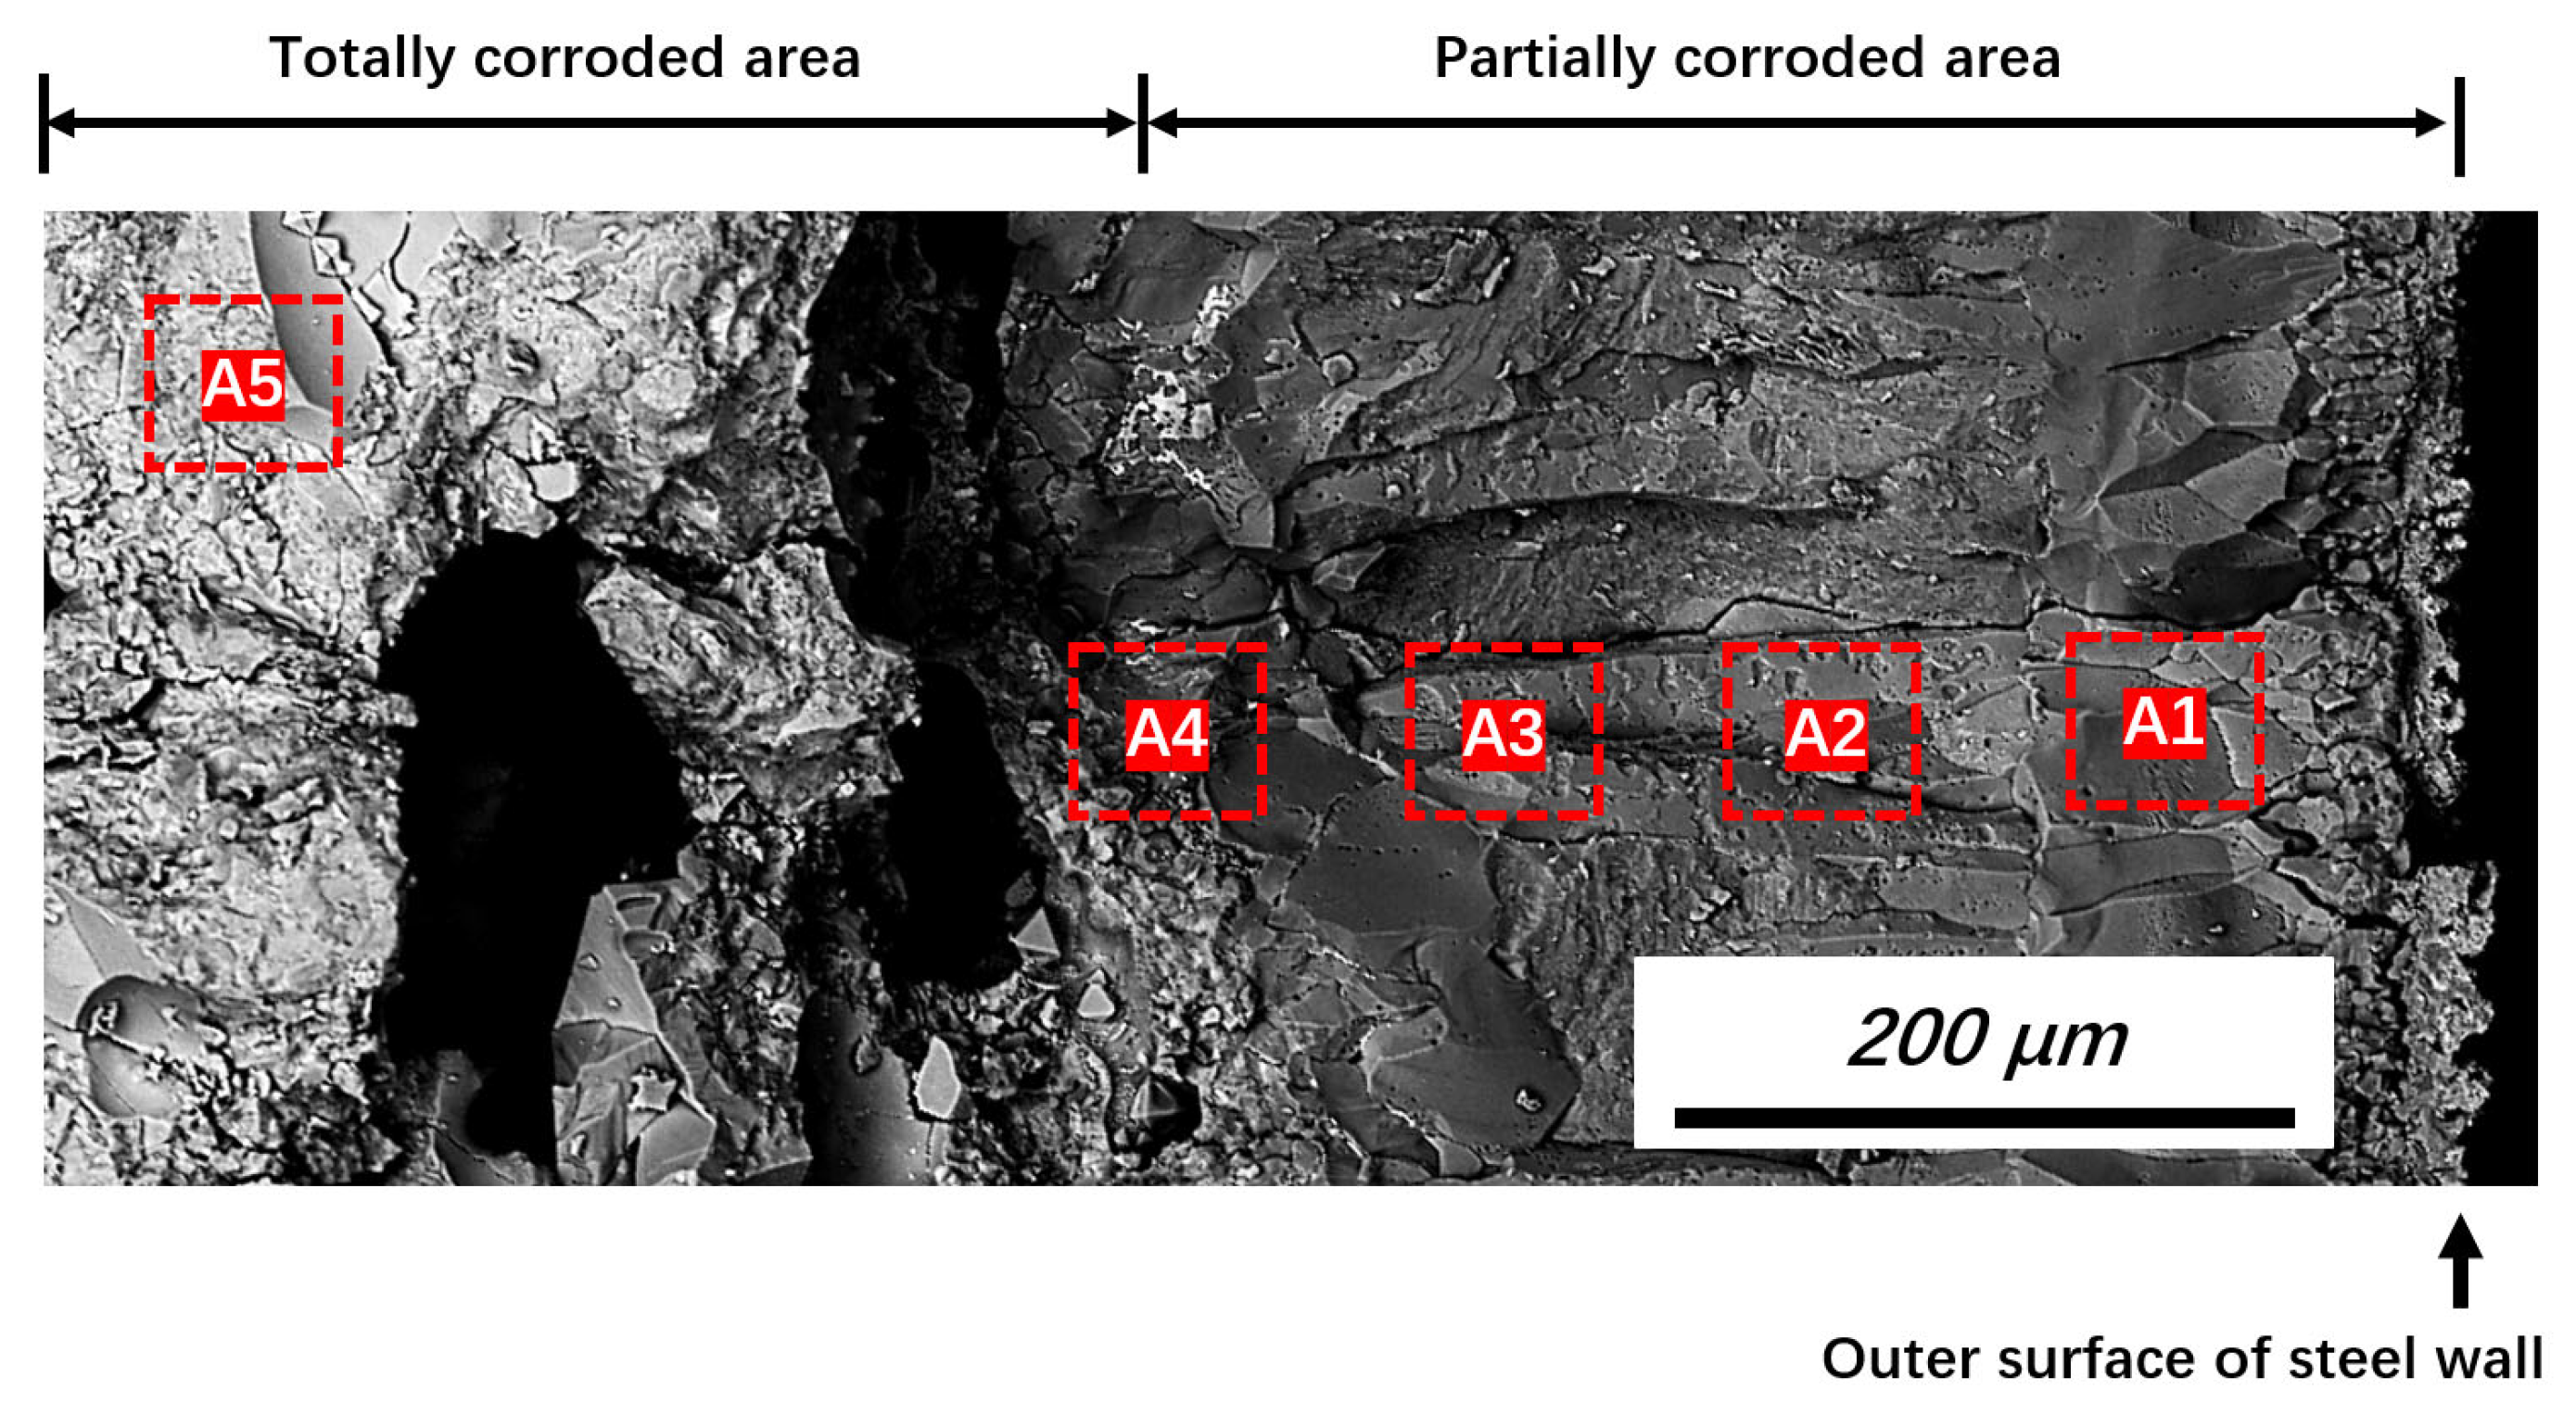
Figure 5 shows the typical appearance of a fracture in the steel wall near Position 2. Two typical areas—that is, totally and partially corroded—were observed. Solidification segregation and reactions caused abrupt compositional changes in micro-areas. Consequently, instead of point or line scanning, EDS area scanning was adopted to measure the average composition and its change tendency within different parts of the totally and partially corroded areas.
The positions for the measurements are shown in
Figure 5 (red dashed lines), with the measurement positions (A1–A5) representing different distances from the outer surface of the steel wall. To ensure data accuracy, five measurements were performed at each distance (different longitudinal locations in
Figure 5), and the average value was recorded.
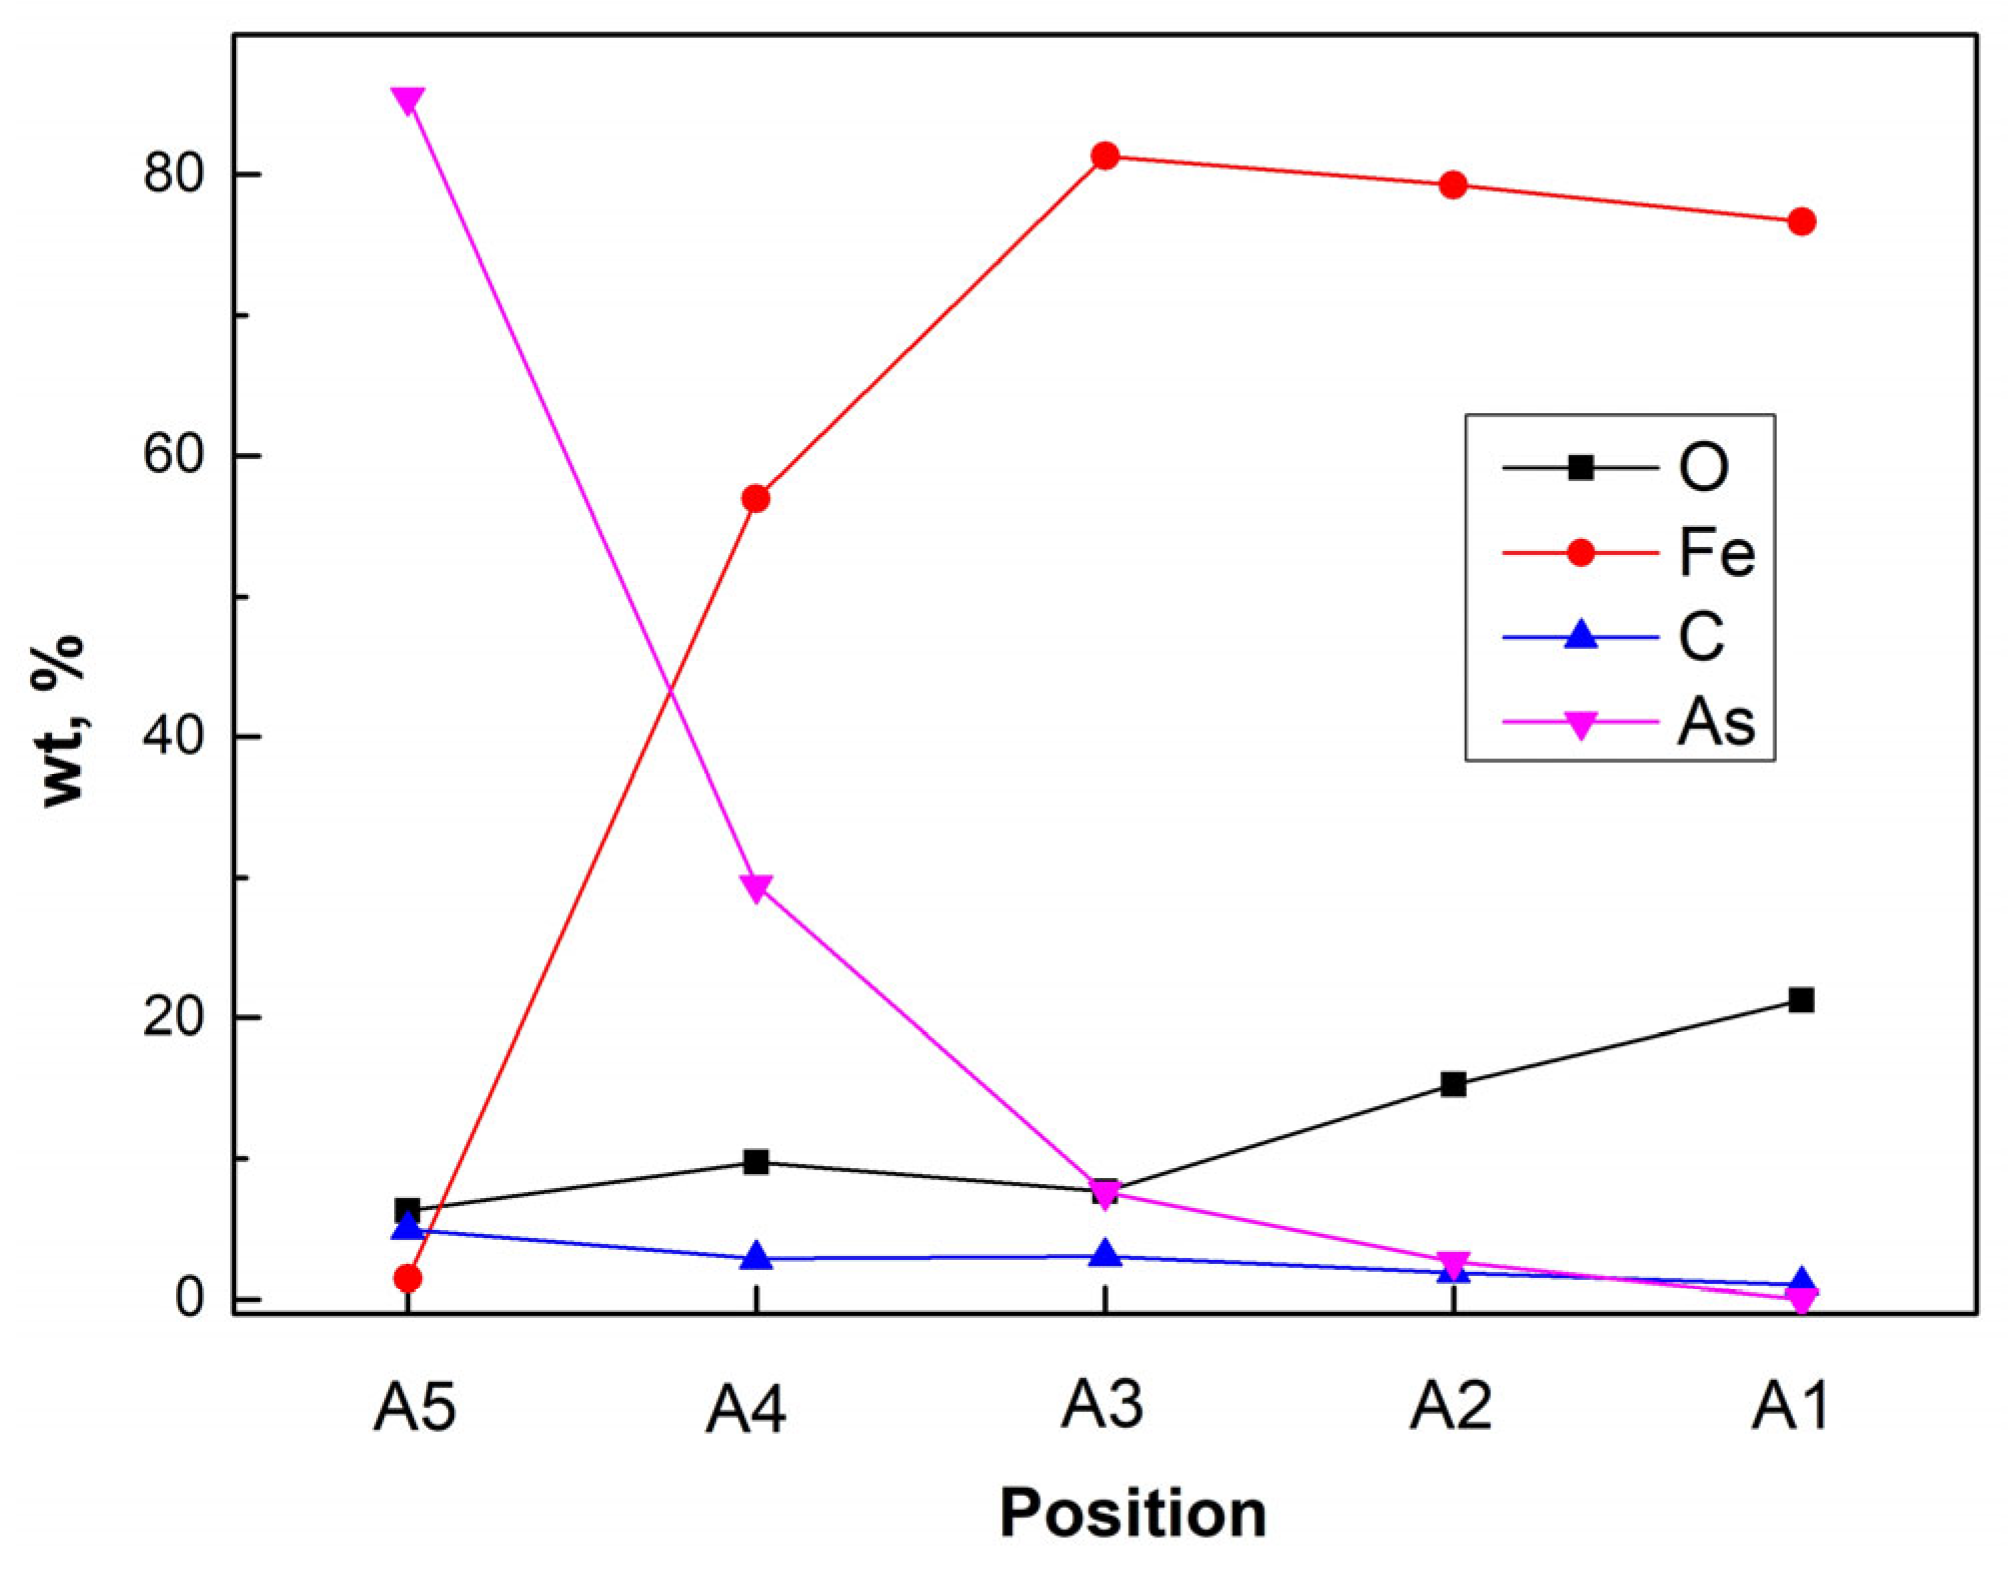
The main compositions measured are shown in
Figure 6. The results indicate that during the production process, oxygen (O) was transferred to the inner side of the steel wall, which promoted the corrosion process. In addition to O, C showed a similar change tendency as As, which increased from areas A1 to A5. (from 1.02 wt% to 4.96 wt%). Although the C content based on EDS measurements was only semi-quantitative, the existence and change tendency could be confirmed. Adding C decreased the eutectic temperature of the Fe–As–C system (the eutectic temperature decreased to 810 °C with 20.4 mol% of As and 4.1 mol% of C) [
17,
18]. This result indicates that C promoted the corrosion process to some degree. The difference between eutectic temperature and processing temperature can reflect the reactivity of phases or substances. Closer to the eutectic temperature (melting temperature in heating process) means lower activation energies of reactions are required to break the old bonds and lower activation energies for diffusion. Thus, a lower eutectic temperature with the addition of C can promote the corrosion process, even if no liquid phases are formed during processing. As rare references have been reported on the As-Fe-C based system, research on the behavior of the C in As–Fe–C systems, especially its thermodynamic and kinetic properties, should be conducted in the future. In the corrosion zone, Sn, Sb, and Se were practically not detected, which further confirms the previously made conclusion about the absence of their influence on the corrosion process.
The average composition change (EDS area scanning) can be used to explain and predict the corrosion tendency; however, it cannot reveal the initial corrosion process. Thus, a typical area showing the initial corrosion features was examined.
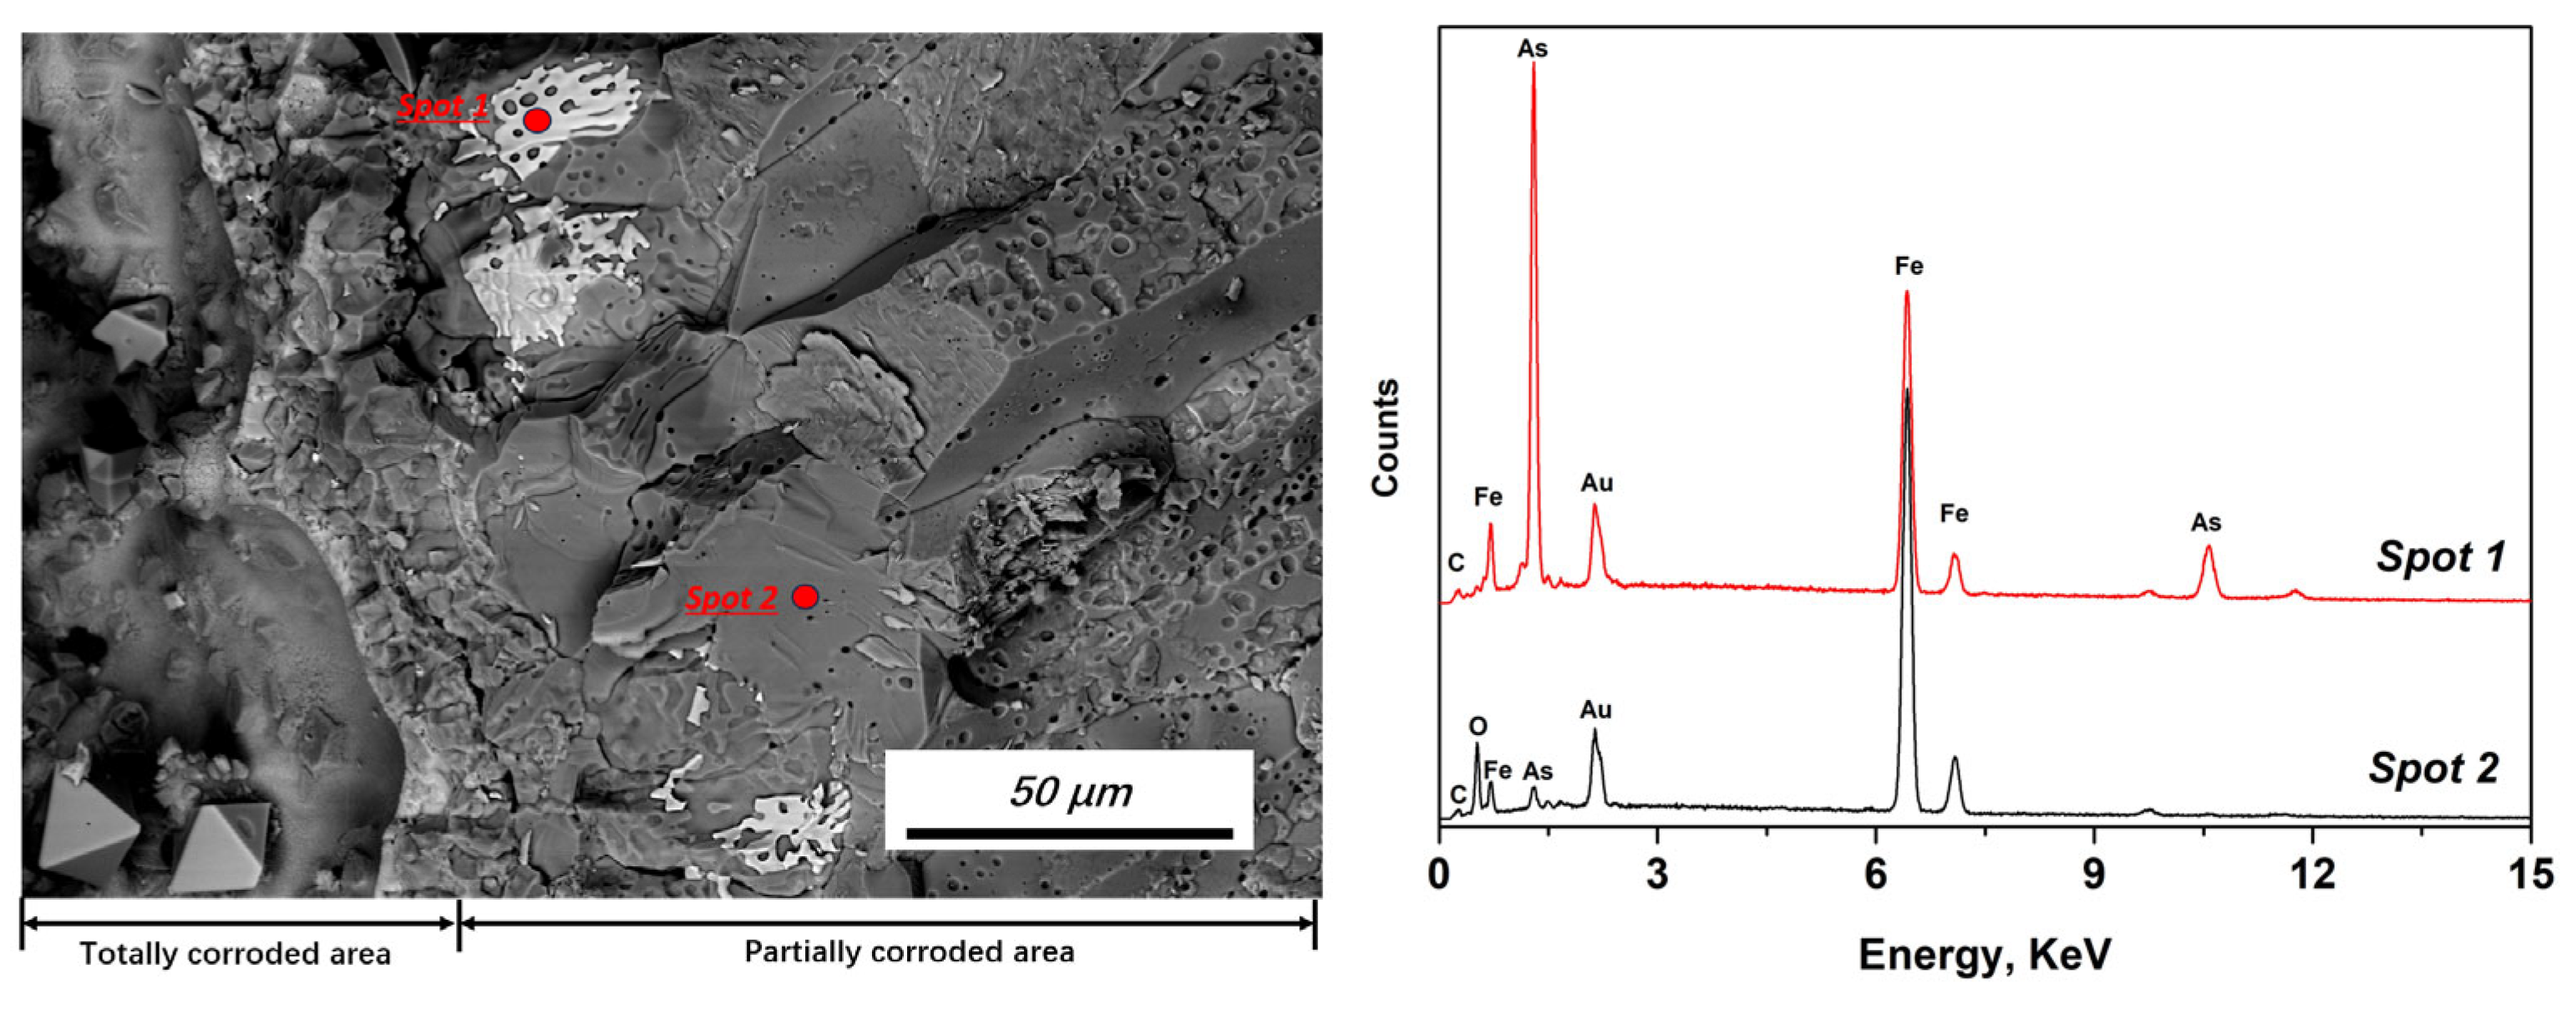
Figure 7 shows the interfacial area between the completely and partially corroded areas. Although most of the initial corrosion products peeled off during the fracturing process, the remaining product phases with bright colors attached to the grain boundaries could still be detected. The typical EDS pattern and main composition of the initial corrosion phase and grain matrix are presented in
Figure 7 and
Table 3, respectively.
The composition results indicate that the initial corrosion products (Spot 1 in
Figure 7) were Fe–As–C-based phases. No obvious O or other elements could be detected. This result further confirms the previous conclusion that C promoted corrosion. However, a relatively high O content was detected in the grain matrix (Spot 2 in
Figure 7). The results indicate that C promoted corrosion, particularly during the initial corrosion stage, by forming an Fe–As–C system. As the reduction process temperature was relatively high, O was transferred to the inner matrix before extensive corrosion by elemental As and C.
3.4. Analysis of Carbon Sources
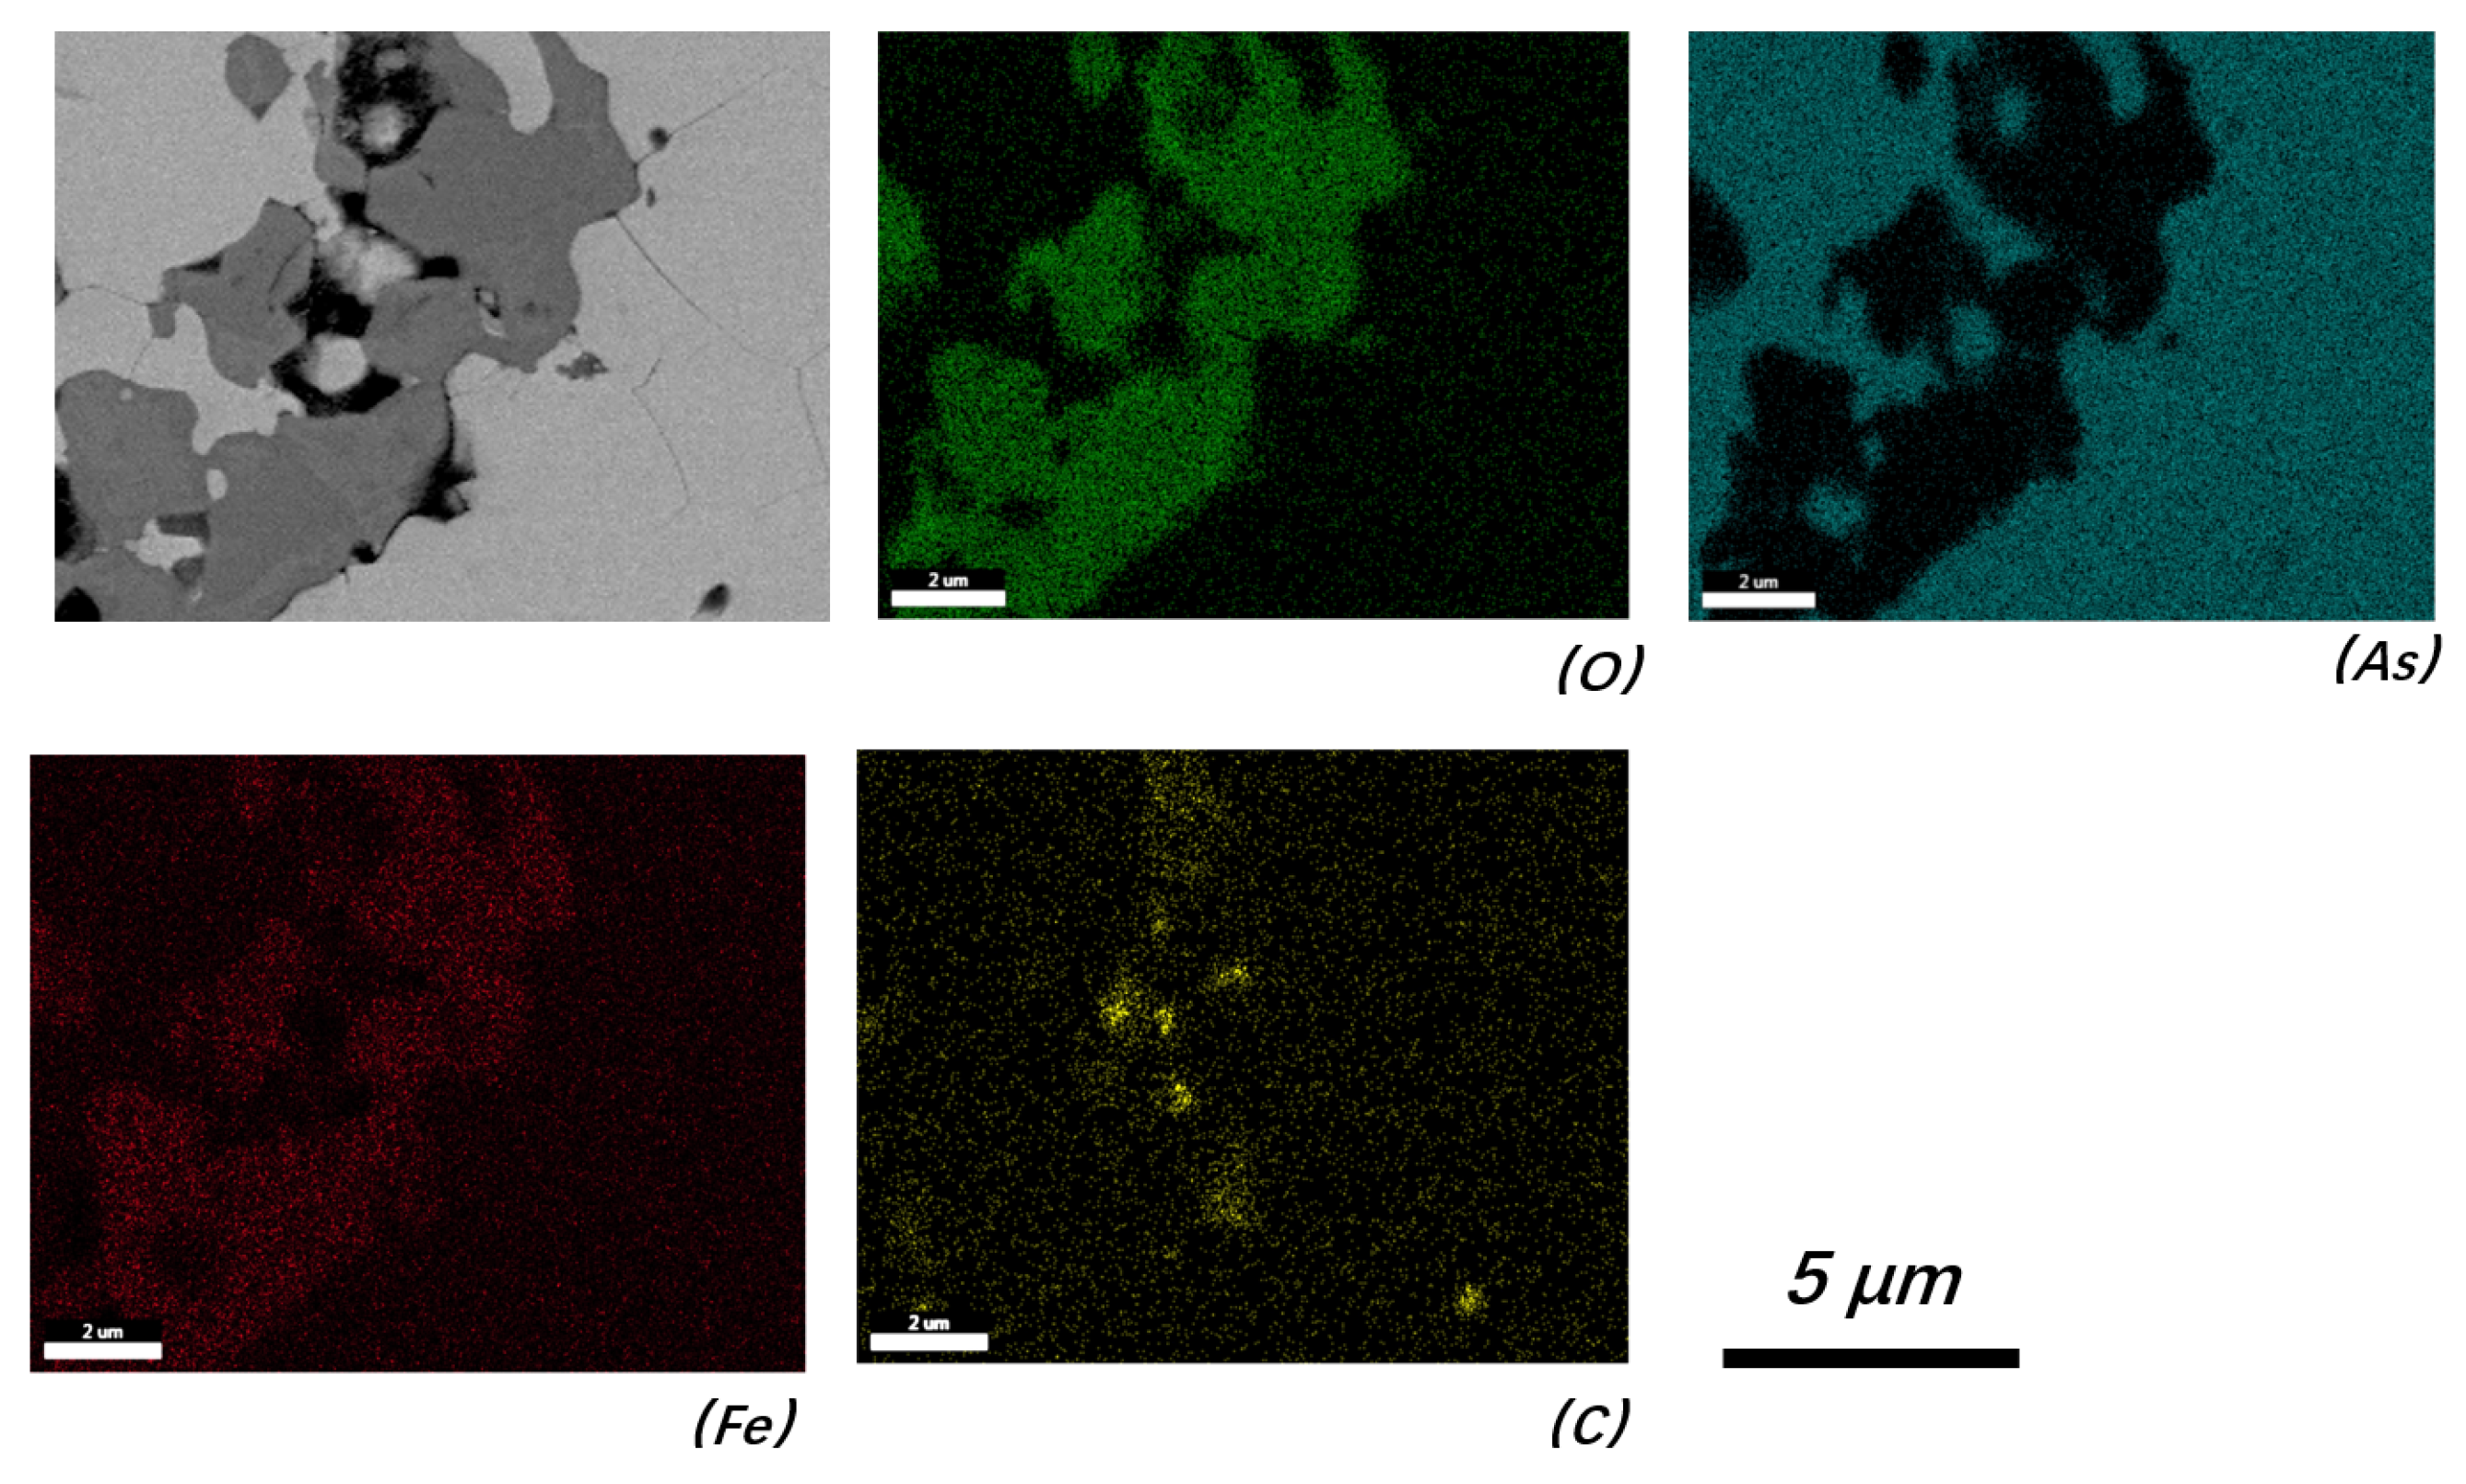
EDS area scanning confirmed the existence of C particles with approximate sizes of 0.4–5 μm in the corrosion system.
Figure 8 shows a typical cross-section near the outer surface of the steel wall (sampled from Position 3 in
Figure 2), where the remaining iron oxide was surrounded by As-based phases, and typical C particles could be observed near the iron-oxide area. The existence of C particles within the corrosion system indicates that, instead of a gaseous C source (CO
2 or CO), the C source could be a solid-state raw material. As the charcoal used for reduction contacted the steel wall directly, the highest corrosion rate occurred in this zone (Position 2 in
Figure 2 and
Figure 3).
Based on the corrosion analysis conducted in this study, C can decrease the eutectic temperature of the system and promote the initial corrosion process. Thus, low-purity products, dust, and unspent charcoal from previous batches should be used with caution, as fine C particles could be enriched in these materials and brought out by gases (such as gaseous arsenic trioxide or elemental arsenic) during heating. The C particles detected within the corroded sample from Position 3 prove this conclusion (no obvious C particles were detected in the initial As2O3).
4. Conclusions
In this study, experiments were conducted to investigate the corrosion process in a steel reactor during elemental As manufacturing. The following conclusions were drawn:
The steel walls near the charcoal zone of the reactors exhibited the highest corrosion velocities, with Fe2As, FeO, and Fe3O4 being the main crystal phases detected near the corrosion perforation area.
In this study, no evidence related to the effects of Sn, Sb, and Se on the corrosion processes was found. The initial corrosion process was attributed to the formation of an Fe–As–C system at the grain boundaries of the steel matrix.
C particles with approximate sizes of 0.4–5 μm were also detected in the corrosion system. These C particles partially originated from reused materials in previous production batches.
Owing to the high processing temperature, O was transferred to the inner matrix before extensive corrosion by elemental As and C.
In this study, we discovered that C particles from initial or reused raw materials promote the initial corrosion of steel reactors by the formation of an Fe–As–C system at the grain boundaries of the steel matrix, which suggests that a standard on fragmentation of carbonaceous materials during the high-temperature reduction and content limitation of C within reused materials is required. Based on the results, an inert atmosphere in the induction furnace is also recommended. Moreover, as few studies have been reported on the thermodynamics and kinetics information of the corrosion process, especially for essential data on Fe–As–C-based systems, which are lacking, related studies will be conducted in the future.
Author Contributions
Conceptualization, X.L. (Xiao Long); methodology, X.L. (Xiao Long), X.L. (Xiang Li) and W.L.; investigation, X.L. (Xiao Long), X.L. (Xiang Li), K.Z., B.F. and J.L.; data curation, J.L., K.Z. and B.F.; writing—original draft preparation, X.L. (Xiao Long), B.F. and K.Z.; writing—review and editing, X.L. (Xiao Long), J.L. and W.L.; funding Acquisition, W.L., X.L. (Xiang Li); All authors have read and agreed to the published version of the manuscript.
Funding
This research was funded by the Natural Science Foundation of Guizhou Province (Qian Ke He Ji Chu MS[2025]201), and Guizhou Institute of Technology high-level talent research launch project [XJGC20190963] and [XJGC20190951], and Central Government-Guided Local Science and Technology Development Fund Project of Guizhou Provence (Qian Ke He Ren Cai XKBF [2025]008).
Institutional Review Board Statement
Not applicable.
Informed Consent Statement
Not applicable.
Data Availability Statement
The original contributions presented in this study are included in the article. Further inquiries can be directed to the corresponding authors.
Conflicts of Interest
The authors declare no conflicts of interest.
Abbreviations
The following abbreviations are used in this manuscript:
| SEM | Scanning electron microscopy |
| EDS | Energy-dispersive spectroscopy |
| XRD | X-ray diffraction |
| XRF | X-ray fluorescence |
References
- Nazari, A.M.; Radzinski, R.; Ghahreman, A. Review of arsenic metallurgy: Treatment of arsenical minerals and the immobilization of arsenic. Hydrometallurgy 2017, 174, 258. [Google Scholar] [CrossRef] [Scilit]
- Fedorov, V.A.; Menshchikova, T.K.; Vargunin, A.I.; Nikonov, K.S.; Brekhovskikh, M.N.; Myslitskii, O.E. Processes for the preparation of high-purity arsenic and its compounds. Inorg. Mater. 2021, 57, 1097–1108. [Google Scholar] [CrossRef] [Scilit]
- Fedorov, V.A.; Menshchikova, T.K.; Nikonov, K.S.; Brekhovskikh, M.N.; Myslitskii, O.E. Features of methods to produce high-purity arsenic. Theor. Found. Chem. Eng. 2023, 57, 644–649. [Google Scholar] [CrossRef] [Scilit]
- Moulins, A.; Andrusyszyn, F.; Dugnani, R.; Zednik, R.J. Indentation fracture toughness of semiconducting gallium arsenide at elevated temperatures. Eng. Fail. Anal. 2022, 137, 106417. [Google Scholar] [CrossRef] [Scilit]
- Mikoushkin, V.M.; Solonitsyna, A.P.; Makarevskaya, E.A. Elemental arsenic in the natural oxide on the MBE GaAs surface. Appl. Surf. Sci. 2020, 504, 144601. [Google Scholar] [CrossRef] [Scilit]
- Ramos-Ruiz, A.; Field, J.A.; Sun, W.; Sierra-Alvarez, R. Gallium arsenide (GaAs) leaching behavior and surface chemistry changes in response to pH and O2. Waste Manag. 2018, 77, 1–9. [Google Scholar] [CrossRef] [Scilit] [PubMed]
- Zhang, Y.L.; Zhan, L.; Xie, B.; Xu, Z.M.; Chen, C. Decomposition of packaging materials and recycling GaAs from waste ICs by hydrothermal treatment. ACS Sustain. Chem. Eng. 2019, 7, 14111–14118. [Google Scholar] [CrossRef] [Scilit]
- Li, L.; Xu, M.; Xiao, Y. Preparation of elemental As from As-Sb fly ash using continuous reductive method with additive of lead oxide. J. Cent. South Univ. 2022, 29, 3003–3015. [Google Scholar] [CrossRef] [Scilit]
- Long, H.; Zheng, Y.J.; Peng, Y.L.; Jin, G.Z.; Deng, W.H.; Zhang, S.C.; He, H.B. Separation and recovery of arsenic and alkali products during the treatment of antimony smelting residues. Miner. Eng. 2020, 153, 106379. [Google Scholar] [CrossRef] [Scilit]
- Wang, Y.; Liu, Y.; Shi, J.; Li, M.; Wang, Y.; Zhang, J. Treatment and recycling of arsenic slag by hydrothermal reduction of As2S3 to As (0). Process Saf. Environ. Prot. 2023, 174, 933–940. [Google Scholar] [CrossRef] [Scilit]
- Yang, K.; Qin, W.; Liu, W. Extraction of elemental arsenic and regeneration of calcium oxide from waste calcium arsenate produced from wastewater treatment. Miner. Eng. 2019, 134, 309–316. [Google Scholar] [CrossRef] [Scilit]
- Qu, S.L. Arsenic Metallurgy; Metallurgical Industry Press: Beijing, China, 2021; p. 93. [Google Scholar]
- Li, F.; Cai, J.; Zhao, X.; Liu, H.; Ju, F.; Li, Y. Research progress in the remediation of arsenic- and cadmium-contaminated groundwater mediated by iron and manganese biomineralization. Catalysts 2025, 15, 570. [Google Scholar] [CrossRef] [Scilit]
- Venegas-Garcia, D.J.; Wilson, L.D. Utilization of bioflocculants from flaxseed gum and fenugreek gum for the removal of arsenicals from water. Materials 2022, 15, 8691. [Google Scholar] [CrossRef] [Scilit] [PubMed]
- Chen, P.; Zhao, Y.; Yao, J.; Zhu, J.; Cao, J. Utilization of lead slag as in situ iron source for arsenic removal by forming iron arsenate. Materials 2022, 15, 7471. [Google Scholar] [CrossRef] [Scilit] [PubMed]
- Fan, J.; Chen, X.; Xu, Z.B.; Xu, X.Y.; Zhao, L.; Qiu, H.; Cao, X.D. One-pot synthesis of nZVI-embedded biochar for remediation of two mining arsenic-contaminated soils: Arsenic immobilization associated with iron transformation. J. Hazard. Mater. 2020, 398, 122901. [Google Scholar] [CrossRef] [Scilit] [PubMed]
- Zhang, Q.Y.; Zhuang, H.S.; Qu, W.Q.; Guo, W. Atlas of Ternary Alloy Phase Diagrams; Chemical Industry Press: Beijing, China, 2022; p. 232. ISBN 9787122409409. [Google Scholar]
- Sawamura, H. New gray cast iron with eutectic graphite structure “S-H cast iron” and its mechanical properties. Mem. Fac. Eng. Kyoto Univ. 1952, 14, 129–144. [Google Scholar]
| Disclaimer/Publisher’s Note: The statements, opinions and data contained in all publications are solely those of the individual author(s) and contributor(s) and not of MDPI and/or the editor(s). MDPI and/or the editor(s) disclaim responsibility for any injury to people or property resulting from any ideas, methods, instructions or products referred to in the content. |