3.1. High-Temperature In Situ XRD
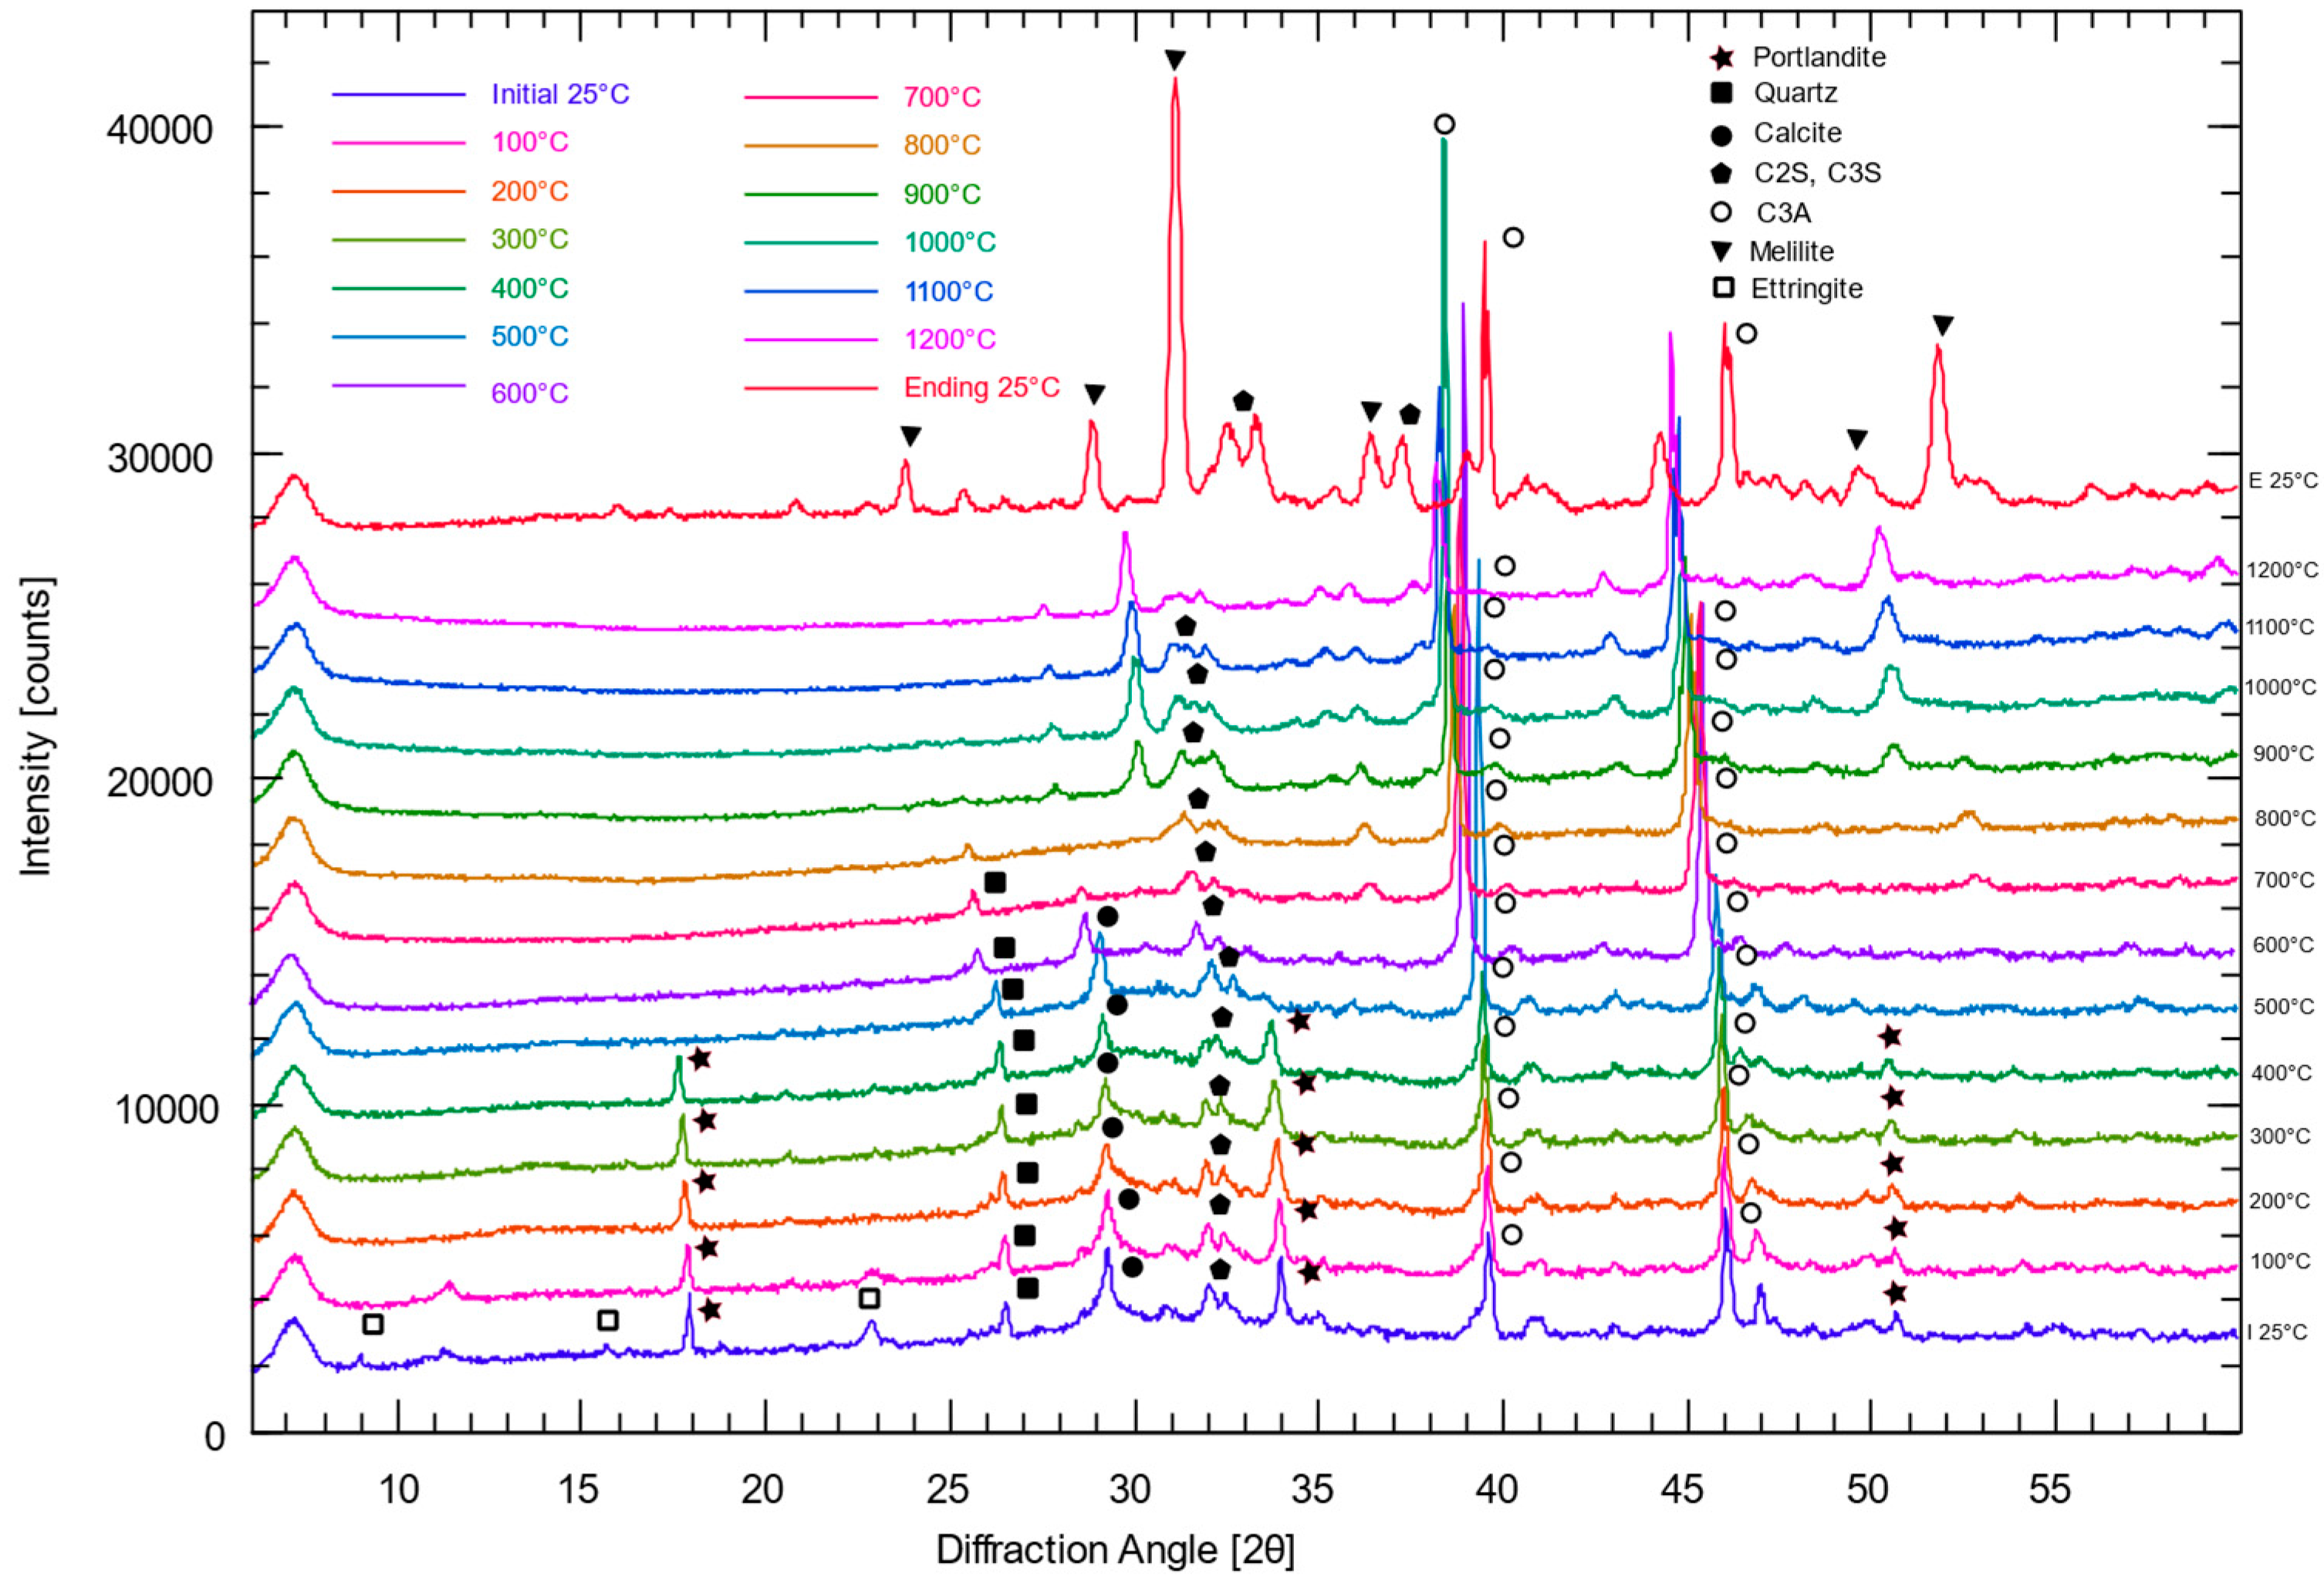
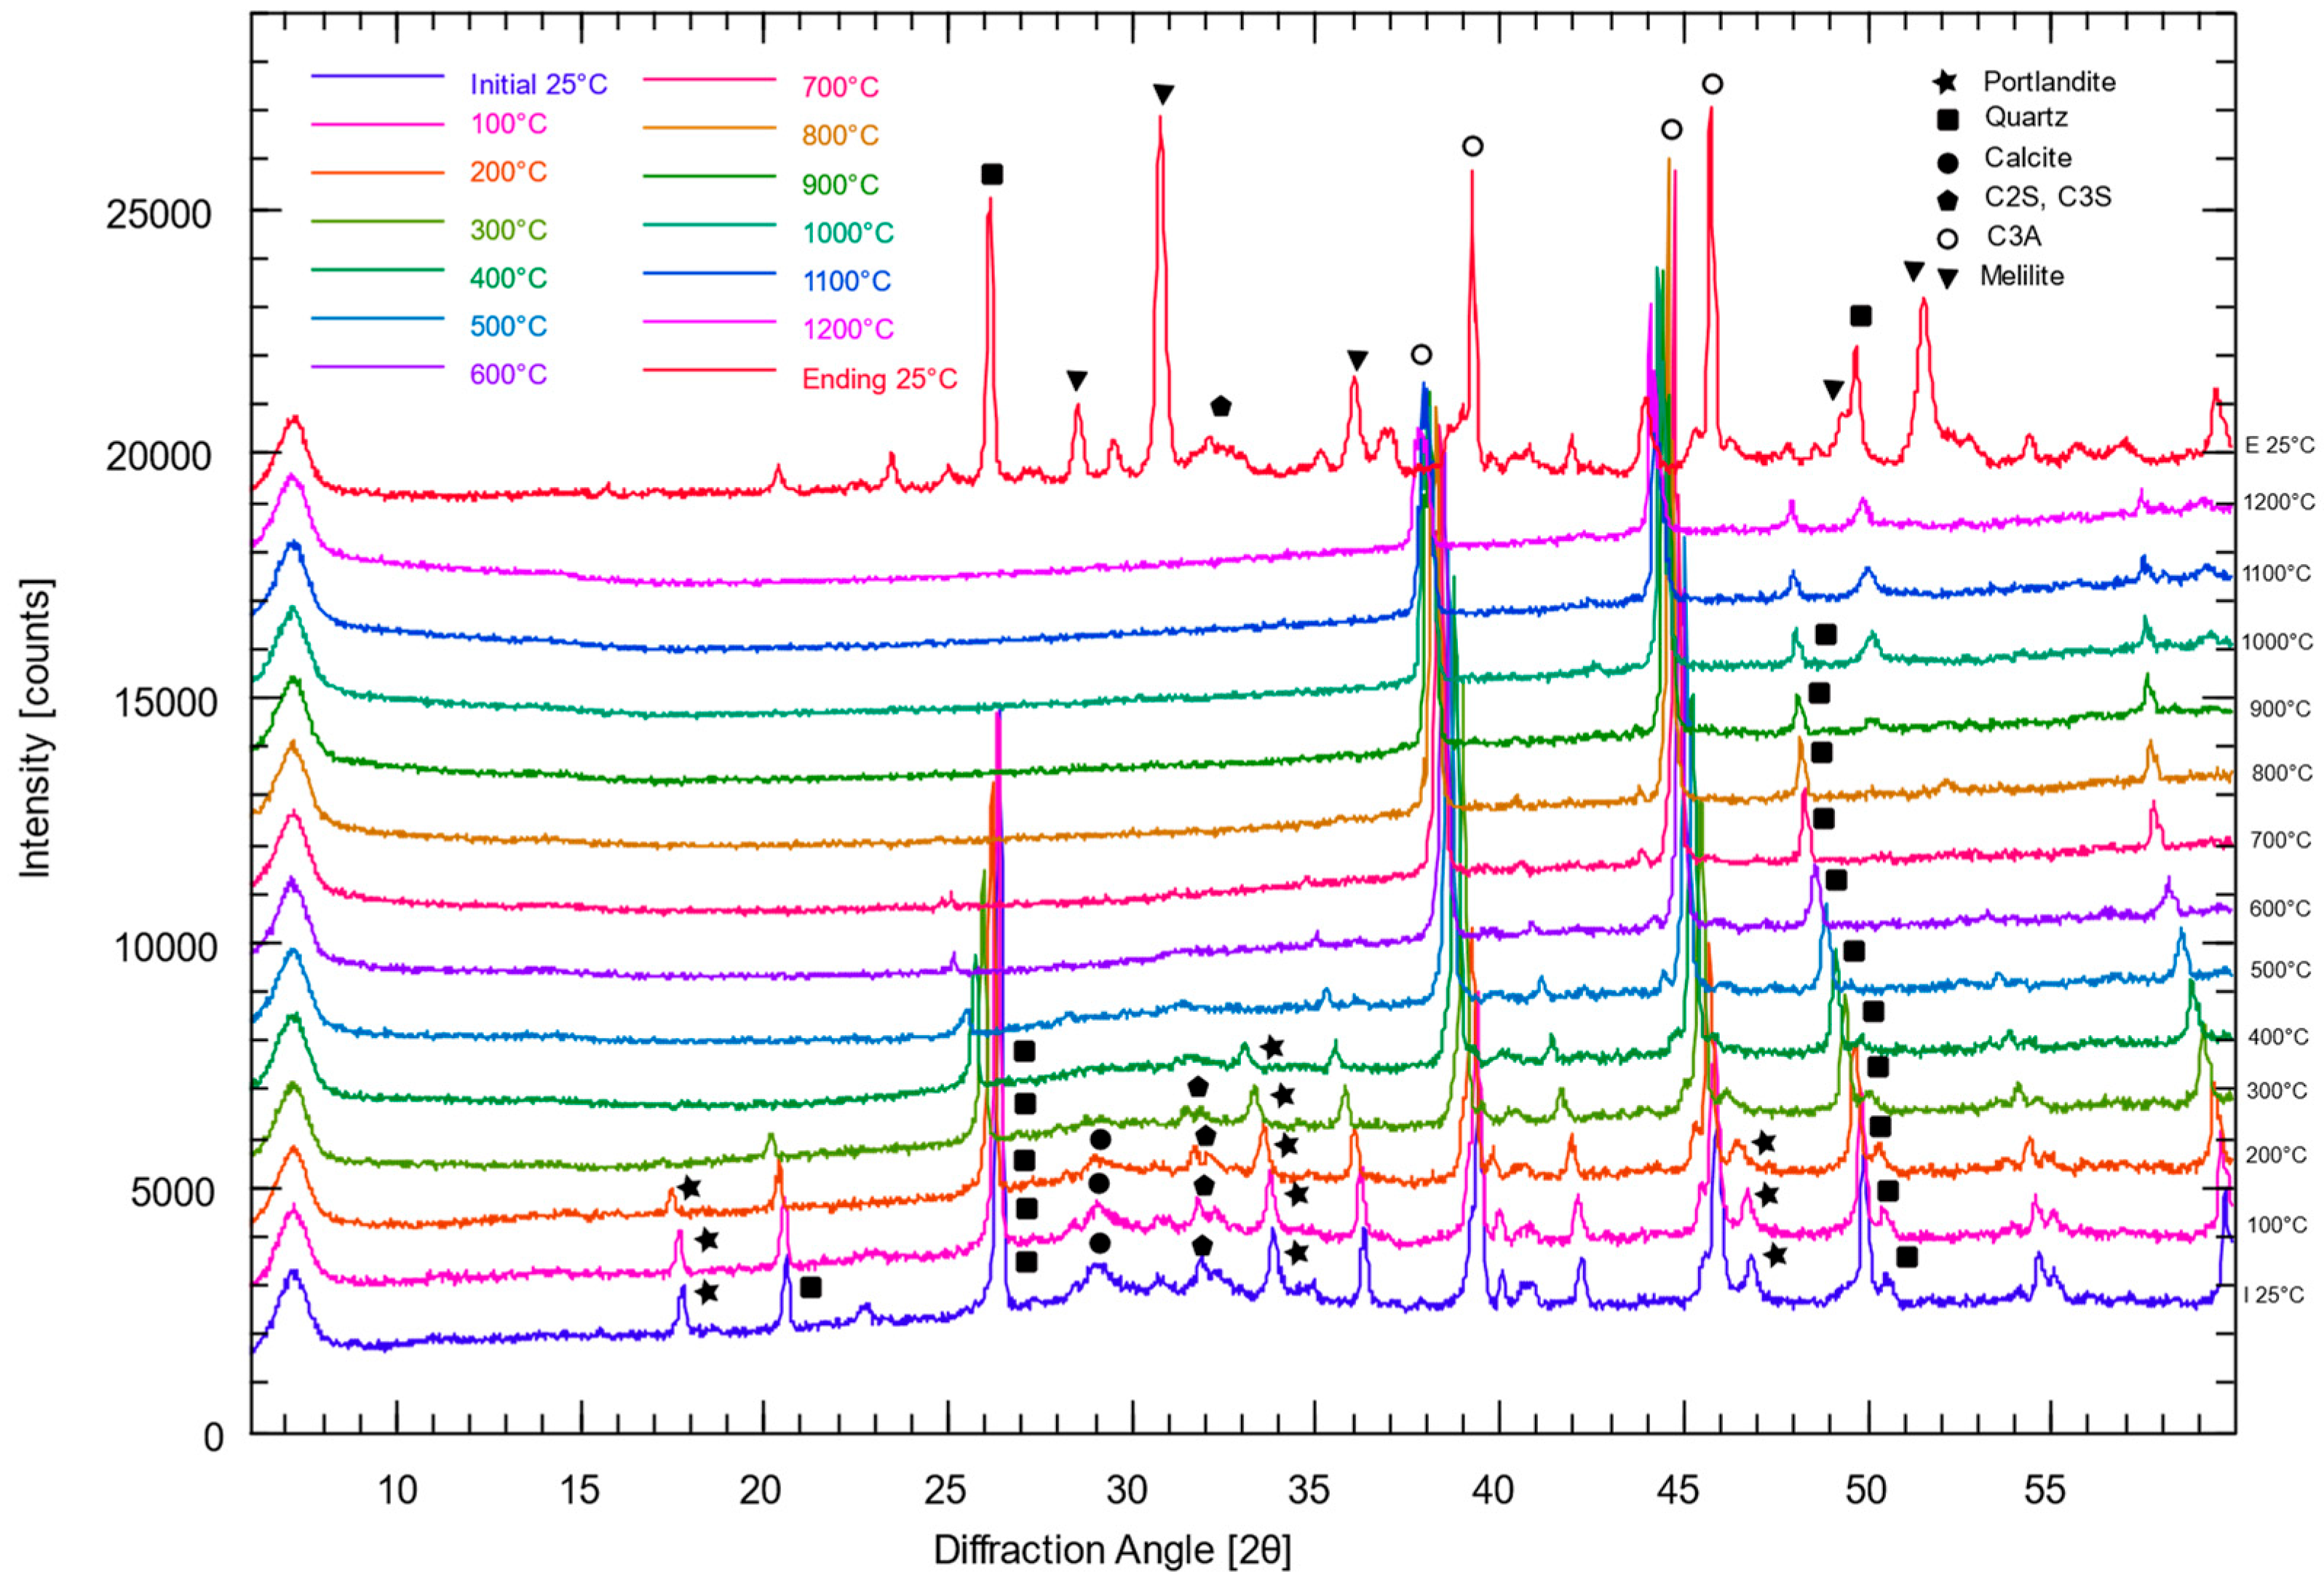
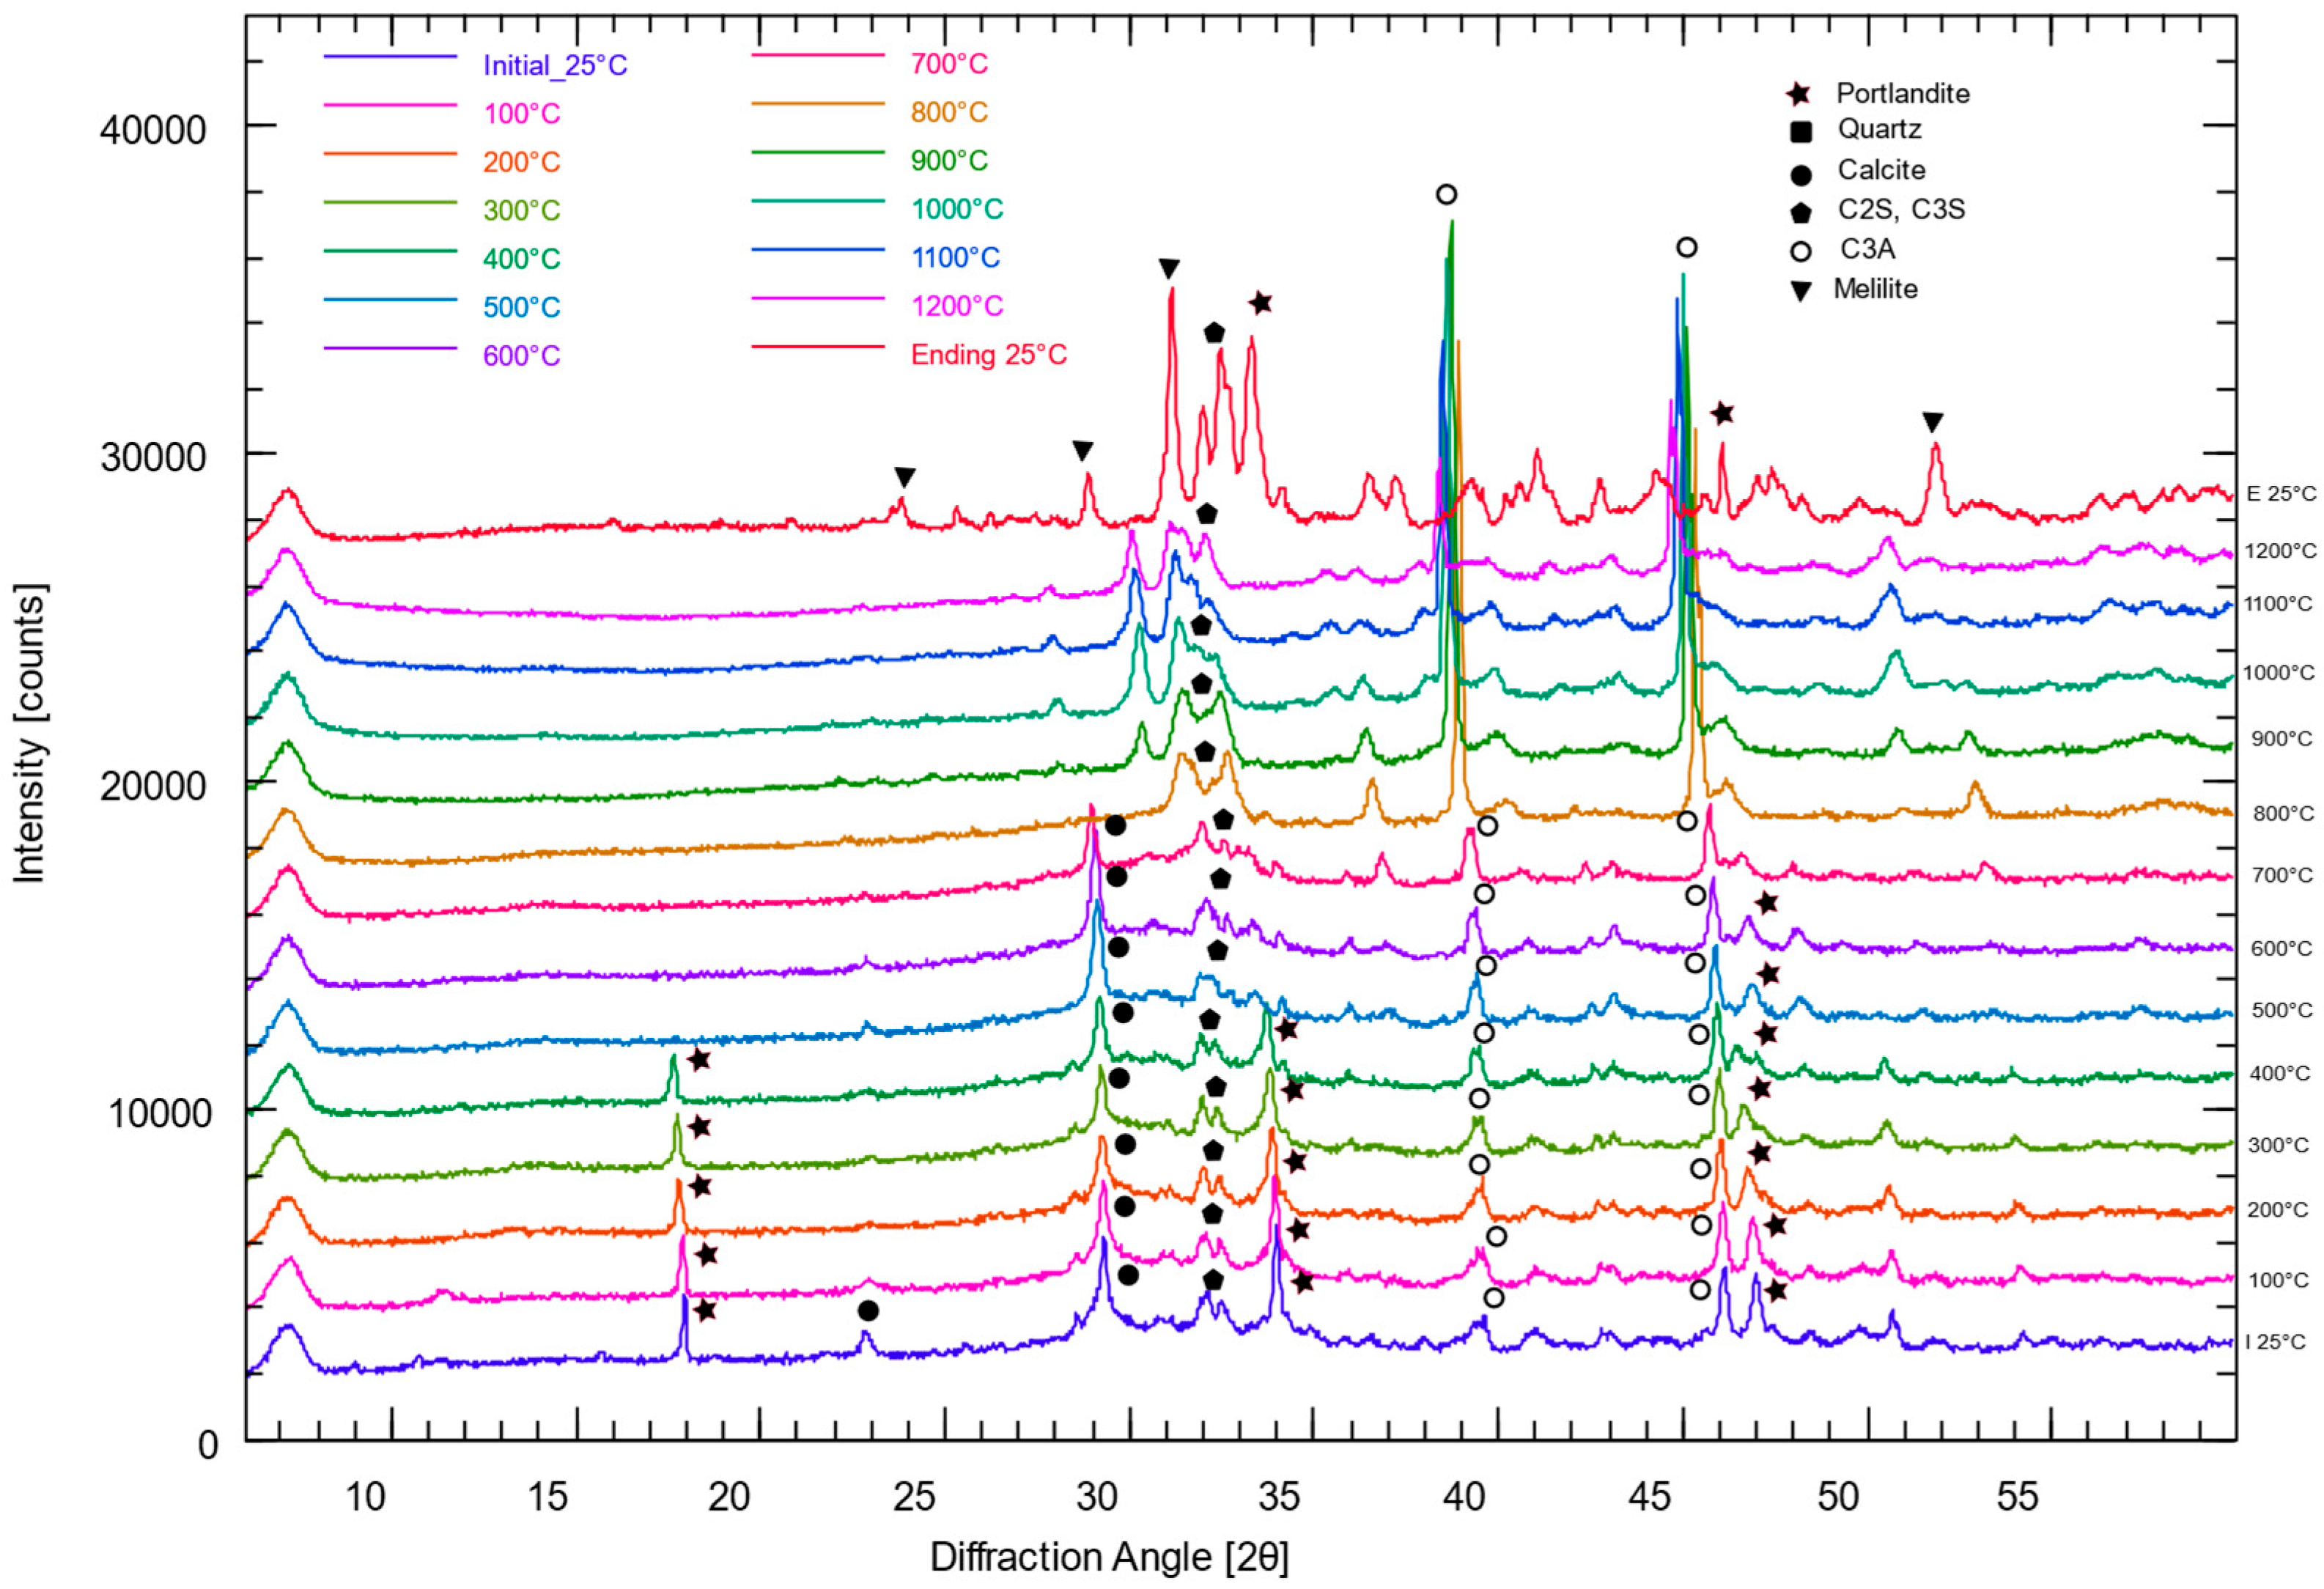
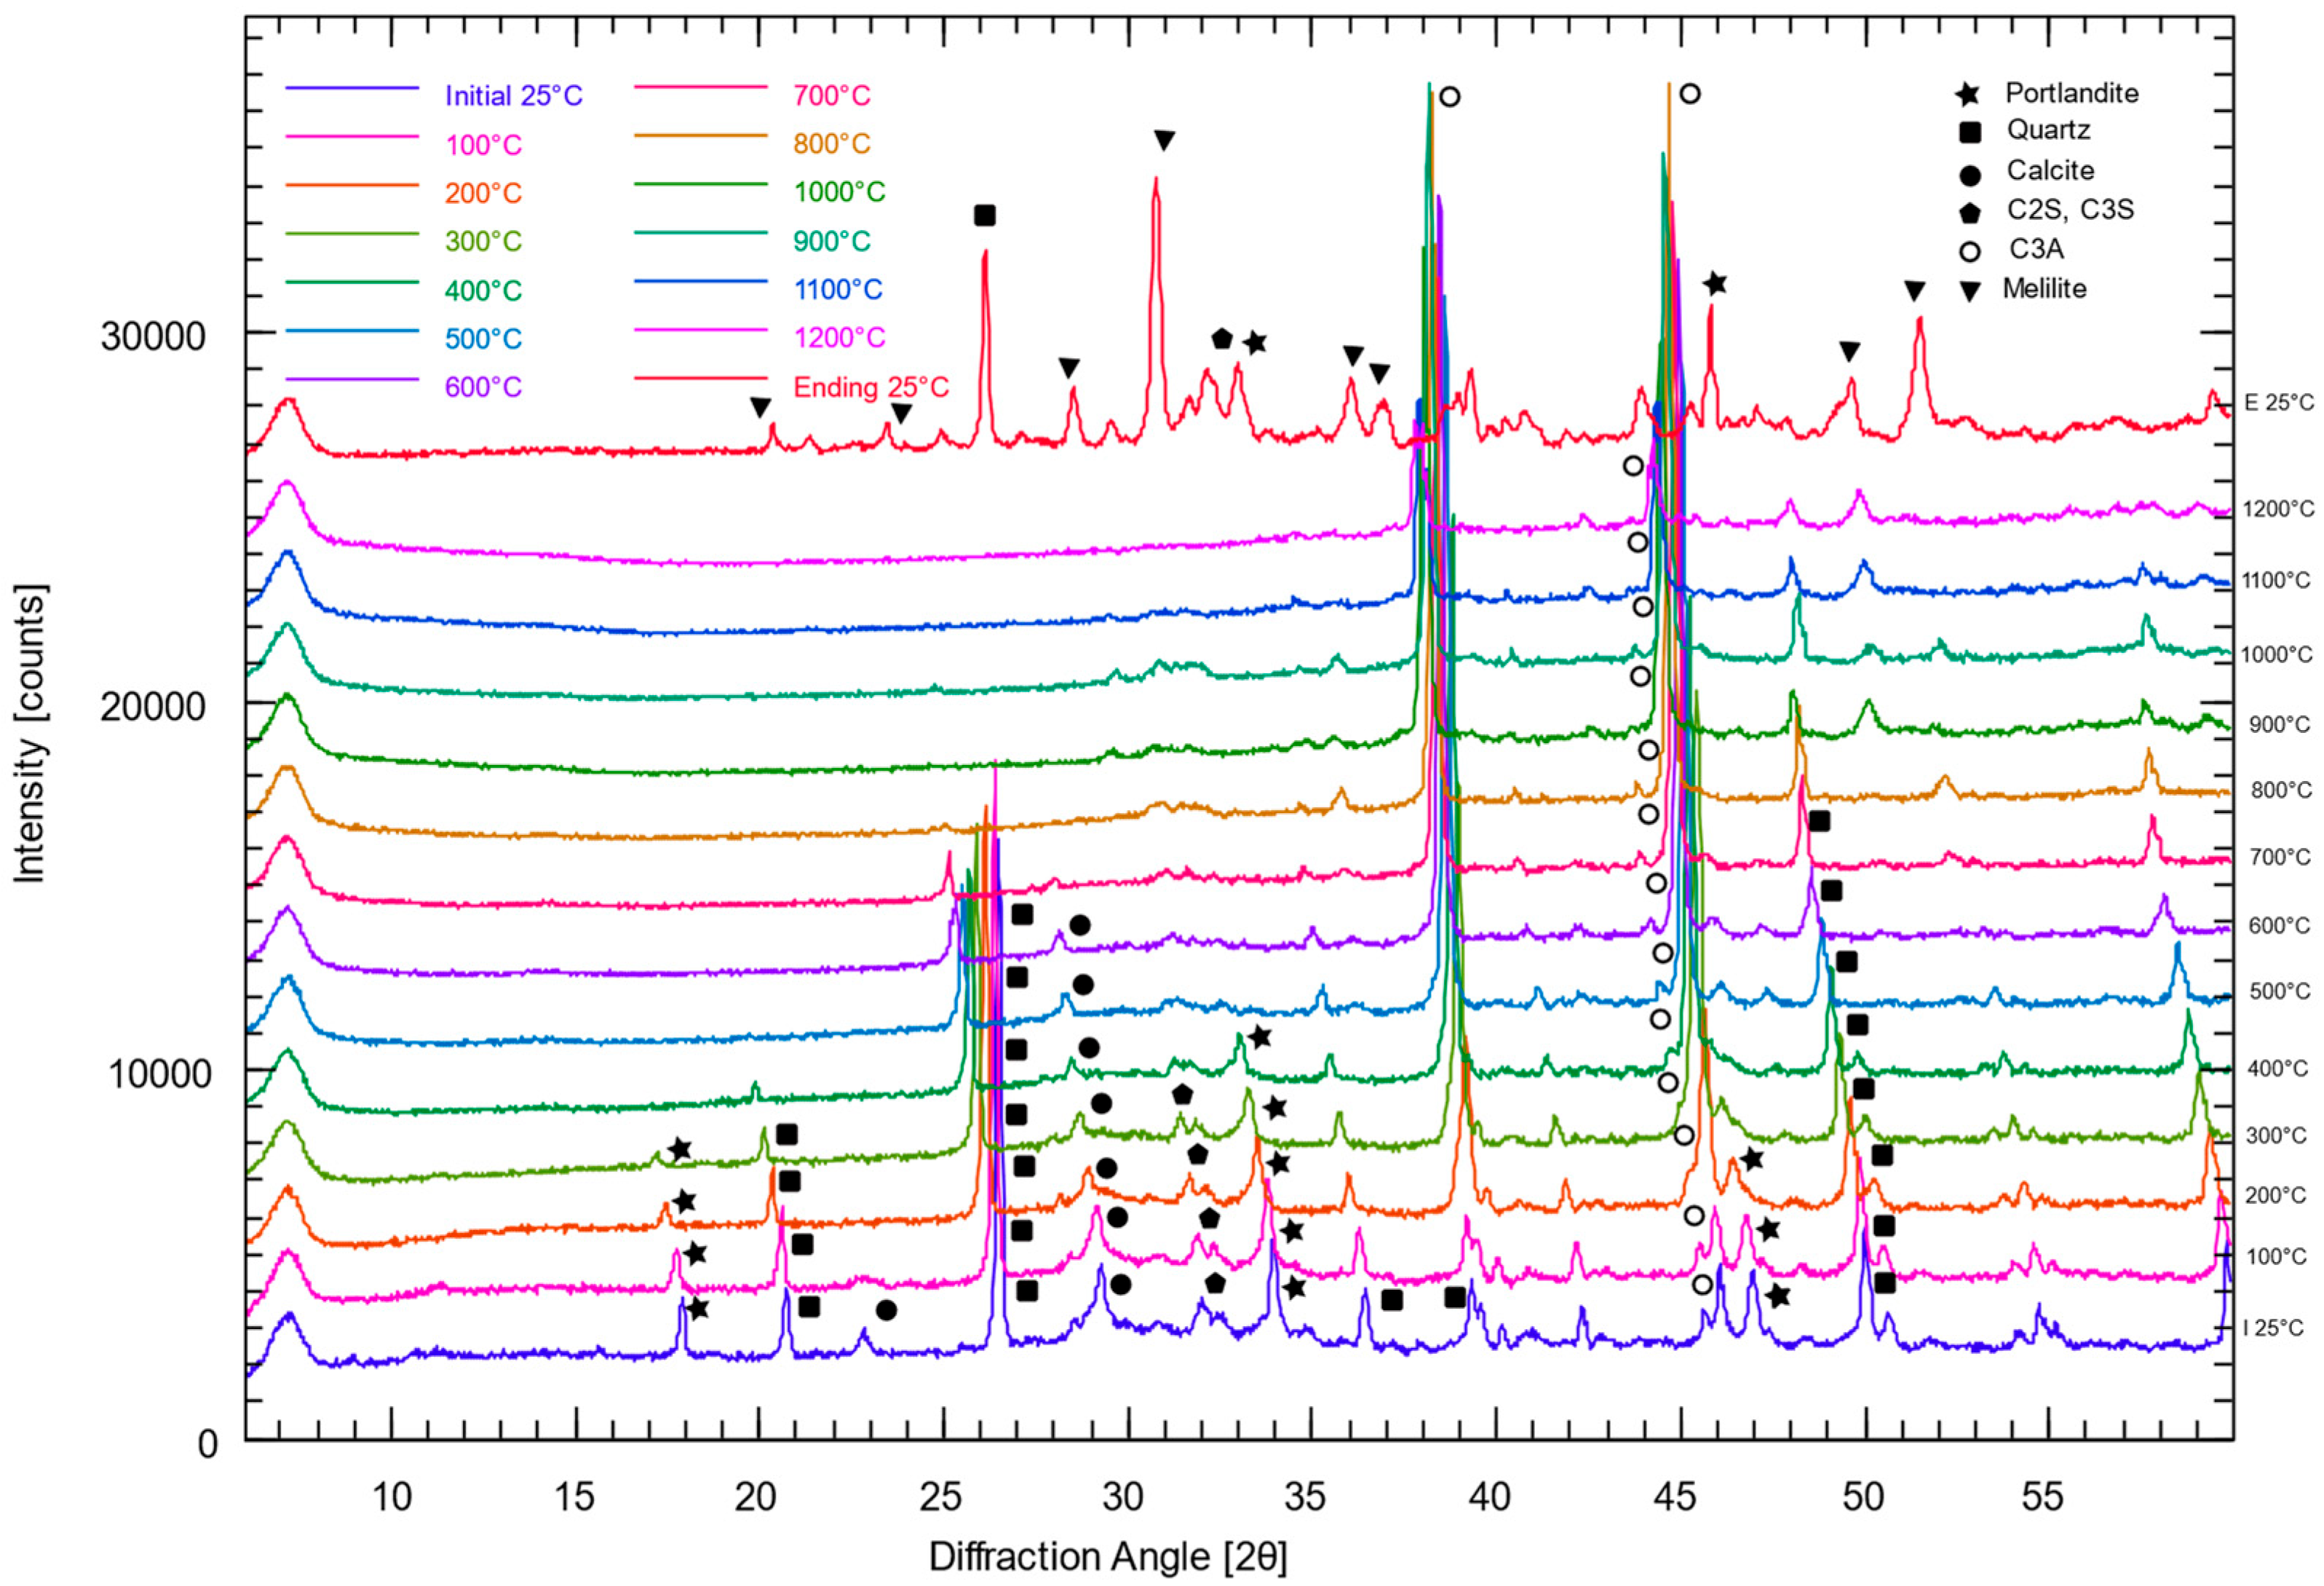
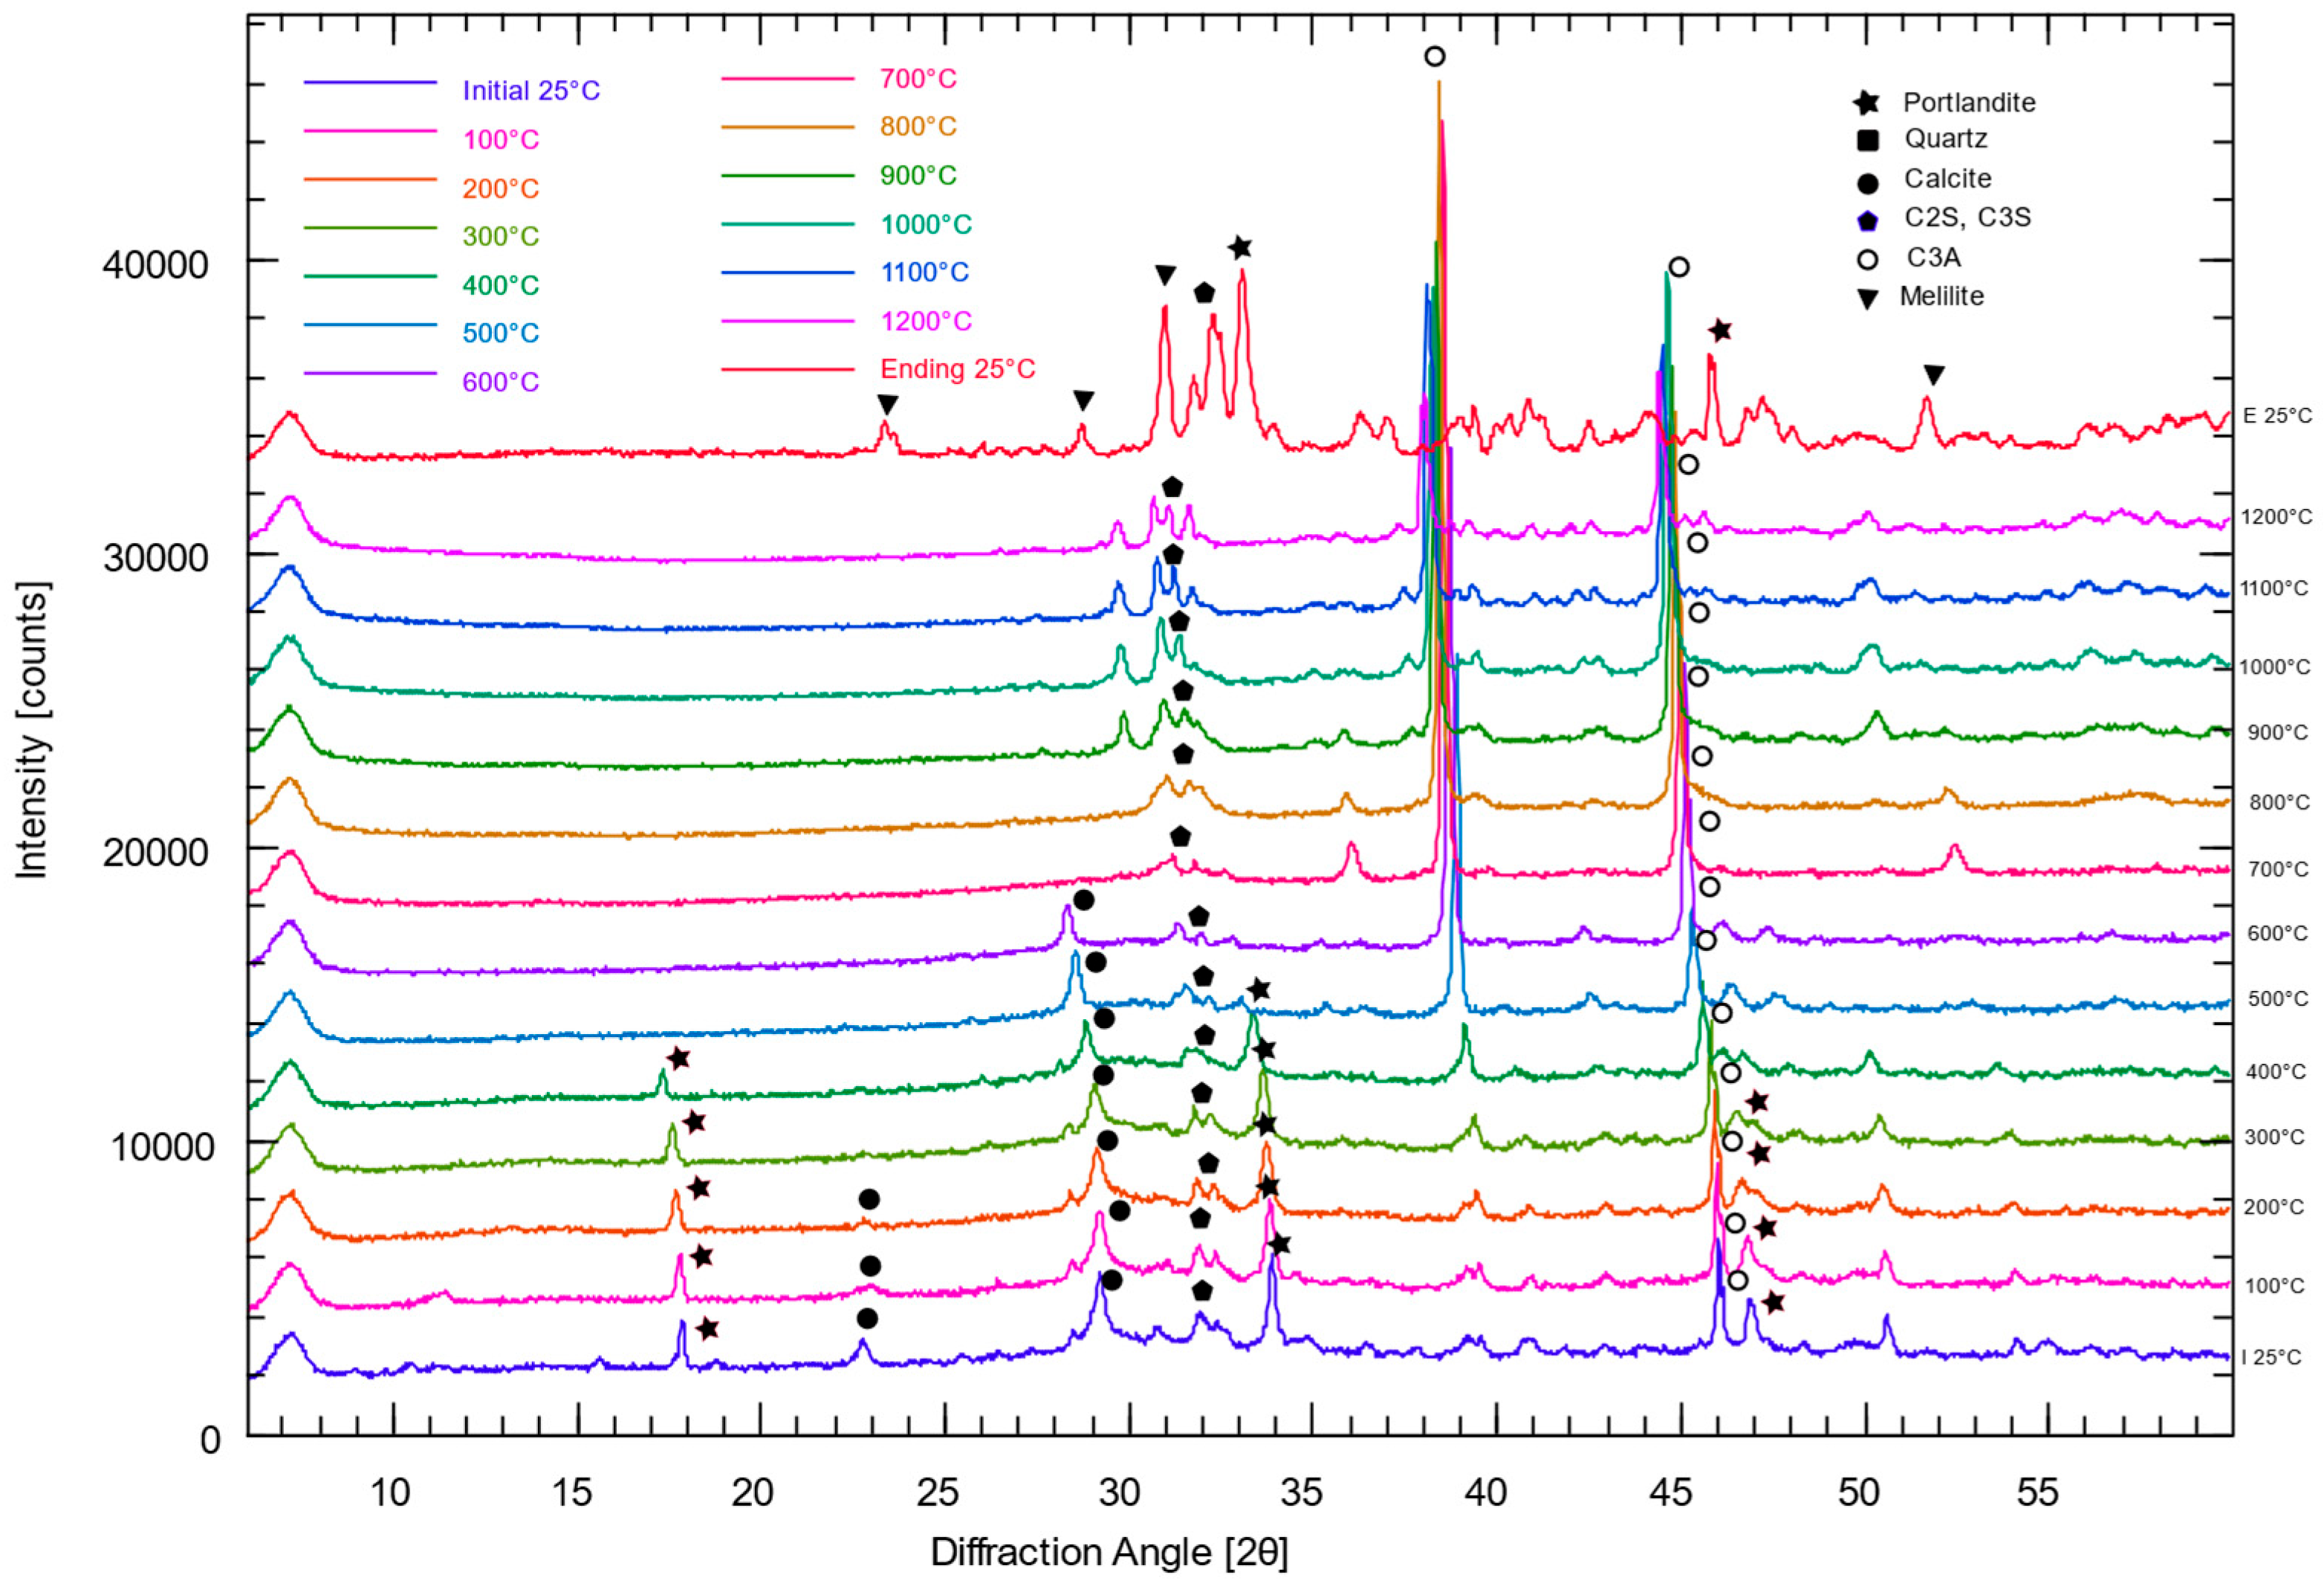
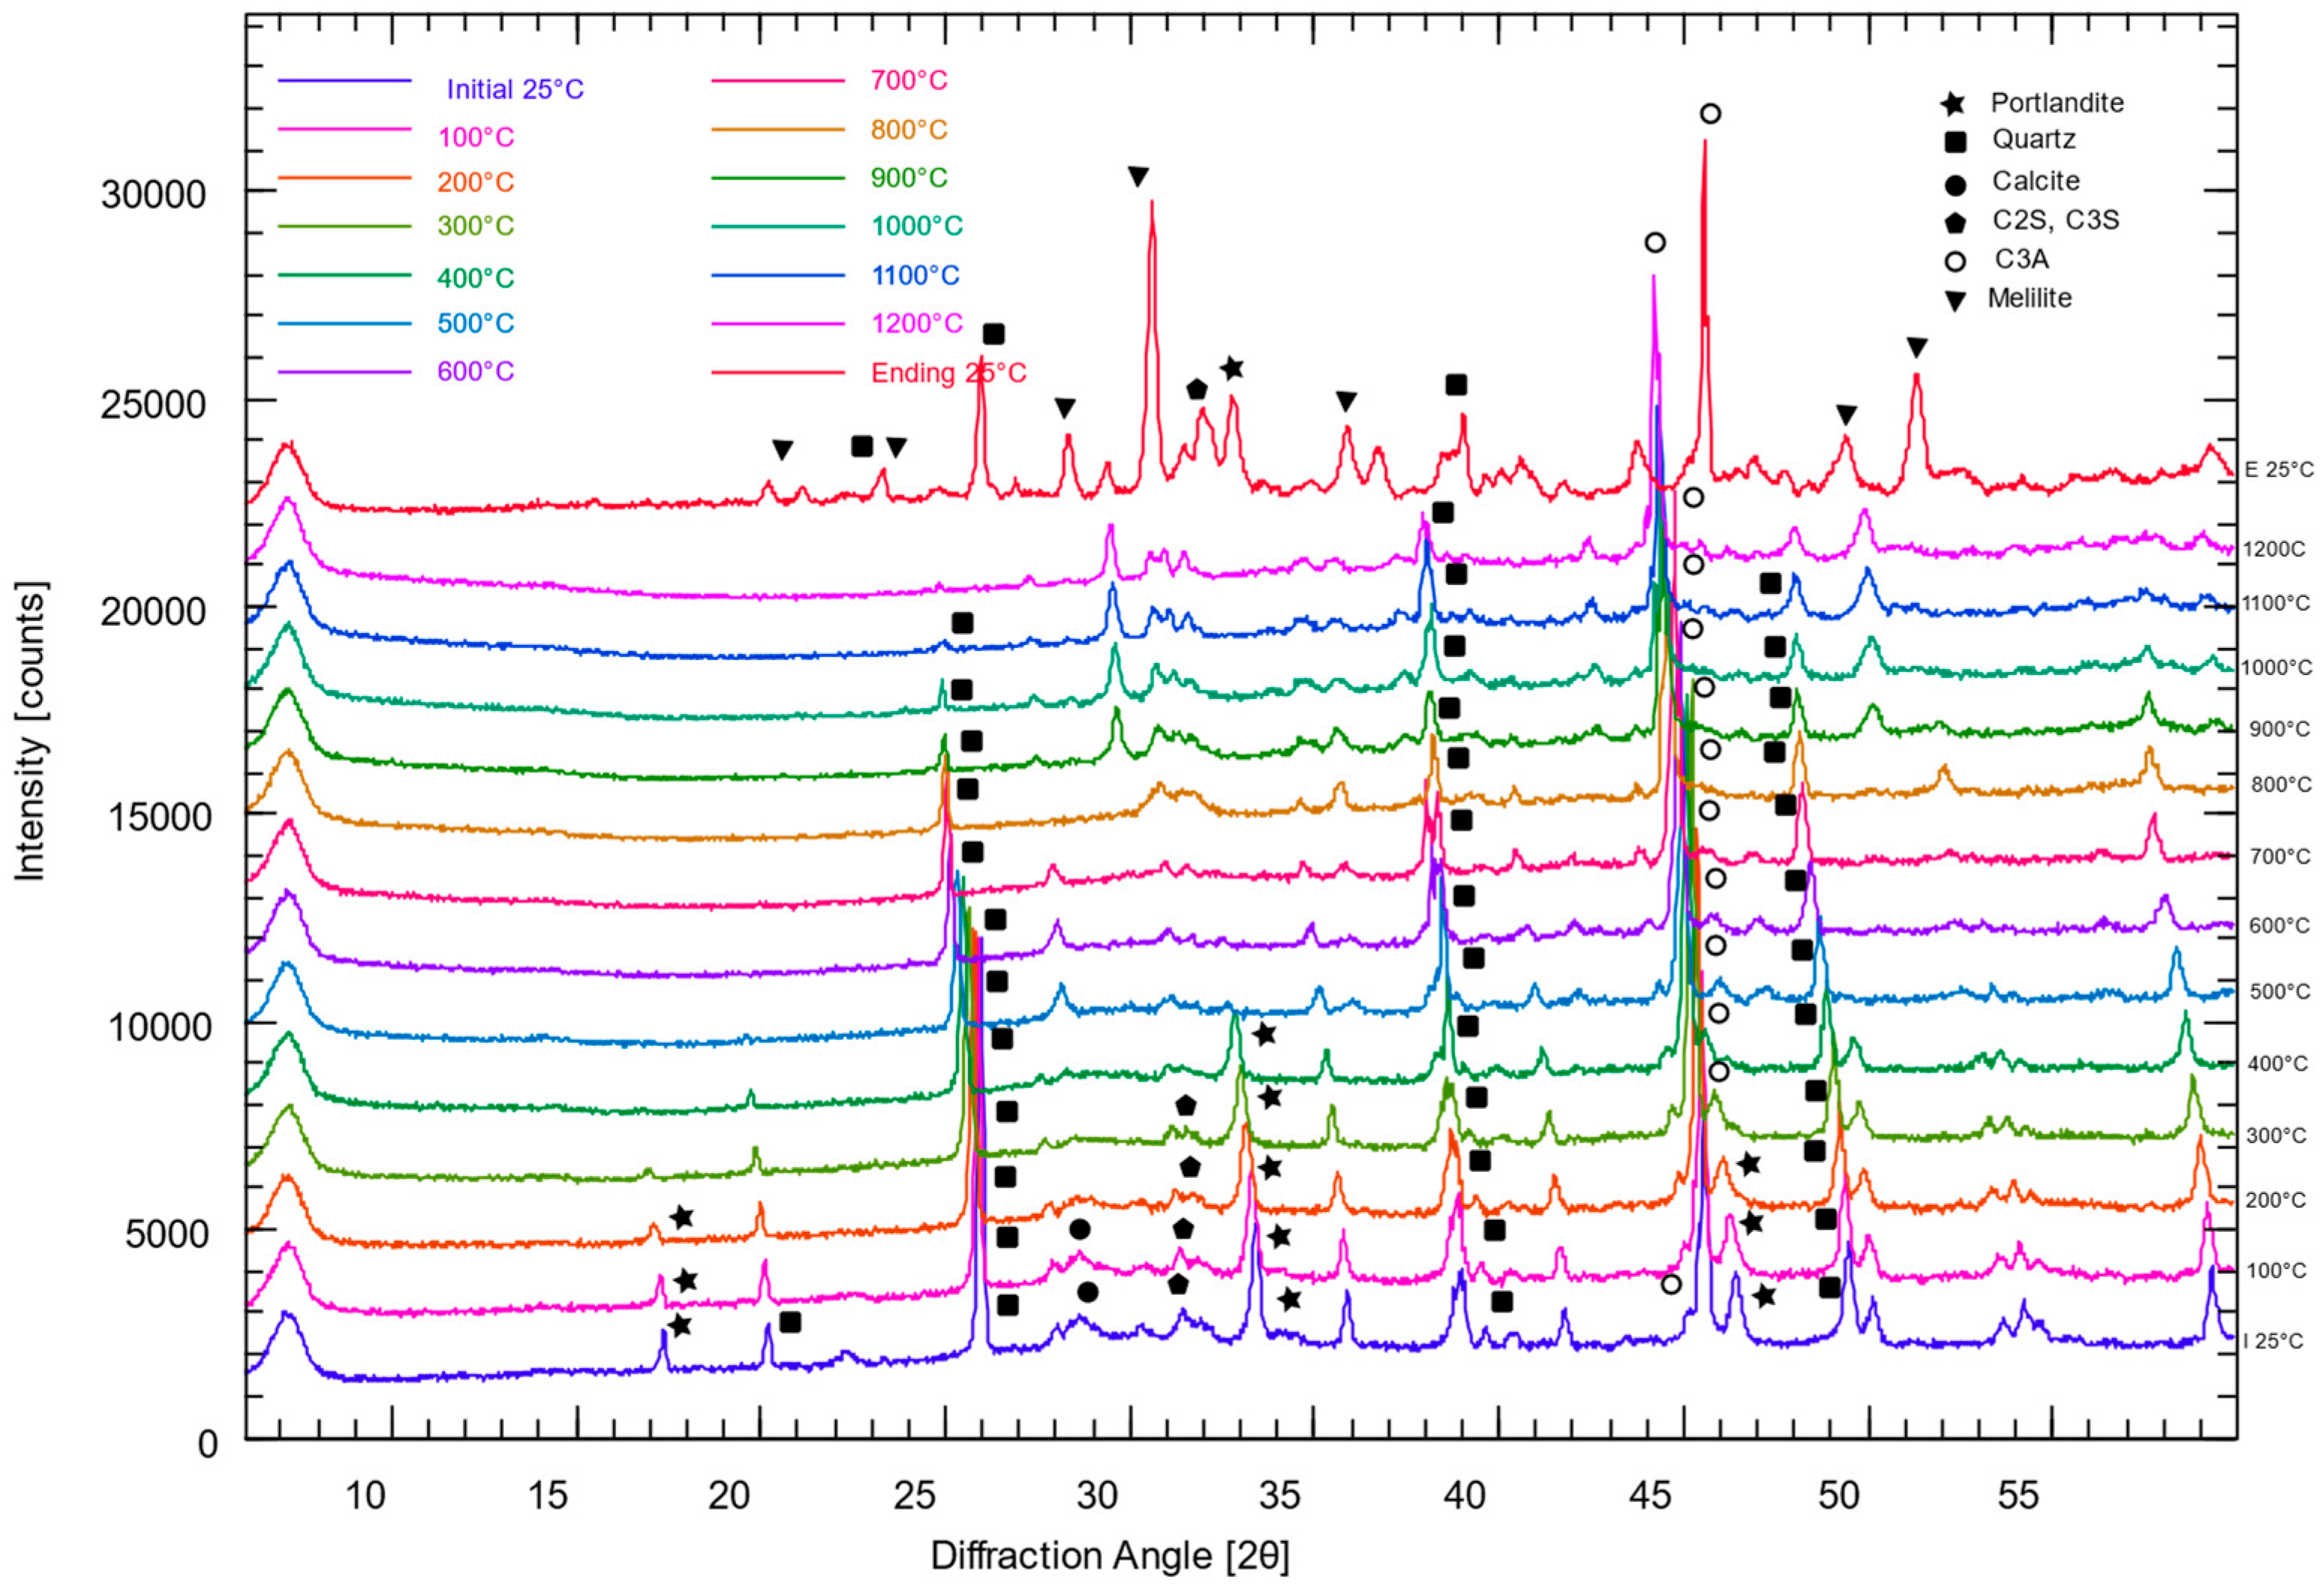
The X-ray diffractograms are shown in
Figure 5,
Figure 6,
Figure 7,
Figure 8,
Figure 9 and
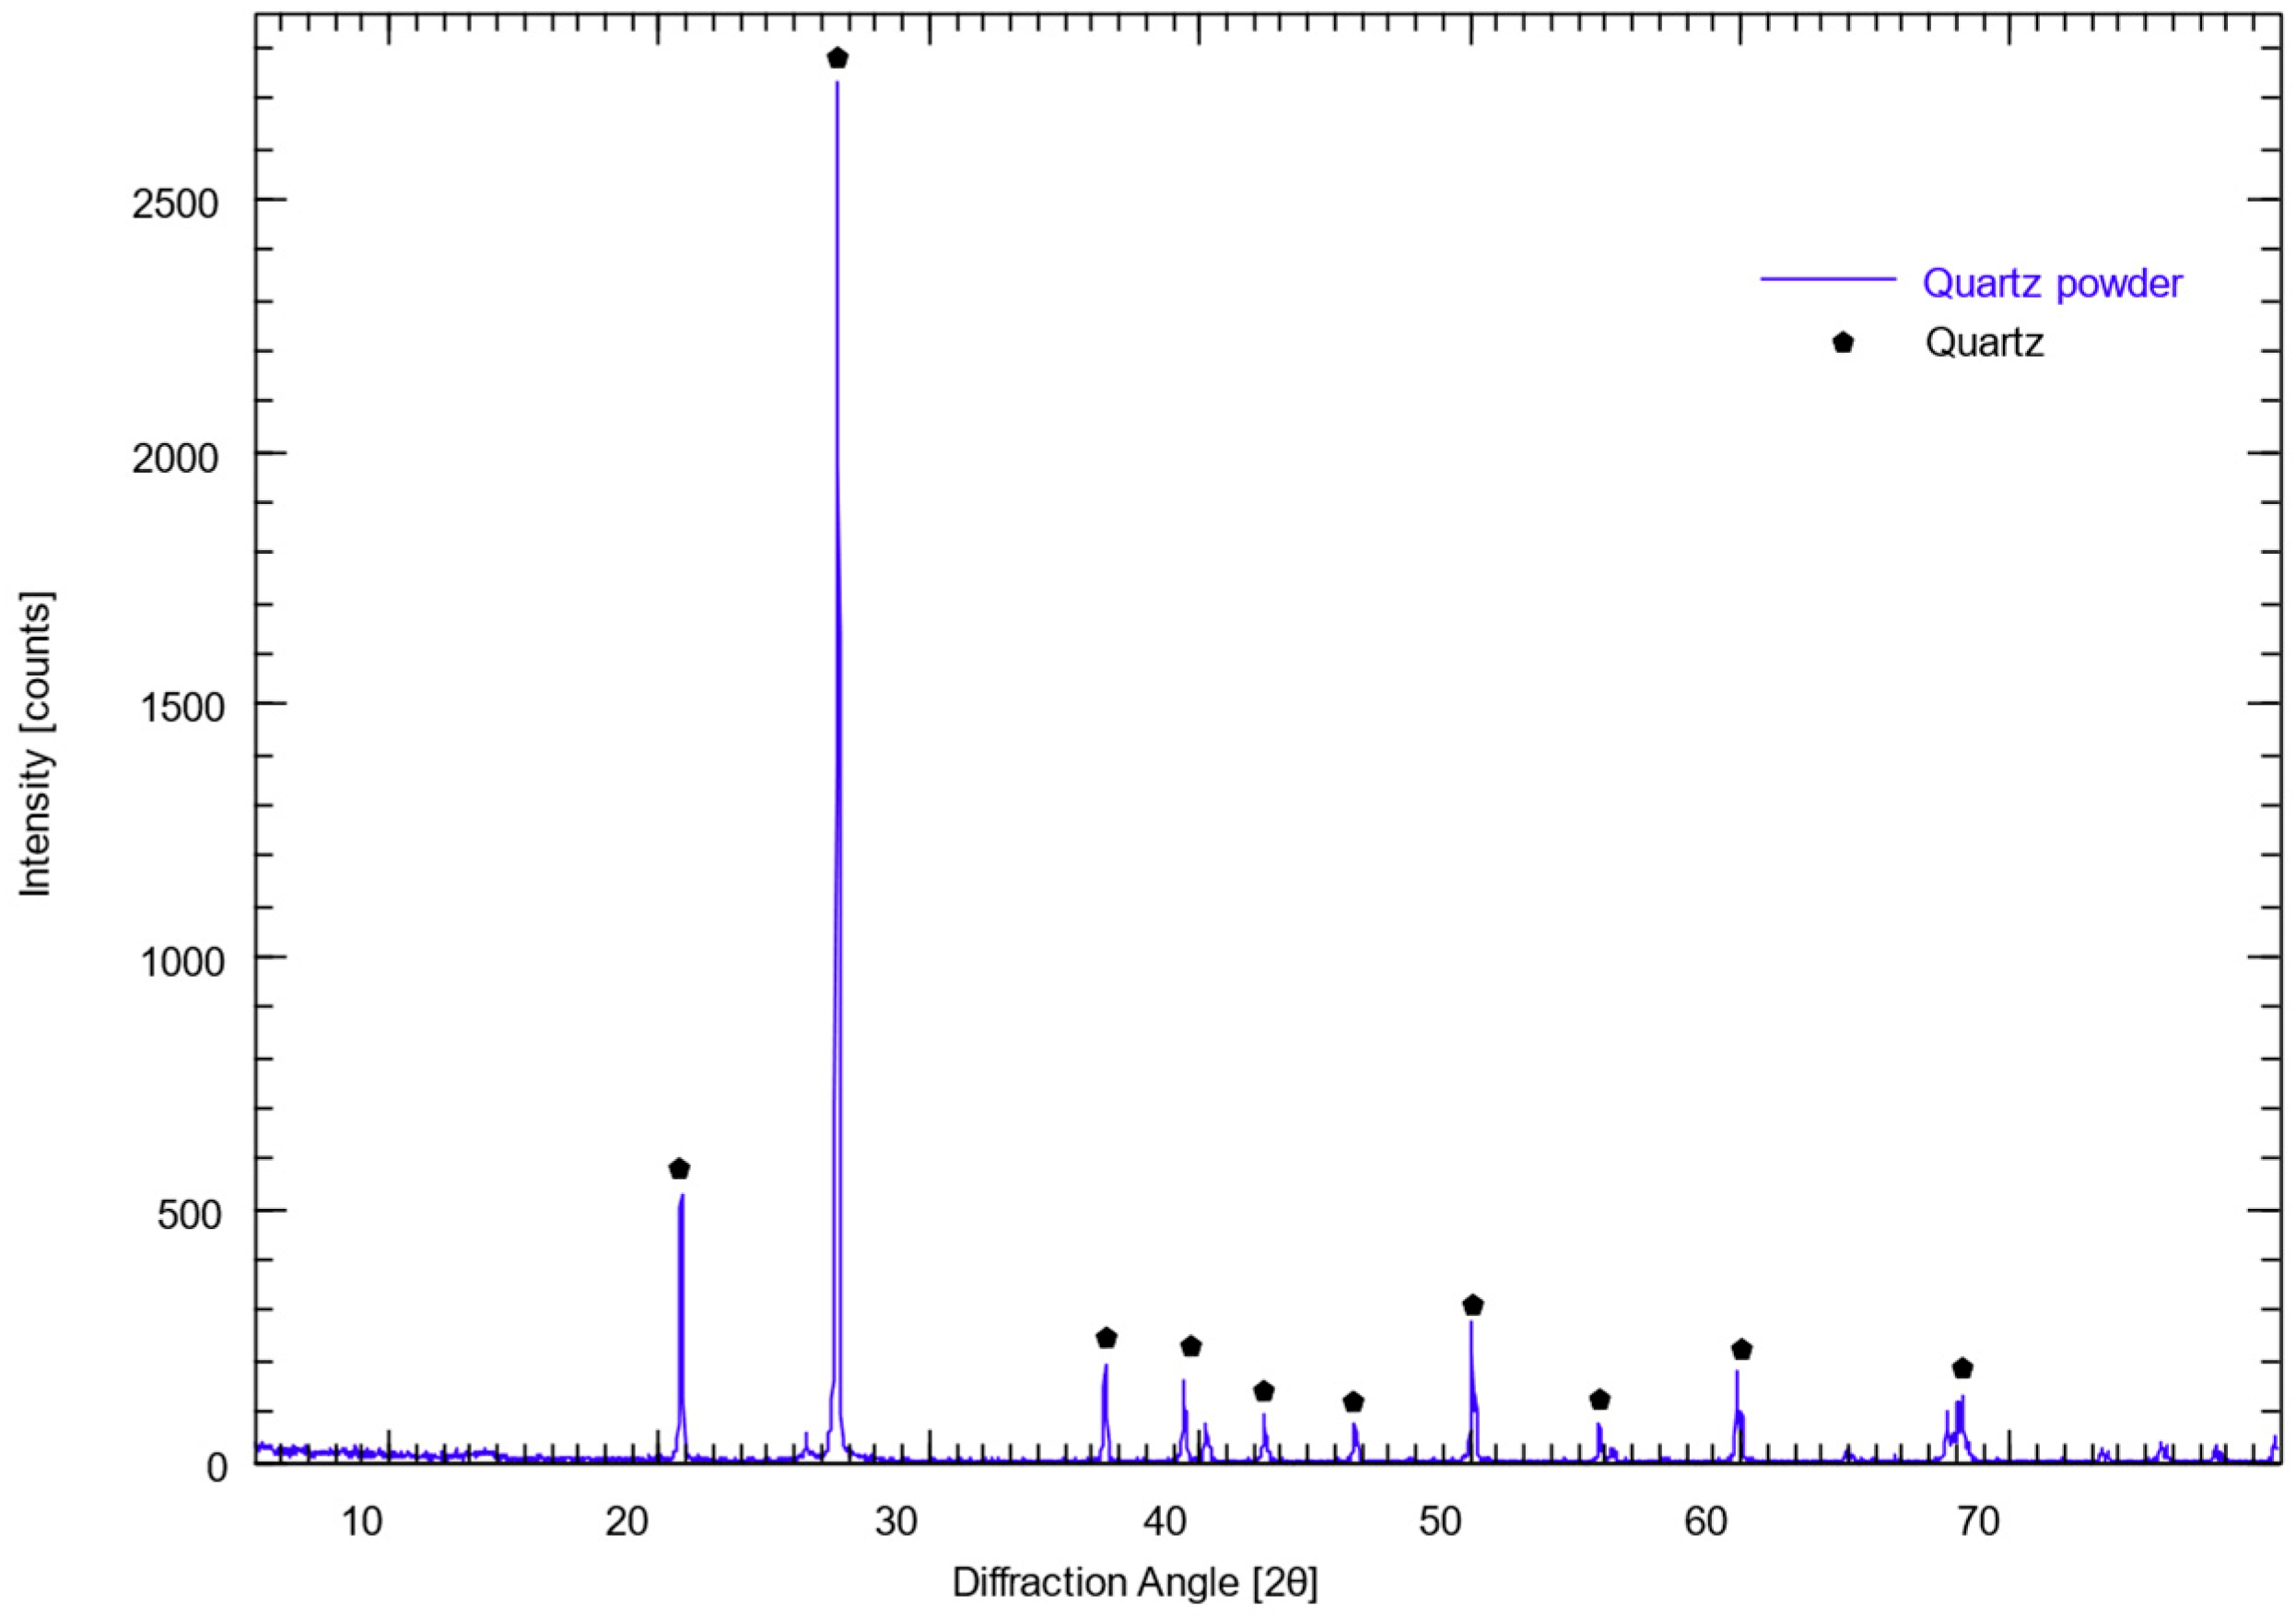
Figure 10. In general, the intensity (peaks) increased around the 25–35° 2θ range because this is where the main diffraction peaks of the crystalline phases present in the cementitious systems occur. The main observed crystalline phases were portlandite (Ca(OH)
2) (2θ ≈ 18.1°), calcite (CaCO
3) (2θ ≈ 29.4°), C
2S (belite), C
3S (alite) (all of them mixed at around 2θ ≈ 34.0°), quartz (2θ ≈ 26.6°), and new phases such as melilite (Ca
2Al(AlSi)O
7 − Ca
2MgSi
2O
7), (2θ ≈ 33.0°) and tricalcium aluminate (C
3A) (2θ ≈ 39.0°). The composition was not quantified due to the limitations of the method described in
Section 2.2.3.
Due to the complex mineralogy of hydrated blended cements, significant peak overlaps occur in the primary 2θ region (29.0–34.0°). In particular, the main diagnostic reflections of newly forming C3A (at 33.2°) and melilite-group phases (at 31.1°) coincide with or lie near the intense diffraction peaks of residual clinker phases (C3S at 30.0°, 32.2°, 34.3° and β-C2S at 32.1°and 32.6°). To confirm the presence of these phases despite these overlaps, secondary non-overlapping diagnostic reflections (e.g., melilite reflection at 24.0°) were monitored in combination with elemental logic from SEM-EDX microanalysis of ex situ samples.
The shift in the peak positions corresponding to the reflections of each phase at different temperatures is caused by thermal expansion, which leads to changes in the angles between atoms within the material, evident from the changes in d-spacings (XRD peaks moving to lower angle) [
27]. The results did not show any significant changes up to 200 °C for samples containing quartz powder (
Figure 6,
Figure 8 and
Figure 10) and 400 °C for mixes containing only cement and GGBFS (
Figure 5,
Figure 7 and
Figure 9). Similar trends were also observed by others. Song et al. [
28] reported that the decomposition of cementitious phases occurred at characteristic temperatures, influenced by phase interactions. Ettringite (81–91 °C) and AFm (129–138 °C) dehydrated early, C-S-H lost water between ~80 and 240 °C and began structural breakdown at 615–630 °C, correlating with strength loss above ~620 °C, while hydrogarnet decomposed around 241–244 °C. Ca(OH)
2 dehydrated between 411 and 427 °C but remained partially stable near 440 °C, and CaCO
3 decomposed at 648–691 °C, with coexisting phases generally decomposing at lower temperatures than their pure counterparts.
When the paste samples without quartz powder reach temperatures > 600 °C, the calcite peak (CaCO
3) (2θ ≈ 29.4°) disappeared (
Figure 5,
Figure 7 and
Figure 9);
Table 5. At that temperature, it decomposes and releases carbon dioxide.
The decomposition of calcite results in the deposition of CaO, which can lead to increased porosity and potentially reduce the material’s mechanical strength [
29] and can react during further heating with silicates present in the cement to form new high-temperature phases as discussed below.
The calcite reflections in samples containing quartz powder (
Figure 6,
Figure 8 and
Figure 10) broaden and drop below the XRD detection limit at temperatures as low as 300 °C. While well-crystallized calcite typically decomposes between 600–800 °C, Igami et al. [
30] attributed low-temperature CO
2 release (300–400 °C) to reactions involving metastable or amorphous carbonate phases. However, the disappearance of diffraction peaks in our XRD data primarily reflects a loss of long-range crystalline order rather than confirmed chemical decomposition, which would require complementary TG/DSC or gas evolution analysis to verify. In these formulations, this earlier decline in reflection intensity is further driven by binder dilution and a higher effective water-to-binder ratio.
A similar trend was observed for portlandite (2θ ≈ 18.1°);
Table 6. In samples without quartz (
Figure 5,
Figure 7 and
Figure 9), all peaks are visible up to 400 °C. However, in samples containing quartz (
Figure 6,
Figure 8 and
Figure 10), peaks are only visible up to 200 °C. As the temperature increases, the intensity and integrals of the peaks decrease, indicating gradual decomposition. This behavior is also influenced by the mixtures’ higher water coefficient and lower binder content. Mentioned decomposition releases H
2O, which can increase porosity and, as a result of the subsequent release of CO
2 from the calcite, potentially lead to flaking.
The sample containing CEM II/B-V 32.5 R and GGBFS (
Figure 5) exhibits a progressive reduction in primary reflection intensities starting around 700 °C, followed by the emergence of new high-temperature crystalline peaks by 900 °C. For the corresponding mixture containing quartz powder (
Figure 6), a significant attenuation and loss of reflection intensities occur at lower temperatures (around 600 °C); however, well-defined crystalline reflections are fully restored upon cooling to ambient temperature.
In contrast, the sample containing CEM I 42.5 N and GGBFS (
Figure 7) remains structurally more stable, with C
3S and C
2S reflections remaining discernible up to 1200 °C, alongside the formation of new crystalline phases by 900 °C. In the corresponding quartz-bearing formulation (
Figure 8), a marked drop in reflection intensities is observed as early as 500 °C, with sharp crystalline reflections similarly reappearing upon cooling to ambient temperature.
Similarly, the sample containing CEM I 52.5 R and GGBFS (
Figure 9) maintains distinct crystalline reflections up to 700 °C before new high-temperature phases begin to form at 900 °C. In the quartz-containing mixture (
Figure 10), the attenuation of primary reflections occurs at 500 °C, with reflection intensities recovering notably by 800 °C.
The primary diagnostic reflection of quartz is located at 2θ ≈ 26.6° (
Figure 6,
Figure 8 and
Figure 10). In samples containing GGBFS combined with CEM II/B-V 32.5 R or CEM I 42.5 N, a marked reduction and broadening of this quartz reflection intensity occurs around 700 °C. Upon cooling to ambient temperature, the peak intensity is fully restored. In the mixture containing GGBFS and CEM I 52.5 R, this attenuation of the quartz reflection becomes pronounced at temperatures above 1000 °C. Rather than structural amorphization, this behavior is influenced by thermal effects, structural expansion, micro-cracking, and the displacive α-β quartz polymorphic transition occurring at approximately 573 °C [
31,
32,
33]. α-quartz, stable below this temperature, possesses a trigonal crystal structure, whereas β-quartz, stable above 573 °C, exhibits a hexagonal structure. This polymorphic transformation is rapid and fully reversible, accompanied by significant anisotropic thermal expansion.
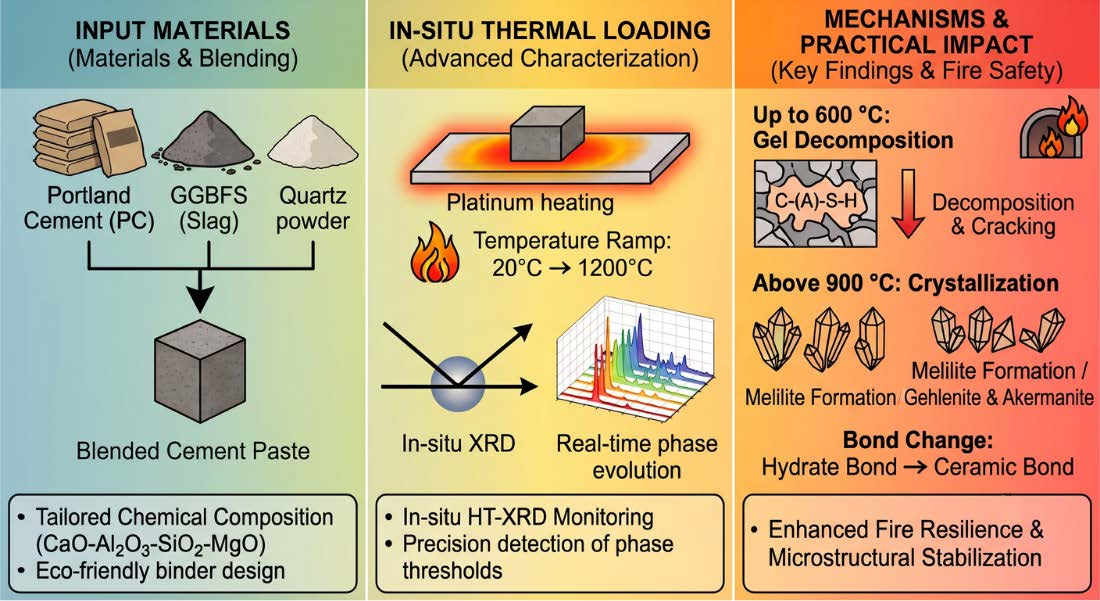
In all cases, after cooling, a new phase was observed. Typically, in blast furnace slag that cools slowly, a phase known as melilite forms [
34]. Melilite is a solid solution composed of gehlenite (2CaO·Al
2O
3·SiO
2) and akermanite (2CaO·MgO·2SiO
2), incorporating all the main components of blast furnace slag: CaO, SiO
2, MgO, and Al
2O
3. Since the selected GGBFS is rich in magnesium, akermanite is more likely to form and dominate in this solid solution during crystallization after high-temperature exposure. The presence of akermanite in cement can influence its properties [
35]. For example, it can impact the hydration process, the mechanical properties of the hardened cement, and its durability. It helps to maintain the stability of the composite material when exposed to high temperatures. Stronger bonds are less likely to degrade in such conditions. Creating akermanite (Ca
2MgSi
2O
7) from C-A-S-H (calcium aluminate silicate hydrates) involves high-temperature reactions [
36]. The synthesis typically occurs through the optimum combination of raw materials containing calcium (calcium carbonate (CaCO
3) or calcium oxide (CaO)), magnesium (magnesium oxide (MgO)), and silicon (silica (SiO
2)), and elevated temperatures, typically in the range of 1200–1400 °C, [
37]. The high-temperature environment facilitates the solid-state reaction between calcium, magnesium, and silica compounds, leading to the formation of akermanite.
The general reaction to form akermanite can be represented as
The most prominent XRD reflections corresponding to the melilite group were observed in the mix containing CEM II/B-V 32.5 R and GGBFS without quartz powder (
Figure 5). Rather than a definitive qualitative XRD assignment, the formation of a melilite-group phase—likely dominated by an akermanite-rich composition—is suggested by the high MgO content of the GGBFS (
Table 1) and supported by local SEM-EDX elemental ratios. The presence of fly ash in this cement type provides additional reactive silica (SiO
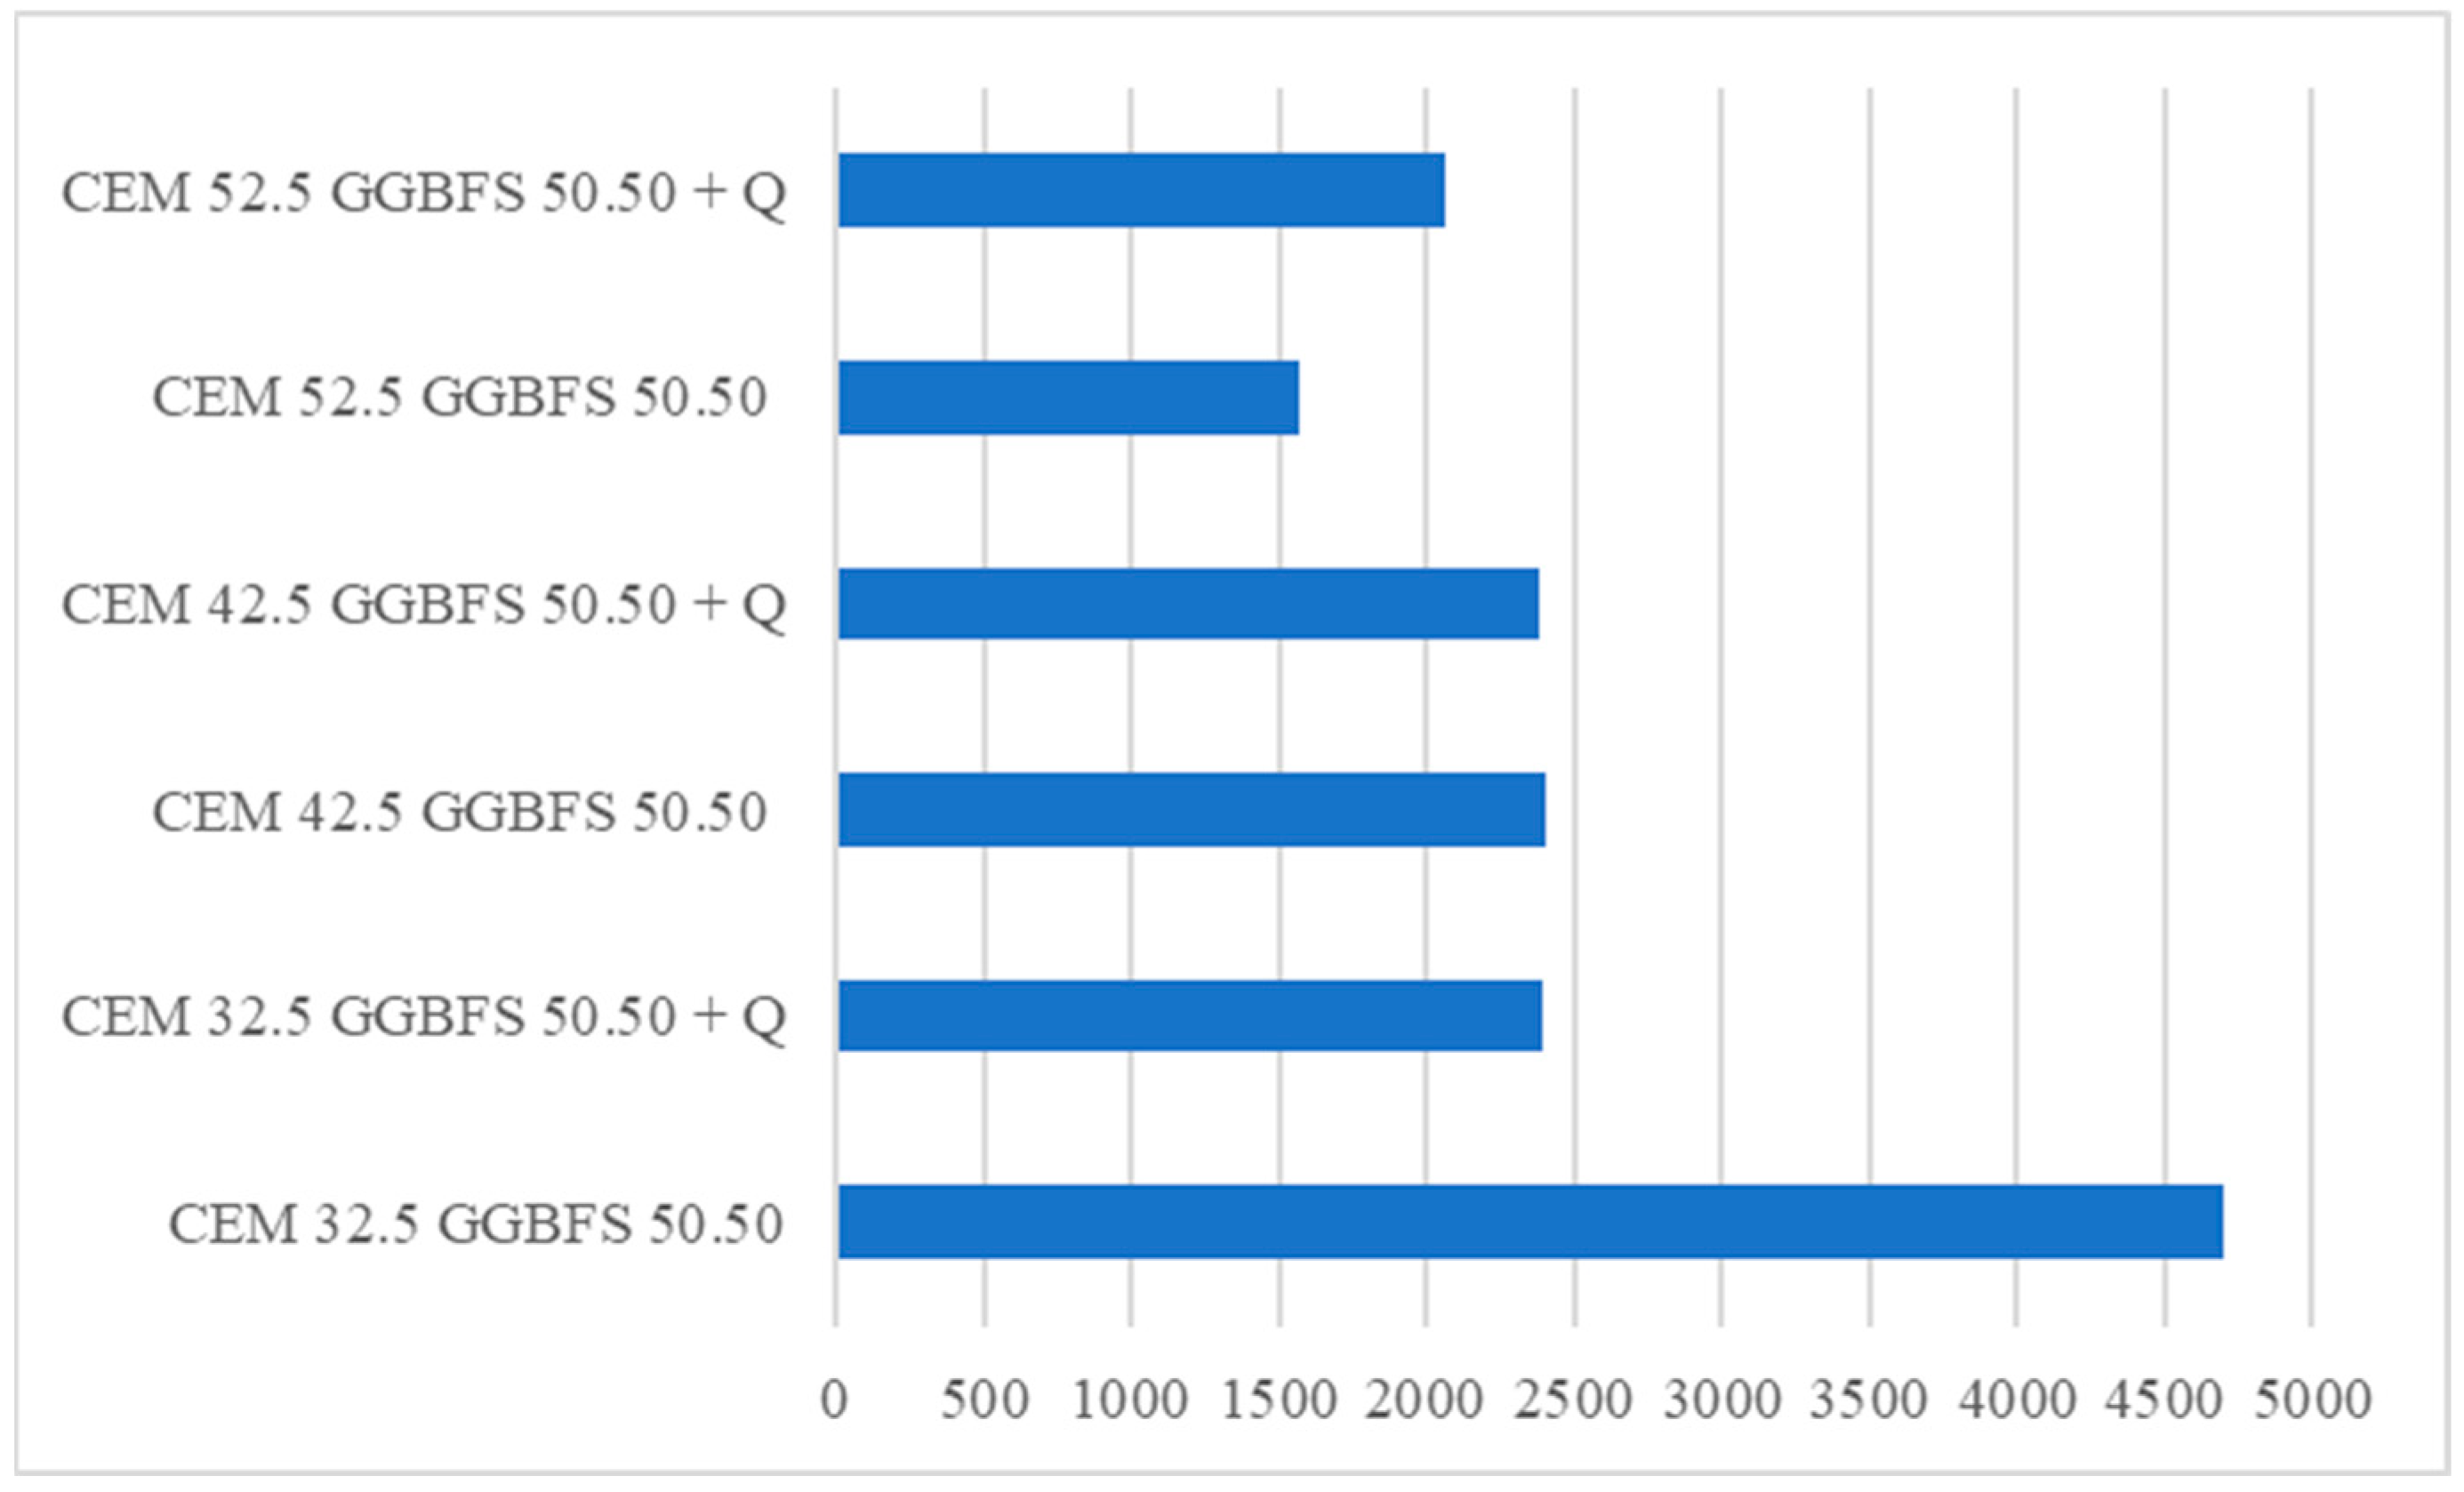
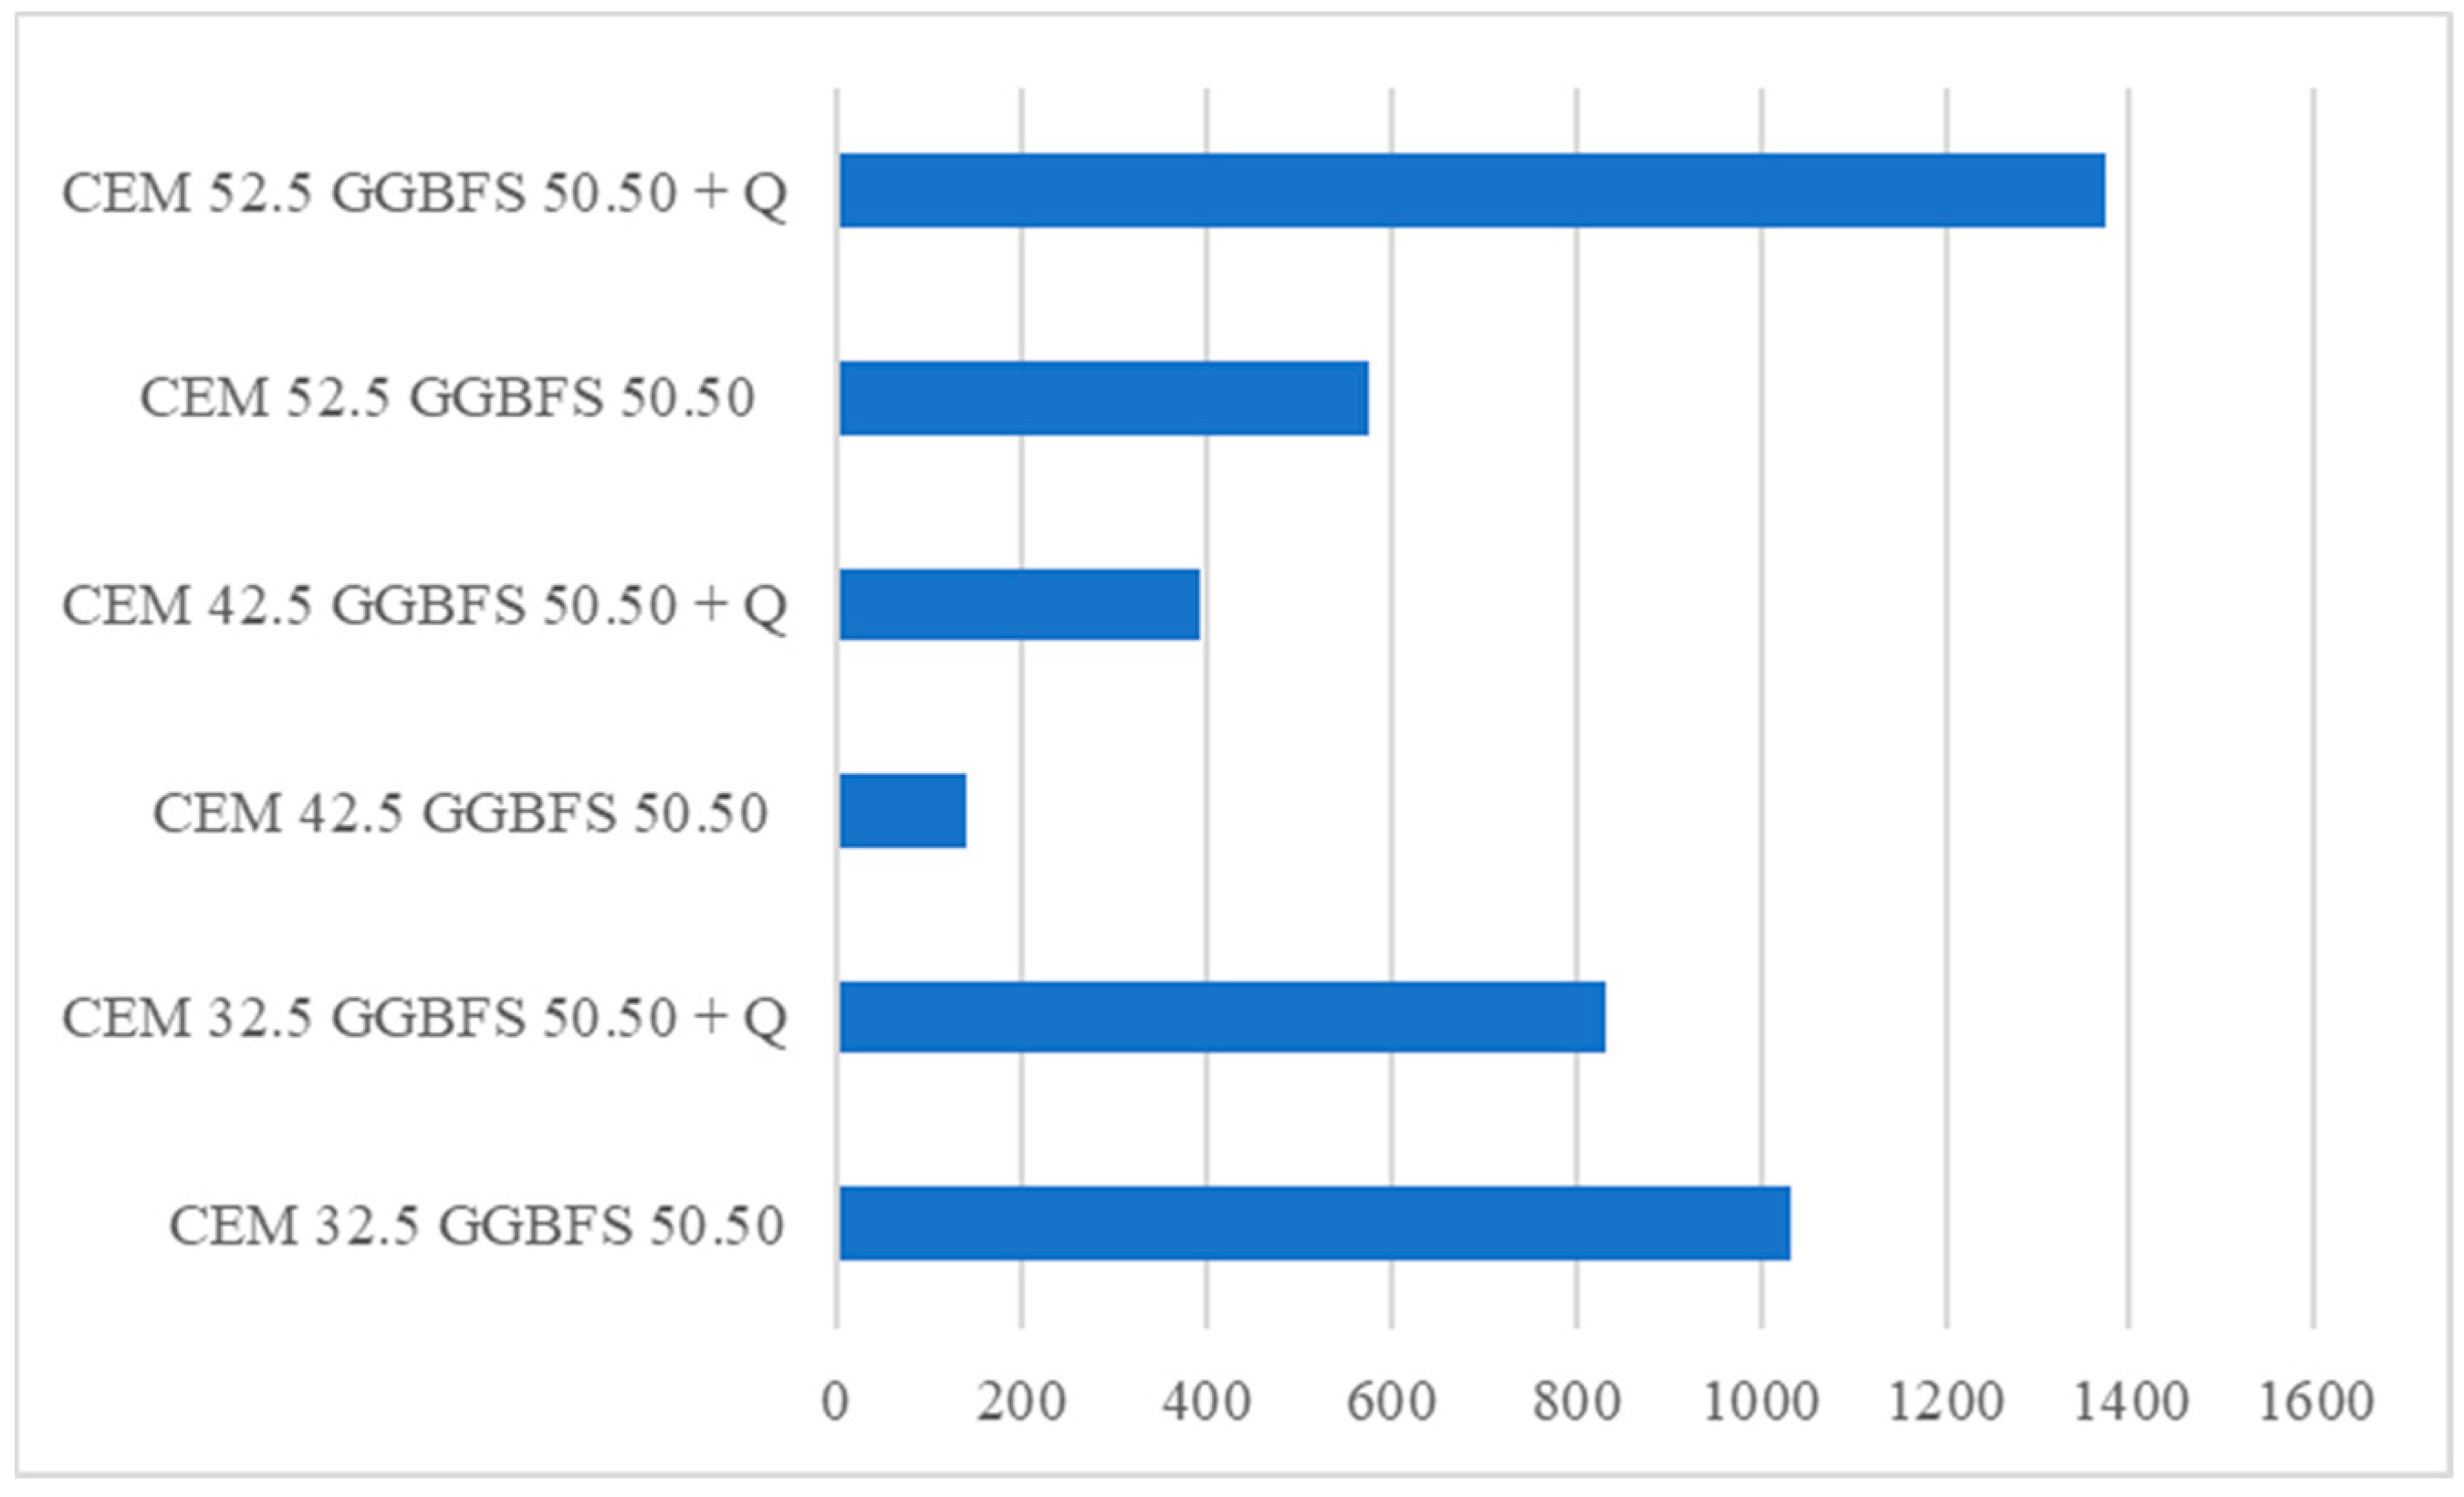
2), which further facilitates melilite formation at elevated temperatures. No clear trend regarding melilite content was observed with respect to the addition of quartz powder (
Figure 11). The relatively low clinker content in CEM II/B-V 32.5 R results in a limited supply of portlandite, which is shared between the hydration of fly ash and GGBFS. This restricts the initial extent of the GGBFS reaction, leaving a larger fraction of unreacted slag that can subsequently devitrify into melilite during heating.
Akermanite has a high melting point (around 1450 °C) [
38], which means it can withstand high temperatures without decomposing or losing its structural integrity. Akermanite has thermal expansion properties compatible with those of the cementitious matrix [
39]. This compatibility could possibly reduce internal stress caused by temperature fluctuations, thereby minimizing the risk of thermal cracking. In cases where cracks form, the self-healing properties of akermanite can help seal these cracks, preventing further propagation and maintaining the structural integrity of the concrete.
After exposure to high temperatures and a cooling-down process, tricalcium aluminate (C
3A) emerged as a new phase in all studied samples (
Figure 12). Due to the decomposition of various components in the cement paste, including calcium silicates and aluminates, they decompose and react. The presence of slag, which contains additional alumina (Al
2O
3) and silica (SiO
2), can contribute to these reactions. However, there is no free Al
2O
3 in the slag as discrete units since it is entirely bonded into the silicate glass. Tricalcium aluminate (C
3A) may form through reactions between calcium oxide (CaO) and aluminum oxide (Al
2O
3) released during decomposition:
There is the possibility that in case of rehydration, C
3A can react with gypsum (CaSO
4·2H
2O) to form ettringite (C
6A
6H
32S
3), which can potentially contribute to volume expansion and internal stresses, leading to potential cracking [
40].
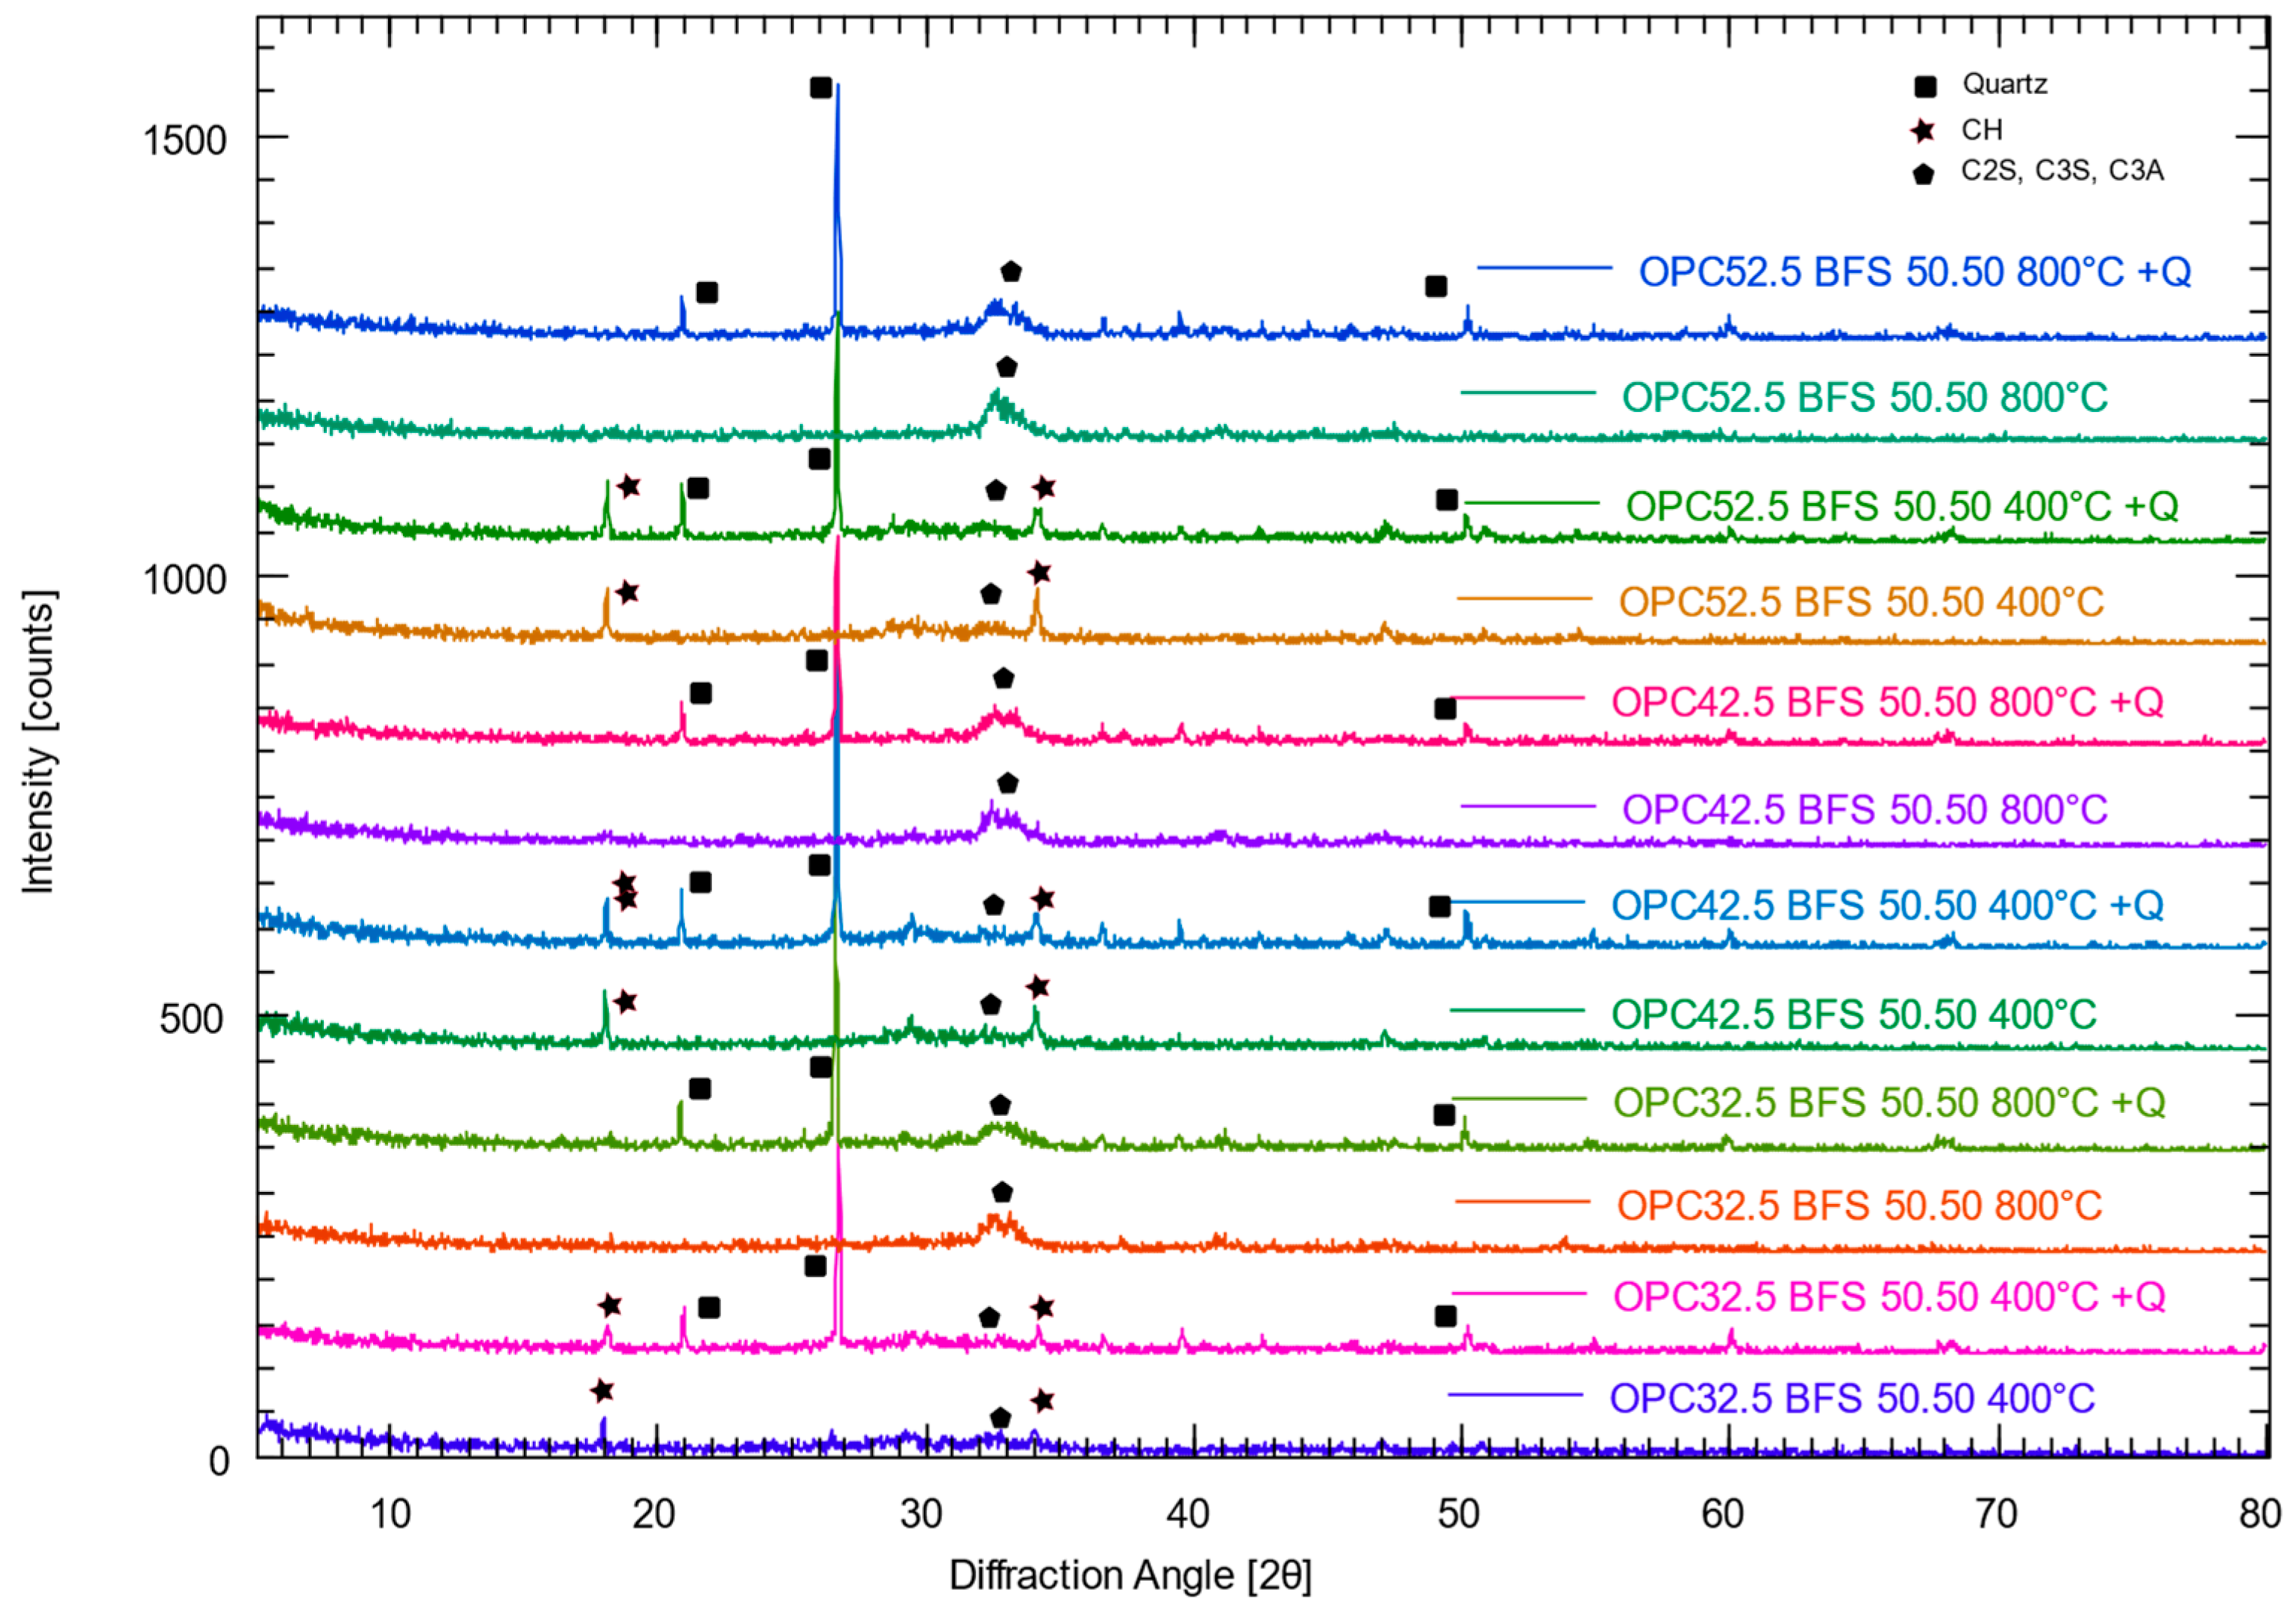
The X-ray diffraction (
Figure 13) achieved after exposing samples to 400 °C and 800 °C and letting them cool down to ambient temperature did not show significant phase changes.
After exposing samples to 400 °C, typical phases such as calcium silicate hydrates (C-S-H) are still present. The XRD patterns for samples containing quartz powder show characteristic peaks corresponding to quartz, indicating its presence and stability at these temperatures.
At 800 °C, the XRD patterns suggest the early appearance of calcium aluminate phases. These phases are likely to form as the original hydration products decompose or transform due to the elevated temperature. The quartz peaks in the samples with quartz powder remain stable, leading to the conclusion that quartz does not react significantly or decompose at this temperature, thus maintaining its crystalline structure [
41,
42]. No new additional phases, such as melilite, were found.
The observed phase transformations have direct implications for concrete performance at high temperatures. The thermal dehydration and breakdown of C-S-H and related hydration products reduce the binding capacity, thereby increasing matrix porosity and weakening the microstructure. In quartz-containing formulations, the reversible polymorphic transitions of quartz, combined with differential thermal expansion and higher effective water-to-binder ratios, induce internal stresses that promote microcracking. Meanwhile, the formation of melilite-group phases at elevated temperatures demonstrates the progressive structural reorganization of the silicate network. Together, these microstructural and mineralogical transformations explain the loss of integrity and the reduction in mechanical performance of blended cement-based materials exposed to elevated temperatures [
43].
3.2. SEM and EDX Analysis
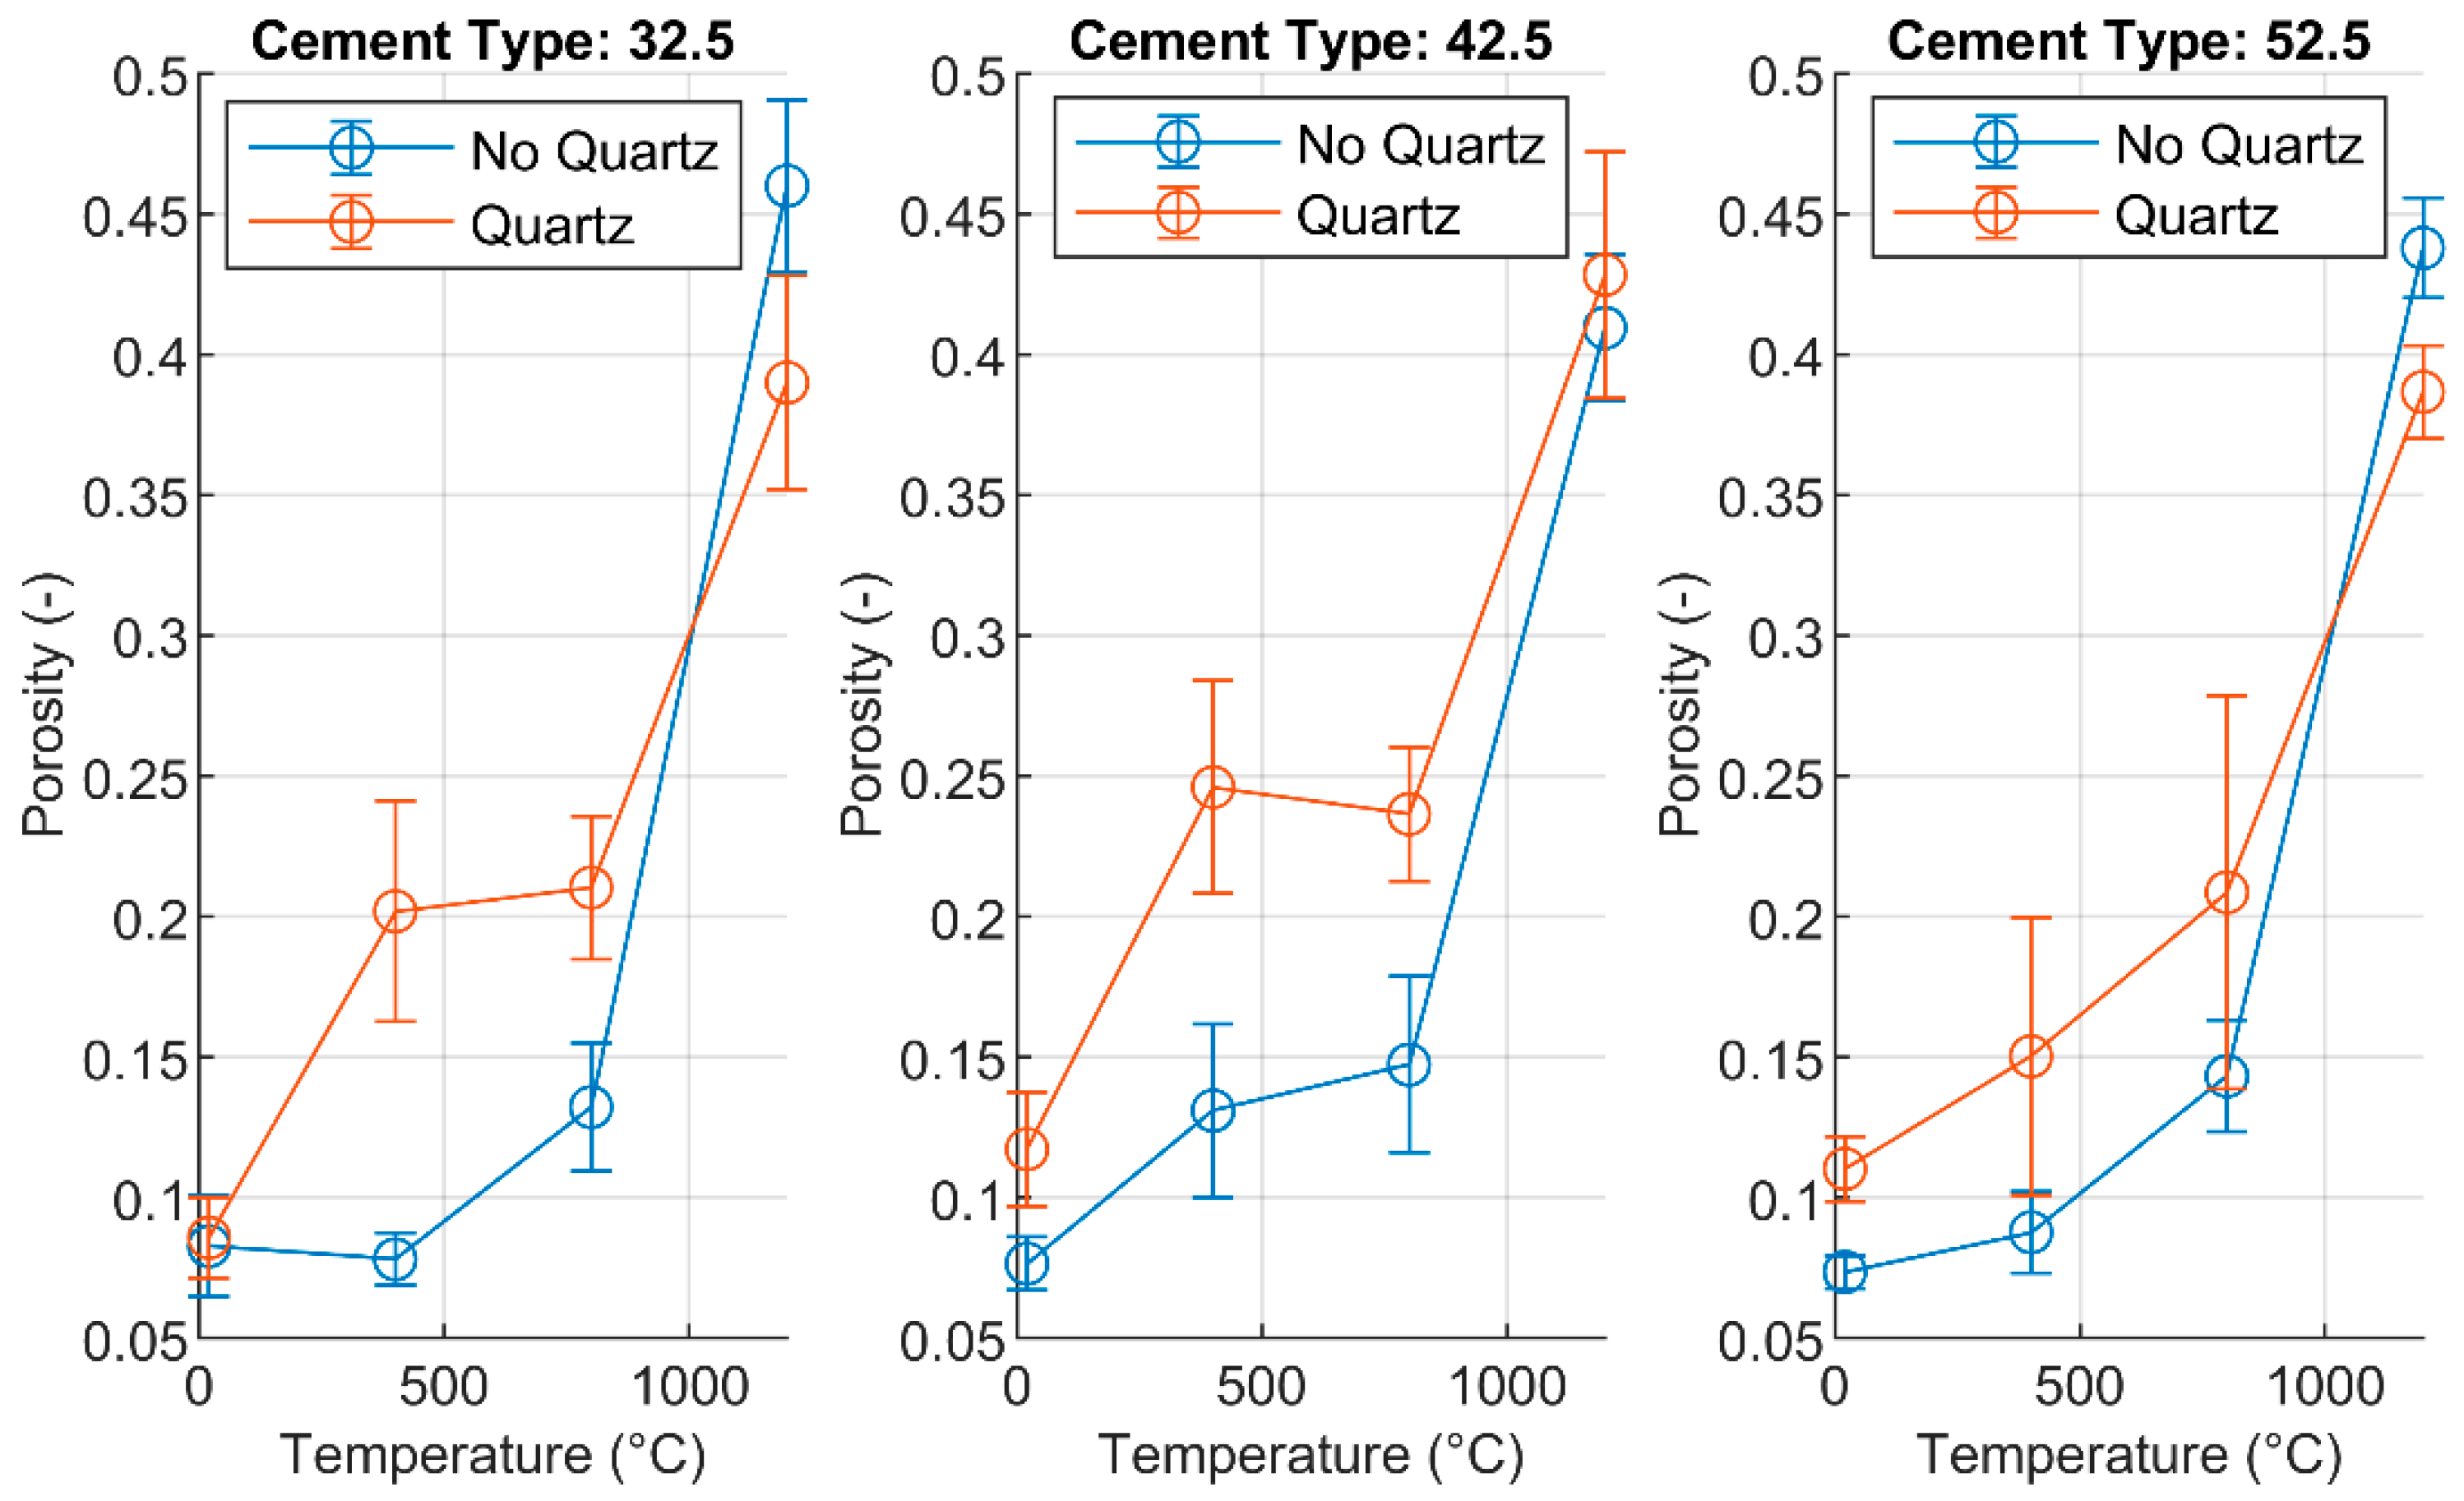
When correlating high-temperature XRD results with SEM observations and porosity measurements, the fundamental differences between in situ and ex situ characterization methods must be considered. In situ XRD directly monitors phase transformations, lattice expansion, and reversible polymorphic transitions (such as the α-β quartz transformation at ~573 °C) at elevated temperatures. In contrast, ex situ SEM microstructural observations and image-based porosity measurements represent the material state after cooling to ambient conditions. During cooling, thermal contraction and differential thermal stresses between distinct phases induce micro-cracking and volumetric changes. Consequently, while ex situ SEM and porosity capture the permanent thermal damage and retained high-temperature phases (such as melilite), they also incorporate cooling-induced artifacts that must be distinguished from the in situ thermal state.
The data obtained from scanning electron microscopy (SEM) paired with energy dispersive X-ray spectroscopy (EDX) are shown in
Table 7. For the mixture CEM 32.5 GGBFS 50.50 without quartz powder, aluminium, silicon, and calcium levels generally decreased with increasing temperature. The Si/Ca atomic ratio slightly increased at 400 °C before decreasing, and both the Al/Ca and Al/Si ratios remain relatively stable across the temperature range.
When quartz powder was added to CEM 32.5 GGBFS 50.50, the trends changed slightly. Aluminium and silicon contents increased at 400 °C, decreased at 800 °C, and rose again at 1200 °C. Calcium decreased initially but increased at 1200 °C. The Si/Ca ratio tended to increase with the temperature, indicating a stabilizing effect of the quartz powder. The Al/Ca atomic ratio remained constant but then increased at 1200 °C. The Al/Si atomic ratio decreased initially but stabilized at higher temperatures.
For CEM 42.5 GGBFS 50.50 without quartz powder, the aluminium amount decreased until 800 °C and then increased at 1200 °C. Silicon and calcium showed similar trends, decreasing until 800 °C and increasing at 1200 °C. The Si/Ca ratio remained relatively stable, while the Al/Ca and Al/Si ratios exhibited only minor changes.
With the addition of quartz powder to CEM 42.5 GGBFS 50.50, both aluminium and silicon contents decreased at 400 °C and 800 °C but increased at 1200 °C. Calcium also decreased until 800 °C and then increased at 1200 °C. The Si/Ca ratio increased steadily with the temperature, while the Al/Ca and Al/Si ratios remained relatively stable, showing only a slight increase at higher temperatures.
For CEM 52.5 GGBFS 50.50 without quartz powder, aluminium content decreased at 400 °C but increased at higher temperatures. Silicon content increased at 800 °C before stabilizing, while calcium content decreased at 400 °C, increased at 800 °C, and then decreased again at 1200 °C. The Si/Ca and Al/Ca ratios decreased initially before increasing, while the Al/Si ratio followed a similar trend.
When quartz powder is added to CEM 52.5 GGBFS 50.50, aluminium and silicon contents decrease at 400 °C and 800 °C but increase at 1200 °C. Calcium content shows a decreasing trend until 800 °C, followed by an increase at 1200 °C. The Si/Ca ratio increases at 400 °C, decreases at 800 °C, and then increases again at 1200 °C. The Al/Ca and Al/Si ratios remain relatively constant across the temperature range.
The SEM-EDX analysis confirms that quartz powder influences the elemental composition of mixes with the temperature. For mixes without quartz, aluminium, silicon, and calcium generally decreased with increasing the temperature, with minor variations in atomic ratios. When quartz was added, silicon and aluminium levels tended to be maintained or recover at higher temperatures (800–1200 °C), and the Si/Ca atomic ratio generally increased, indicating enhanced thermal stability. These compositional trends help explain the stabilizing effect observed in XRD measurements, as quartz preserves silicon-rich phases and promotes the formation of calcium–aluminate–silicate phases, reducing microstructural degradation, limiting porosity growth, and maintaining mechanical integrity at elevated temperatures.
Supporting these findings, a recent study [
44] utilizing high-throughput atomistic modelling to investigate the structural and mechanical properties of calcium aluminate silicate hydrate (C-A-S-H) across a range of Ca/Si and Al/Si ratios found that increasing the Al/Si ratio promotes chain polymerization. It is leading to longer mean chain lengths and improved mechanical performance. This aligns with earlier work by L’Hopital et al. [
45], who demonstrated that Al incorporation into C–S–H strongly depends on the Ca/Si ratio, producing distinct structural configurations (C–S–Ha at low Ca/Si and C–S–Hb at high Ca/Si). At low Ca/Si ratios, Al preferentially substitutes Si in non-bridging sites, whereas at higher Ca/Si ratios substitution shifts to bridging positions, promoting chain rupture and reorganization. These insights suggest that quartz powder, by supplying additional silicon and promoting higher Al uptake, contributes to stronger polymerized C-A-S-H networks, consistent with the stabilizing trends observed in SEM-EDX analysis.
However, mixtures containing quartz display a dual response: while supporting silicon-rich phase formation, the combined effects of the α-β quartz transition, binder dilution, and a higher effective water-to-binder ratio induce internal stresses and cause earlier reductions in portlandite and calcite XRD reflection intensities, which may theoretically affect high-temperature mechanical performance.




 ,
,