3.1. Flow Behavior Analysis
The true stress–strain curves obtained during high-temperature deformation provide an integrated response of the microstructural state and deformation characteristics of titanium alloys. In general, the flow behavior is strongly dependent on both the imposed deformation parameters and the initial microstructure of the material.
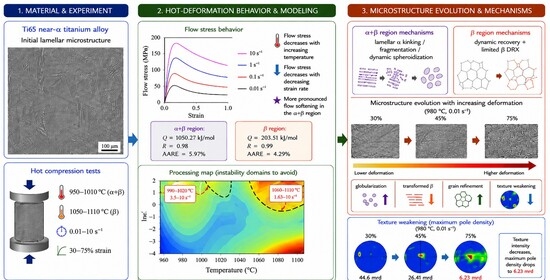
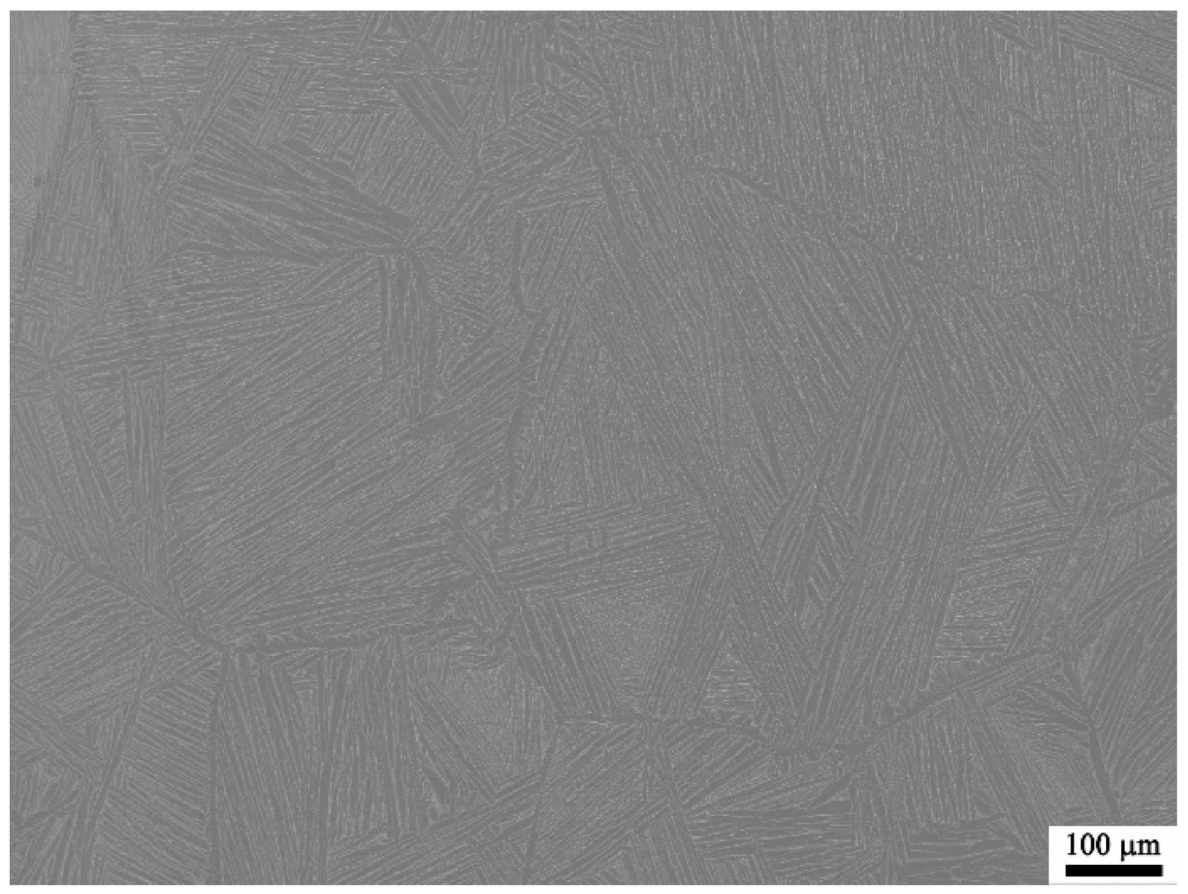
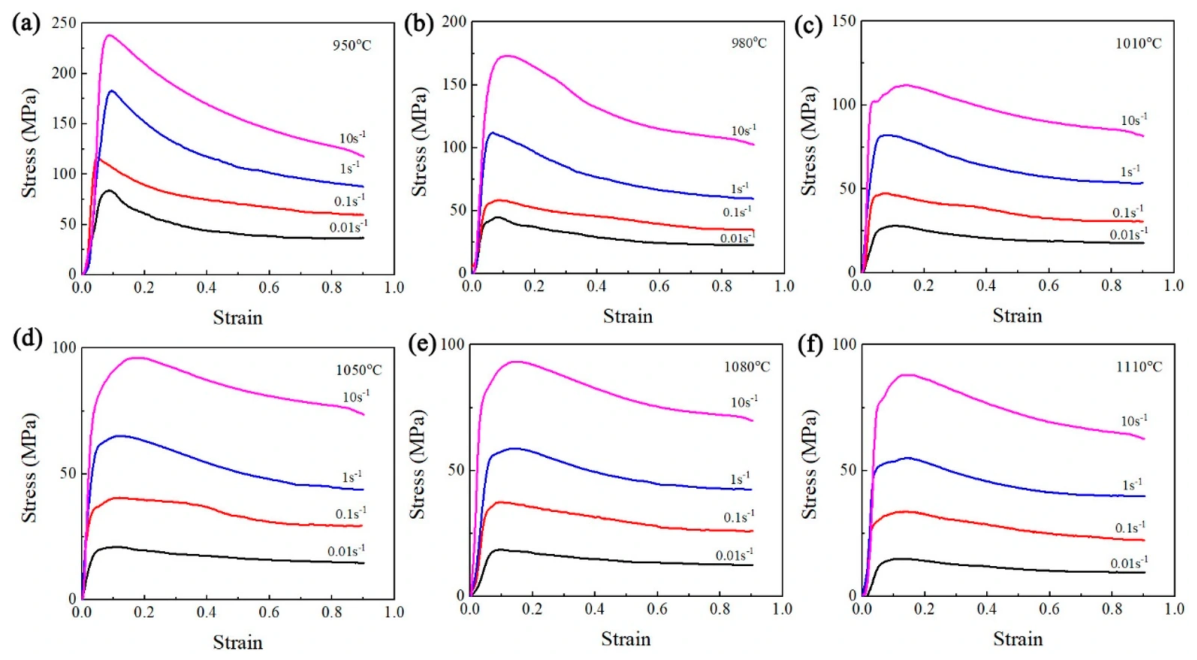
Figure 2 presents the true strain–stress curves of the Ti65 alloy with an initial lamellar microstructure under different hot compression conditions. At the initial stage of deformation, the increase in flow stress can be attributed to strain hardening associated with the accumulation and interaction of dislocations [
29]. Because direct dislocation characterization was not performed, this interpretation should be regarded as a mechanistic inference based on the observed flow response rather than as direct experimental evidence. Meanwhile, dynamic restoration mechanisms, such as dynamic recovery, dynamic recrystallization and globularization of the α phase, are still insufficiently activated at this stage [
10,
30]. With increasing strain, dynamic softening mechanisms, including dynamic recovery and the progressive fragmentation and spheroidization of lamellar α, become increasingly active and counteract the strain-hardening effect, eventually leading to a peak or a steady/softening flow response depending on the deformation condition.
At high strain rates, part of the plastic work can be converted into heat faster than it can be dissipated to the surroundings, resulting in a transient adiabatic temperature rise. Although the specimen temperature was monitored by a thermocouple welded at the mid-height surface, the deformation time at 10 s−1 is very short (approximately 0.09 s to a true strain of 0.9), and a local temperature rise in the specimen interior cannot be completely excluded. A first-order adiabatic estimate based on the measured stress–strain curves indicates that the theoretical upper-bound temperature rise at 10 s−1 is on the order of approximately 20–47 °C over the investigated temperature range, with the largest value occurring at the lowest deformation temperature. Because heat transfer to the anvils and surroundings was neglected in this estimate, the actual temperature rise is expected to be lower. Nevertheless, adiabatic heating may contribute to the apparent flow softening and flow instability observed under high-strain-rate conditions, particularly at relatively low temperatures.
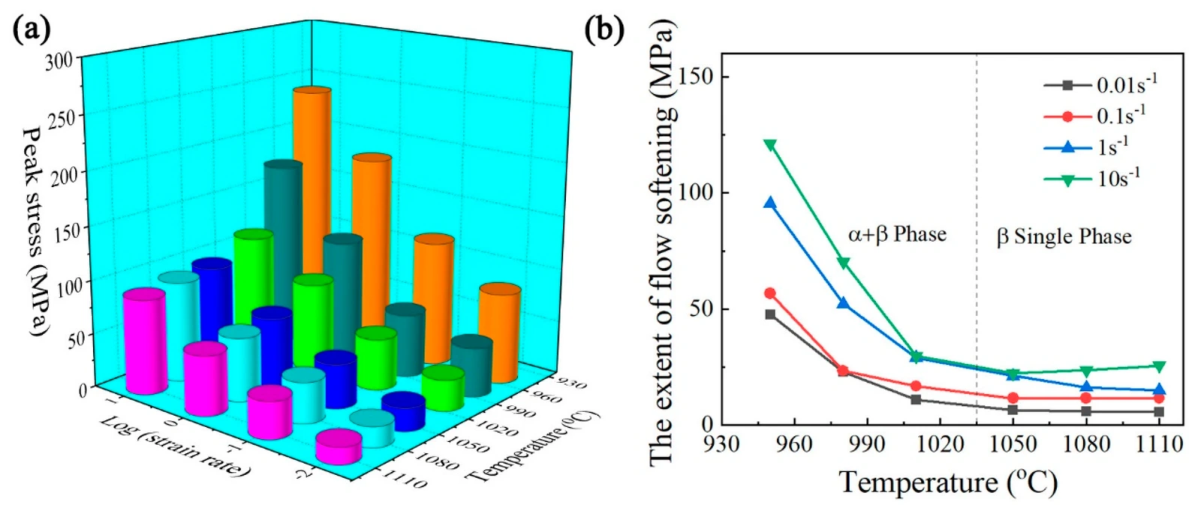
The peak stress of the lamellar Ti65 alloy varies markedly with deformation temperature and strain rate, as summarized in
Figure 3a. It can be seen that the peak stress decreases with increasing deformation temperature and decreasing strain rate. The decrease in peak stress with increasing deformation temperature and decreasing strain rate can be attributed to the competition between work hardening and thermally activated restoration processes. At elevated temperatures, enhanced atomic diffusion increases dislocation mobility and facilitates dislocation climb, rearrangement and annihilation, thereby promoting dynamic recovery and reducing the accumulated dislocation density. Meanwhile, enhanced interfacial mobility favors boundary migration and microstructural reconstruction during hot deformation. A lower strain rate provides sufficient time for these thermally activated processes to proceed at a given strain, whereas at higher strain rates, the rapid multiplication and accumulation of dislocations cannot be effectively compensated by dynamic restoration, resulting in stronger work hardening and higher flow stress [
5]. Similar behavior has recently been reported for near-α titanium alloys, in which increasing temperature and decreasing strain rate promoted microstructural evolution, α-lamella spheroidization and dynamic restoration [
11,
31]. In addition, with increasing temperature in the α + β phase region of Ti65 alloy, the increasing fraction of the β phase, which possesses a BCC structure and more readily activated slip systems, improves deformation compatibility and further decreases the deformation resistance [
4]. Therefore, the combined effects of enhanced dislocation restoration, interfacial migration, α-lamella spheroidization and temperature-dependent phase constitution account for the observed reduction in peak stress.
Figure 3b further compares the degree of flow softening under different deformation conditions. The results show that the softening degree of the lamellar Ti65 alloy decreases as the temperature increases and the strain rate decreases. In addition, the flow-softening behavior in the α + β phase region is more pronounced than that in the single β phase region, suggesting that the deformation-induced evolution of lamellar α, such as kinking, fragmentation and spheroidization, plays an important role in the softening response during subtransus deformation.
3.2. Constitutive Model Construction
During hot deformation, the flow stress of metallic materials is governed by the combined effects of deformation temperature, strain rate and strain. Therefore, considerable efforts have been devoted to developing constitutive models that can quantitatively describe the relationship between flow stress and thermomechanical parameters [
28]. For hot forming processes, an accurate constitutive equation is of great importance because it not only characterizes the deformation response of the material but also provides essential input data for predicting forming loads and conducting numerical simulations. Accordingly, the establishment of a reliable constitutive model is necessary for understanding and optimizing the hot-working behavior of the Ti65 alloy.
According to their theoretical basis and modeling strategy, constitutive models for hot deformation can generally be classified into three categories: phenomenological models, physically based models and data-driven models, such as artificial neural networks. Among them, phenomenological constitutive models have been widely used because of their relatively simple mathematical form and acceptable prediction accuracy [
32]. For titanium alloys, the Arrhenius-type model expressed by a hyperbolic sine function is commonly employed to describe flow stress over a wide range of stress levels during hot deformation [
33]. The relationship among strain rate, flow stress and deformation temperature can be expressed as follows:
In these equations,
,
,
T,
Q, and R denote the strain rate, flow stress, absolute temperature, apparent activation energy for hot deformation, and universal gas constant, respectively.
A1,
A2,
A,
n1,
n, α, and β are material-dependent constants, among which α is generally calculated as
. To facilitate the determination of the material constants involved in the above constitutive equations, the natural logarithm was taken on both sides of Equation (1), and the following linearized expressions were obtained:
where
and
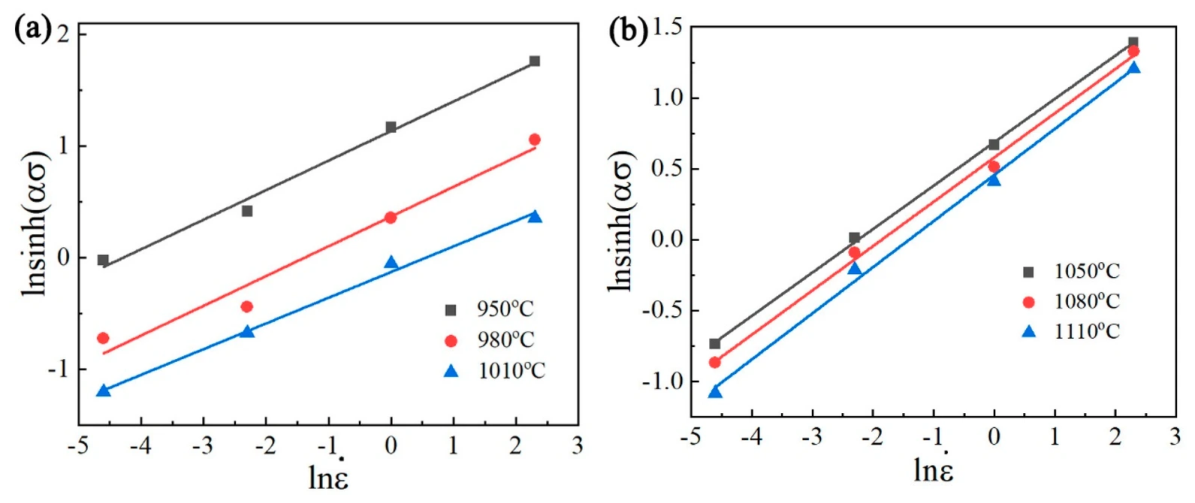
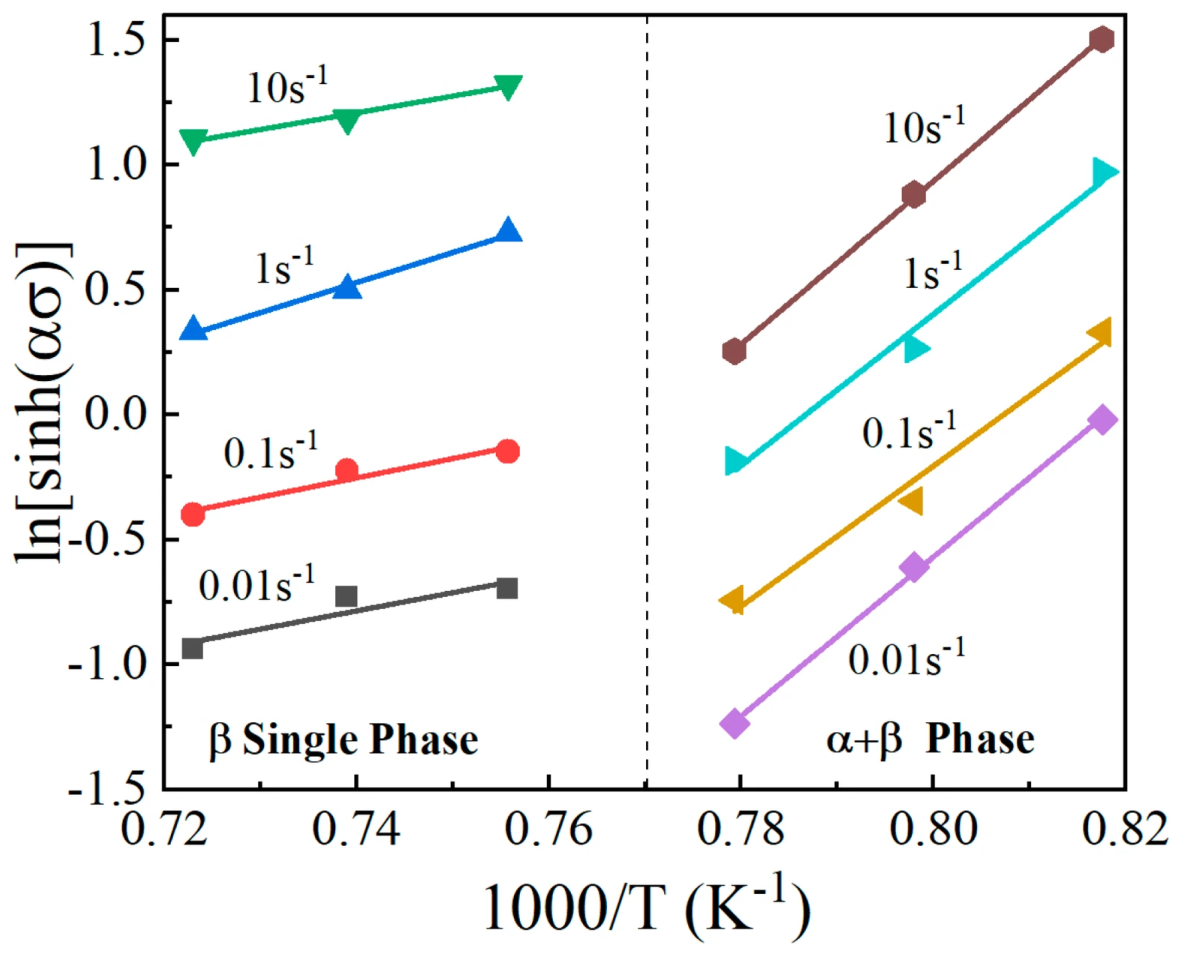
. To determine the material constants in the constitutive equations, the peak stresses obtained under different deformation conditions were substituted into Equation (2). Based on the linear fitting results shown in
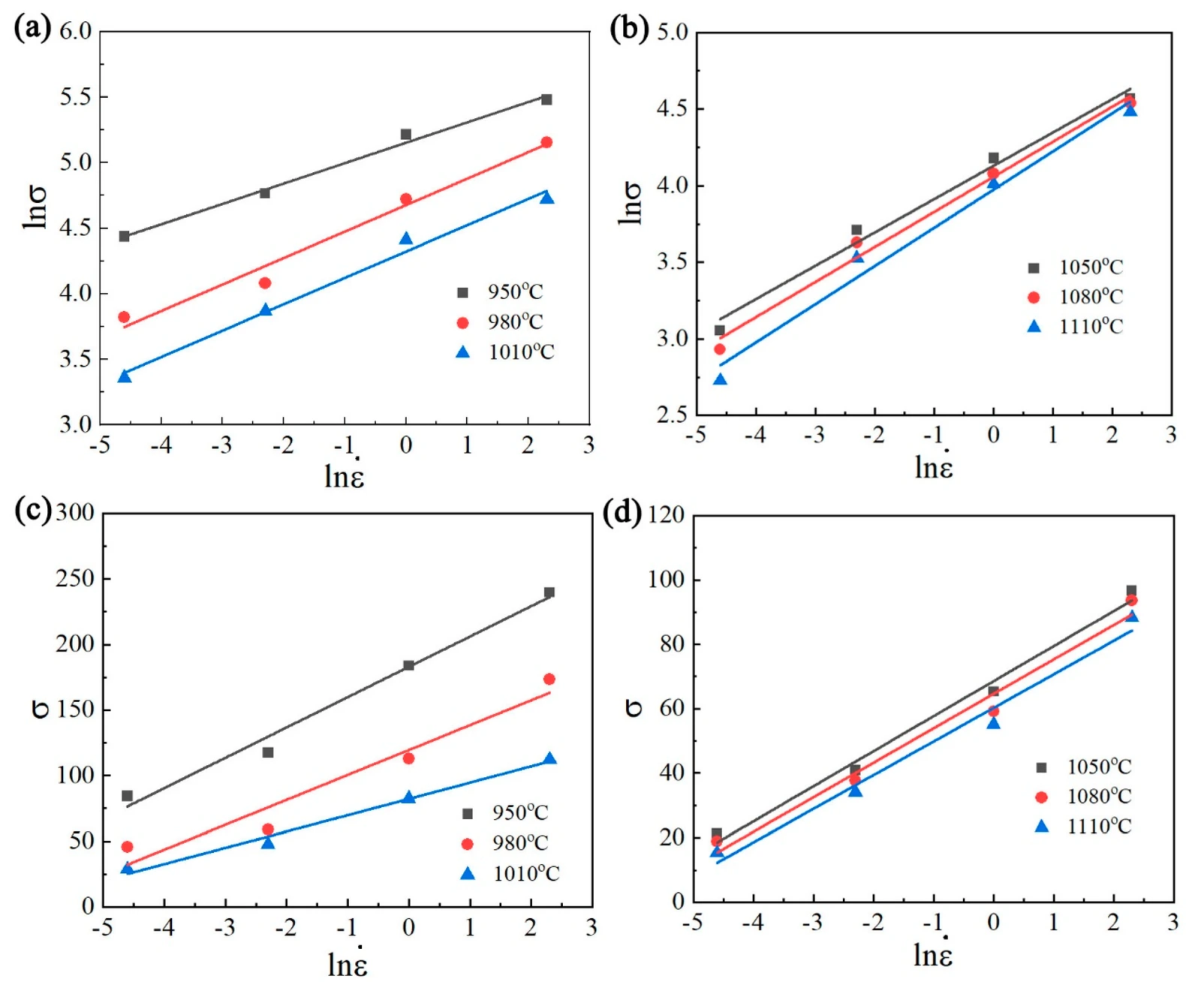
Figure 4, the values of
n1 and β in the α + β phase region and β single-phase region were calculated from the slopes of the
and
plots, respectively. Subsequently, the material parameter α was obtained according to the relationship
. The calculated α values for the lamellar Ti65 alloy were 0.0102 and 0.0217 MPa
−1 in the α + β phase region and β single-phase region, respectively.
For a given temperature interval, the apparent activation energy for hot deformation,
Q, is usually assumed to remain constant. On this basis, the Arrhenius-type equation can be further transformed, and the value of
Q can be evaluated from the following relationship:
Based on Equation (3), the parameter related to strain-rate sensitivity can be obtained from the slope of the
plots, and the corresponding linear fitting results are shown in
Figure 5. In a similar manner, the temperature-dependent term in Equation (3) can be calculated from the slope of the
plots. The detailed fitting relationships are presented in
Figure 6. For improved readability,
, rather than
, was used as the abscissa in
Figure 6. Therefore, the slope obtained directly from
Figure 6 is
. Since
, a factor of 1000 must be included when calculating the apparent activation energy, i.e.,
.
The calculated apparent activation energies based on the peak-stress data are 1050.27 kJ/mol in the α + β phase region and 203.51 kJ/mol in the β single-phase region. It should be emphasized that the activation energy obtained from the Arrhenius-type constitutive relationship is an apparent, phenomenological parameter reflecting the overall temperature sensitivity of the flow stress rather than the energy barrier of a single atomic diffusion mechanism. It is generally accepted that the self-diffusion activation energies of pure α-Ti and β-Ti are approximately 204 and 153 kJ/mol, respectively [
34]. The activation energy obtained in the α + β phase region is therefore much higher than the self-diffusion activation energies of both α-Ti and β-Ti. In the β single-phase region, the obtained value is relatively close to the reported diffusion-related activation energies of β-Ti, supporting the predominance of diffusion-assisted dislocation recovery. In contrast, the markedly higher value in the α + β region results from the coupled contribution of several strongly temperature-dependent processes. With increasing temperature toward the β-transus, the phase fraction changes rapidly, while dislocation rearrangement, α-lamella kinking and fragmentation, α/β interfacial migration, dynamic spheroidization and α → β transformation occur concurrently. Consequently, the strong temperature sensitivity associated with these coupled microstructural processes is incorporated into the fitted apparent activation energy, giving rise to a value substantially higher than the self-diffusion activation energy of pure Ti. Similarly high apparent activation energies have been reported for other titanium alloys with lamellar microstructures during deformation in the α + β region [
35,
36,
37]. The apparent activation energy calculated in the β single-phase region is only slightly higher than the self-diffusion activation energy of β-Ti. This suggests that dynamic recovery is likely to be the dominant restoration mechanism during deformation in the β region. Meanwhile, limited dynamic recrystallization of the β phase may also occur under certain deformation conditions. This interpretation is consistent with the evolution tendency of the flow stress curves, in which the β region deformation exhibits a relatively weaker flow-softening behavior compared with that in the α + β phase region.
It should be noted that the apparent activation energy obtained from the Arrhenius model should not be regarded as an intrinsic and invariant material constant. Within each phase region, a single effective activation energy is used at a given strain level to represent the overall temperature dependence of the flow stress. This treatment is a phenomenological approximation. In particular, in the α + β region, the relative fractions of α and β phases vary with temperature, while the contributions of α-lamella fragmentation, dynamic spheroidization, interfacial migration, dynamic recovery, and α → β transformation also evolve. Therefore, the calculated activation energy represents an effective value averaged over the investigated temperature interval rather than the activation barrier of a single microscopic process. In the β region, the assumption of a single effective activation energy is comparatively more reasonable because deformation occurs predominantly in the β phase, although temperature-dependent recovery and recrystallization processes may still contribute.
To improve the accuracy of flow-stress prediction, the influence of deformation temperature on the strain-rate-dependent deformation response was further considered. Accordingly, the Zener–Hollomon parameter was introduced to incorporate the combined effects of temperature and strain rate into the constitutive description. The expression of
Z is given as:
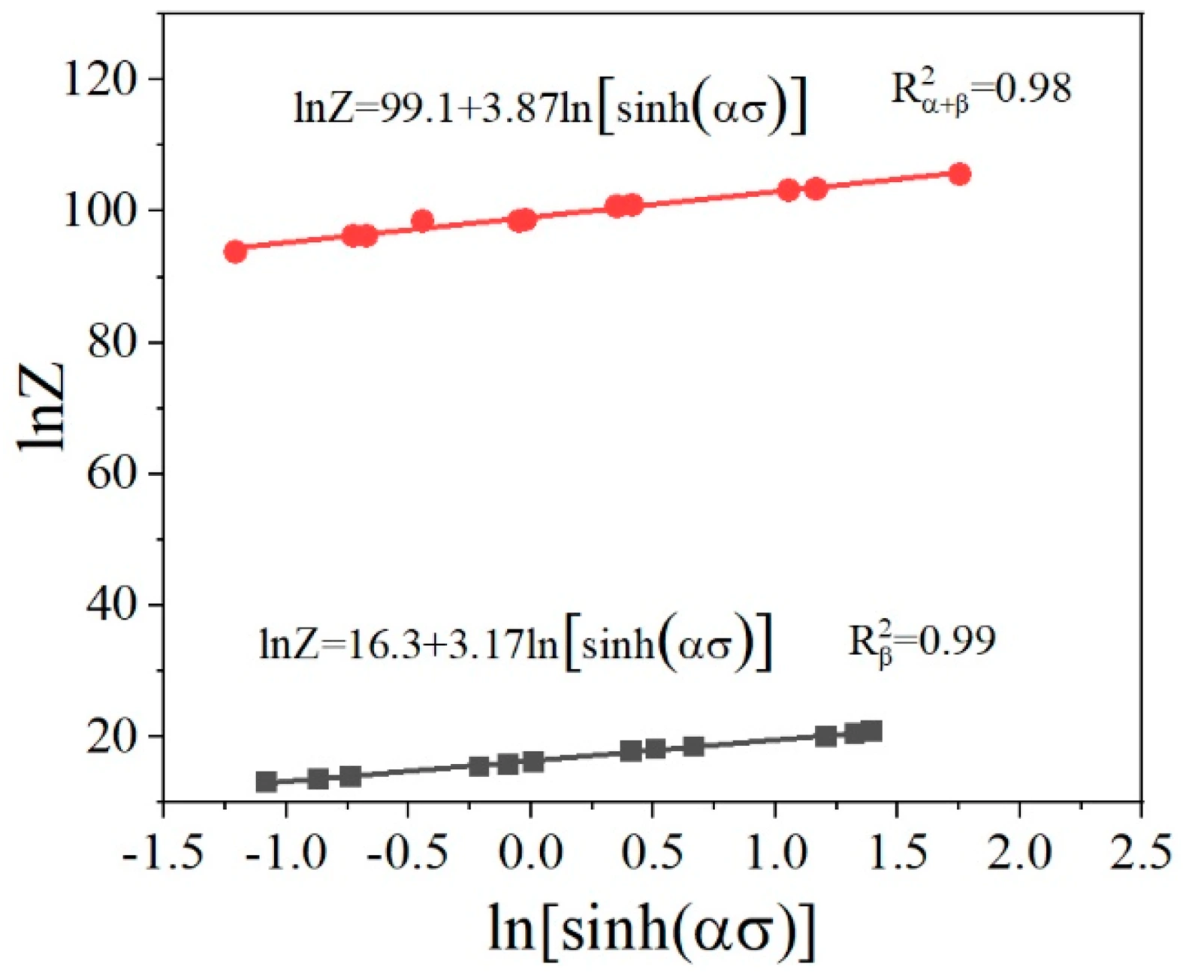
After taking the natural logarithm of both sides of Equation (3), a linear relationship between ln Z and
can be obtained, as expressed in Equation (5). Accordingly, ln A is evaluated from the intercept of the linear fitting curve in
Figure 7.
According to the material parameters determined above, the Arrhenius-type constitutive models for the Ti65 alloy in the α + β phase region and β single-phase region were established separately. The final constitutive equations are expressed as follows:
However, the conventional Arrhenius-type equation in Equation (1) does not explicitly account for the influence of strain on flow stress during hot deformation. Previous studies have shown that strain can markedly affect the material constants involved in the constitutive model [
38,
39]. Therefore, to improve the prediction accuracy of the flow stress of the Ti65 alloy, it is necessary to establish the strain-dependent relationships of the material parameters in the constitutive equation. These relationships can be expressed in matrix form, as shown in Equation (8).
After incorporating both the Zener–Hollomon parameter and the strain effect, the flow stress can be calculated and predicted using Equation (9). To assess the influence of polynomial order and minimize the risk of overfitting, second- to sixth-order polynomial functions were systematically evaluated for describing the strain dependence of
,
n,
Q, and
α. The fitting quality was quantified using the coefficient of determination (
R2), adjusted coefficient of determination (
), and root-mean-square error (RMSE). The corresponding statistical results are summarized in
Table S1. With increasing polynomial order, the fitting accuracy generally improved, and the sixth-order polynomial provided the highest adjusted
R2 and the lowest RMSE for all four material parameters in both phase regions. To further examine the possibility of overfitting, a leave-one-condition-out cross-validation was performed at the constitutive-model level. In each iteration, one complete temperature–strain-rate condition was excluded from model calibration and subsequently predicted using the model established from the remaining deformation conditions. The results are shown in
Table S2. No deterioration in cross-validation performance was observed for the sixth-order polynomial compared with the lower-order functions. Therefore, the sixth-order polynomial was retained as a common-order representation of the strain-dependent material parameters. It should be noted that the polynomial functions are intended only for interpolation within the experimentally investigated strain range of 0.10–0.90 and should not be extrapolated beyond this range.
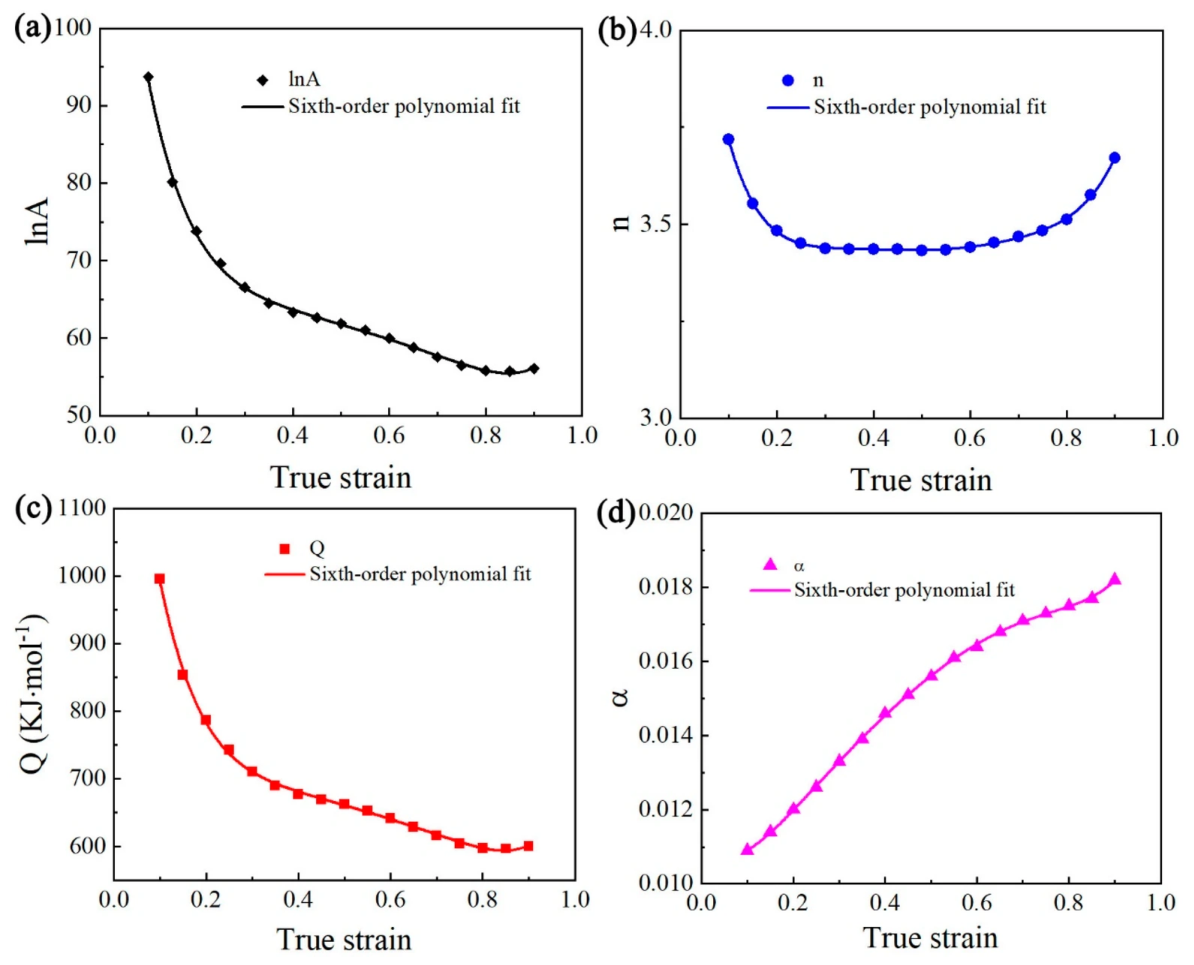
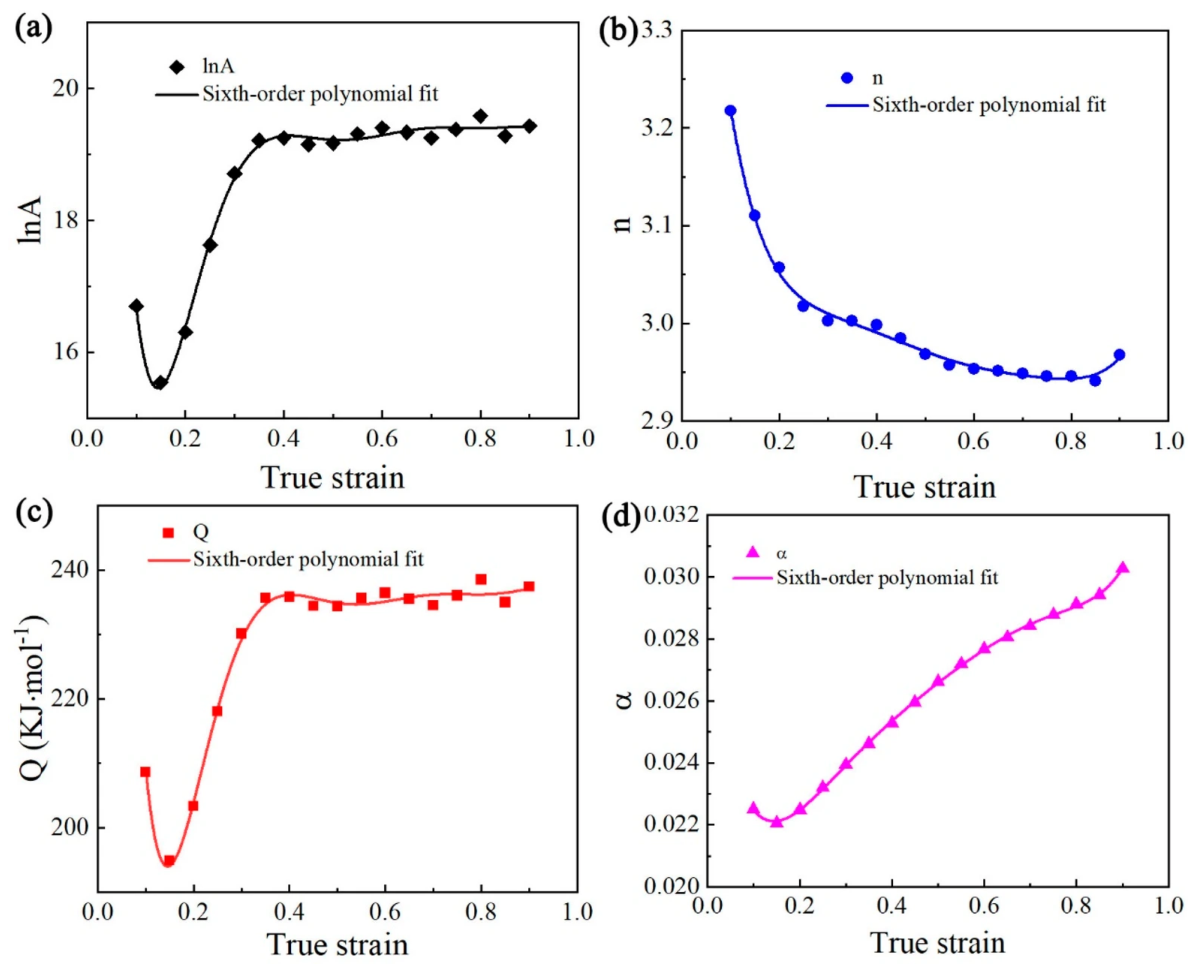
The corresponding relationships between the material constants and strain for the lamellar microstructure in different phase regions are presented in
Figure 8 and
Figure 9. The results indicate that the material parameters vary noticeably with increasing strain. For example, the apparent activation energy of the lamellar Ti65 alloy fluctuates between 597 and 1050 kJ/mol in the α + β phase region, whereas it varies within a narrower range of 195–238 kJ/mol in the β single-phase region. The polynomial coefficients and the corresponding functional expressions describing the strain-dependent material parameters in the constitutive equations are summarized in
Table 2 and
Table 3.
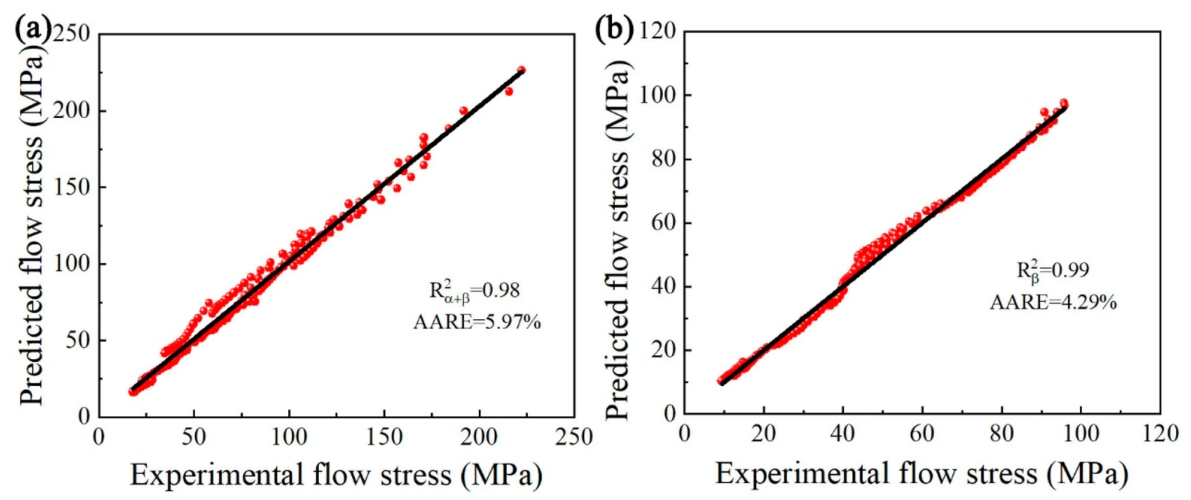
Figure 10 compares the agreement between the calculated and experimental flow stresses of the lamellar Ti65 alloy in different phase regions obtained using the Arrhenius-type constitutive model. To quantitatively evaluate the fitting accuracy of the established model, the correlation coefficient R and the average absolute relative error AARE were employed. These two statistical indicators are commonly used to assess the agreement between experimental and calculated values. The corresponding expressions are given as follows:
where
and
represent the experimental and predicted flow stress values, respectively;
and
are the average values of the experimental and predicted flow stresses, respectively; and
N is the total number of data points used for model evaluation.
The established models exhibit good fitting accuracy and agreement with the experimental flow stresses for the lamellar Ti65 alloy in both phase regions. In the α + β phase region, the correlation coefficient R and average absolute relative error AARE are 0.98 and 5.97%, respectively. In the β single-phase region, the corresponding values are 0.99 and 4.29%, respectively. These results indicate that the established strain-compensated Arrhenius-type constitutive equation can accurately describe the hot deformation behavior of the lamellar Ti65 alloy. Moreover, the slightly higher R value and lower AARE value in the β single-phase region suggest that the model exhibits better predictive capability in the β region than in the α + β phase region. The cross-validation results shown in
Table S2 further demonstrate satisfactory generalization capability of the constitutive model.
3.3. Hot Processing Map
At present, two main types of processing maps have been reported for hot deformation analysis: the Raj processing map based on an atomistic model [
40] and the processing map established using the dynamic materials model (DMM) [
41]. In general, the Raj map is mainly applicable to pure metals or relatively simple alloys, and the determination of its model parameters usually requires extensive theoretical calculations. Therefore, this approach has certain limitations and is not suitable for constructing the processing map of the multi-component Ti65 alloy.
In contrast, the DMM-based processing map has been widely used to evaluate the hot workability of various metallic materials, including aluminum alloys [
42], titanium alloys [
24] and high-strength steels [
43]. According to the DMM proposed by Prasad et al., the workpiece undergoing hot deformation can be regarded as a non-linear energy-dissipation system [
44]. The flow stress is assumed to follow a power-law relationship with strain rate, and the strain-rate sensitivity index can be used to calculate the power dissipation efficiency and identify flow-instability domains.
During hot deformation, the total external power input (P) is generally partitioned into two complementary parts: the power content (G), which is consumed by plastic deformation, and the power co-content (J), which is dissipated through microstructural evolution. Most of the energy associated with plastic deformation is converted into heat, while only a small fraction is stored in the material in the form of crystal defects. By contrast, the energy dissipated through microstructural evolution is closely related to deformation-induced metallurgical processes, such as dynamic recovery, dynamic recrystallization, dynamic phase transformation and globularization of lamellar microstructures. Accordingly, the total power input can be expressed as follows:
In the above equation,
and
denote the flow stress and strain rate during hot deformation, respectively.
G is defined as the dissipator content, while
J represents the dissipator co-content. For a fixed strain, the dependence of true stress on strain rate can be described by the following relationship:
where
–
are material constants determined by fitting the experimental data. The dissipator co-content
J can then be expressed as follows:
For an ideal linear dissipative system, the dissipator co-content reaches its maximum value,
Jmax, when the strain-rate sensitivity exponent
m is equal to 1. In the dynamic materials model, the power dissipation efficiency
η is commonly used to evaluate the hot workability of metallic materials. This parameter represents the fraction of the total power input that is dissipated through microstructural evolution during hot deformation. It can be calculated using the following equation:
To delineate the unsafe processing domains, the flow-instability criterion proposed by Prasad et al. was adopted [
45]. This criterion was developed from the extremum principle of irreversible thermodynamics for continuum systems, and the instability condition is given by:
where
D represents the dissipation function. Since the energy consumed by microstructural evolution during hot deformation is associated with the dissipator power co-content,
D can be replaced by
J according to the dynamic materials model, namely:
According to the maximum entropy production rate principle, the flow-instability criterion used in the processing map is finally obtained as:
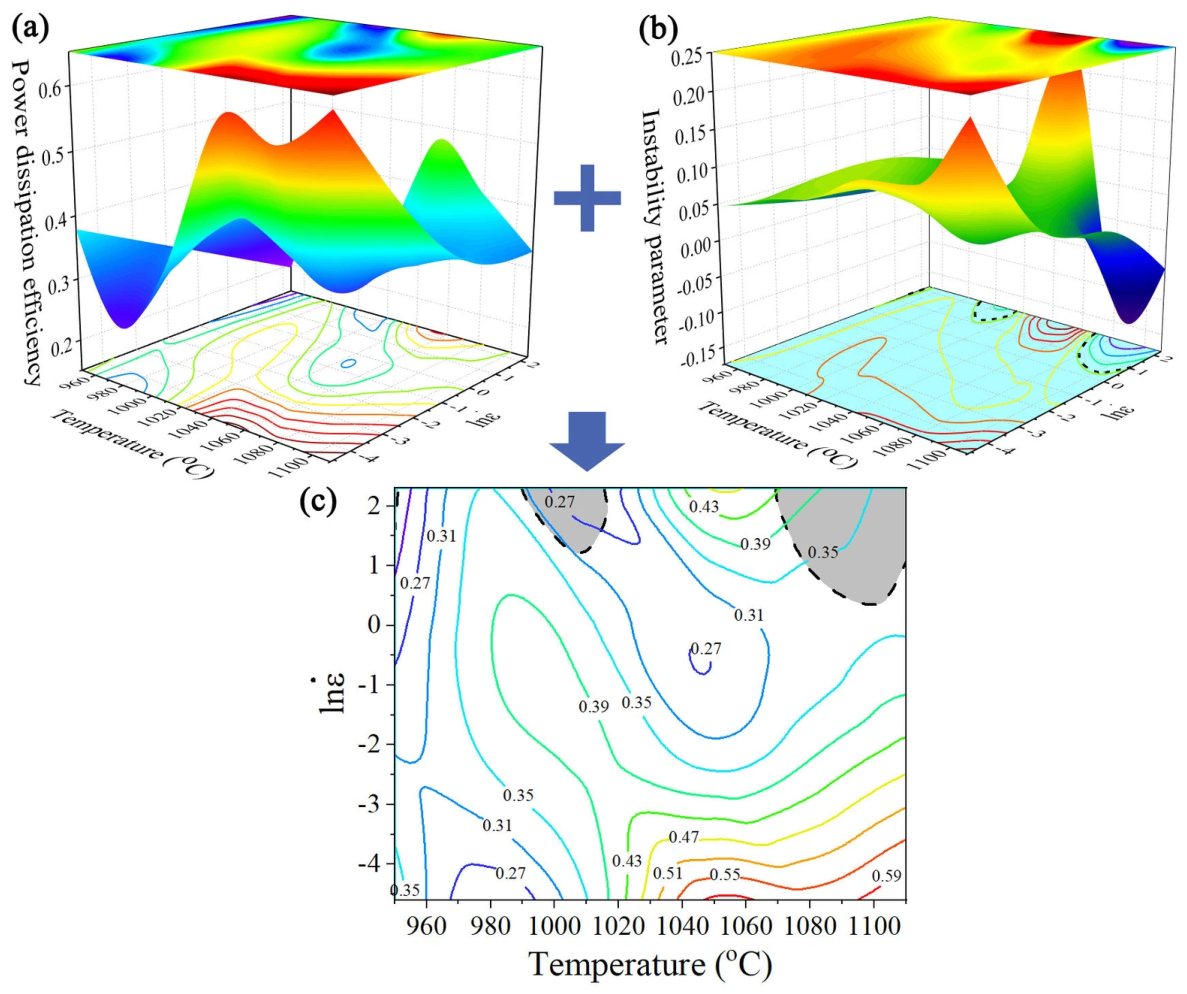
The processing map was constructed by superimposing the power dissipation map and the flow-instability map. At a given strain, the power dissipation efficiency η was calculated under different combinations of deformation temperature and strain rate, and the obtained η values were plotted as contour lines to generate the power dissipation map. Physically, η represents the relative entropy-production rate associated with microstructural evolution during hot deformation. Similarly, the instability map was established based on the flow-instability criterion and was used to identify unstable deformation domains in the two-dimensional space of deformation temperature and strain rate.
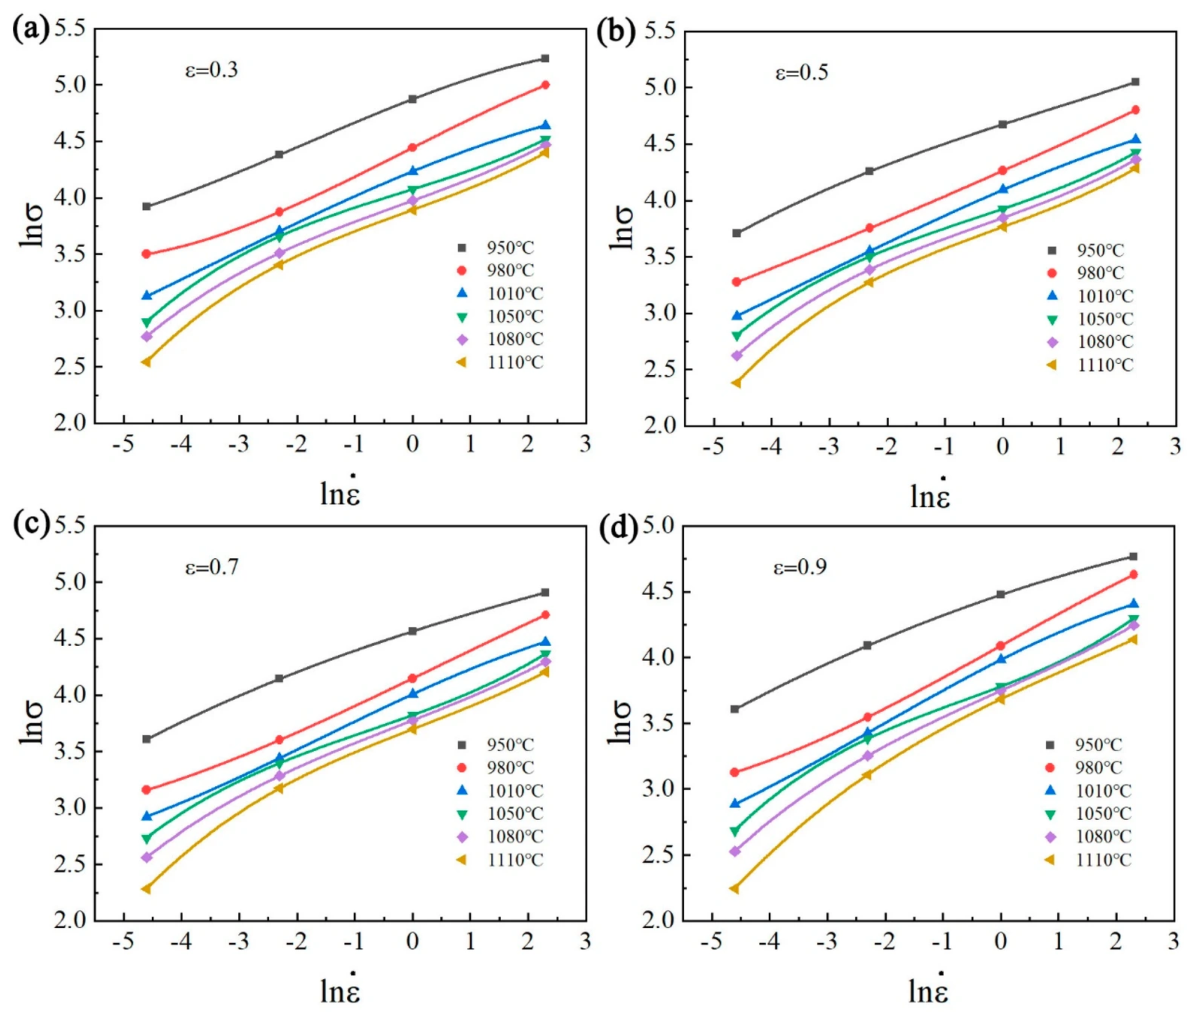
To calculate the power dissipation efficiency, the strain-rate sensitivity exponent
m was first determined from the relationship between
and
. The corresponding fitting results at different deformation temperatures are shown in
Figure 11. It can be observed that the strain rate has a pronounced influence on the flow stress, and the stress increases markedly with increasing strain rate. In addition, the effect of temperature on flow stress differs between the α + β phase region and the β single-phase region. In the lower-temperature α + β phase region, the flow stress is strongly affected by deformation temperature. By contrast, in the β single-phase region, the temperature sensitivity of flow stress becomes weaker. This tendency is particularly evident at high strain rates, where the variation in flow stress with increasing temperature is relatively limited.
The instability parameter in the processing map was calculated according to Equation (19). Specifically, the relationship between
and
was fitted using a polynomial function, and the corresponding slope under each deformation condition was then obtained. By adding this slope to the strain-rate sensitivity exponent
m, the instability parameter
was determined. The final processing map was constructed by superimposing the power dissipation map and the flow-instability map. Since the flow stress of Ti65 alloy evolves continuously with strain, the strain-rate sensitivity
m, power dissipation efficiency
η, and flow-instability parameter
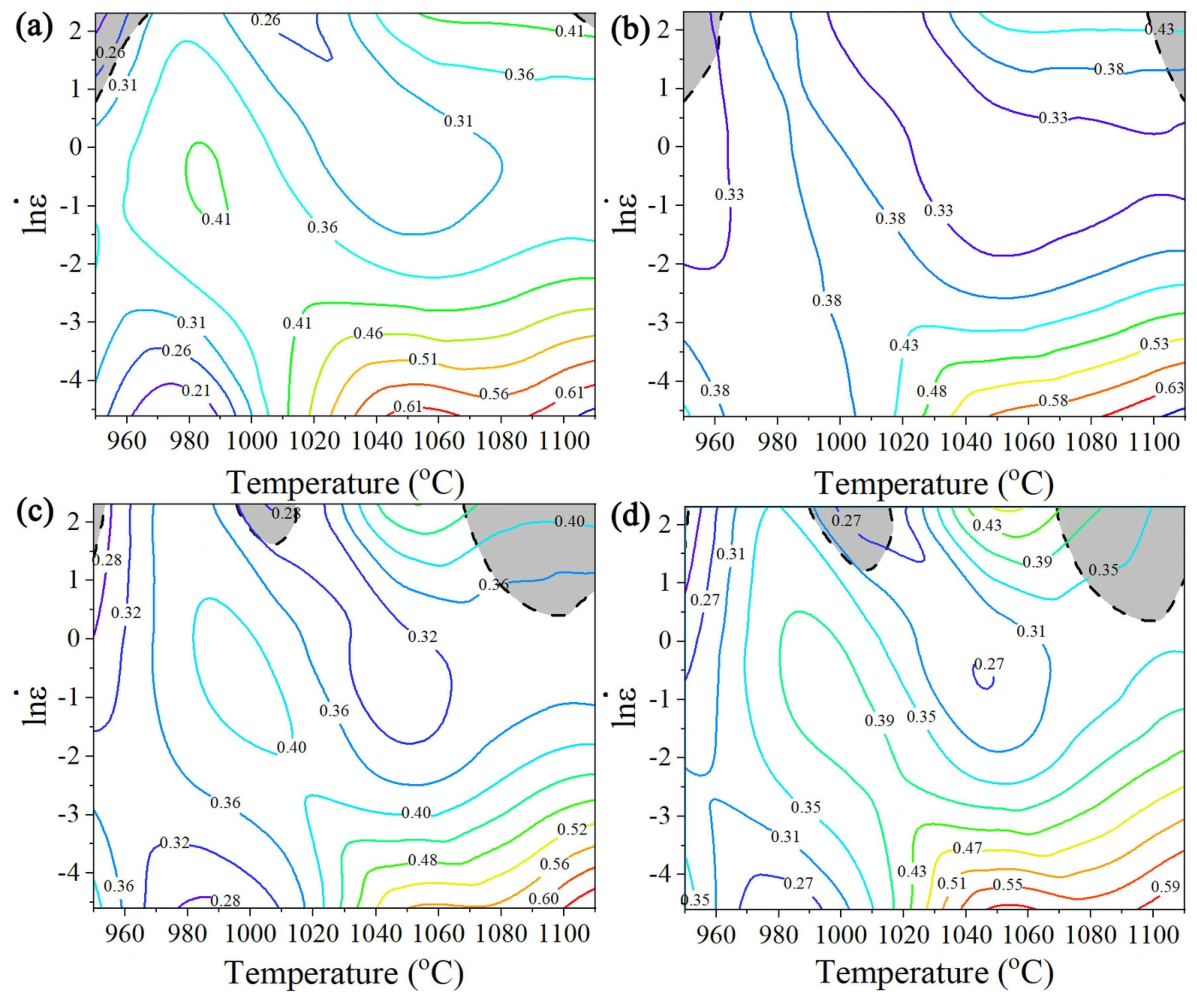
are also strain-dependent. Therefore, processing maps were additionally constructed at true strains of 0.3, 0.5, 0.7, and 0.9 to evaluate the evolution of hot workability with increasing deformation. The corresponding processing maps are shown in
Figure 12. It indicates that, at relatively low strains (
), the instability domains are mainly located in the low-temperature/high-strain-rate region. The total area occupied by the instability domains is relatively limited, suggesting that the alloy exhibits good hot workability at low strains and is less susceptible to flow instability during hot deformation. With increasing strain, the processing-map characteristics change progressively. When the strain exceeds 0.7, an additional instability domain emerges in the intermediate-temperature/high-strain-rate region, approximately within 995–1015 °C and 5–10 s
−1. As the strain further increases to 0.9, this intermediate-temperature instability domain expands slightly. These results demonstrate that the hot processing window of the lamellar Ti65 alloy is strain-dependent, and the tendency toward flow instability becomes more pronounced at larger strains.
Figure 13 shows the processing map of the lamellar Ti65 alloy at a strain of 0.9. The processing map established based on the dynamic materials model can be used to predict suitable hot-working domains and avoid the formation of microstructural defects [
46]. Su et al. [
25] also employed processing maps to identify the stable and unstable deformation regions of the short-term high-temperature titanium alloy DsTi700. Their results showed that obvious flow localization occurred in the instability domain at high strain rates, indicating an unstable microstructural state.
As shown in
Figure 13c, two instability domains can be identified during hot deformation of the lamellar Ti65 alloy. One is located above the phase-transformation temperature at high strain rates, corresponding to 1060–1110 °C and 1.65–10 s
−1. The other appears in the upper part of the α + β phase region below the phase-transformation temperature, within the range of 990–1020 °C and 3.5–10 s
−1. When deformation is conducted within these domains, the alloy is more likely to undergo flow instability. Typical plastic instability modes in titanium alloys include adiabatic shear bands, localized flow and wedge cracking [
4]. Macroscopic instability or cracking after hot deformation can usually be identified from the external appearance of the compressed specimens, whereas internal microstructural instability must be further confirmed by microstructural characterization. Therefore, although the processing map provides an effective basis for optimizing the hot-working window and improving the overall mechanical performance of the alloy, possible defect formation during actual deformation cannot be completely excluded. A combined analysis of processing maps and microstructural evolution is therefore necessary to further suppress plastic instability during hot working [
47].
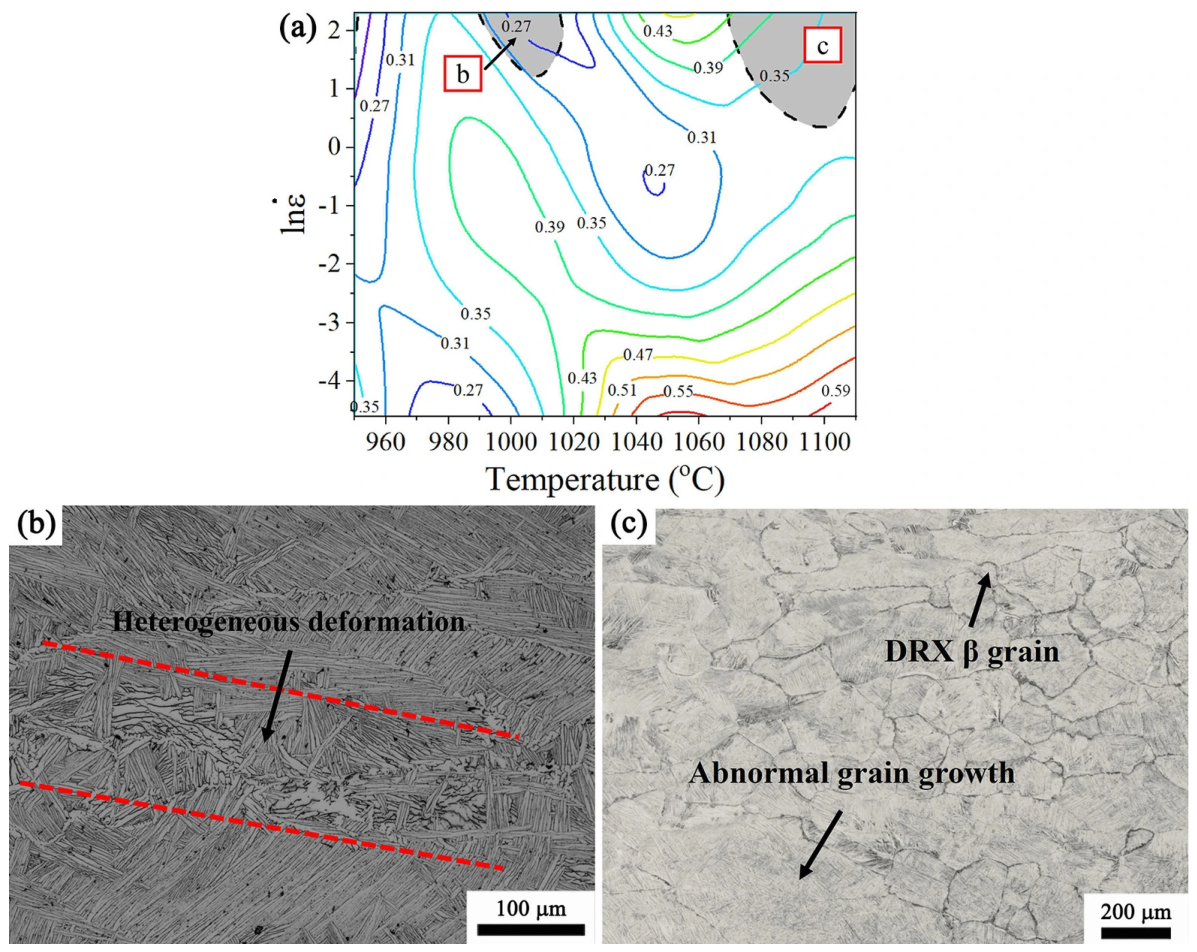
Figure 14 shows the processing map of the lamellar Ti65 alloy at a strain of 0.9 and the microstructures corresponding to the instability domains. As shown in
Figure 14a, two instability regions, marked as regions b and c, can be identified. Their representative microstructures are presented in
Figure 14b,c, respectively. At 1010 °C and 10 s
−1, the alloy was deformed in the upper α + β phase region, where partial α → β transformation may occur. Under the combined effects of large strain, high strain rate and adiabatic temperature rise, localized plastic deformation was promoted, resulting in non-uniform spheroidization of lamellar α. As indicated by the red dashed lines in
Figure 14b, a band-like region with heterogeneous α spheroidization was formed, suggesting a local instability feature that may cause stress concentration.
Figure 14c shows the microstructure deformed in the β single-phase region at 1110 °C and 10 s
−1. At this condition, the deformation condition lies within the instability domain predicted by the DMM instability criterion (
). The corresponding microstructure exhibits pronounced β-grain coarsening. However, grain coarsening itself should not be regarded as direct evidence of flow instability, because the high deformation temperature can also enhance β-grain-boundary mobility and promote grain growth. Therefore, the coarse β-grain morphology observed under this condition is interpreted as a microstructural feature accompanying the high-temperature/high-strain-rate instability domain, whereas the classification of flow instability is primarily based on the negative instability parameter obtained from the processing map. Although extensive dynamic recrystallization of β grains occurred, abnormal grain growth was also observed locally. This resulted in a mixed-grain structure composed of fine recrystallized grains and coarsened β grains. Such microstructural heterogeneity may induce non-uniform deformation during subsequent processing and negatively affect the mechanical properties of the final forged components.
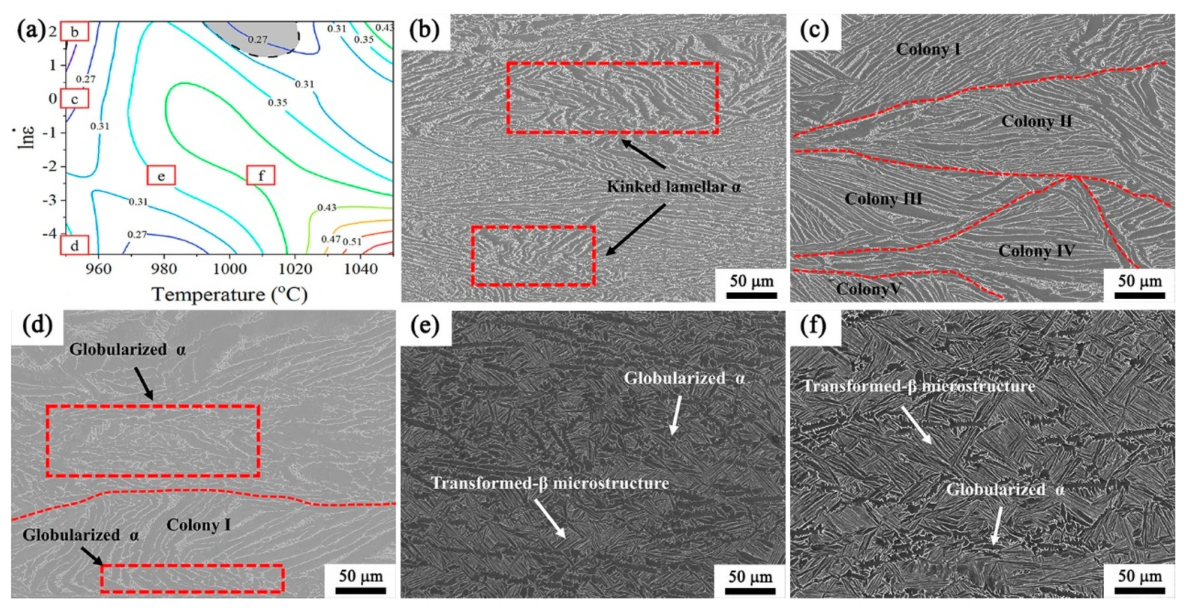
Figure 15a shows the processing map of the lamellar Ti65 alloy deformed in the α + β phase region. To correlate the processing-map characteristics with microstructure evolution, five representative specimens with different power dissipation efficiencies were selected for microstructural analysis, as marked by the red boxes b-f in
Figure 15a. Regions b and c correspond to relatively low power dissipation efficiencies (
η < 0.27). The corresponding microstructures after deformation at 950 °C/10 s
−1 and 950 °C/1 s
−1 are shown in
Figure 15b,c, respectively. With increasing strain rate, the lamellar α phase changes from a colony-like arrangement, as indicated by colonies I–V in
Figure 15c, to a more distorted morphology with local kinking and bending, as shown in
Figure 15b. Regions d and e exhibit moderate power dissipation efficiencies (0.31 <
η < 0.35). As shown in
Figure 15d, partial spheroidization of lamellar α occurs after deformation at 950 °C and 0.01 s
−1, but the spheroidization is highly heterogeneous and mainly limited to local regions within individual colonies. In colony I, most α lamellae still retain their plate-like morphology. This heterogeneous spheroidization may be related to the spatial arrangement and crystallographic orientation of α lamellae with respect to the loading direction. Previous studies have shown that “soft-oriented” α lamellae can activate multiple slip systems, such as basal and prismatic slip or prismatic and pyramidal <c + a> slip, thereby promoting a higher globularization efficiency. In
Figure 15e, when the temperature increases to 980 °C at a strain rate of 0.1 s
−1, the deformed microstructure consists of equiaxed α, elongated α and transformed β microstructure, including residual lamellar α and interlamellar β. Compared with the microstructure deformed at 950 °C, the degree of α spheroidization is further increased.
Region f in
Figure 15a corresponds to a high-power dissipation efficiency range of (0.39 <
η < 0.43), and the microstructure deformed at 1010 °C and 0.1 s
−1 is shown in
Figure 15f. Since this temperature is located in the upper α + β phase region and close to the β-rich region, a large amount of primary β phase participates in plastic deformation. As a result, a relatively high-volume fraction of transformed β microstructure is retained after deformation, as indicated by the white arrows in
Figure 15f. Meanwhile, the elevated temperature also promotes partial spheroidization of the deformed lamellar α phase. Compared with
Figure 15e, increasing the deformation temperature from 980 °C to 1010 °C at the same strain rate of 0.1 s
−1 leads to a noticeable increase in the transformed β microstructure. However, the amount of lamellar α involved in deformation decreases at the higher temperature, resulting in a lower degree of α spheroidization. Overall, the microstructures obtained at 980 °C/0.1 s
−1 and 1010 °C/0.1 s
−1 both show a tendency to evolve toward a bimodal microstructure.
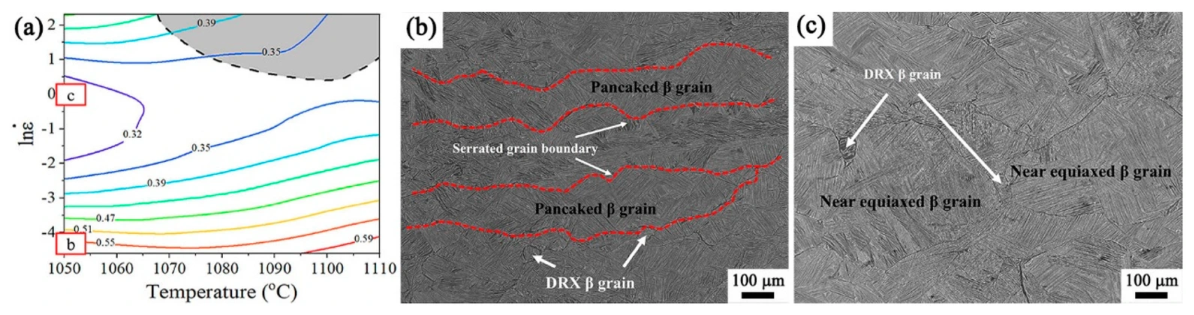
Figure 16a shows the processing map of the lamellar Ti65 alloy deformed in the β single-phase region. To reveal the effect of power dissipation efficiency on microstructure evolution, two representative conditions, marked as b (1050 °C, 0.01 s
−1) and c (1050 °C, 1 s
−1), were selected for microstructural analysis. The corresponding microstructures are shown in
Figure 16b,c, respectively. As the strain rate decreases and the
η value increases, the β grains after deformation tend to be elongated along the material flow direction. Meanwhile, serrated grain boundaries and a small number of dynamically recrystallized β grains can be observed, indicating obvious migration of the prior β grain boundaries under deformation. These features may be responsible for the relatively high power dissipation efficiency under this condition. In contrast, after deformation at 1050 °C and 1 s
−1, the prior β grains exhibit a higher degree of equiaxial morphology. A few dynamically recrystallized grains are also observed near the triple junctions, as indicated by the white arrows in
Figure 16c. During subsequent cooling from the β single-phase region, continuous grain-boundary α and intragranular α
s precipitate from the deformed β matrix.
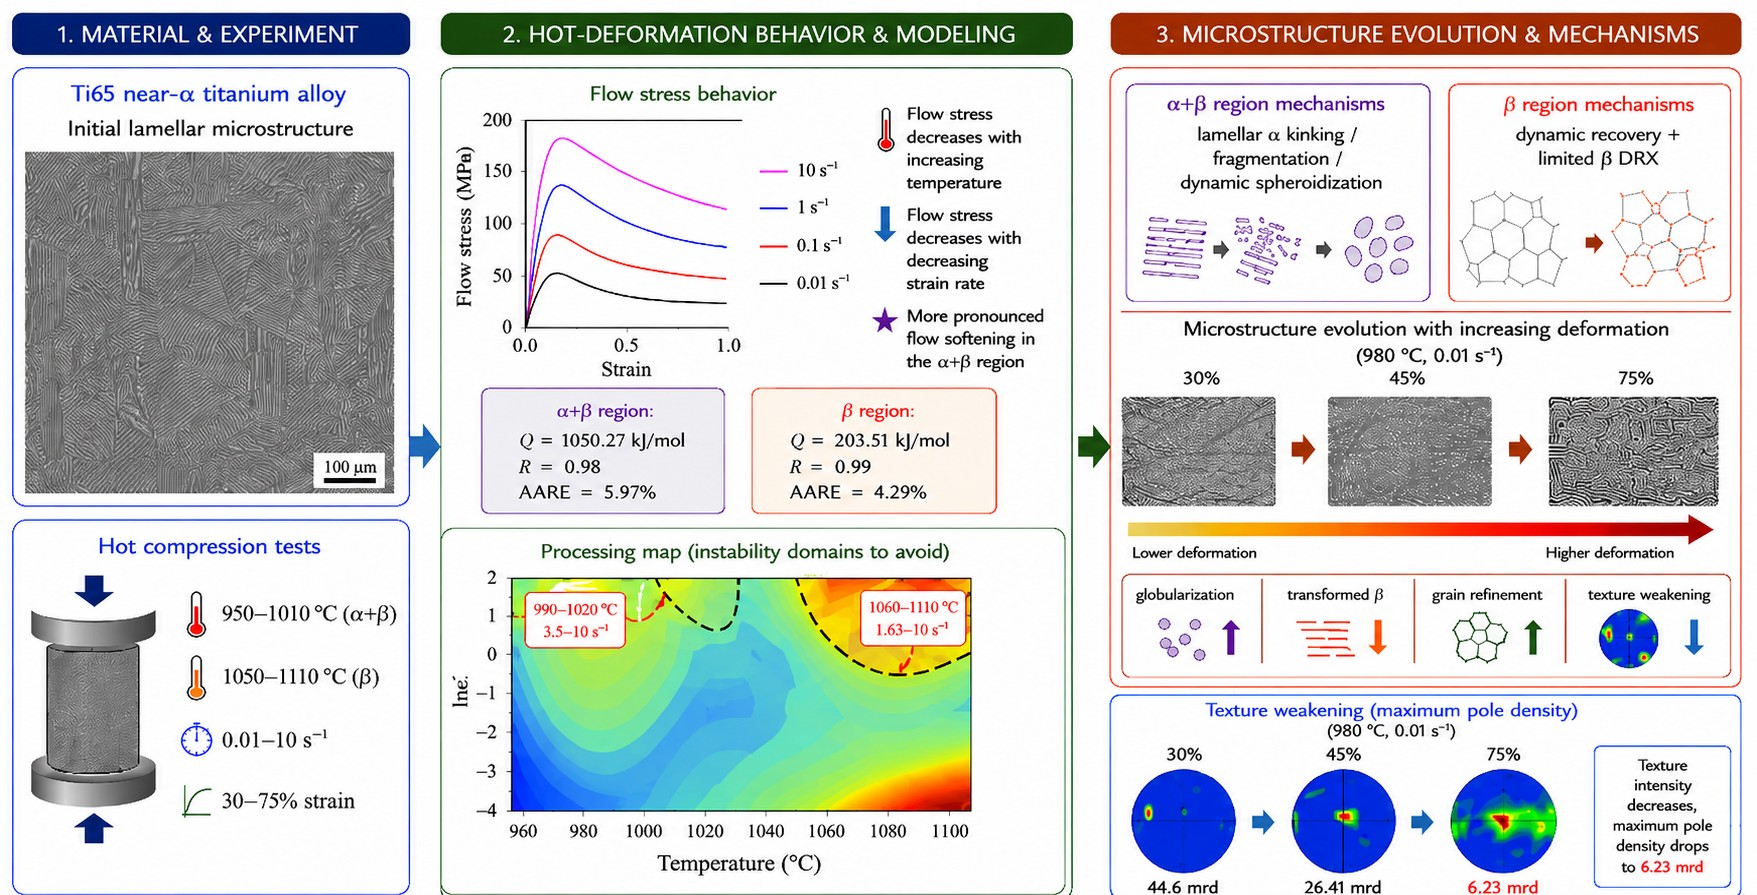
Based on the combined processing-map and microstructural analyses, the preferred hot-working conditions for the lamellar Ti65 alloy are located in the low-strain-rate region of the α + β phase field. Among the experimentally investigated conditions, deformation near 980 °C and 0.01–0.1 s−1 provides a favorable balance between flow stability and microstructural evolution. Under these conditions, the instability criterion is not satisfied, while α-lamella fragmentation and dynamic spheroidization are effectively promoted. At lower temperatures, spheroidization remains relatively heterogeneous, whereas increasing the temperature toward the β-transus increases the fraction of transformed β and reduces the amount of lamellar α participating in spheroidization. Therefore, a practical hot-working window centered around 980 °C and 0.01–0.1 s−1 is recommended for processing Ti65 alloy with an initial lamellar microstructure.
3.4. Microstructure Evolution Under Different Deformation Amounts
The hot deformation behavior, constitutive modeling and processing-map construction of the lamellar Ti65 alloy have been discussed above. The results indicate that dynamic spheroidization of lamellar α is the dominant microstructural evolution mechanism in the α + β phase region. Since the local deformation amount is usually non-uniform during forging, it is necessary to further clarify the effect of strain on microstructure and crystallographic orientation during hot deformation.
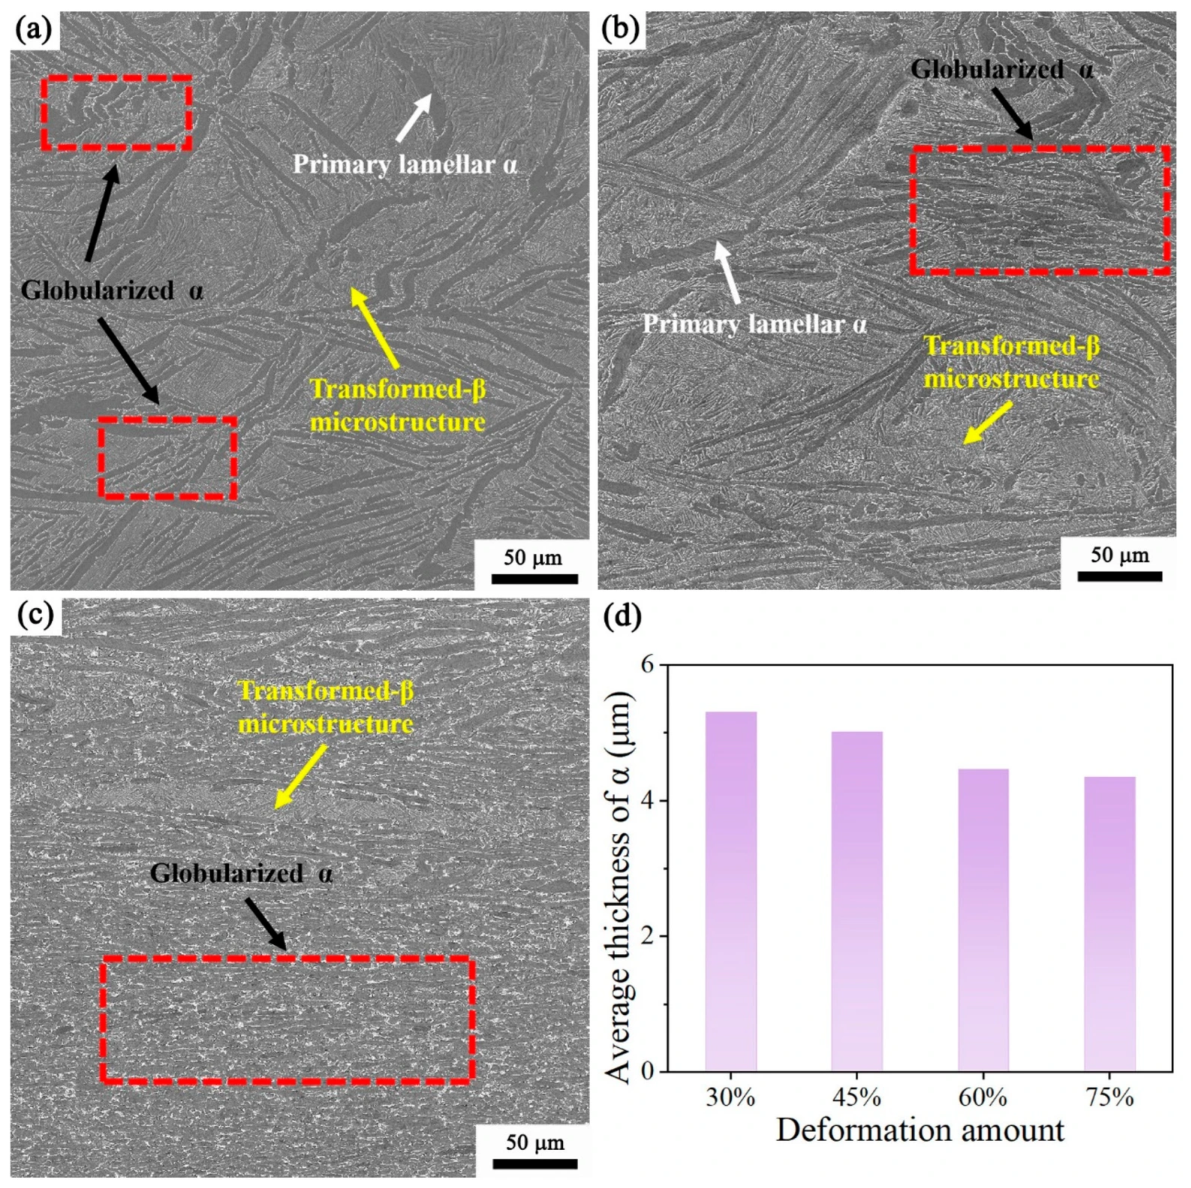
Figure 17 shows the microstructures of the lamellar Ti65 alloy deformed at 980 °C and 0.01 s
−1 under different deformation amounts, together with the quantitative statistics of the average thickness of primary lamellar α. As shown in
Figure 17a–c, the deformed microstructure is mainly composed of spheroidized equiaxed or nearly equiaxed α, residual elongated α with kinked or non-kinked morphology, short-rod-like α, and transformed β microstructure consisting of fine α
s lamellae and interlamellar β.
With increasing deformation amount, the fraction of transformed β microstructure gradually decreases, as marked by the yellow lines. When the deformation amount exceeds 60%, the transformed β fraction is reduced to below approximately 10%. This indicates that, during hot forging at 980 °C, the lamellar Ti65 alloy gradually evolves from a bimodal-like microstructure toward an equiaxed microstructure with increasing deformation amount. Meanwhile, the volume fraction of dynamically spheroidized α increases continuously, as indicated by the red boxes. The statistical results in
Figure 17d further show that the average thickness of primary lamellar α decreases with increasing deformation amount. Therefore, a larger deformation amount is beneficial for promoting α-lamella fragmentation, dynamic spheroidization and microstructural refinement toward equiaxed grains.
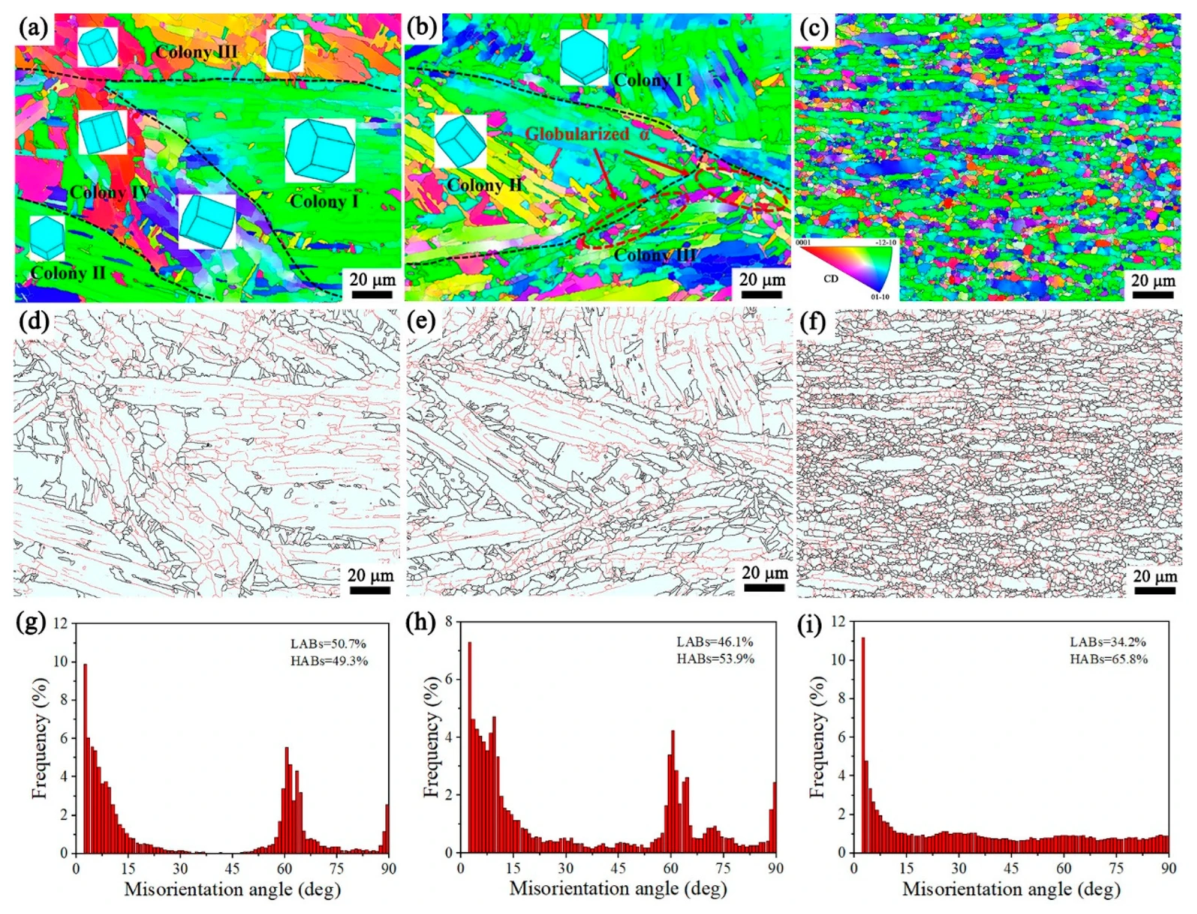
Figure 18 shows the effects of deformation amount on the orientation distribution, substructure and misorientation distribution of the lamellar Ti65 alloy deformed at 980 °C and 0.01 s
−1. As shown in
Figure 18a, when the deformation amount is 30%, most α colonies still maintain relatively uniform orientations, such as colonies I–III. However, an obvious orientation gradient appears in colony IV, which may provide favorable conditions for subsequent dynamic spheroidization of lamellar α. When the deformation amount increases to 45%, the orientation gradients within colonies I–III become more pronounced, as shown in
Figure 18b. Meanwhile, some spheroidized fine α grains are distributed along the edges of adjacent colonies, as marked by the red dashed ellipses. At a deformation amount of 75%, most lamellar α has undergone obvious dynamic spheroidization, and the degree of grain refinement is significantly enhanced, as shown in
Figure 18c.
Figure 18d–f show the corresponding grain-boundary maps, and
Figure 18g–i present the misorientation distributions. At 30% deformation, most lamellar α remains unspheroidized, and low-angle grain boundaries are mainly located inside individual colonies. As the deformation amount increases to 45%, the fraction of low-angle grain boundaries decreases from 50.7% to 46.1%, while that of high-angle grain boundaries increases from 49.3% to 53.9%. These high-angle boundaries are mainly distributed within α colonies and along the edges of neighboring colonies, indicating that increasing deformation promotes α-lamella subdivision, boundary evolution and dynamic spheroidization.
It should be noted that, with increasing deformation amount, the fractions of boundaries near 10°, 60° and 90° in the misorientation distribution gradually decrease, whereas those in the ranges of 30–45° and 75–90° increase. This variation is closely related to the progressive destruction of the Burgers orientation relationship during dynamic spheroidization. At a low deformation amount, most lamellar α remains unspheroidized, and the crystallographic relationship inherited from the β → α transformation is largely retained. Therefore, the misorientation distribution at 30% deformation shows relatively high fractions near 10°, 60° and 90°. With further deformation, β-phase penetration and α-lamella fragmentation promote dynamic spheroidization. As a result, the spheroidized α particles no longer maintain a specific misorientation relationship with neighboring lamellar α, leading to increased fractions of misorientations in the ranges of 30–45° and 75–90°. When the deformation amount reaches 75%, the volume fraction of spheroidized α increases markedly, and the misorientation distribution becomes relatively uniform between 15° and 90° without distinct peaks. This further confirms that, with increasing deformation, the progressive fragmentation of the α lamellae and the increasing separation of α segments by the β phase reduce the crystallographic orientation coherence within the original α colonies inherited from the prior β phase.
Quantitative grain-boundary analysis was further performed using misorientation-angle criteria of 2–15° for LABs and ≥15° for HABs. At a deformation amount of 30%, the LAB and HAB fractions are 50.7% and 49.3%, respectively. With increasing deformation, the LAB fraction decreases whereas the HAB fraction increases, indicating progressive conversion of deformation-induced subboundaries into high-angle boundaries. This evolution is consistent with the accumulation and rearrangement of dislocations within the lamellar α phase, followed by subdivision of the α lamellae and progressive interfacial separation during dynamic spheroidization. At the highest deformation amount of 75%, the HAB fraction increased to 65.8% and together with the more dispersed misorientation distribution provides quantitative EBSD evidence for the enhanced subdivision and spheroidization of lamellar α. It should be distinguished that α-lamella fragmentation and spheroidization represent successive morphological stages rather than identical processes. Fragmentation refers to the subdivision or breakup of the original continuous α lamellae into shorter segments, while these segments may still retain an elongated morphology (). , where I and b represent the major and minor dimensions of an α particle, respectively. Dynamic spheroidization involves further interface migration and morphological adjustment, leading to isolated near-equiaxed α particles with . Therefore, only α particles satisfying the aspect-ratio criterion were included in the quantitatively determined spheroidized fraction.
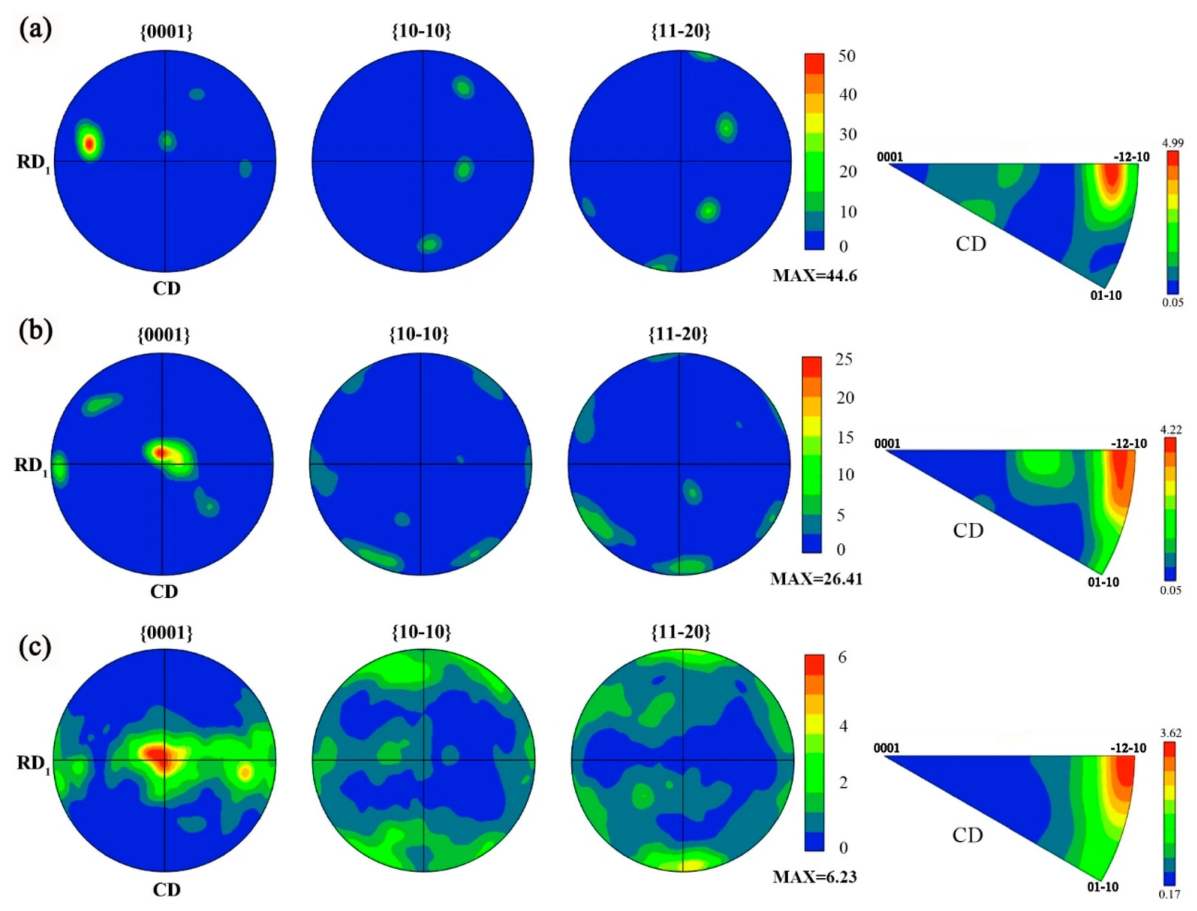
Figure 19 shows the pole figures and inverse pole figures of the lamellar Ti65 alloy deformed at 980 °C and 0.01 s
−1 under different deformation amounts. At 30% deformation, the {0001} pole figure in
Figure 19a shows a relatively concentrated orientation distribution. This is mainly because most α lamellae still retain their colony-like morphology, and the α lamellae within the same colony have similar crystallographic orientations. Only local orientation gradients are formed at this deformation amount. Therefore, a relatively high maximum pole density is obtained, and the inverse pole figure indicates that the dominant orientation is close to <11-20>//CD. When the deformation amount increases to 45%, the orientation gradient within α colonies becomes more pronounced. As a result, the orientations within the same colony become more dispersed, leading to a clear decrease in the maximum pole density, as shown in
Figure 19b. Meanwhile, the fiber texture gradually spreads from <11-20>//CD toward <10-10>//CD and <-24-23>//CD. At 75% deformation, the c-axis of the deformed α phase tends to rotate away from the compression direction, and the {0001} pole figure exhibits a more dispersed basal-pole distribution, as shown in
Figure 19c. The maximum pole density decreases to 6.23 mrd. This indicates that extensive dynamic spheroidization not only promotes grain refinement but also weakens the initial texture intensity of the lamellar microstructure.