1. Introduction
Beryl is a hexagonal cyclosilicate with the ideal formula of Be
3Al
2Si
6O
18. Its structure consists of six-membered [SiO
4] rings stacked along the c-axis and linked by AlO
6 octahedra and BeO
4 tetrahedra, forming continuous structural channels parallel to the c-axis. These channels can accommodate H
2O; CO
2; and non-framework constituents such as Na, Li, K, Rb, and Cs [
1,
2,
3,
4,
5,
6,
7]. Transition metals including Cr, V, and Fe can enter or modify local coordination environments in the beryl lattice and produce characteristic absorption in the visible and near-infrared regions [
8,
9,
10,
11,
12]. UV–Vis–NIR spectroscopy probes transition-metal-related electronic absorption, whereas Raman and FTIR spectroscopy provide complementary information on framework vibrations and channel constituents [
13,
14,
15,
16,
17].
The green color of emerald is commonly associated with Cr
3+ and V
3+. In near-octahedral coordination, electronic transitions of both ions produce broad bands in the violet–blue and orange–red regions, with substantial overlap between their principal absorption ranges [
8,
18,
19,
20,
21]. Fe
3+ and Fe
2+ may add responses in the near-ultraviolet, short-wavelength visible, and near-infrared regions, further complicating spectral assignments in natural samples [
9,
10,
11,
12,
22,
23]. Band positions alone are therefore generally insufficient to distinguish the relative contributions of V and Cr, and independent compositional constraints are required. Artificially doped crystals allow specific dopant-related centers to be examined under controlled conditions, whereas natural crystals commonly contain compositional heterogeneity, fractures, inclusions, and several coexisting trace constituents [
24,
25,
26,
27].
In addition to transition-metal composition, the beryl framework and molecular species within its structural channels form an important part of the spectroscopic background. Raman spectroscopy characterizes framework vibrations involving Al–O, Si–O–Si, and Si–O/Be–O units and can verify the dominant phase in the analyzed region. FTIR spectroscopy identifies both framework vibrations and bands associated with type-I and type-II channel water. Natural and synthetic beryl may differ in their combinations of transition-metal constituents, alkali elements, and channel water [
5,
7,
15,
16,
17,
28,
29].
Natural green beryl has recently been identified in the North Muzart River area in Zhaosu County, Xinjiang, northwestern China, but this material has not previously been examined through an integrated comparison of transition-metal composition, electronic absorption, framework vibrations, and channel-water features. The samples are enriched in V, whereas Cr was not detected under the present EDXRF conditions, providing a V-dominant compositional context for examining visible absorption.
This study combines microscopy, EDXRF, UV–Vis–NIR, Raman, and FTIR spectroscopy to characterize the transition-metal composition, electronic absorption, dominant phase, and channel-water features of natural V-rich green beryl from the North Muzart River area. Particular emphasis is placed on the compositional constraints on the broad absorption bands near 429 and 617 nm and on the beryl framework and channel environment in which these electronic absorptions occur.
2. Materials and Methods
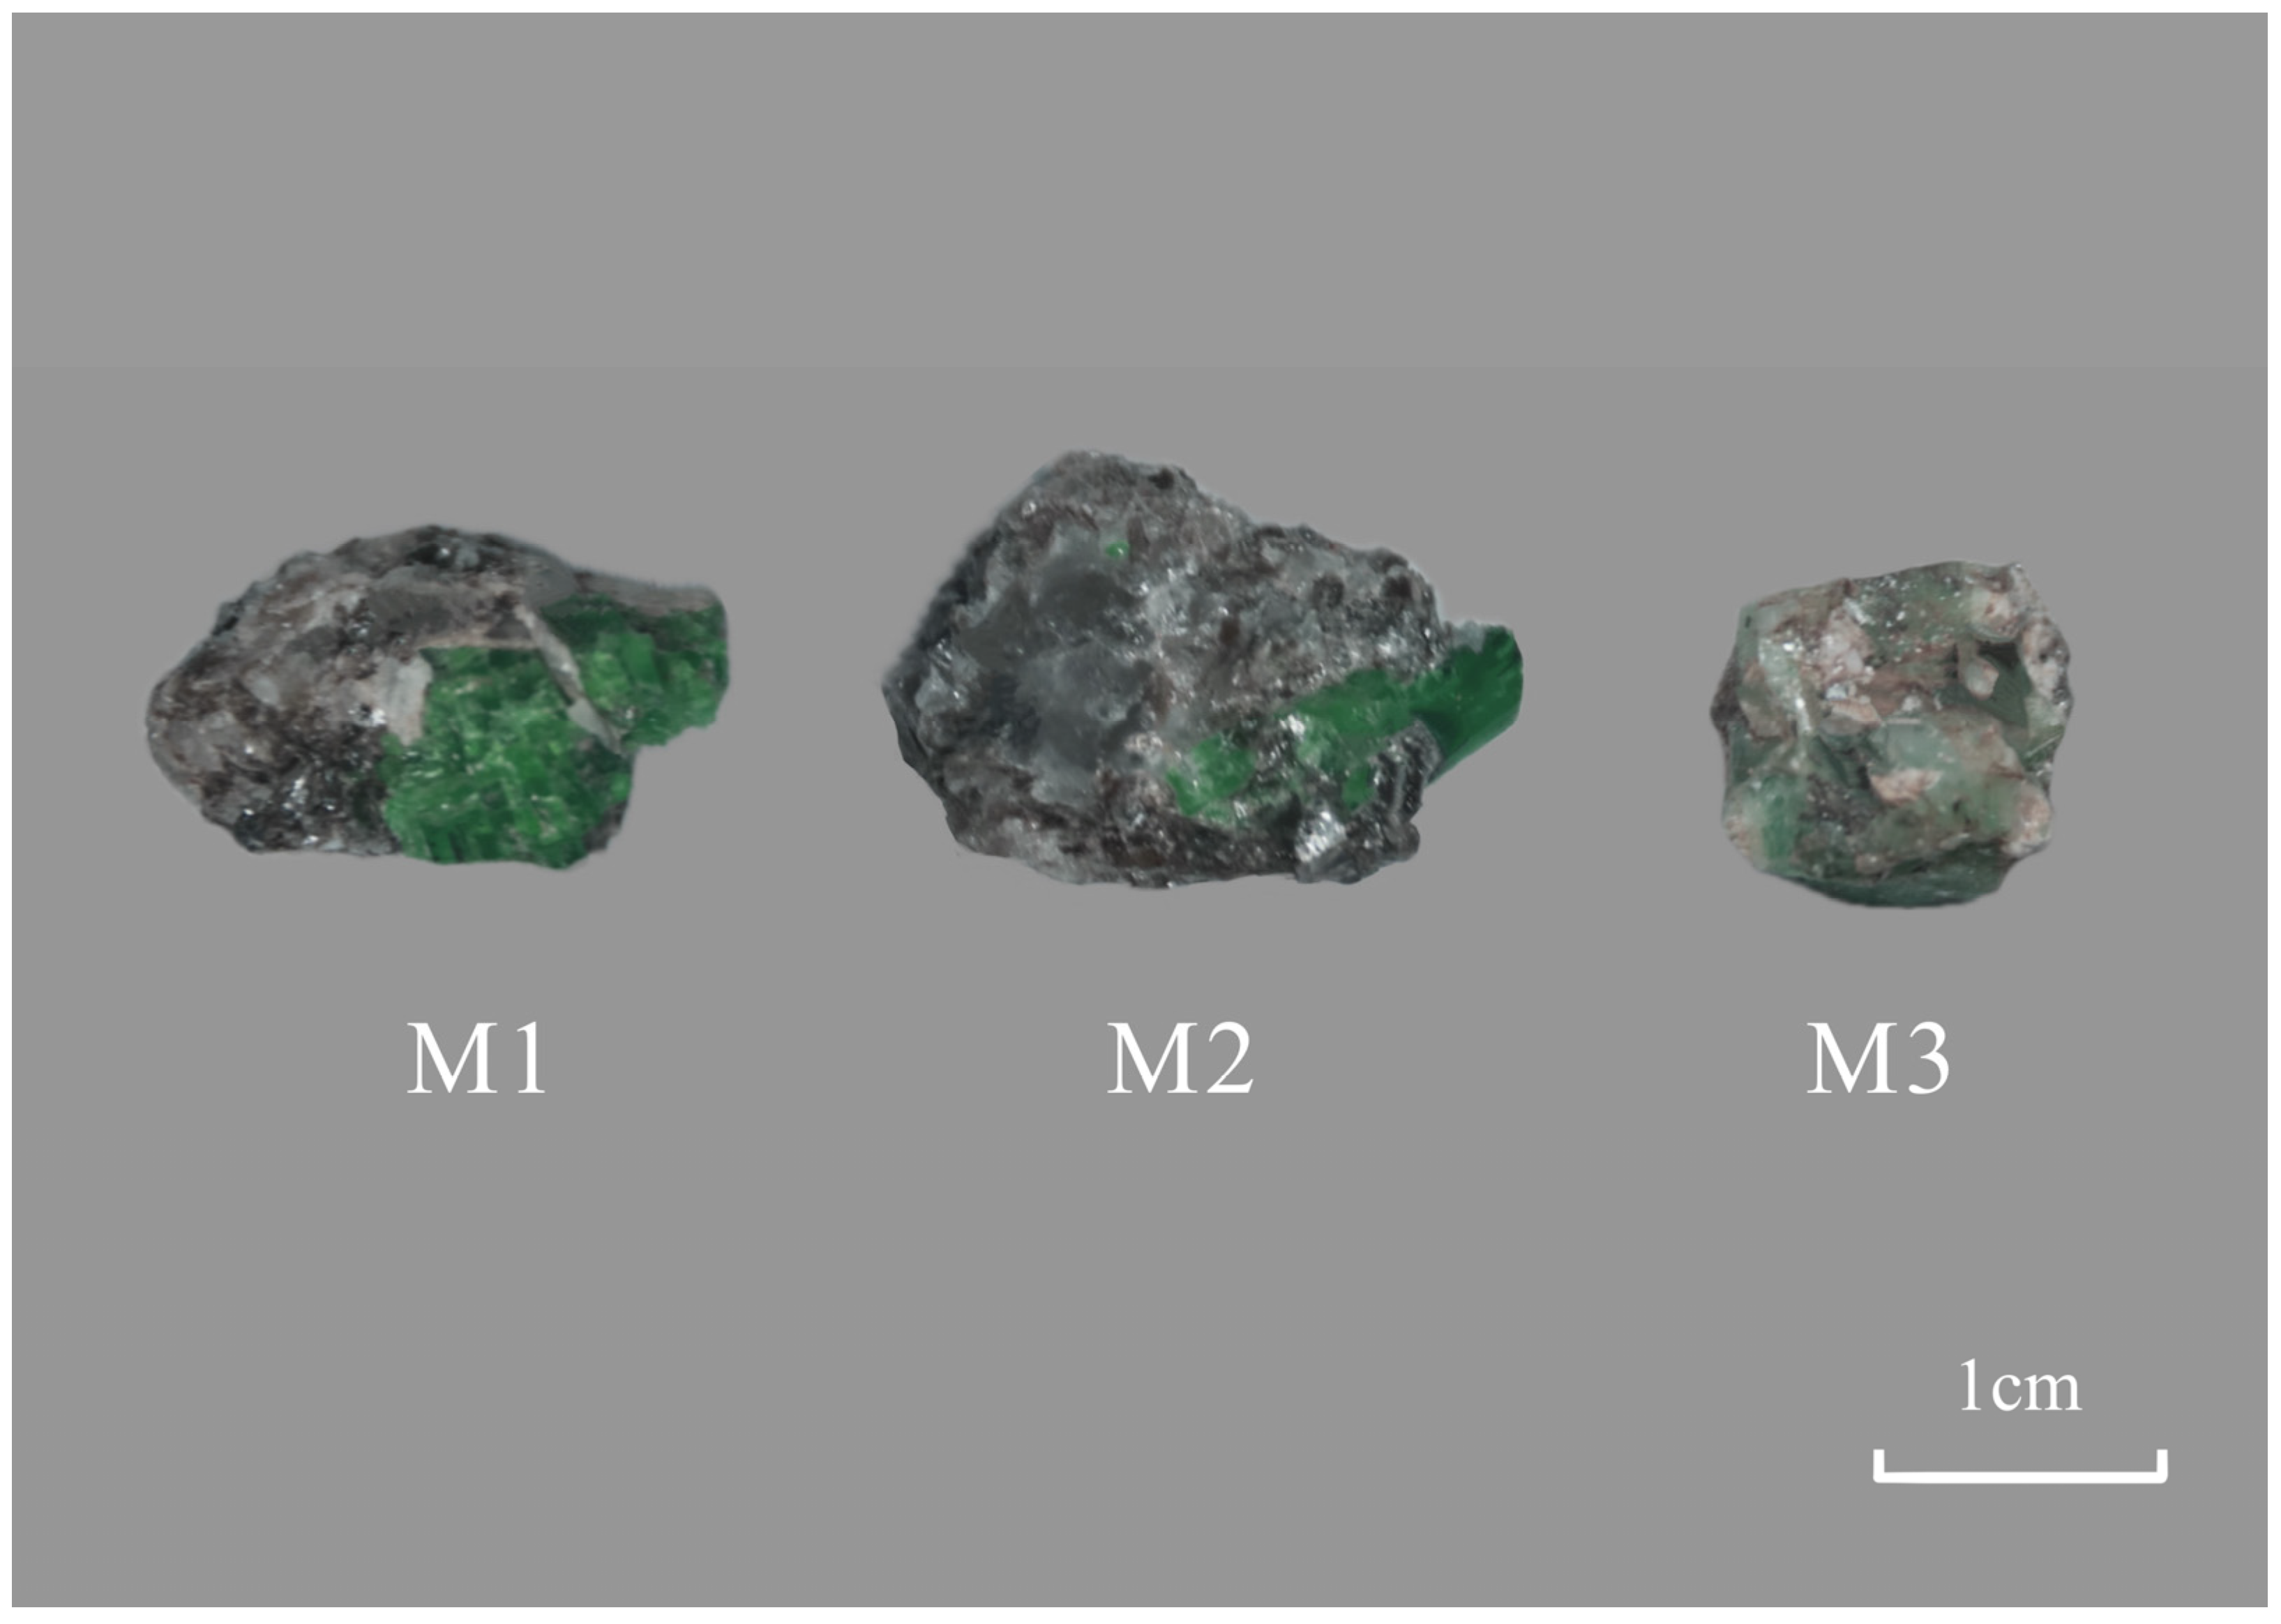
The samples were obtained from the North Muzart River area in Zhaosu County, Xinjiang, northwestern China. Ten natural green beryl specimens were selected, including three specimens attached to host rock. In samples M1–M3, the green beryl occurs mainly as irregular aggregates or locally developed hexagonal prismatic crystals. Crystal–host-rock boundaries are irregular, and fractures and fragments of host-rock minerals are locally visible (
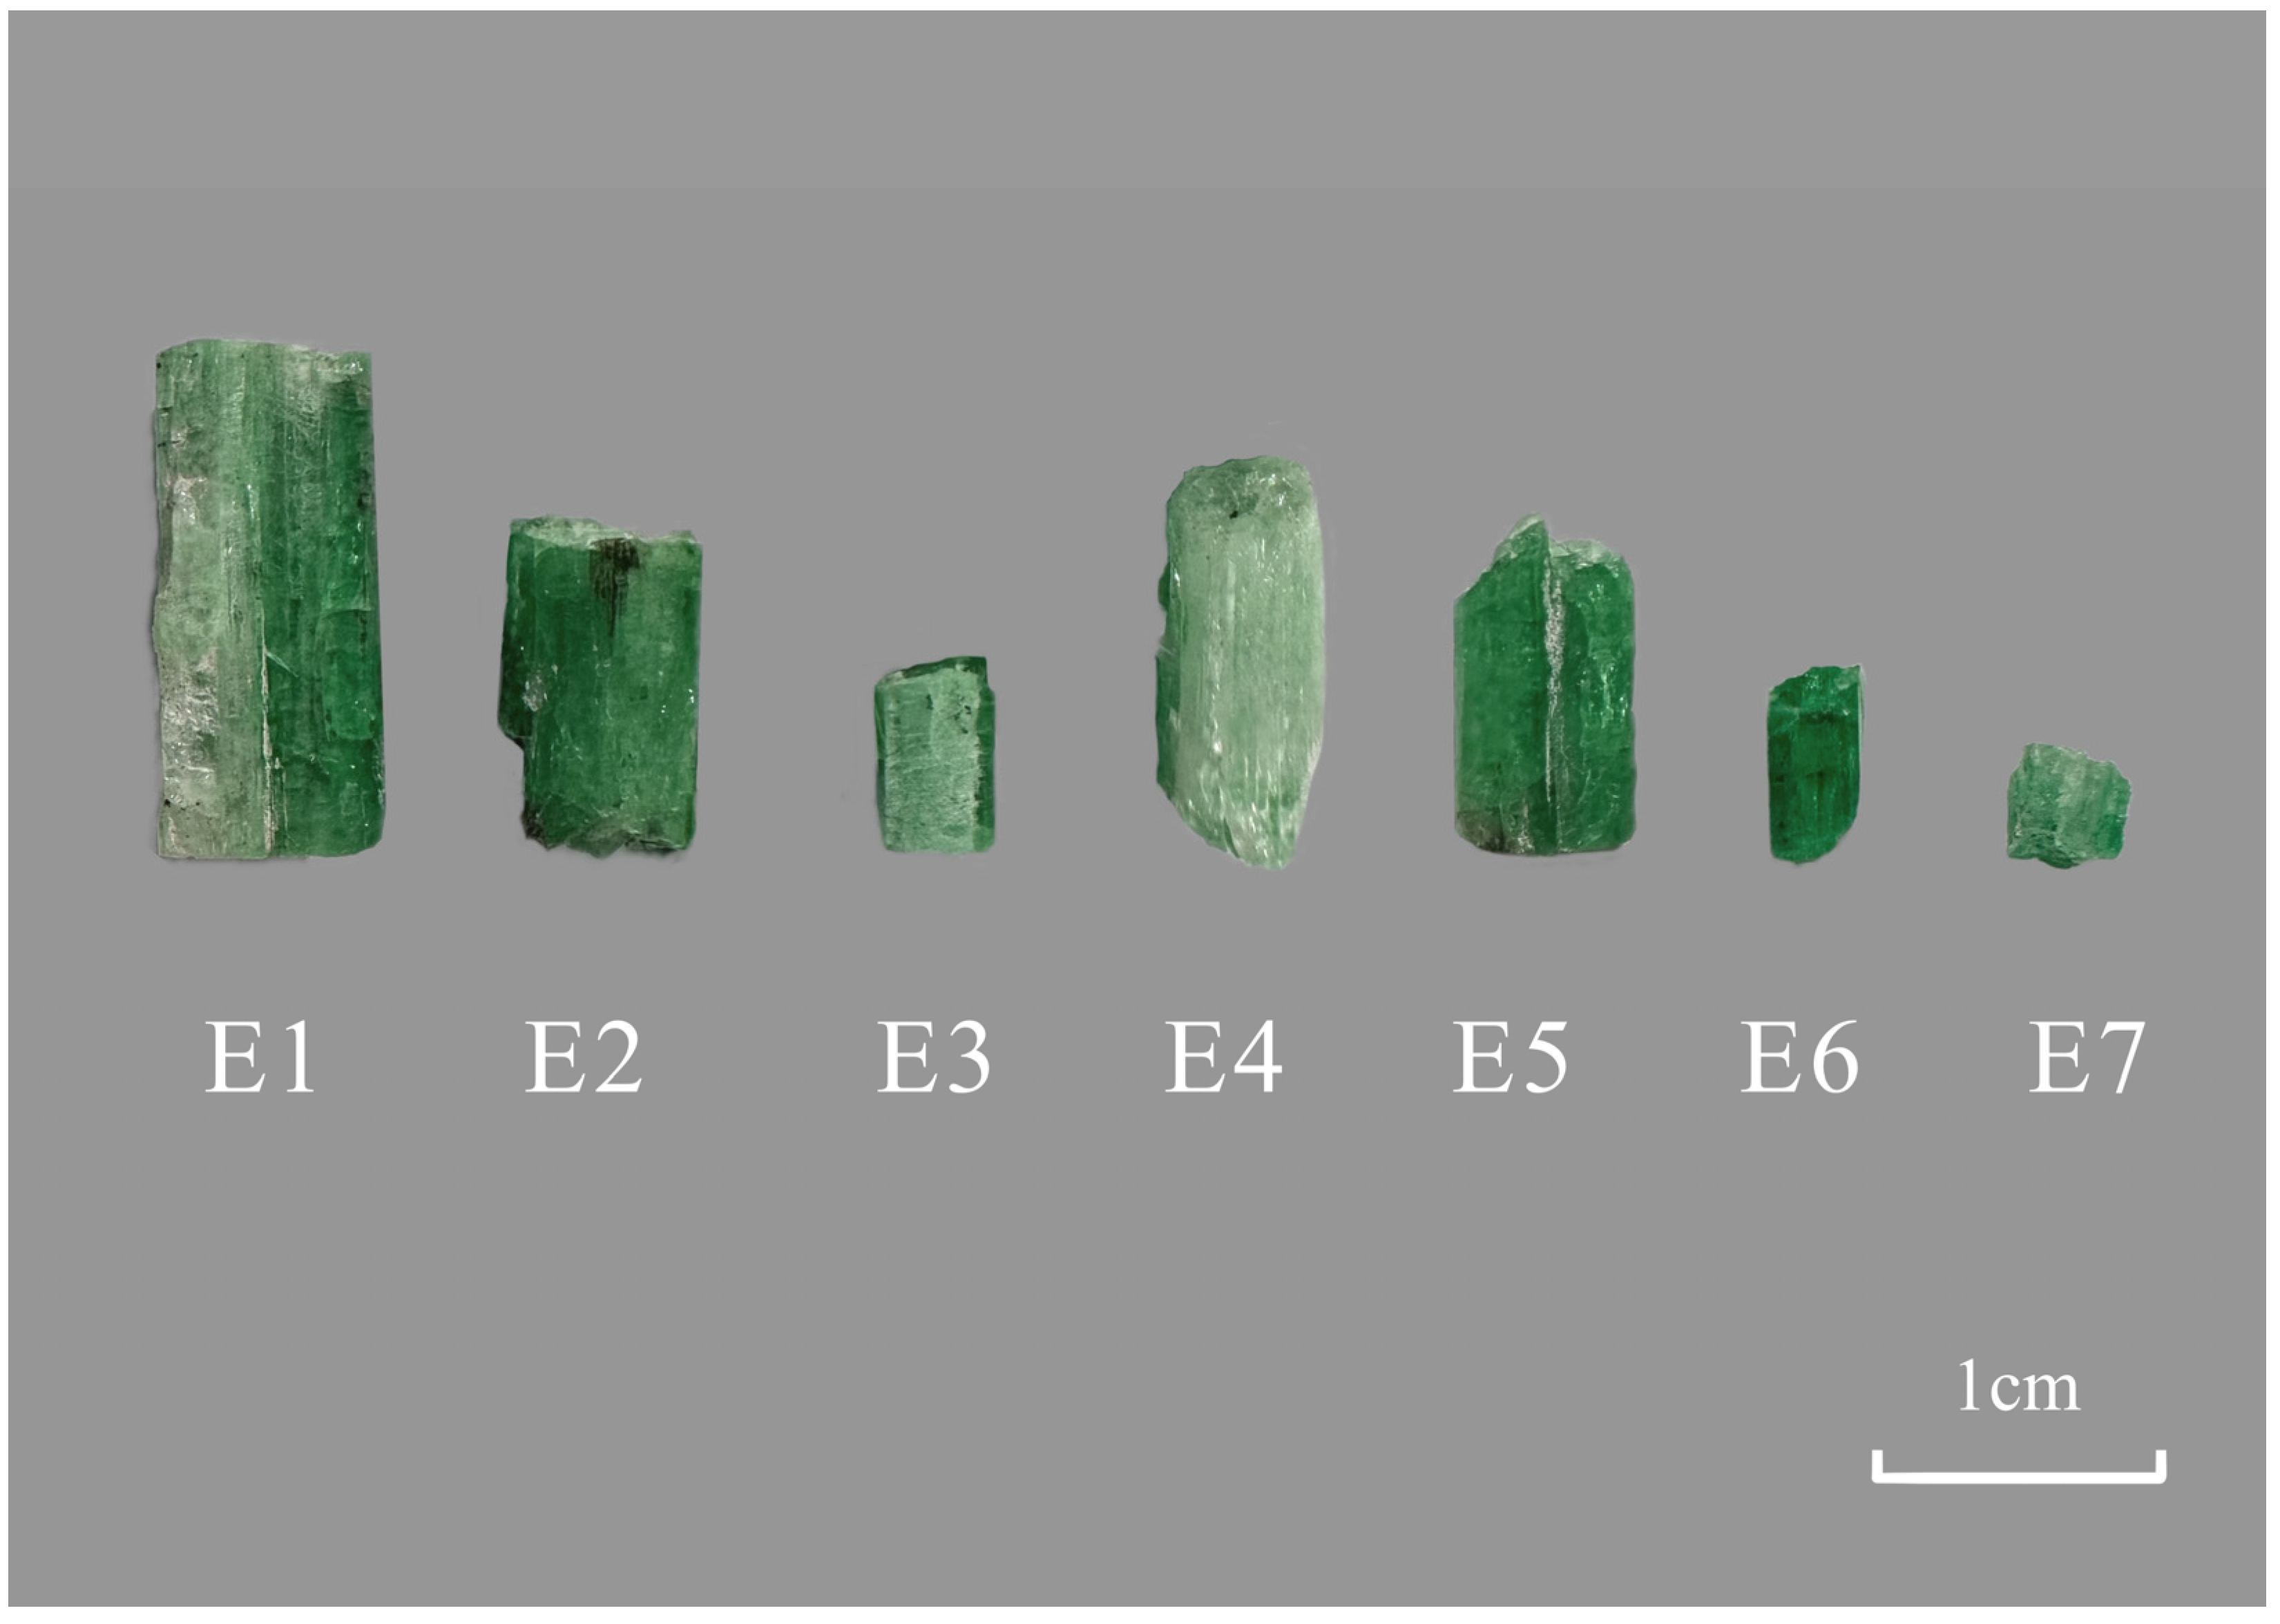
Figure 1). Detached crystals E1–E7 retain hexagonal prismatic outlines, natural crystal faces, and longitudinal striations parallel to the c-axis. They are generally of low transparency and range from pale to dark green (
Figure 2). External morphology was examined with a GI-MP22 (Baoguang Technologies, Nanjing, China) gemological microscope equipped for photography.
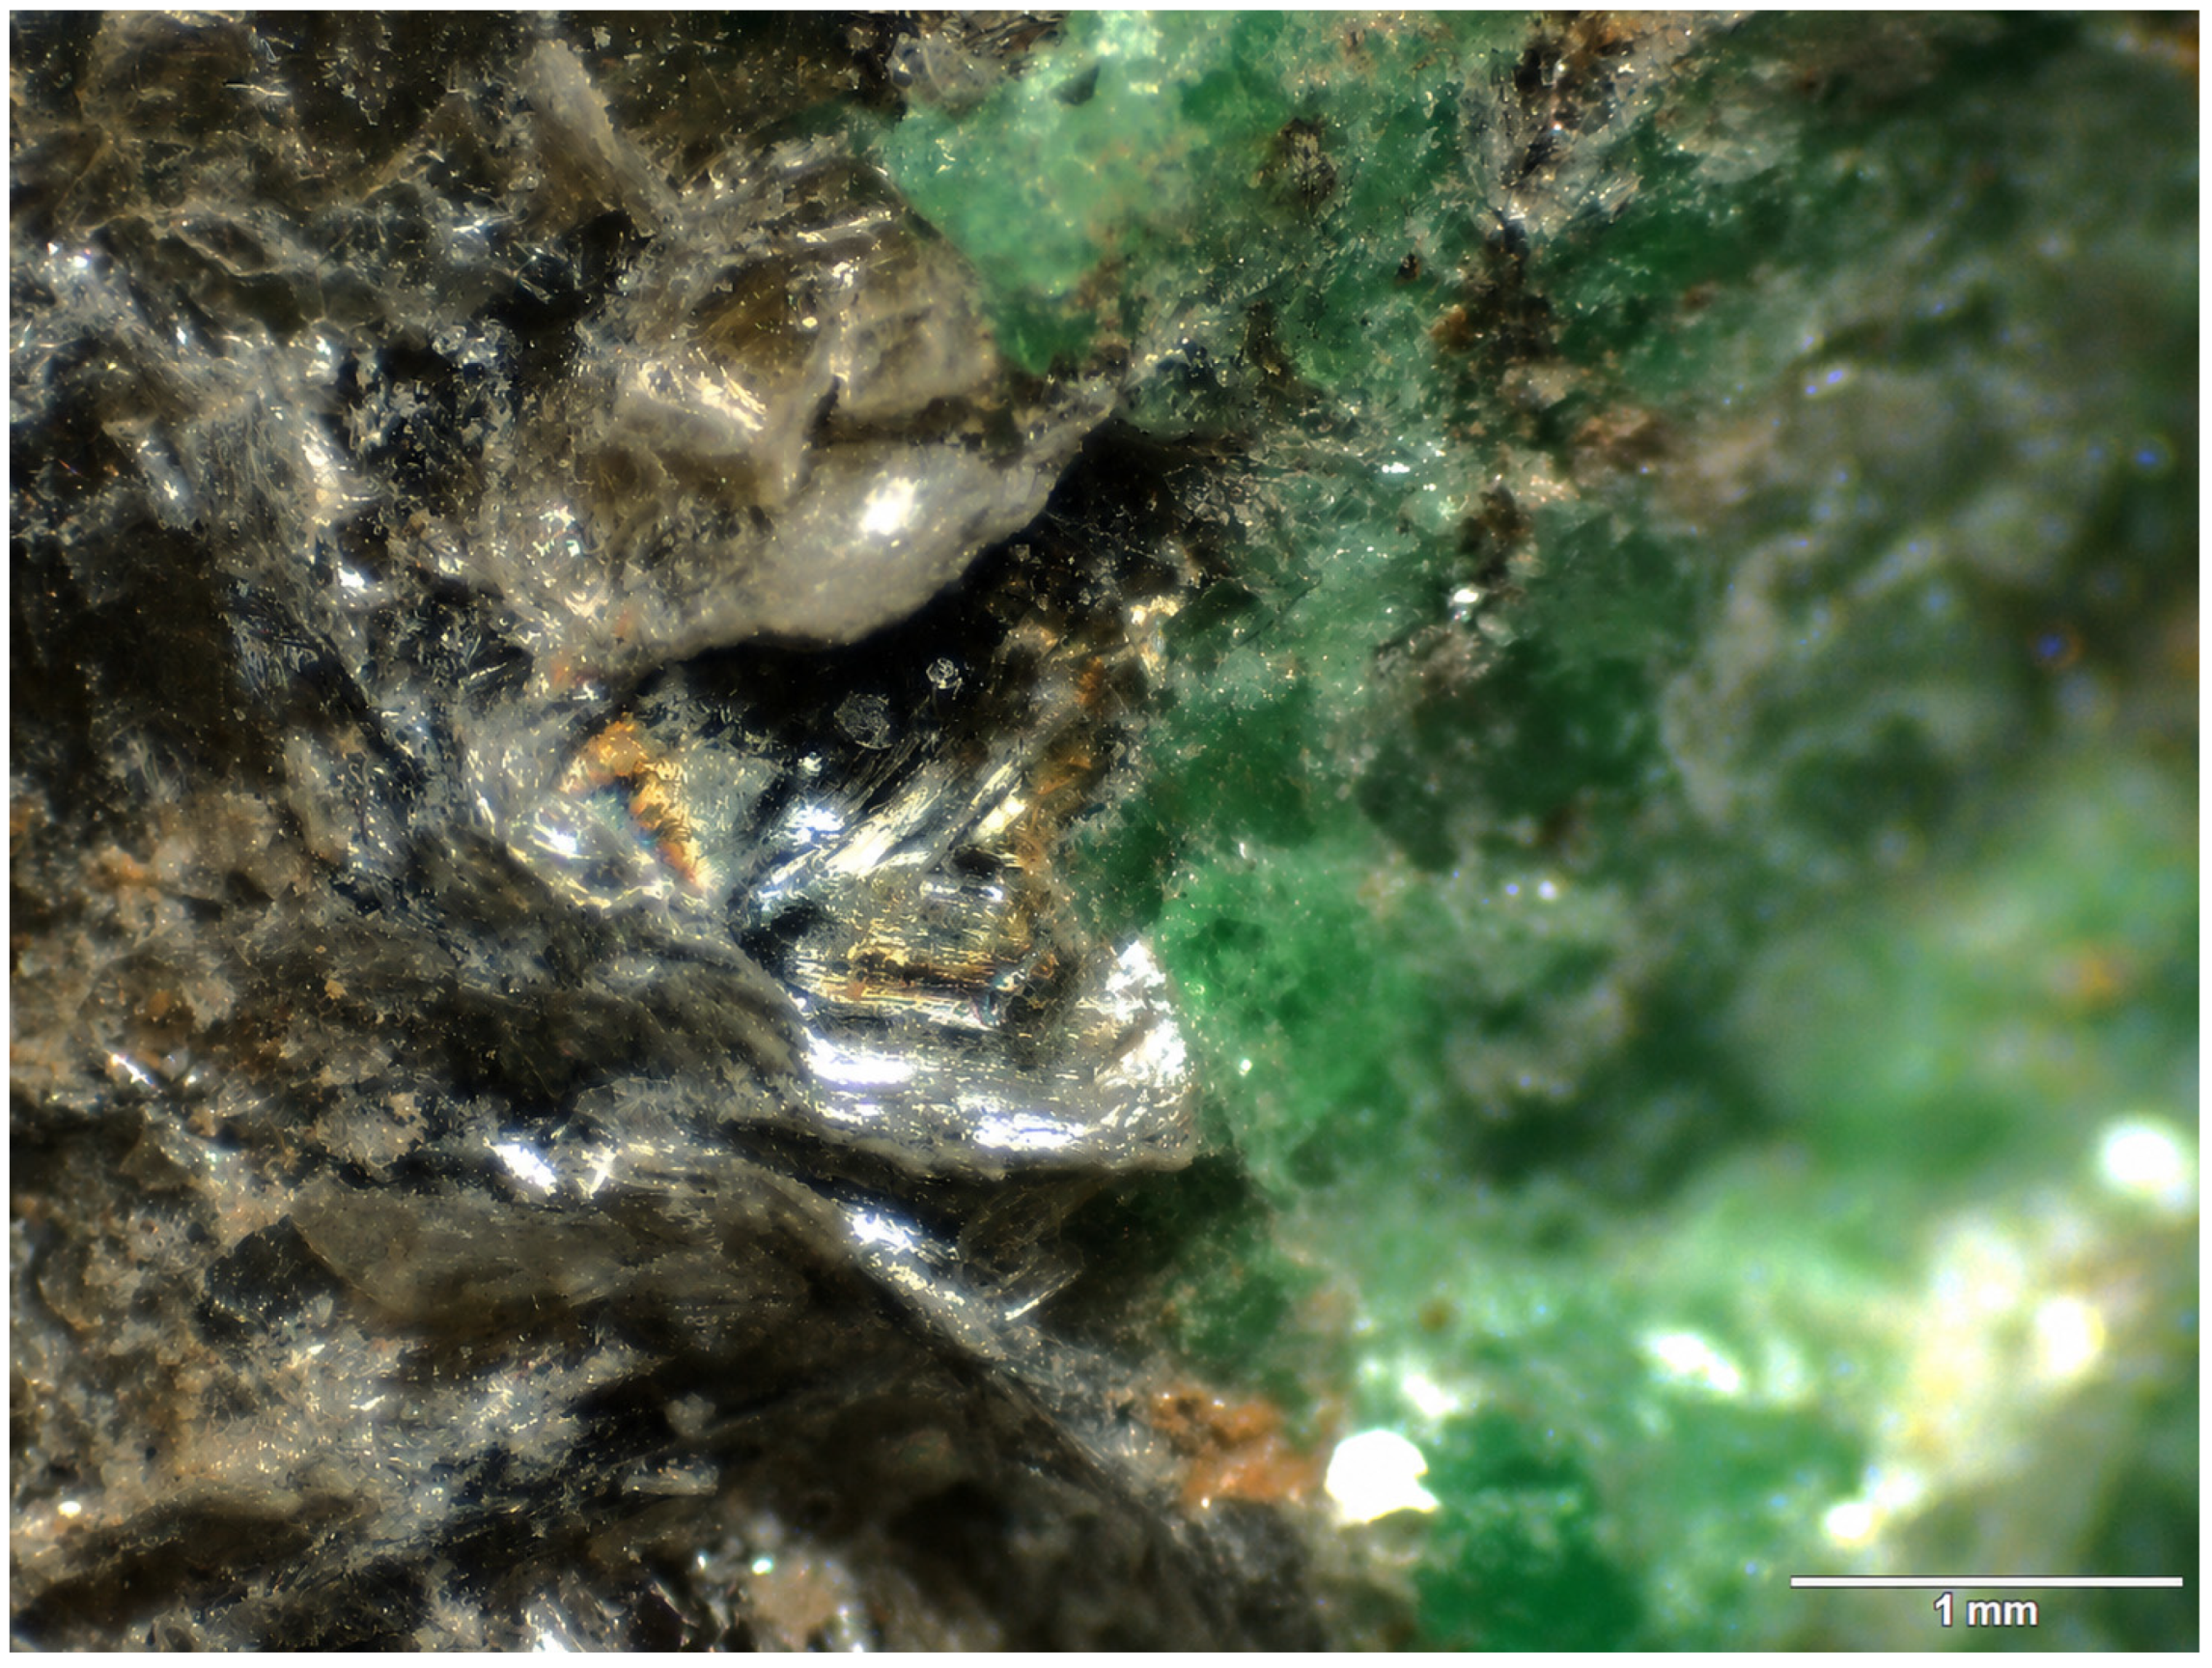
Figure 3 and
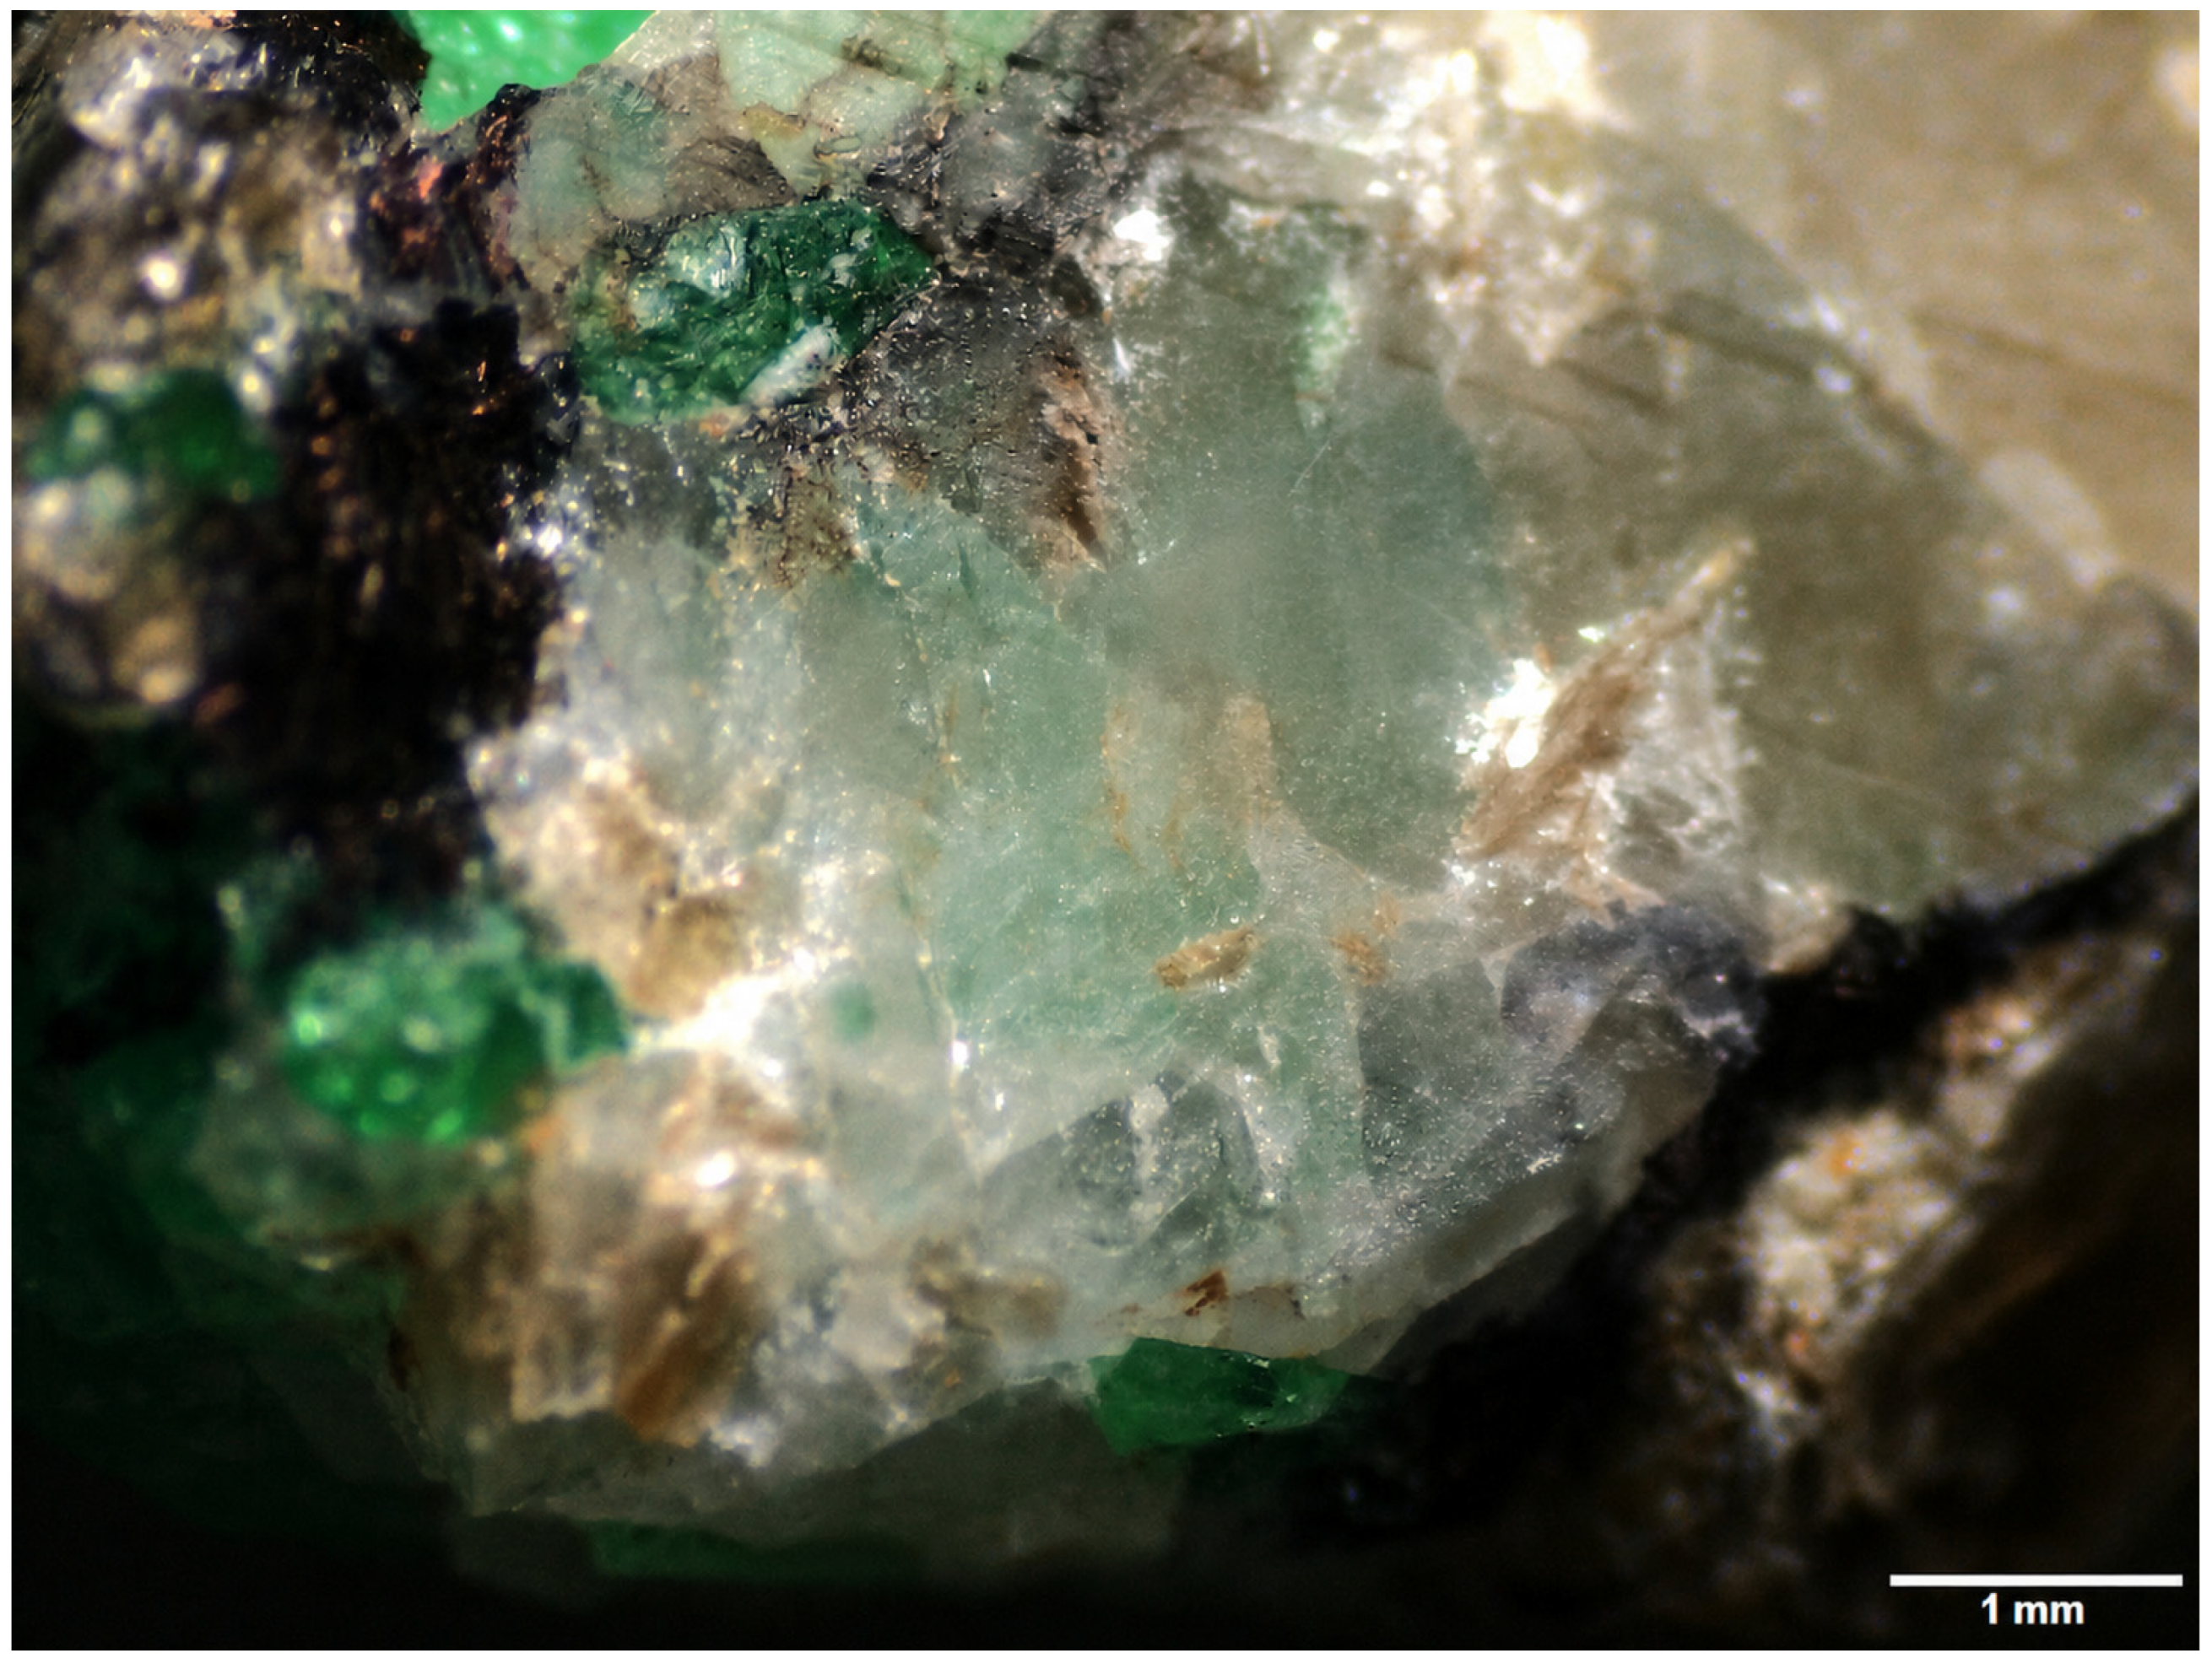
Figure 4 show representative contact boundaries and local microscopic features of the host-rock-bearing samples. For consistency with the analytical scope of this study, the investigated specimens are designated as green beryl—specifically, natural V-rich green beryl rather than emerald; the term ‘emerald’ is retained only in general or literature-based discussion.
EDXRF analyses were performed at the Gemological Experimental Teaching Center, School of Gemology, China University of Geosciences (Beijing, China), using a Shimadzu EDX-7000 energy-dispersive X-ray fluorescence spectrometer (Shimadzu, Kyoto, Japan) for nondestructive semiquantitative analysis. Each sample was placed in a sample cup covered with Mylar film and analyzed under vacuum with a measurement diameter of 1 mm. Thirteen point analyses were obtained from the seven detached crystals, with one to three positions measured on each crystal depending on its size, surface flatness, and accessible analytical area. Element contents were calculated by the fundamental-parameter method and reported as semiquantitative oxide-equivalent contents. Because Be cannot be measured reliably by this method, the data were not used to reconstruct the complete stoichiometry of beryl but to compare the detectable compositional characteristics of V, Fe, and Cr. A matrix-specific quantitative detection limit for Cr2O3 was not established for the semiquantitative fundamental-parameter EDXRF analysis used in this study. Accordingly, ‘not detected’ is used qualitatively and should not be interpreted as indicating zero Cr concentration.
UV–Vis–NIR spectra were collected at the same center using a Shimadzu UV-3600 UV–Vis–NIR spectrophotometer (Shimadzu, Kyoto, Japan) in reflectance geometry over 200–900 nm with a data interval of 1 nm. The instrument software reported the spectra directly in absorbance units; these data are therefore treated here as apparent absorbance. The c-axis was identified from the natural crystal morphology, and spectra were collected from crystal surfaces approximately parallel or perpendicular to the c-axis. No polarizing accessory was used; these measurements therefore represent approximate orientation comparisons rather than polarized spectra.
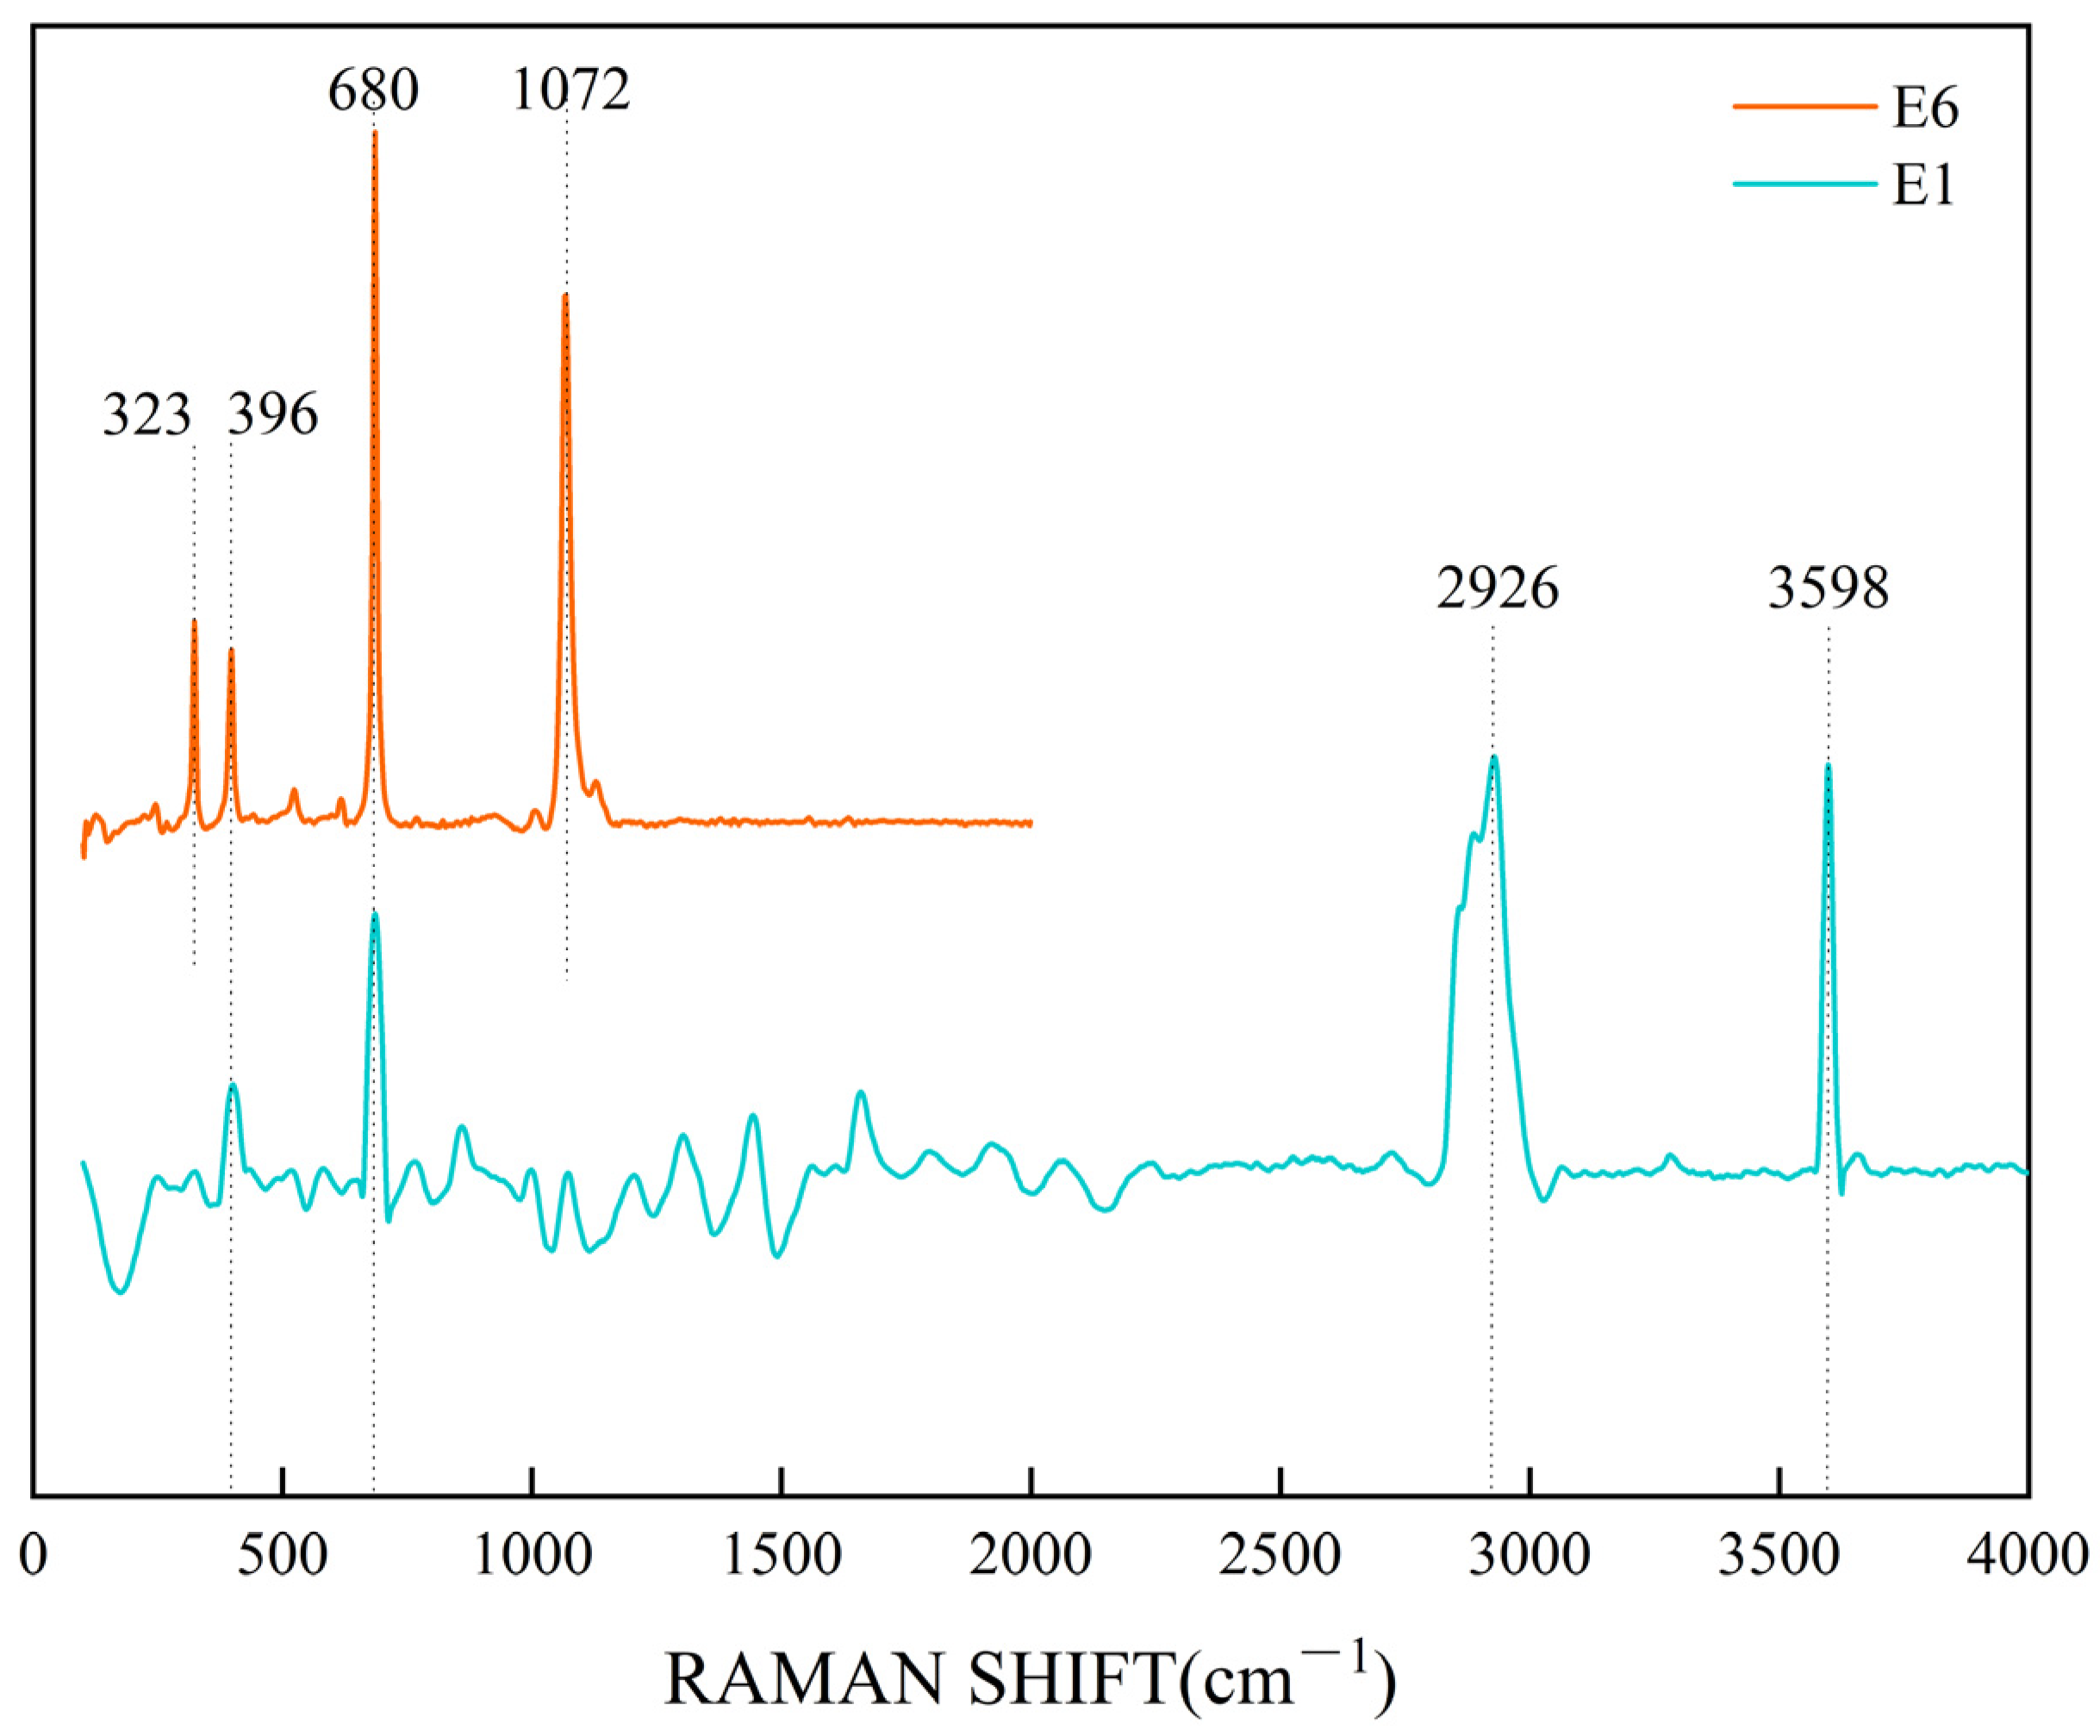
Raman spectra were acquired at the same center using a HORIBA LabRAM HR Evolution confocal micro-Raman spectrometer (HORIBA Scientific, Palaiseau, France) with 532 nm excitation, a 50× long-working-distance objective, and a 600 grooves/mm grating. Spectra were collected over 100–4000 cm−1 with an integration time of 5 s and two accumulations at each analytical point. Data were recorded and processed using LabSpec 6 software. For the beryl-host characterization presented in this manuscript, two Raman spots were evaluated: one on E1 and one on E6. Both spots were selected from visually homogeneous green regions and deliberately positioned away from visible inclusions, fractures, and host-rock contacts to minimize interference from secondary phases.
FTIR spectra were collected from four selected detached crystals (E1, E3, E4, and E7) at the same center using a Bruker TENSOR 27 Fourier-transform infrared spectrometer (Bruker, Ettlingen, Germany) in transmission and reflectance modes. The spectral range was 8000–400 cm−1, the resolution was 4 cm−1, and each spectrum was accumulated over 32 scans using a 6 mm aperture.
3. Results
3.1. EDXRF Analysis
Thirteen EDXRF point analyses were obtained from the seven detached crystals (E1–E7) (
Table 1). The V
2O
5-equivalent contents range from 0.562 to 4.616 wt.%, and the Fe
2O
3-equivalent contents range from 0.172 to 0.494 wt.%. Cr
2O
3 was not detected at any analytical point under the present EDXRF conditions. Variations in V
2O
5-equivalent content among crystals and between positions on the same crystal indicate a degree of compositional heterogeneity.
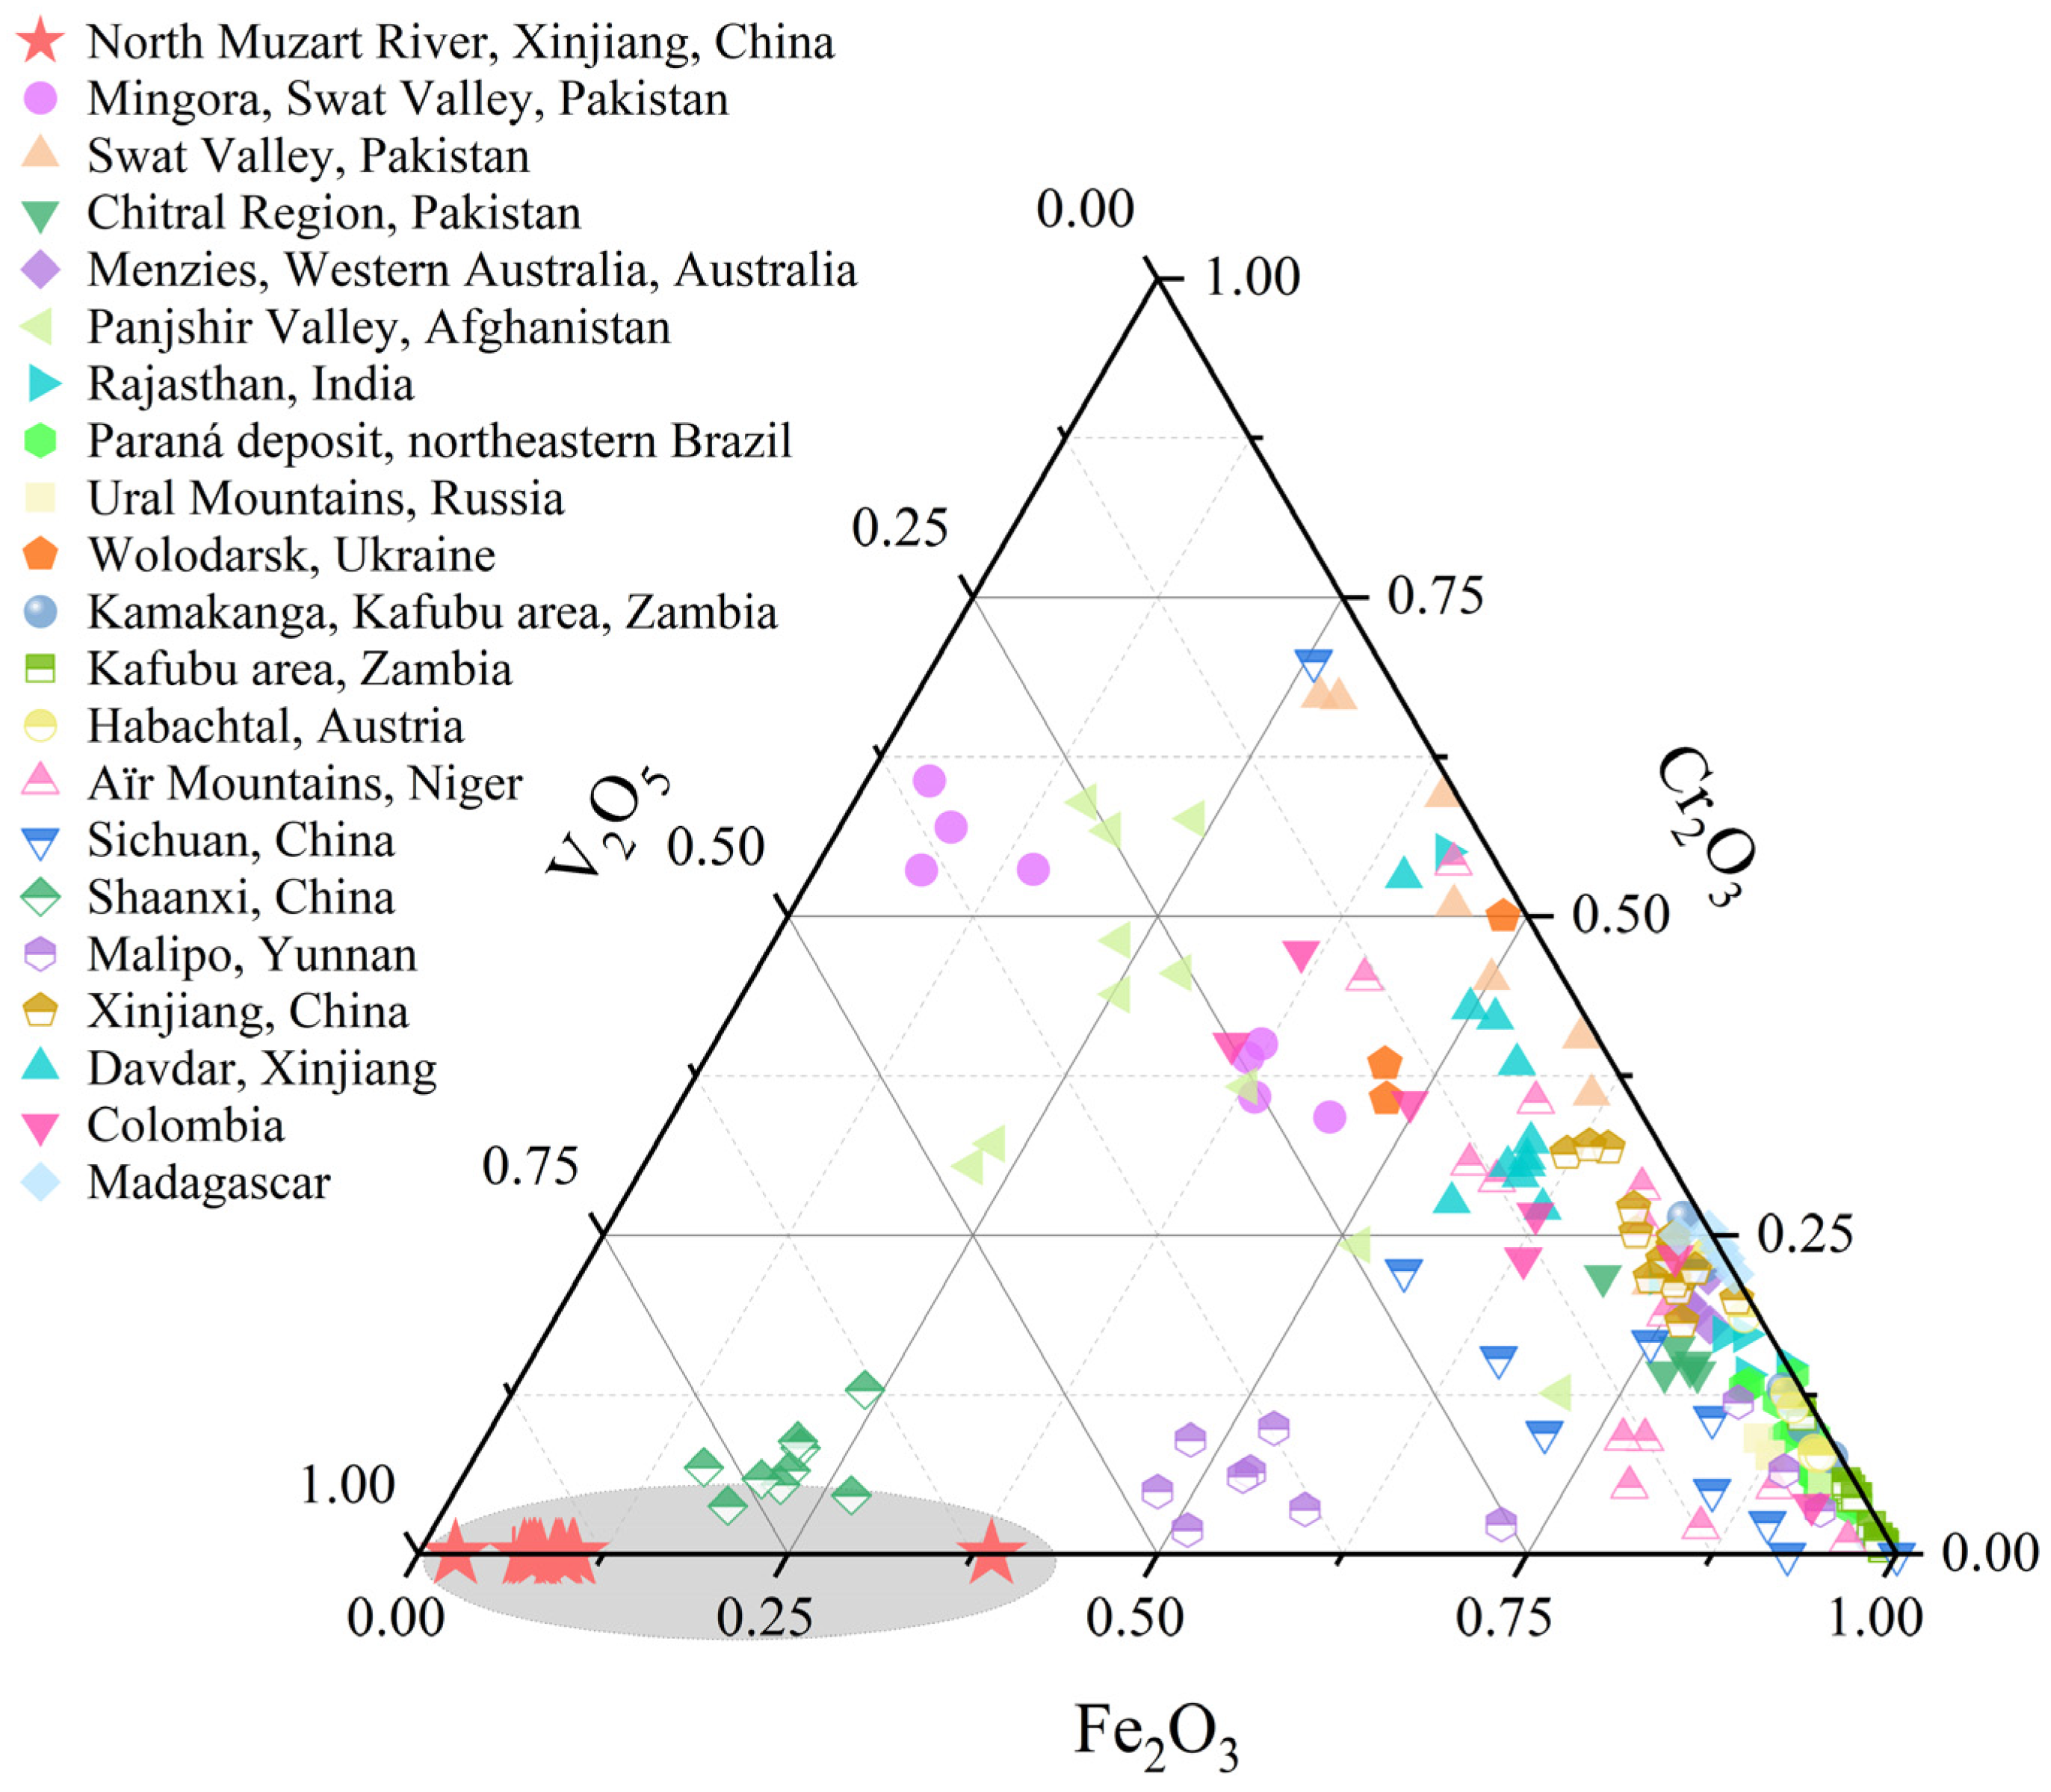
To visualize the relative proportions of the three transition-metal components, the Fe
2O
3-, V
2O
5-, and Cr
2O
3-equivalent contents from the 13 EDXRF analyses were normalized and plotted together with literature data for green beryl from other localities in an Fe
2O
3–V
2O
5–Cr
2O
3 ternary diagram (
Figure 5).
The North Muzart River data cluster near the V2O5 endmember, with a comparatively small Fe2O3 proportion. Because Cr2O3 was not detected under the present EDXRF conditions, the points are plotted on the Cr2O3 = 0 boundary as a visualization convention; this position does not imply that the actual Cr concentration is zero. Relative to the comparison dataset, the samples occupy a V-dominant field and are clearly separated from many Cr-dominant or Fe–Cr-rich samples.
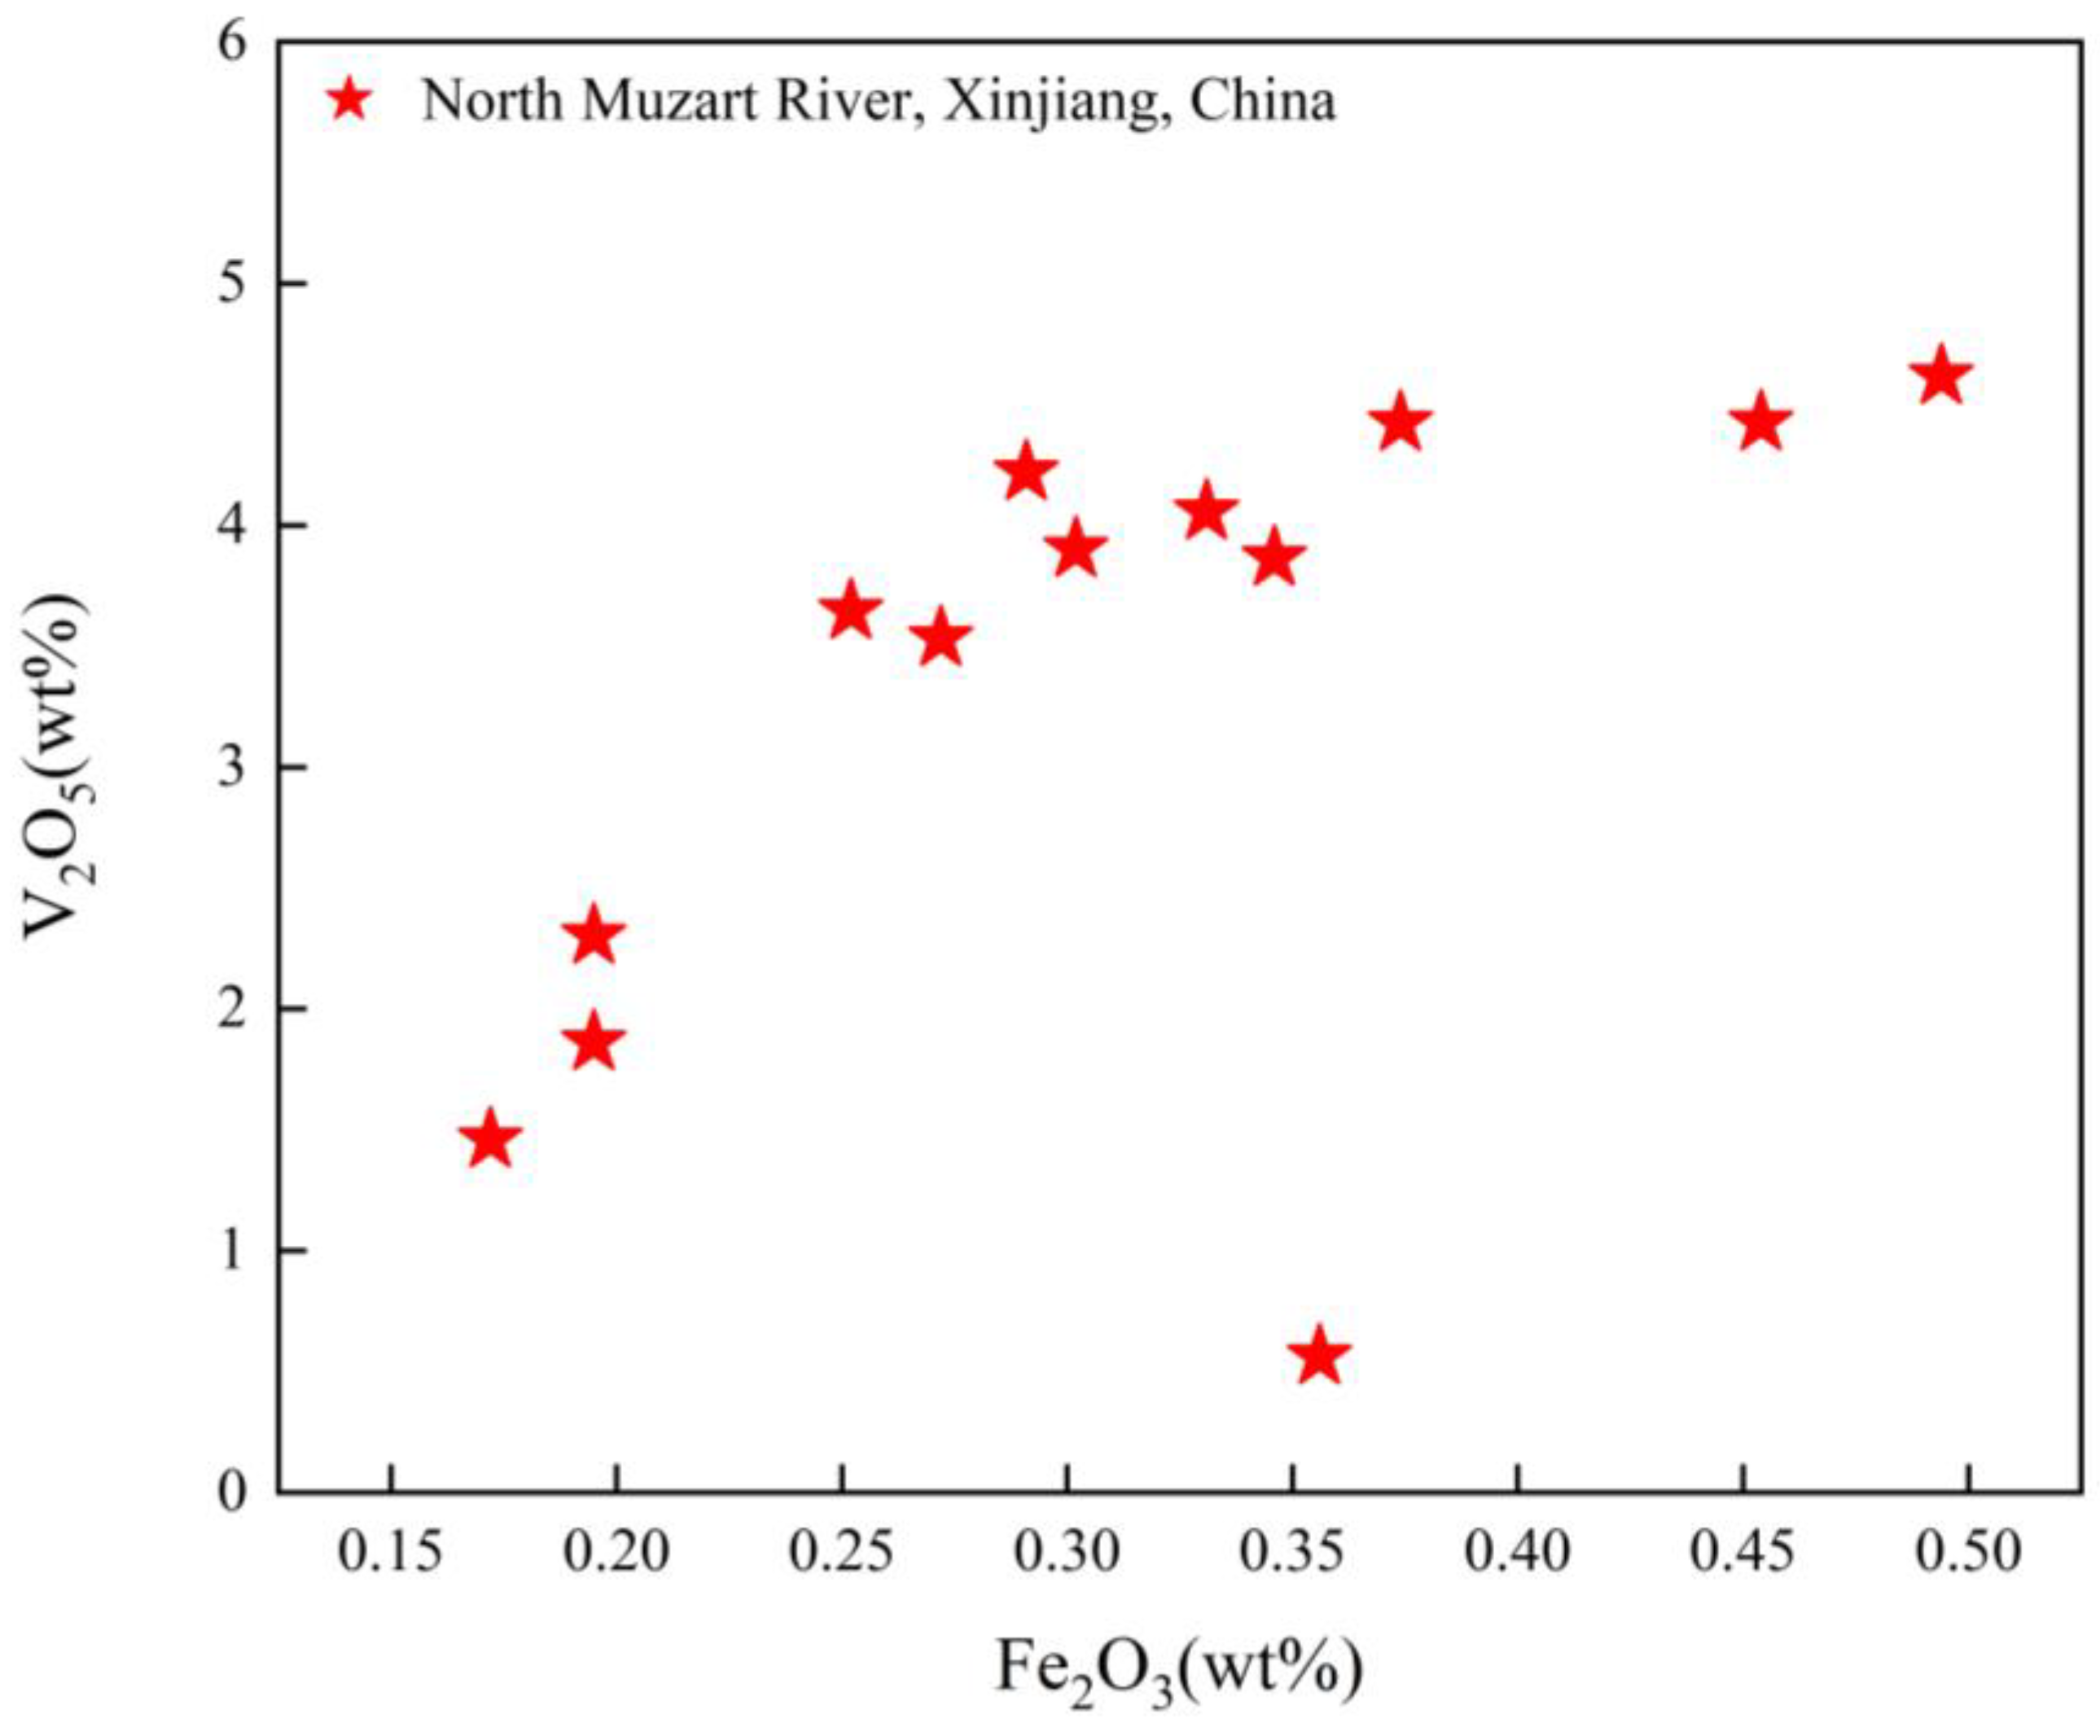
The Fe
2O
3–V
2O
5 binary plot displays a broadly positive distribution, although E7-1 is a clear outlier and the remaining points retain appreciable scatter (
Figure 6). Given the semiquantitative oxide-equivalent data and limited sample size, the plot is used only to show the compositional distribution and not to infer lattice-scale coupling between V and Fe.
3.2. UV–Vis–NIR Spectroscopy
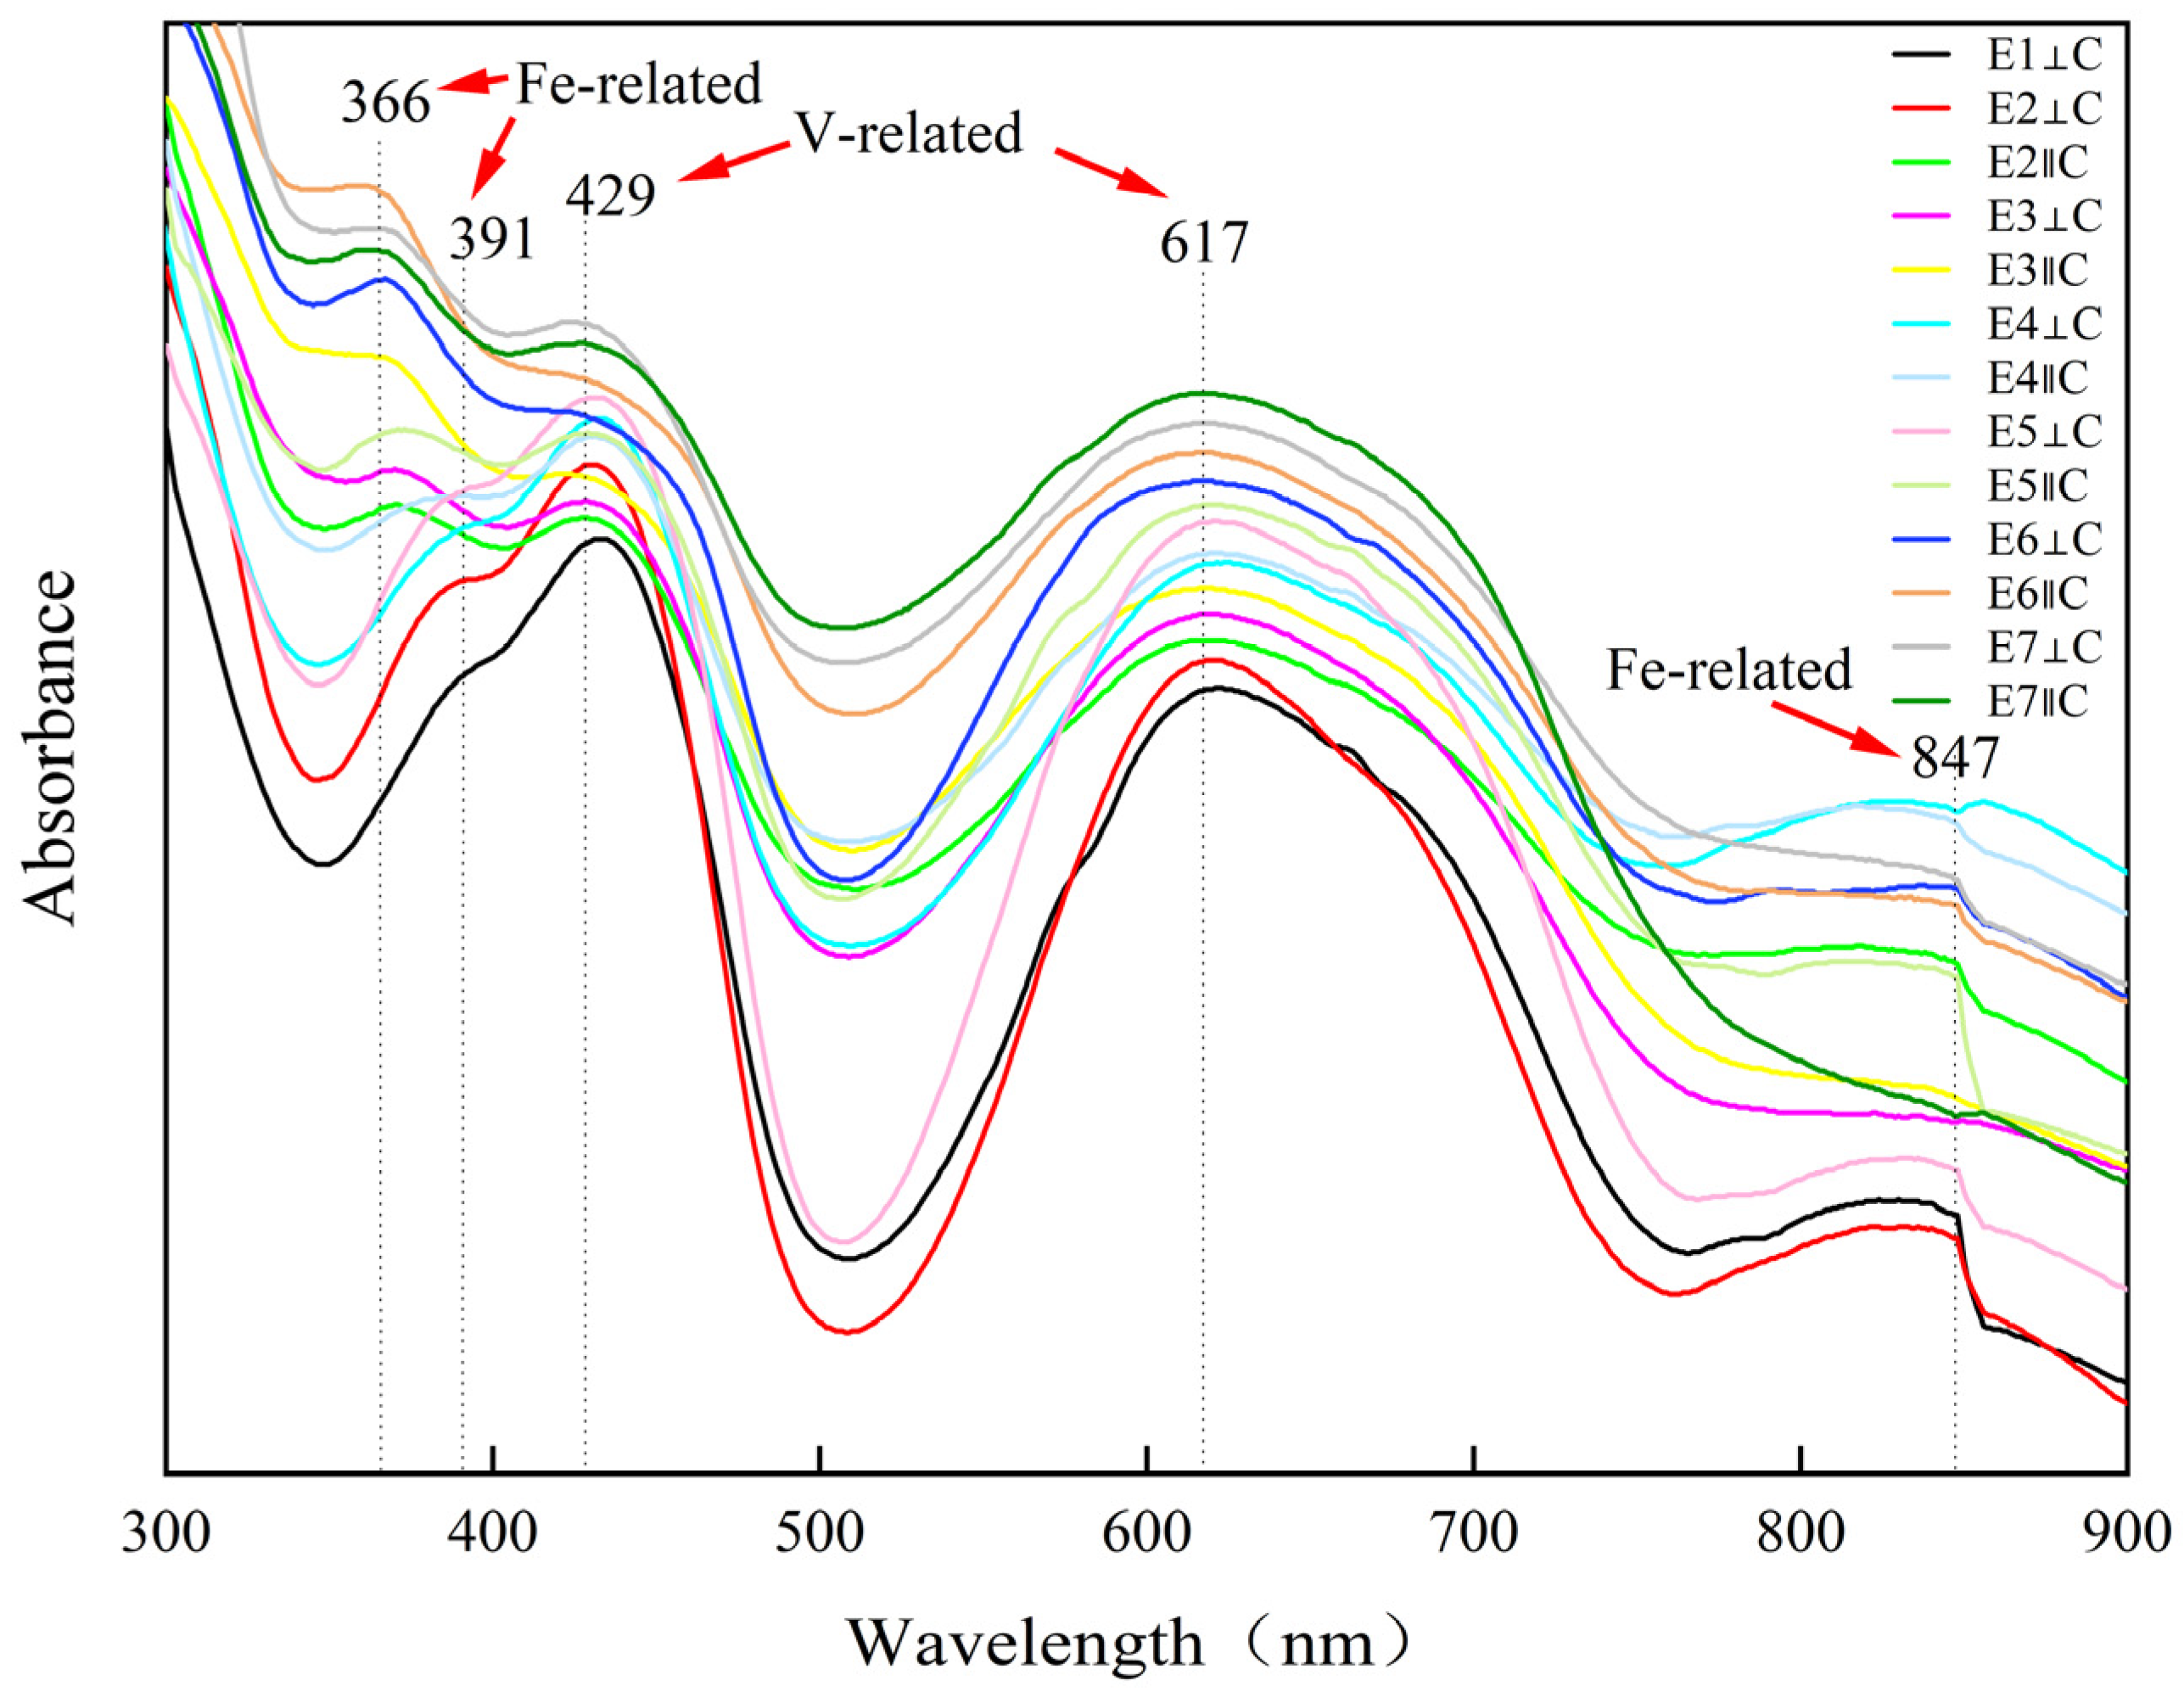
Thirteen UV–Vis–NIR spectra were obtained from the seven detached crystals. The E1 spectrum was collected from a surface approximately perpendicular to the c-axis, whereas paired spectra for E2–E7 were collected from surfaces approximately parallel and perpendicular to the c-axis. All spectra have similar broad-band profiles, with two principal bands recurring near 429 and 617 nm. Weaker responses occur near 366 and 391 nm, together with a weak, broad near-infrared response near 847 nm (
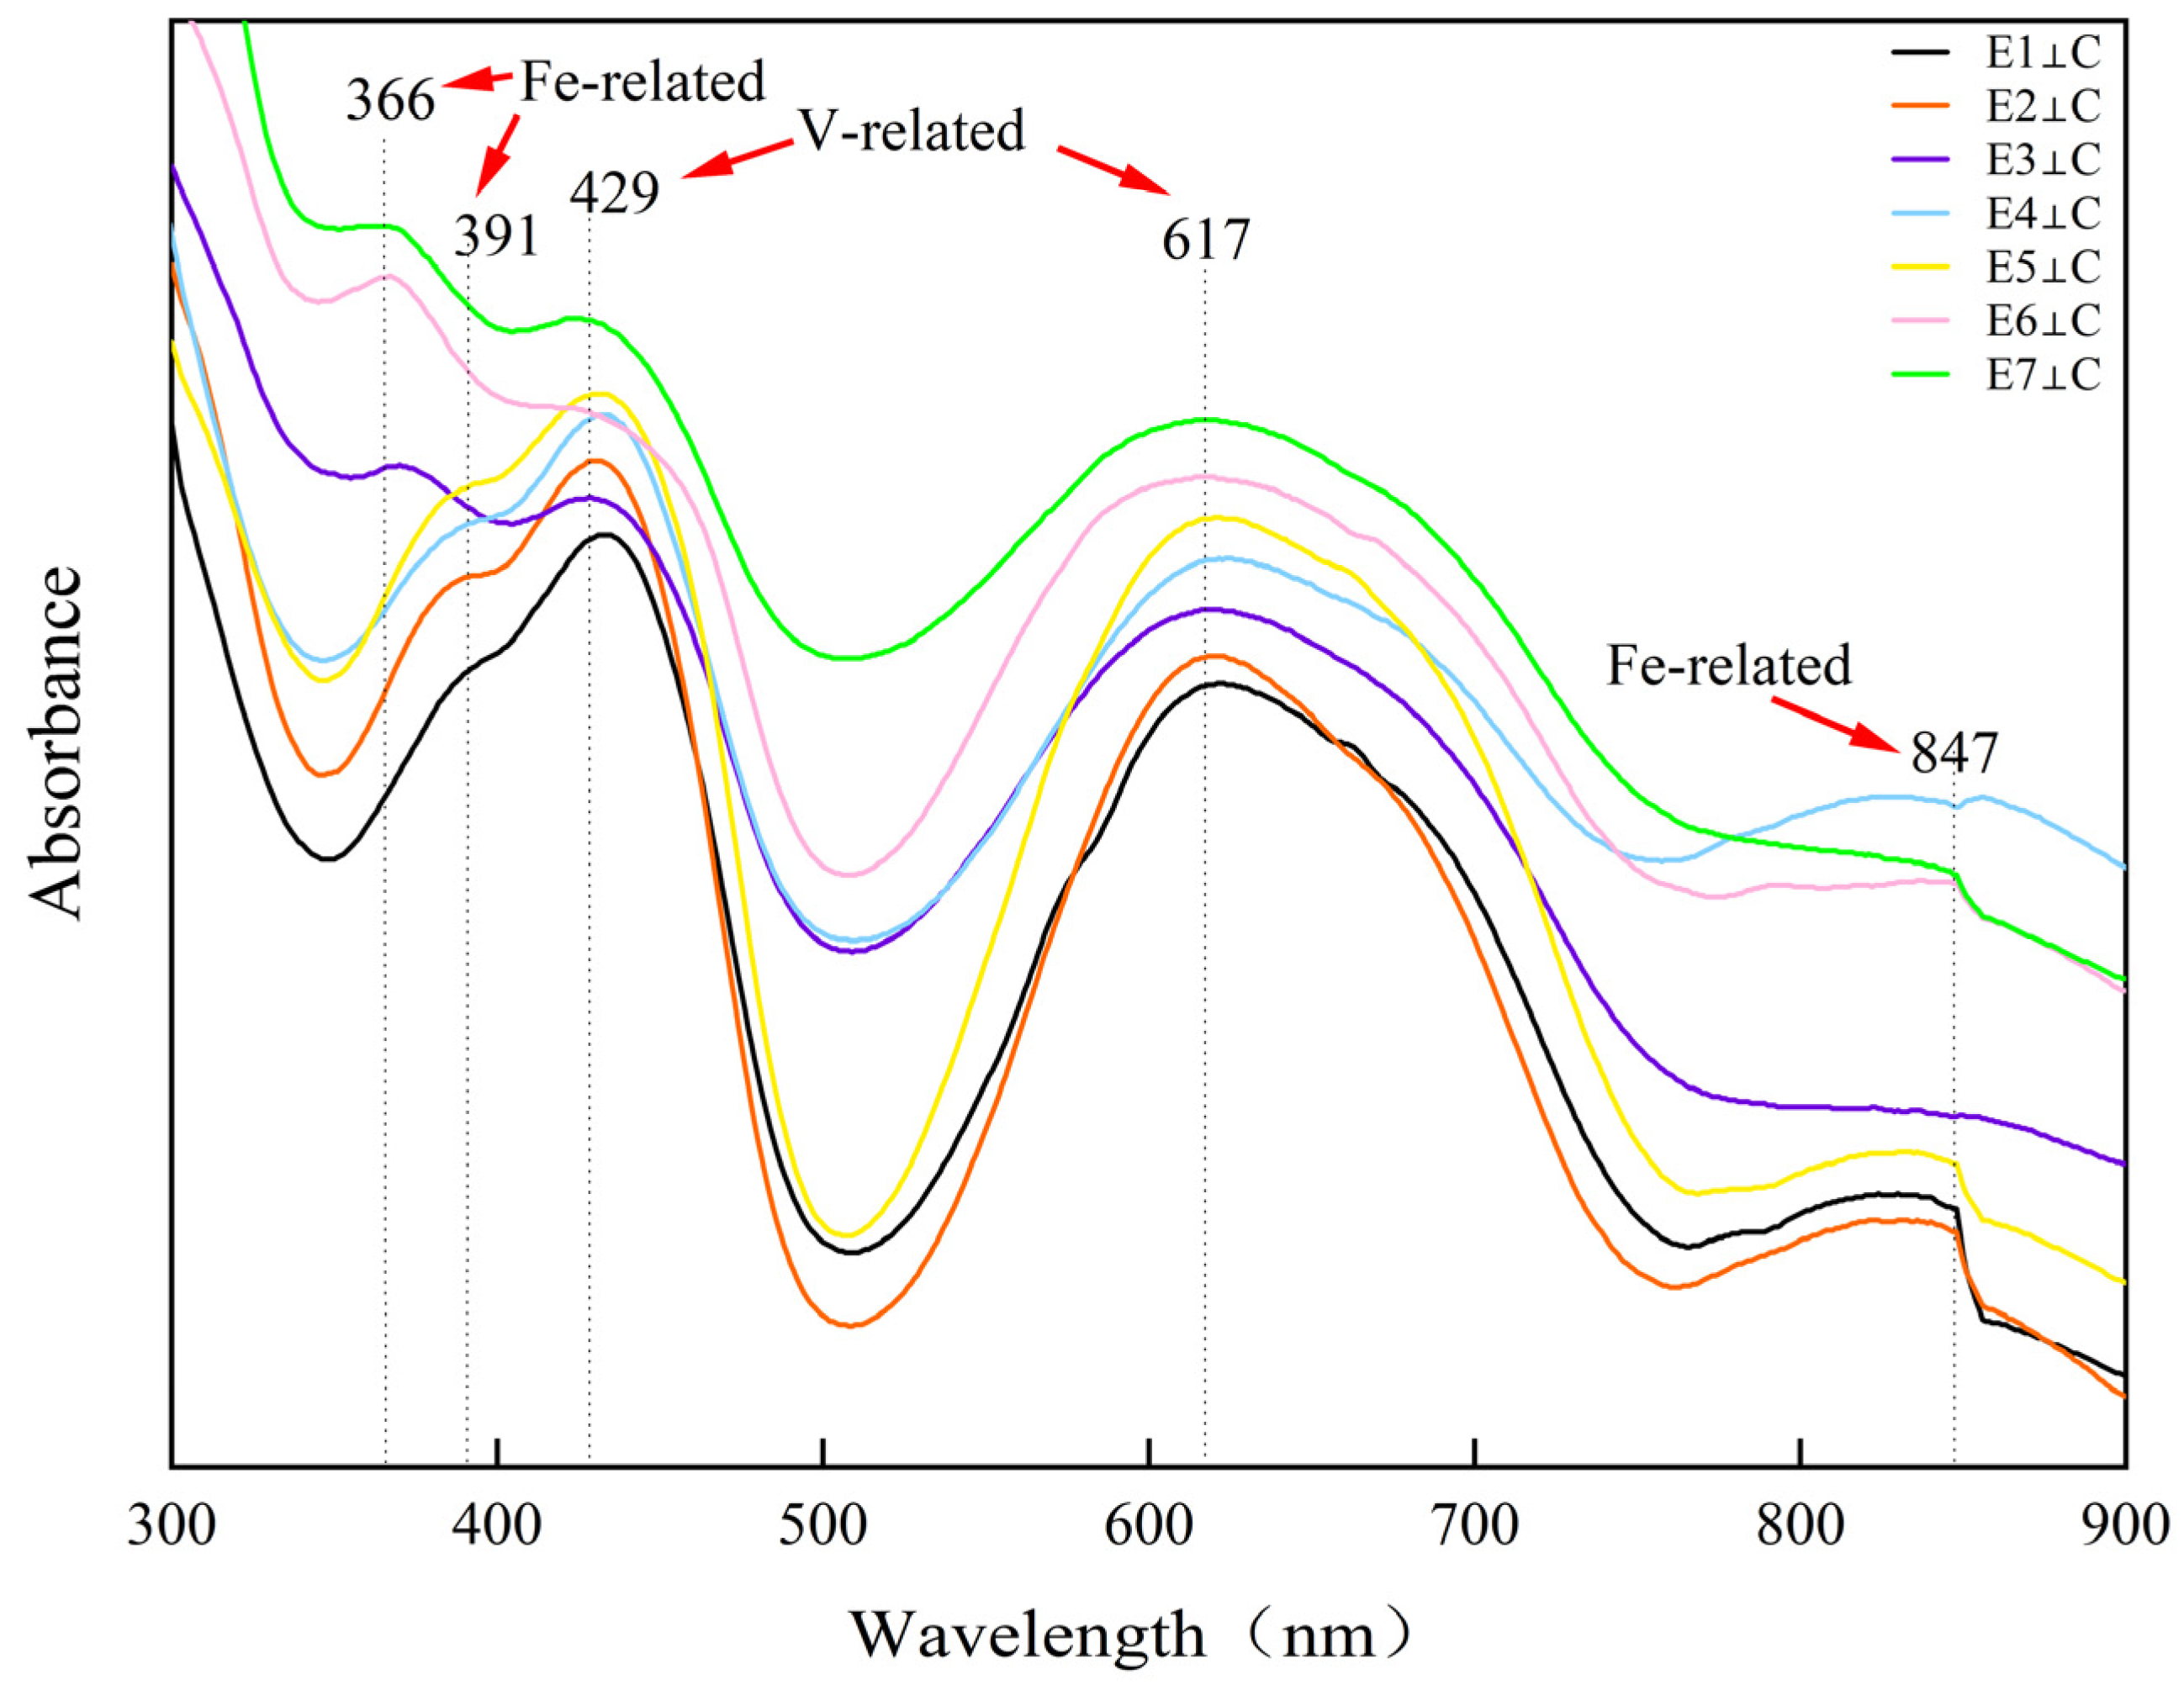
Figure 7). The paired spectra have broadly similar principal band positions but differ in relative intensity, band shape, and baseline. These orientation designations are approximate and should not be interpreted as polarized measurements or as quantitative characterization of dichroism. To compare band positions under the same approximate orientation, the seven spectra collected from surfaces approximately perpendicular to the c-axis were plotted separately (
Figure 8). The principal bands near 429 and 617 nm and the weaker responses near 366, 391, and 847 nm remain identifiable, demonstrating that the main band positions are reproducible under the same nominal orientation. Differences in relative intensity and baseline among the spectra may reflect variations in crystal thickness; surface flatness; transparency; fracture density; and, where present, minor surface residues. Accordingly, baseline differences are not interpreted quantitatively.
3.3. Raman Spectroscopy
The Raman spectrum of E6 contains characteristic bands near 323, 396, 680, and 1072 cm
−1 (
Figure 9). The bands near 323 and 396 cm
−1 are associated with low-frequency lattice vibrations involving Al–O motion. The intense bands near 680 and 1072 cm
−1 are characteristic of beryl and involve Be–O/silicate-ring-related vibrations and Si–O stretching, respectively [
13,
14]. This band set is consistent with the beryl framework at the analyzed E6 location. The high-wavenumber Raman spectrum of E1 contains a water-related band near 3598 cm
−1, consistent with the type-II channel-water response observed by FTIR [
13,
15,
16,
28,
50]. The E1 spectrum also contains a C–H stretching signal near 2926 cm
−1, probably derived from surface organic residue or local contamination; it is not treated as an intrinsic structural feature of beryl. At the two selected analytical locations, the Raman spectra are consistent with the beryl framework, with no strong bands attributable to a secondary phase. This observation is restricted to the analyzed regions and does not imply phase purity of the entire specimens.
3.4. FTIR Spectroscopy
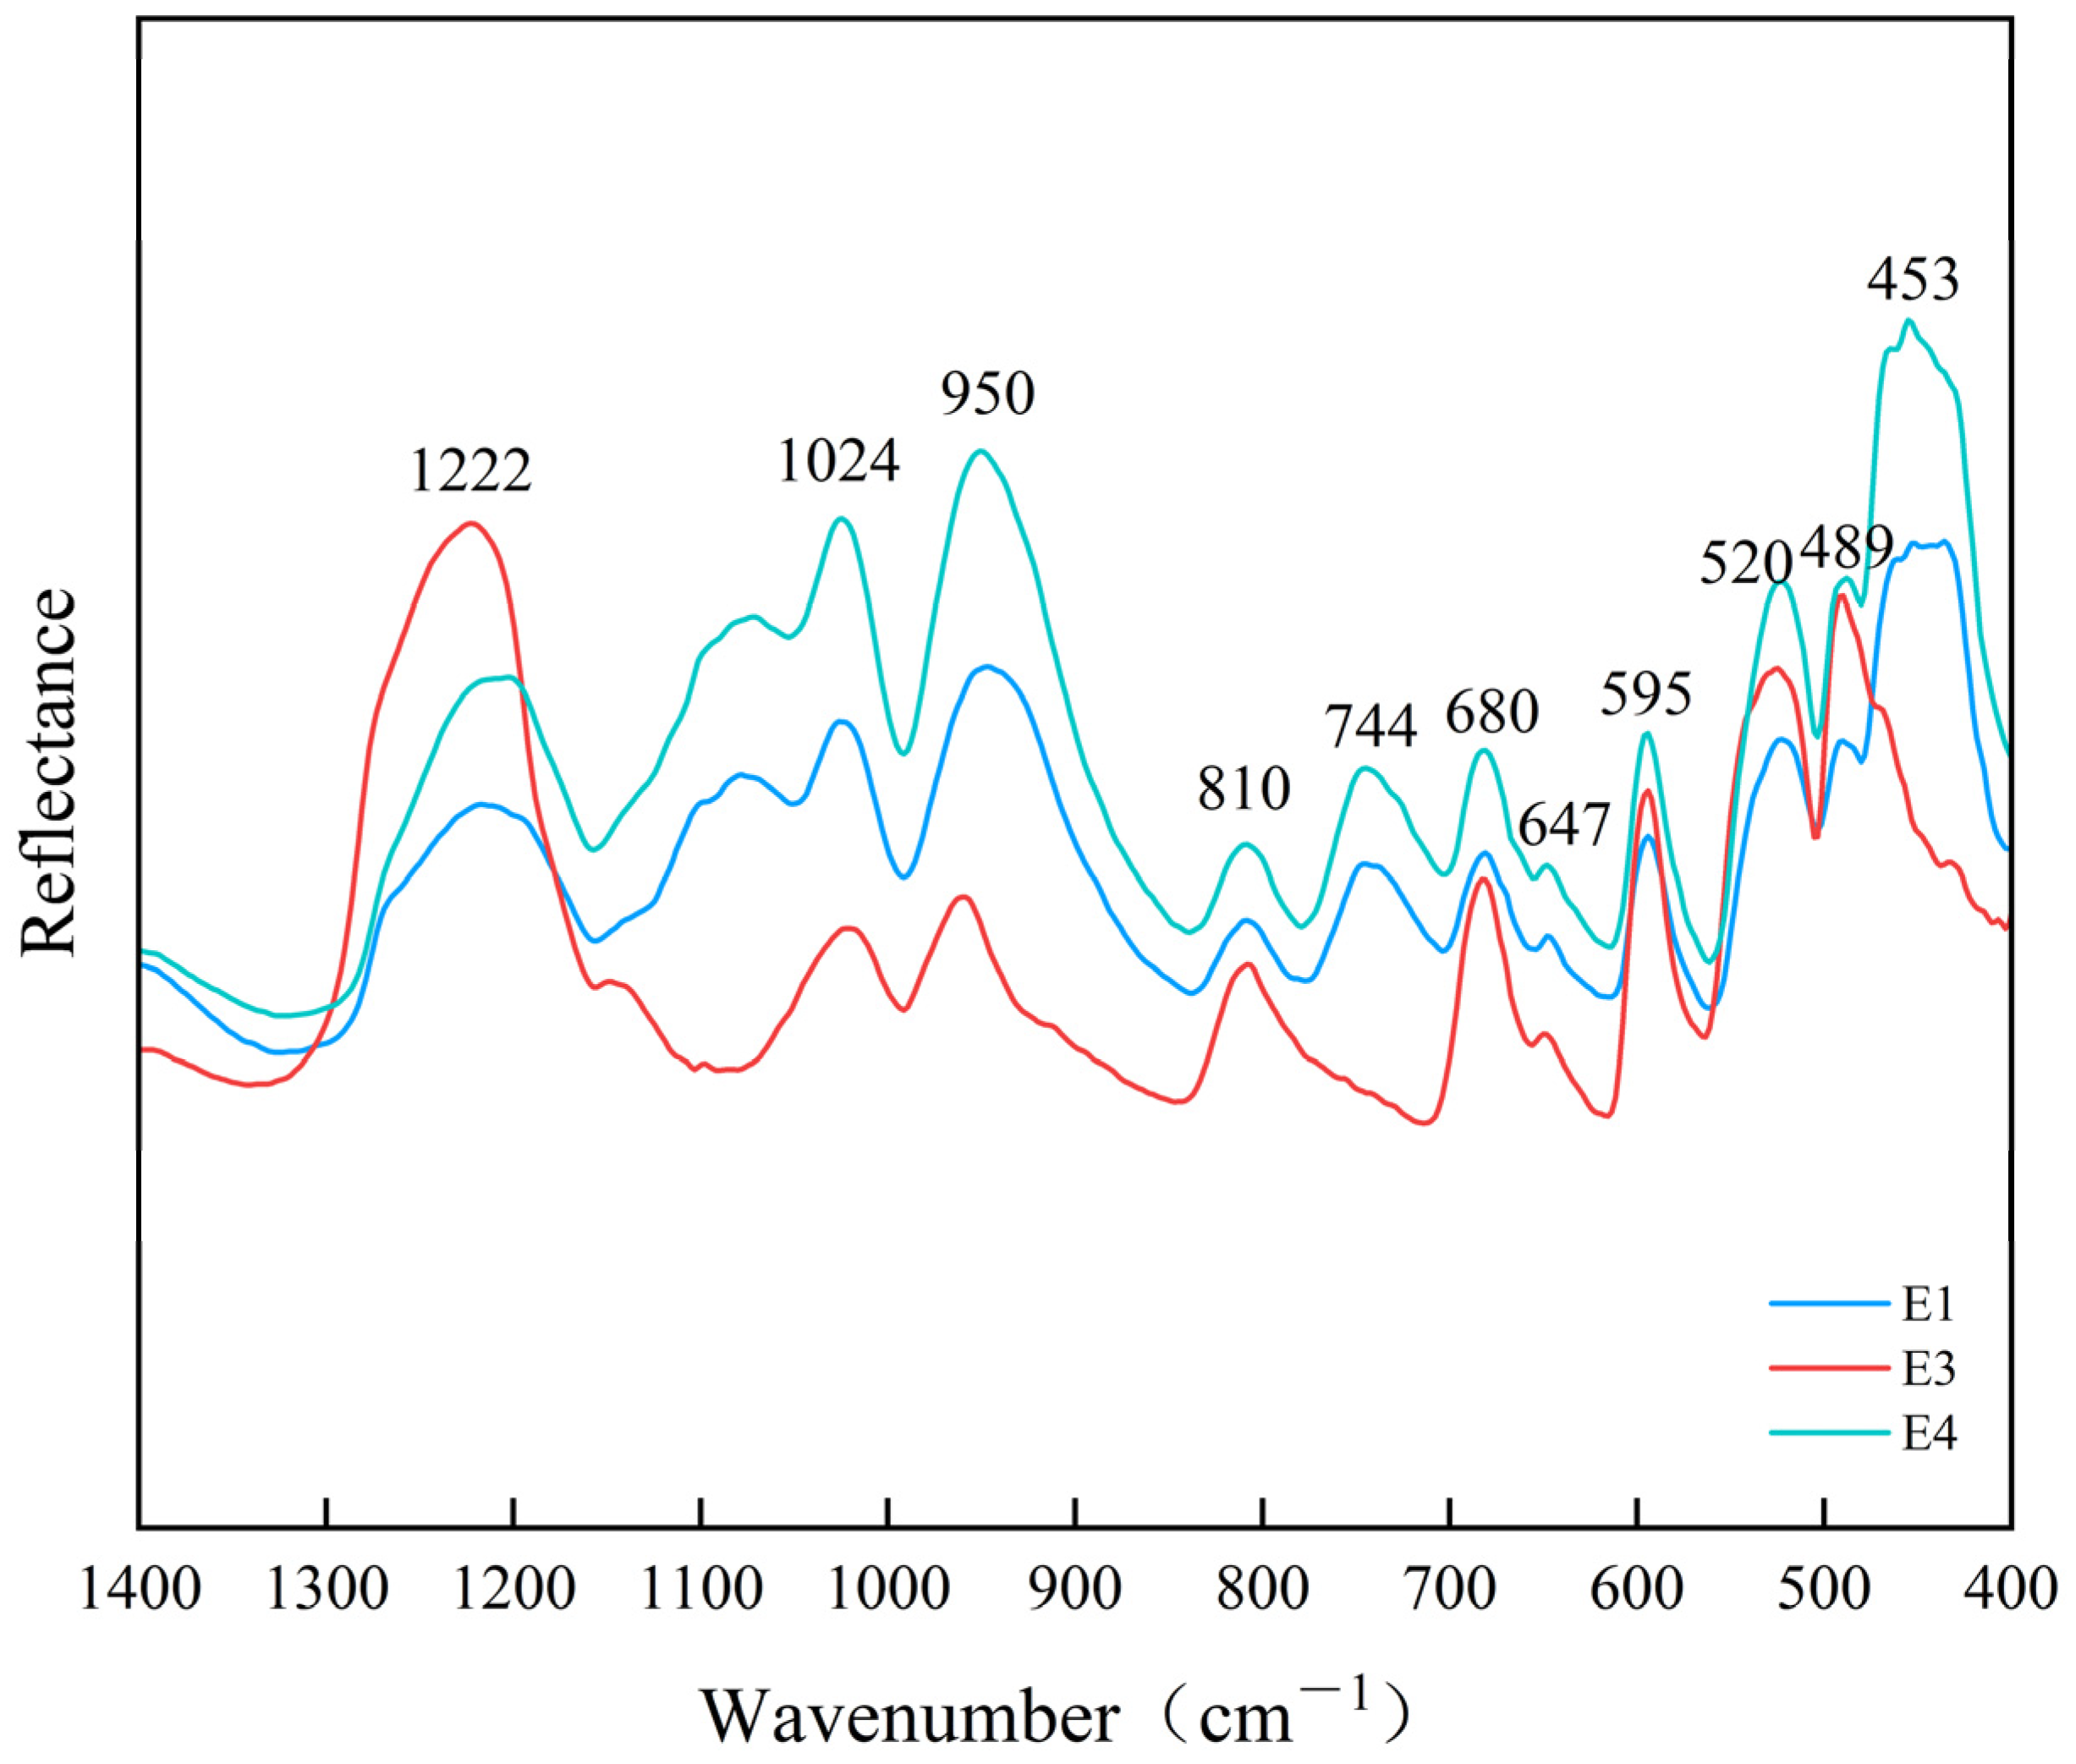
The FTIR spectra of E1, E3, and E4 display similar sets of beryl framework bands between 453 and 1222 cm
−1, including vibrations related to Si–O, Si–O–Si, O–Si–O, and Be–O units, indicating that the samples retain the characteristic beryl framework (
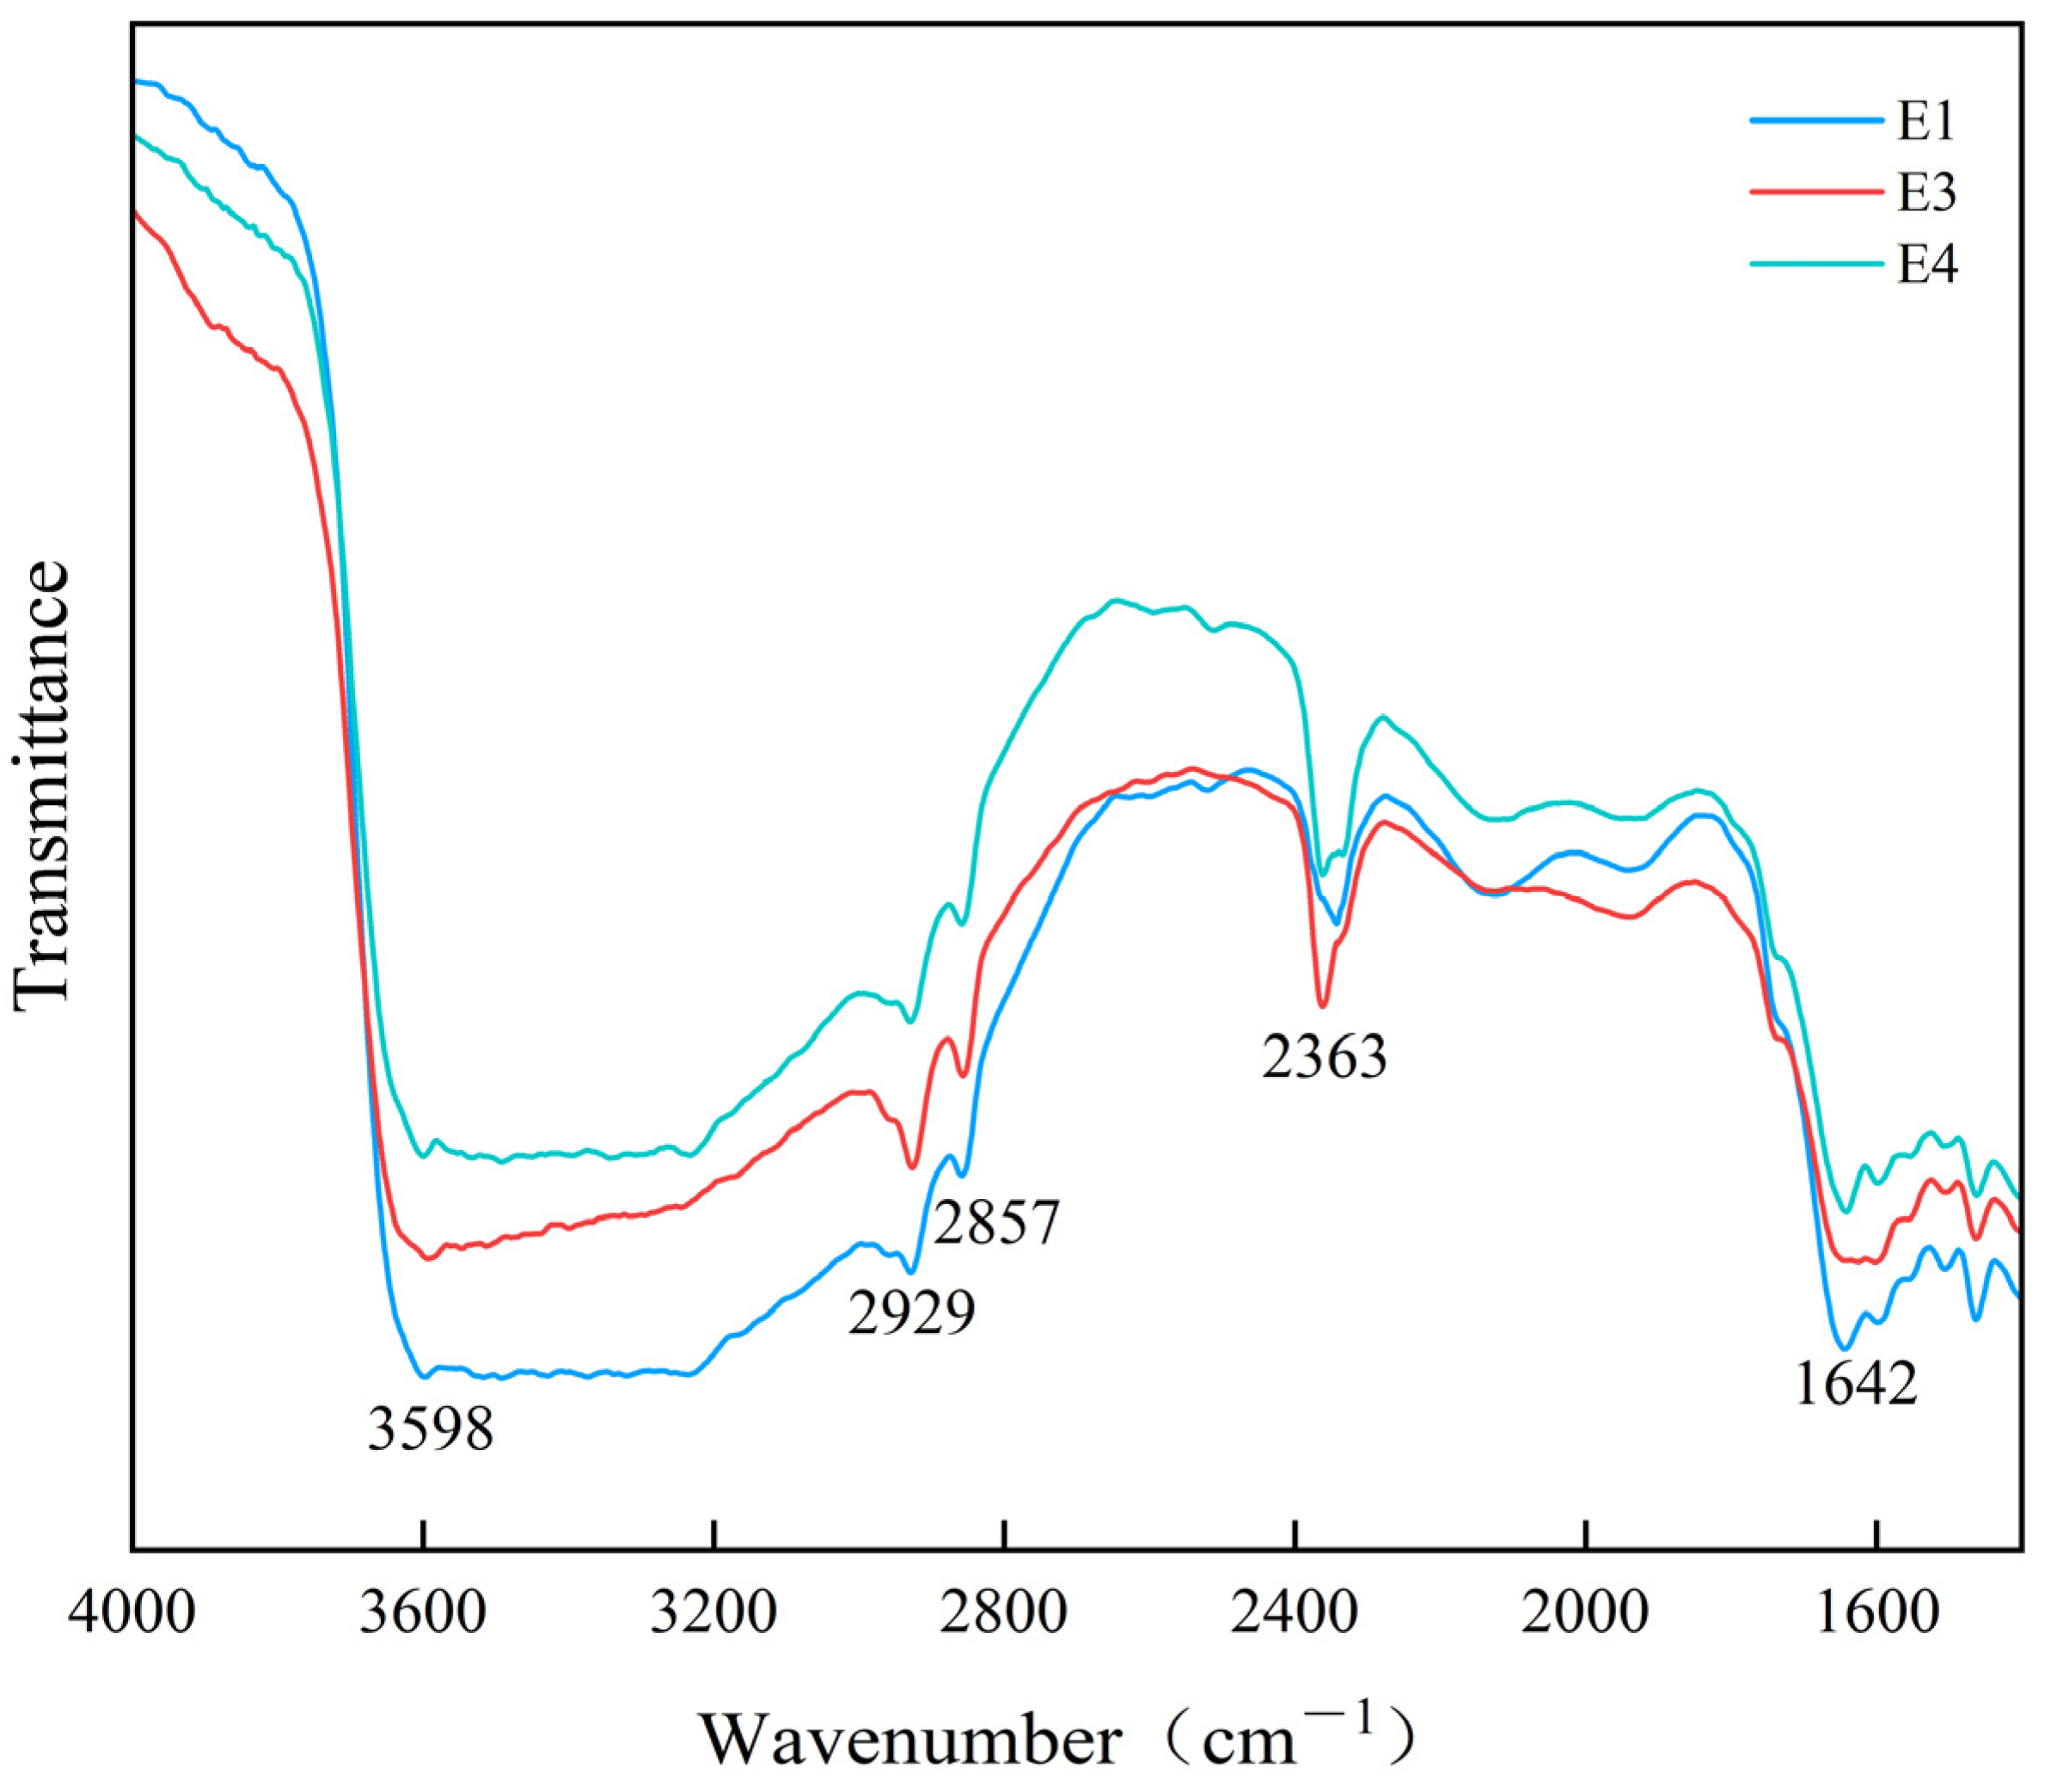
Figure 10). Water-related bands occur near 1642 and 3598 cm
−1 (
Figure 11). Features near 2857 and 2929 cm
−1 may reflect C–H stretching or surface organic residues. The weak response near 2363 cm
−1 is likely associated with environmental CO
2 or CO
2 in the optical path and is therefore not assigned to a structural component.
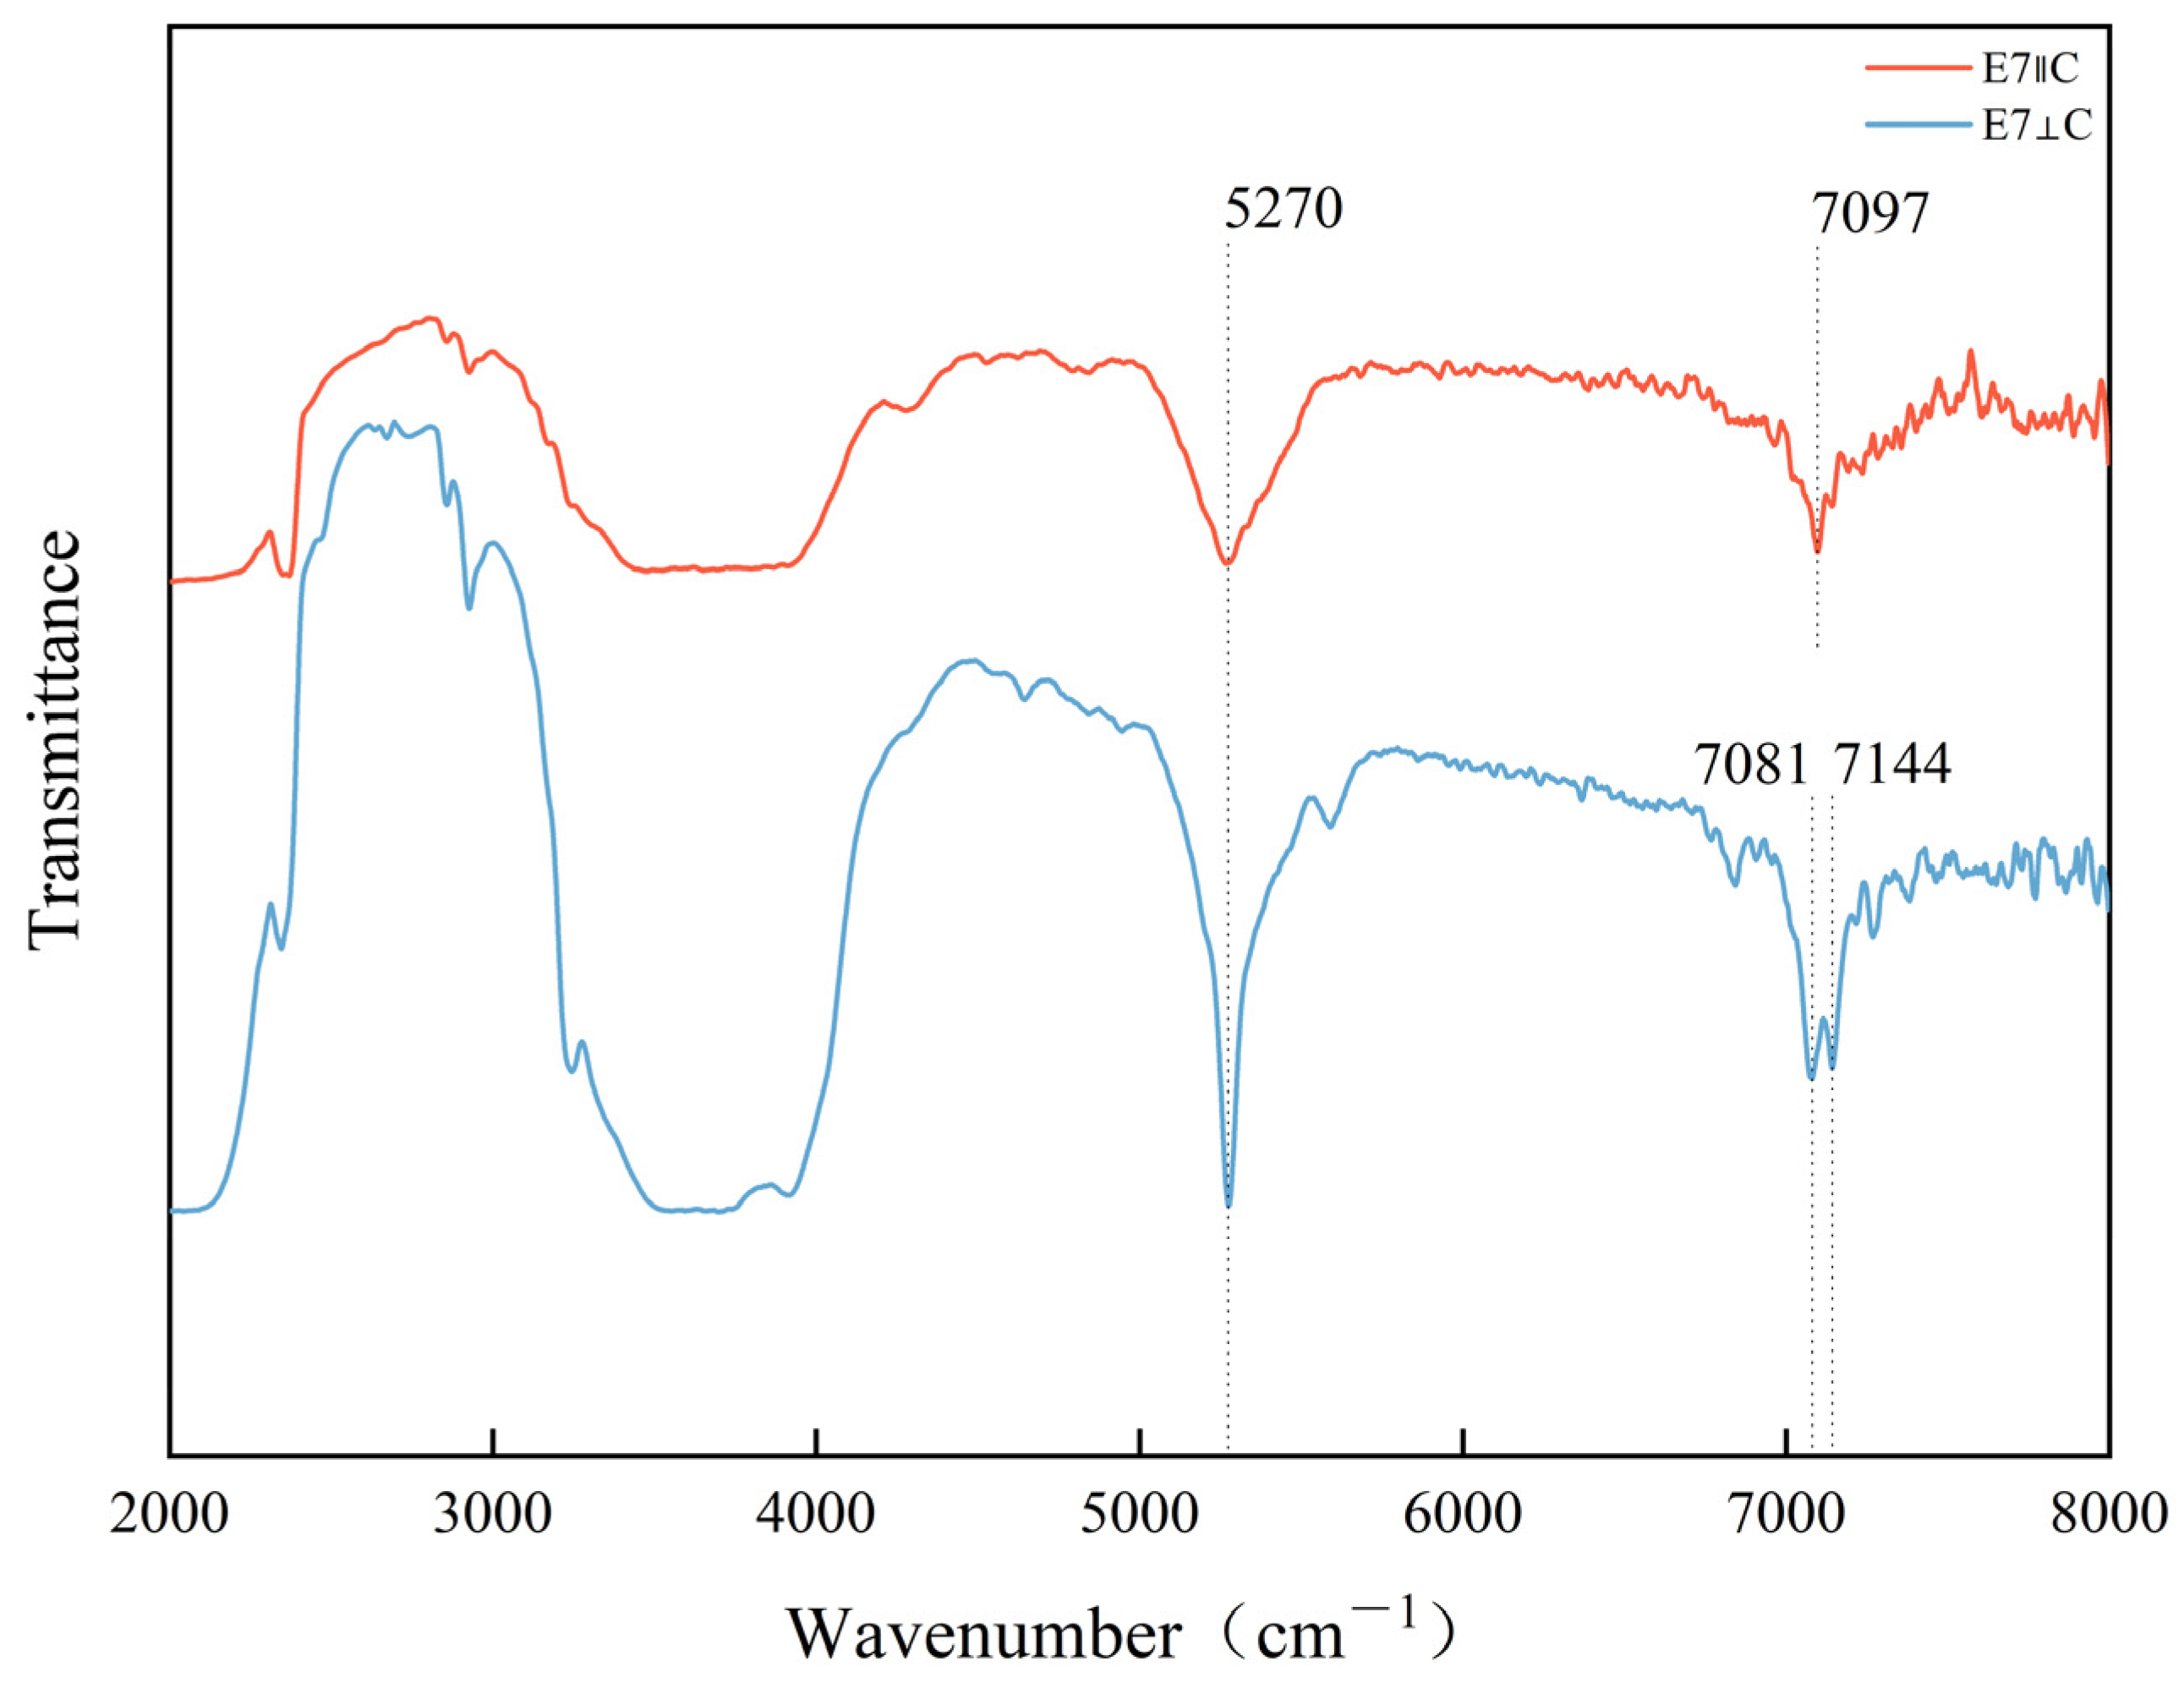
Sample E7 contains water-related combination or overtone absorptions near 5270, 7081–7097, and 7144 cm
−1 (
Figure 12). Based on previous studies of water in beryl channels, the bands near 1642, 3598, and 7081–7097 cm
−1 are mainly consistent with type-II water, whereas the band near 5270 cm
−1 may contain contributions from both type-I and type-II water; the weaker feature near 7144 cm
−1 is associated with type-I water. Taken together, the channel-water features observed in the four FTIR-analyzed crystals are predominantly consistent with type-II water, with a weaker type-I contribution [
5,
15,
16,
17,
28,
50,
51,
52]. The principal bands and their preliminary assignments are summarized in
Table 2.
4. Discussion
4.1. V-Dominant Composition and Undetected Cr: Constraints on V-Related Electronic Absorption
The principal visible absorption ranges of V
3+ and Cr
3+ overlap strongly in natural emerald, making their relative contributions difficult to determine from band positions alone [
8,
18,
19,
20,
21]. EDXRF analysis of the North Muzart River samples indicates a distinctly V-dominant composition, with Cr not detected under the present analytical conditions; the Fe
2O
3–V
2O
5–Cr
2O
3 ternary plot likewise places the data close to the V
2O
5 endmember. The Fe
2O
3–V
2O
5 distribution is appreciably scattered and does not support a lattice-coupling relationship between the two components. Within this compositional context, the recurring broad bands near 429 and 617 nm are consistent with the characteristic visible absorptions commonly attributed to V
3+ in beryl and are interpreted here as predominantly V-related [
8,
18,
19,
20,
21]. This interpretation remains indirect and does not exclude a minor contribution from Cr below the EDXRF detection capability.
The weaker responses near 366, 391, and 847 nm may involve Fe-related centers and appear as additional absorption in the near-ultraviolet to short-wavelength visible region and in the near-infrared region [
9,
10,
11,
12,
22,
23]. When only the seven spectra collected from surfaces approximately perpendicular to the c-axis are compared, the principal bands remain near 429 and 617 nm, indicating that their positions do not arise from combining spectra obtained in different orientations.
EDXRF provides semiquantitative compositional information and does not directly determine the valence state, lattice site, or local coordination of V; the oxidation-state assignment is therefore indirect. In a qualitative crystal-field framework, if V occurs as V
3+ (3d
2) at the approximately octahedral Al site of beryl, broad visible d–d absorptions are expected. The present bands at ~617 and ~429 nm correspond to ~16,200 and ~23,300 cm
−1, respectively. V-rich Malipo emeralds show comparable maxima at 432/611 nm (o-ray) and 425/644 nm (e-ray) [
18], while V-bearing Nigerian beryl shows broad bands near 427 and 610 nm [
20]. These comparisons support a predominantly V-related interpretation without independently establishing the V valence state. Representative absorption features of V-bearing natural and synthetic beryl are compared in
Table 3.
4.2. Vibrational-Spectroscopic Features of the Beryl Framework and Channel Water
Raman spectra from the two selected green regions provide local phase confirmation of the beryl host and therefore support the spectroscopic interpretation, although they do not establish phase purity beyond the analyzed locations. The principal absorption bands near 429 and 617 nm are therefore more likely to originate from transition-metal-related centers within the analyzed beryl host than from a secondary phase [
13,
14].
The Raman spectrum of E1 contains a water-related response near 3598 cm
−1, consistent with channel water. Across the four FTIR-analyzed crystals, the observed water-related bands are predominantly consistent with type-II water, accompanied by weaker type-I features [
5,
15,
16,
17,
28,
50,
51,
52].
The relative intensities of type-I and type-II water bands are influenced by channel cations and growth conditions. Because type-II H
2O is associated with water molecules whose orientation is affected by nearby channel cations, its predominance provides crystal-chemical information on the channel environment [
5,
15,
16,
17,
50,
51]. However, this feature alone does not uniquely constrain the mineralizing-fluid composition or physicochemical conditions and is not used here as an independent genetic or geographic-origin indicator.
4.3. Significance of the North Muzart River Samples as a Natural Comparative System
Compared with emeralds in which Cr and V commonly coexist, the North Muzart River samples show a V-dominant composition, with Cr not detected under the present EDXRF conditions, and therefore provide a natural comparative system for examining V-related electronic absorption [
18,
20,
21,
30,
34,
35,
37,
38]. Raman and FTIR spectroscopy further establish the associated beryl-framework and channel-water background.
The samples can also be compared with experimentally V-doped beryl and V-bearing synthetic emerald, particularly with respect to the principal absorption bands near 429 and 617 nm [
25,
27]. In gemological characterization, this combination of compositional and spectroscopic features may serve as one component of a multi-parameter comparison with other green beryls and emeralds. However, these features are not sufficient on their own for geographic-origin determination or natural-versus-synthetic identification. For synthetic materials, the North Muzart River samples provide a natural reference for V-related absorption rather than a quantitative model for dopant concentration or crystal-growth conditions.
The crystals were not directionally cut and differ in thickness, surface condition, transparency, and fracture density. No polarizing accessory was used, and the EDXRF and spectroscopic analytical areas were not strictly coincident. The present comparisons are therefore limited to band position, band shape, and relative intensity. Absolute absorption coefficients were not calculated, and no quantitative relationships were established between V content and absorption intensity or between crystallographic direction and dichroism. Rigorous crystal-field analysis requires controlled orientation and polarized spectra, whereas quantitative concentration–absorption relationships additionally require thickness-normalized spectra and more precise composition data. The present study did not address crystal-growth processes or spatial V-concentration gradients and therefore cannot constrain the detailed incorporation of V or the physicochemical conditions of crystal growth.
5. Conclusions
Natural V-rich green beryl from the North Muzart River area is characterized by a V-dominant EDXRF composition, with Cr not detected under the present analytical conditions, and recurrent absorption bands near 429 and 617 nm. Their positions agree with V-related absorptions reported for V-rich beryl and are therefore interpreted as predominantly V-related, while the V3+ assignment remains indirect because EDXRF does not determine the oxidation state, crystallographic site, or local coordination of V and cannot exclude a minor contribution from Cr below the EDXRF detection capability. Raman spectra from the two selected green regions are consistent with the beryl host, and FTIR spectra of the four analyzed crystals show predominantly type-II channel-water features.
The main contribution of this study is to provide an integrated compositional and spectroscopic reference for an unusual natural V-dominant beryl system, including electronic absorption, framework vibrations, and channel-water characteristics. Its value is primarily comparative rather than quantitative because of the semiquantitative EDXRF data, variable crystal thickness, and only approximate crystallographic orientation. Future work combining valence-sensitive measurements, controlled polarized absorption spectroscopy, and higher-resolution compositional analysis could test V-site/valence assignments and concentration–absorption relationships more directly.
Author Contributions
Writing—original draft preparation, T.Z.; visualization, T.Z.; software, T.Z.; writing—review and editing, G.L.; methodology, G.L.; resources, G.L.; data curation, G.L.; validation, F.S.; conceptualization, F.S.; investigation, F.S. All authors have read and agreed to the published version of the manuscript.
Funding
This research received no external funding.
Institutional Review Board Statement
Not applicable.
Informed Consent Statement
Not applicable.
Data Availability Statement
The original contributions presented in this study are included in the article. Further inquiries can be directed to the corresponding author.
Acknowledgments
The authors are grateful to the Gemological Experimental Teaching Center, School of Gemology, China University of Geosciences (Beijing), for assistance with data preparation for this study.
Conflicts of Interest
Author Fabian Schmitz was employed by Rhein Main Gem Consulting. The remaining authors declare that the research was conducted in the absence of any commercial or financial relationships that could be construed as potential conflicts of interest.
References
- Gibbs, G.V.; Breck, D.W.; Meagher, E.P. Structural refinement of hydrous and anhydrous synthetic beryl, Al2(Be3Si6)O18 and emerald, Al1.9Cr0.1(Be3Si6)O18. Lithos 1968, 1, 275–285. [Google Scholar] [CrossRef] [Scilit]
- Artioli, G.; Rinaldi, R.; Stahl, K.; Zanazzi, P.F. Structure refinements of beryl by single-crystal neutron and X-ray diffraction. Am. Mineral. 1993, 78, 762–768. [Google Scholar]
- Aurisicchio, C.; Fioravanti, G.; Grubessi, O.; Zanazzi, P.F. Reappraisal of the crystal chemistry of beryl. Am. Mineral. 1988, 73, 826–837. [Google Scholar]
- Sherriff, B.L.; Grundy, H.D.; Hartman, J.S.; Hawthorne, F.C.; Černý, P. The incorporation of alkalis in beryl: A multinuclear MAS NMR and crystal-structure study. Can. Mineral. 1991, 29, 271–285. [Google Scholar]
- Aurisicchio, C.; Grubessi, O.; Zecchini, P. Infrared spectroscopy and crystal chemistry of the beryl group. Can. Mineral. 1994, 32, 55–68. [Google Scholar]
- Hawthorne, F.C.; Huminicki, D.M.C. The crystal chemistry of beryllium. Rev. Mineral. Geochem. 2002, 50, 333–403. [Google Scholar] [CrossRef] [Scilit]
- Hanser, C.S.; Häger, T.; Botcharnikov, R. Incorporation and substitution of ions and H2O in the structure of beryl. Eur. J. Mineral. 2024, 36, 449–472. [Google Scholar] [CrossRef] [Scilit]
- Wood, D.L.; Nassau, K. The characterization of beryl and emerald by visible and infrared absorption spectroscopy. Am. Mineral. 1968, 53, 777–800. [Google Scholar]
- Blak, A.R.; Isotani, S.; Watanabe, S. Optical absorption and electron spin resonance in blue and green natural beryl. Phys. Chem. Miner. 1982, 8, 161–166. [Google Scholar] [CrossRef] [Scilit]
- Mathew, G.; Karanth, R.V.; Gundo Rao, T.K.; Deshpande, R.S. Colouration in natural beryls: A spectroscopic investigation. J. Geol. Soc. India 2000, 56, 285–304. [Google Scholar] [CrossRef] [Scilit]
- Isotani, S.; Blak, A.R.; Watanabe, S. UV optical absorption spectra analysis of beryl crystals from Brazil. Phys. B 2010, 405, 1501–1508. [Google Scholar] [CrossRef] [Scilit]
- Taran, M.N.; Vyshnevskyi, O.A. Be, Fe2+-substitution in natural beryl: An optical absorption spectroscopy study. Phys. Chem. Miner. 2019, 46, 795–806. [Google Scholar] [CrossRef] [Scilit]
- Hagemann, H.; Lucken, A.; Bill, H.; Gysler-Sanz, J.; Stalder, H.A. Polarized Raman spectra of beryl and bazzite. Phys. Chem. Miner. 1990, 17, 395–401. [Google Scholar] [CrossRef] [Scilit]
- Bersani, D.; Azzi, G.; Lambruschi, E.; Barone, G.; Mazzoleni, P.; Raneri, S.; Longobardo, U.; Lottici, P.P. Characterization of emeralds by micro-Raman spectroscopy. J. Raman Spectrosc. 2014, 45, 1293–1300. [Google Scholar] [CrossRef] [Scilit]
- Fukuda, J.; Shinoda, K. Coordination of water molecules with Na+ cations in a beryl channel as determined by polarized IR spectroscopy. Phys. Chem. Miner. 2008, 35, 347–357. [Google Scholar] [CrossRef] [Scilit]
- Wood, D.L.; Nassau, K. Infrared spectra of foreign molecules in beryl. J. Chem. Phys. 1967, 47, 2220–2228. [Google Scholar] [CrossRef] [Scilit]
- Charoy, B.; De Donato, P.; Barres, O.; Pinto-Coelho, C. Channel occupancy in an alkali-poor beryl from Serra Branca (Goias, Brazil): Spectroscopic characterization. Am. Mineral. 1996, 81, 395–403. [Google Scholar] [CrossRef] [Scilit]
- Hu, Y.; Lu, R. Unique vanadium-rich emerald from Malipo, China. Gems Gemol. 2019, 55, 338–352. [Google Scholar] [CrossRef] [Scilit]
- Bai, F.; Pan, H.; Li, X. Replacement degree of Al3+ and Cr/V ratio in high-V emeralds from Malipo, Yunnan, China. Arab. J. Geosci. 2019, 12, 377. [Google Scholar] [CrossRef] [Scilit]
- Hong, Y.; Zhang, Y.; Shao, X.; Mu, Y.; Yu, Y. Gemological characteristics and coloration mechanism of vanadium-bearing beryl from Nigeria. Minerals 2025, 15, 557. [Google Scholar] [CrossRef] [Scilit]
- Karampelas, S.; Al-Shaybani, B.; Mohamed, F.; Sangsawong, S.; Al-Alawi, A. Emeralds from the most important occurrences: Chemical and spectroscopic data. Minerals 2019, 9, 561. [Google Scholar] [CrossRef] [Scilit]
- Taran, M.N.; Rossman, G.R. Optical spectroscopic study of tuhualite and a re-examination of the beryl, cordierite, and osumilite spectra. Am. Mineral. 2001, 86, 973–980. [Google Scholar] [CrossRef] [Scilit]
- Spinolo, G.; Fontana, I.; Galli, A. Optical absorption spectra of Fe2+ and Fe3+ in beryl crystals. Phys. Status Solidi B 2007, 244, 4660–4668. [Google Scholar] [CrossRef] [Scilit]
- Flamini, A.; Gastaldi, L.; Viticoli, S. Crystal growth and characterization of beryl doped with transition metal ions. Mater. Res. Bull. 1986, 21, 1–6. [Google Scholar] [CrossRef] [Scilit]
- Mittani, J.C.R.; Watanabe, S.; Matsuoka, M.; Baptista, D.L.; Zawislak, F.C. Doping by diffusion and implantation of V, Cr, Mn and Fe ions in uncoloured beryl crystals. Nucl. Instrum. Methods Phys. Res. B 2004, 218, 255–258. [Google Scholar] [CrossRef] [Scilit]
- Adamo, I.; Gatta, G.D.; Rotiroti, N.; Diella, V.; Pavese, A. Gemmological investigation of a synthetic blue beryl: A multi-methodological study. Mineral. Mag. 2008, 72, 799–808. [Google Scholar] [CrossRef] [Scilit]
- Schmetzer, K.; Schwarz, D.; Bernhardt, H.-J.; Häger, T. A new type of Tairus hydrothermally-grown synthetic emerald, coloured by vanadium and copper. J. Gemmol. 2006, 30, 59–74. [Google Scholar] [CrossRef] [Scilit]
- Belyanchikov, M.A.; Zhukova, E.S.; Tretiak, S.; Zhugayevych, A.; Dressel, M.; Uhlig, F.; Smiatek, J.; Fyta, M.; Thomas, V.G.; Gorshunov, B.P. Vibrational states of nano-confined water molecules in beryl investigated by first-principles calculations and optical experiments. Phys. Chem. Chem. Phys. 2017, 19, 30740–30748. [Google Scholar] [CrossRef] [Scilit] [PubMed]
- Mashkovtsev, R.I.; Thomas, V.G.; Fursenko, D.A.; Zhukova, E.S.; Uskov, V.V.; Gorshunov, B.P. FTIR spectroscopy of D2O and HDO molecules in the c-axis channels of synthetic beryl. Am. Mineral. 2016, 101, 175–180. [Google Scholar] [CrossRef] [Scilit]
- Qin, L.-J.; Yu, X.-Y.; Guo, H.-S. Fluid inclusion and chemical composition characteristics of emeralds from Rajasthan Area, India. Minerals 2022, 12, 641. [Google Scholar] [CrossRef] [Scilit]
- De Araújo Neto, J.F.; De Brito Barreto, S.; Carrino, T.A.; Müller, A.; Montefalco de Lira Santos, L.C. Mineralogical and gemological characterization of emerald crystals from Paraná deposit, NE Brazil: A study of mineral chemistry, absorption and reflectance spectroscopy and thermal analysis. Braz. J. Geol. 2019, 49, e20190014. [Google Scholar] [CrossRef] [Scilit]
- Zheng, Y.-Y.; Yu, X.-Y.; Xu, B.; Gao, Y.-J. Characterizing Malysheva emeralds (Urals, Russia) by microscopy, spectroscopy, trace element chemistry, and machine learning. Crystals 2024, 14, 683. [Google Scholar] [CrossRef] [Scilit]
- Franz, G.; Vyshnevskyi, O.; Taran, M.; Khomenko, V.; Wiedenbeck, M.; Schiperski, F.; Nissen, J. A new emerald occurrence from Kruta Balka, Western Peri-Azovian region, Ukraine: Implications for understanding the crystal chemistry of emerald. Am. Mineral. 2020, 105, 162–181. [Google Scholar] [CrossRef]
- Zhang, Y.; Yu, X.-Y. Spectroscopy and trace-element characteristics of emeralds from Kamakanga, Zambia. Crystals 2023, 13, 1605. [Google Scholar] [CrossRef] [Scilit]
- Nikopoulou, M.; Karampelas, S.; Hennebois, U.; Gruss, P.; Gaillou, E.; Fritsch, E.; Herreweghe, A.; Papadopoulou, L.; Melfos, V.; Kantiranis, N.; et al. Microscopic, spectroscopic and chemical analysis of emeralds from Habachtal, Austria. Minerals 2025, 15, 22, Correction in Minerals 2025, 15, 707. https://doi.org/10.3390/min15070707. [Google Scholar] [CrossRef] [Scilit]
- Giuliani, G.; Groat, L.A.; Marshall, D.; Fallick, A.E.; Branquet, Y. Emerald deposits: A review and enhanced classification. Minerals 2019, 9, 105. [Google Scholar] [CrossRef] [Scilit]
- Hanser, C.S.; Stephan, T.; Gul, B.; Häger, T.; Botcharnikov, R. Comparison of emeralds from the Chitral District, Pakistan, with other Pakistani and Afghan emeralds. J. Gemmol. 2023, 38, 582–599. [Google Scholar] [CrossRef] [Scilit]
- Jiang, Y.; Zhao, S.; Zhang, Z.; Xu, B. Gemological characteristics and trace chemical element analysis of emerald in Kafubu, Zambia. Crystals 2025, 15, 385. [Google Scholar] [CrossRef] [Scilit]
- Groat, L.A.; Giuliani, G.; Marshall, D.D.; Turner, D. Emerald deposits and occurrences: A review. Ore Geol. Rev. 2008, 34, 87–112. [Google Scholar] [CrossRef] [Scilit]
- Vapnik, Y.; Moroz, I.; Roth, M.; Eliezri, I. Formation of emeralds at pegmatite–ultramafic contacts based on fluid inclusions in Kianjavato emerald, Mananjary deposits, Madagascar. Mineral. Mag. 2006, 70, 141–158. [Google Scholar] [CrossRef] [Scilit]
- Kozłowski, A.; Metz, P.; Estrada, H.A. Emeralds from Somondoco, Colombia: Chemical composition, fluid inclusions and origin. Neues Jahrb. Mineral. Abh. 1988, 159, 23–49. [Google Scholar] [CrossRef] [Scilit]
- Zhao, H.; Cai, J.; Xu, Y.; Li, Y.; Liu, Y. Chemical composition analysis and genetic significance of emeralds from Mingora, Pakistan. Geoscience 2025, 39, 194–208. (In Chinese) [Google Scholar] [CrossRef]
- Cao, S.; Dai, H.; Wang, C.; Yu, L.; Zuo, R.; Wang, F.; Guo, L. Gemological and spectroscopic characteristics of emerald from the Swat mining area, Pakistan. Spectrosc. Spectr. Anal. 2022, 42, 3533–3540. (In Chinese) [Google Scholar]
- Dai, H.; Wang, D.; Liu, L.; Yu, Y.; Dai, J. Mineralogical characteristics of emerald from the Jiajika rare-metal mining area, Sichuan. Acta Mineral. Sin. 2018, 38, 135–142. (In Chinese) [Google Scholar]
- Dai, H.; Wang, D.; Liu, L.; Huang, F.; Wang, C. Electron-probe and micro-area X-ray diffraction study of emerald-grade beryl from the Zhen’an W–Be polymetallic deposit, Shaanxi. Rock Miner. Anal. 2018, 37, 336–345. (In Chinese) [Google Scholar]
- Wang, H.; Liang, R.; Lan, Y.; Pan, H.; Ai, X.; Lin, H. Spectroscopic characteristics of emerald from Menzies, Australia. Acta Mineral. Sin. 2019, 39, 657–663. (In Chinese) [Google Scholar]
- Zhao, X.; Sha, X.; Yin, Y.; Zhao, H.; Zhang, S.; Xie, A. Mineralogical and spectroscopic characteristics of Malipo emerald, Yunnan. Mod. Min. 2023, 39, 149–153. (In Chinese) [Google Scholar]
- Dong, X.; Chen, T.; Zhou, Z. Gemological and spectroscopic characteristics of emerald from the Panjshir Valley, Afghanistan. J. Gems Gemmol. 2023, 25, 17–29. (In Chinese) [Google Scholar] [CrossRef]
- Hua, J.; Di, J. Chemical composition and spectroscopic characteristics of emeralds from the Bahia mining area, Brazil. J. Gems Gemmol. 2022, 24, 109–117. (In Chinese) [Google Scholar] [CrossRef]
- Mashkovtsev, R.I.; Lebedev, A.S. Infrared spectroscopy of water in beryl. J. Struct. Chem. 1993, 33, 930–933. [Google Scholar] [CrossRef] [Scilit]
- Fukuda, J.; Shinoda, K.; Nakashima, S.; Miyoshi, N.; Aikawa, N. Polarized infrared spectroscopic study of diffusion of water molecules along structure channels in beryl. Am. Mineral. 2009, 94, 981–985. [Google Scholar] [CrossRef] [Scilit]
- Fukuda, J.; Shinoda, K. Water molecules in beryl and cordierite: High-temperature vibrational behavior, dehydration, and coordination to cations. Phys. Chem. Miner. 2011, 38, 469–481. [Google Scholar] [CrossRef] [Scilit]
Figure 1.
Natural V-rich green beryl specimens attached to host rock from the North Muzart River area (M1–M3).
Figure 1.
Natural V-rich green beryl specimens attached to host rock from the North Muzart River area (M1–M3).
Figure 2.
Detached natural V-rich green beryl crystals used for compositional and spectroscopic analyses (E1–E7).
Figure 2.
Detached natural V-rich green beryl crystals used for compositional and spectroscopic analyses (E1–E7).
Figure 3.
Microscopic appearance of the contact between green beryl and host rock. The boundary between green beryl and the surrounding mineral grains is irregular, with local fractures and host-rock fragments; scale bar = 1 mm.
Figure 3.
Microscopic appearance of the contact between green beryl and host rock. The boundary between green beryl and the surrounding mineral grains is irregular, with local fractures and host-rock fragments; scale bar = 1 mm.
Figure 4.
Microscopic appearance of a pale-green beryl aggregate in a host-rock-bearing specimen. Color and transparency are heterogeneous, and the aggregate has irregular contacts with the surrounding minerals; scale bar = 1 mm.
Figure 4.
Microscopic appearance of a pale-green beryl aggregate in a host-rock-bearing specimen. Color and transparency are heterogeneous, and the aggregate has irregular contacts with the surrounding minerals; scale bar = 1 mm.
Figure 5.
Normalized Fe
2O
3–V
2O
5–Cr
2O
3 ternary diagram for natural V-rich green beryl from the North Muzart River area and green beryl from other localities. Data for the North Muzart River samples are from the present EDXRF analyses; comparative data are from references [
19,
21,
30,
31,
32,
33,
34,
35,
36,
37,
38,
39,
40,
41,
42,
43,
44,
45,
46,
47,
48,
49]. The three oxide-equivalent components were normalized to Fe
2O
3 + V
2O
5 + Cr
2O
3 = 100%. Points for which Cr
2O
3 was not detected are plotted on the Cr
2O
3 = 0 boundary for visualization; their positions do not indicate that the actual Cr content is zero. The gray shaded ellipse is used only to highlight the distribution of the North Muzart River samples and has no statistical meaning.
Figure 5.
Normalized Fe
2O
3–V
2O
5–Cr
2O
3 ternary diagram for natural V-rich green beryl from the North Muzart River area and green beryl from other localities. Data for the North Muzart River samples are from the present EDXRF analyses; comparative data are from references [
19,
21,
30,
31,
32,
33,
34,
35,
36,
37,
38,
39,
40,
41,
42,
43,
44,
45,
46,
47,
48,
49]. The three oxide-equivalent components were normalized to Fe
2O
3 + V
2O
5 + Cr
2O
3 = 100%. Points for which Cr
2O
3 was not detected are plotted on the Cr
2O
3 = 0 boundary for visualization; their positions do not indicate that the actual Cr content is zero. The gray shaded ellipse is used only to highlight the distribution of the North Muzart River samples and has no statistical meaning.
Figure 6.
Binary plot of Fe2O3- and V2O5-equivalent contents in natural V-rich green beryl from the North Muzart River area. The dataset comprises 13 EDXRF point analyses, and both oxide contents are semiquantitative EDXRF equivalents.
Figure 6.
Binary plot of Fe2O3- and V2O5-equivalent contents in natural V-rich green beryl from the North Muzart River area. The dataset comprises 13 EDXRF point analyses, and both oxide contents are semiquantitative EDXRF equivalents.
Figure 7.
UV–Vis–NIR apparent absorbance spectra of natural V-rich green beryl from the North Muzart River area. The E1 spectrum was collected from a crystal surface approximately perpendicular to the c-axis; paired spectra for E2–E7 were collected from surfaces approximately parallel and perpendicular to the c-axis. Spectral annotations indicate tentative literature-based assignments rather than direct valence-state determinations in the present samples.
Figure 7.
UV–Vis–NIR apparent absorbance spectra of natural V-rich green beryl from the North Muzart River area. The E1 spectrum was collected from a crystal surface approximately perpendicular to the c-axis; paired spectra for E2–E7 were collected from surfaces approximately parallel and perpendicular to the c-axis. Spectral annotations indicate tentative literature-based assignments rather than direct valence-state determinations in the present samples.
Figure 8.
UV–Vis–NIR apparent absorbance spectra of natural V-rich green beryl from the North Muzart River area collected from crystal surfaces approximately perpendicular to the c-axis. Spectral annotations indicate tentative literature-based assignments rather than direct valence-state determinations in the present samples.
Figure 8.
UV–Vis–NIR apparent absorbance spectra of natural V-rich green beryl from the North Muzart River area collected from crystal surfaces approximately perpendicular to the c-axis. Spectral annotations indicate tentative literature-based assignments rather than direct valence-state determinations in the present samples.
Figure 9.
Raman spectra of natural V-rich green beryl samples E1 and E6 from the North Muzart River area.
Figure 9.
Raman spectra of natural V-rich green beryl samples E1 and E6 from the North Muzart River area.
Figure 10.
FTIR spectra of samples E1, E3, and E4 over 400–1400 cm−1.
Figure 10.
FTIR spectra of samples E1, E3, and E4 over 400–1400 cm−1.
Figure 11.
FTIR spectra of samples E1, E3, and E4 over 1400–4000 cm−1.
Figure 11.
FTIR spectra of samples E1, E3, and E4 over 1400–4000 cm−1.
Figure 12.
FTIR spectra of sample E7 over 2000–8000 cm−1, collected from crystal surfaces approximately parallel and perpendicular to the c-axis.
Figure 12.
FTIR spectra of sample E7 over 2000–8000 cm−1, collected from crystal surfaces approximately parallel and perpendicular to the c-axis.
Table 1.
Semiquantitative EDXRF oxide-equivalent contents of natural V-rich green beryl from the North Muzart River area.
Table 1.
Semiquantitative EDXRF oxide-equivalent contents of natural V-rich green beryl from the North Muzart River area.
| Cr2O3 (wt.%) | CuO (wt.%) | La2O3 (wt.%) | K2O (wt.%) | CaO (wt.%) | Cs2O (wt.%) | Fe2O3 (wt.%) | V2O5 (wt.%) | Al2O3 (wt.%) | SiO2 (wt.%) | Sample |
|---|
| n.d. | n.d. | 0.013 | 0.089 | 0.171 | 0.185 | 0.195 | 2.301 | 16.446 | 77.984 | E1-1 |
| n.d. | 0.007 | 0.027 | 0.084 | 0.067 | 0.111 | 0.374 | 4.423 | 15.865 | 78.794 | E1-2 |
| n.d. | 0.007 | 0.048 | n.d. | 0.124 | 0.116 | 0.454 | 4.424 | 15.529 | 79.093 | E1-3 |
| n.d. | 0.011 | 0.044 | n.d. | 0.057 | 0.086 | 0.272 | 3.532 | 17.187 | 78.695 | E2-1 |
| n.d. | 0.014 | 0.048 | n.d. | 0.096 | 0.087 | 0.252 | 3.644 | 17.122 | 78.656 | E2-2 |
| n.d. | 0.005 | 0.023 | n.d. | 0.101 | 0.092 | 0.302 | 3.901 | 16.439 | 79.019 | E3 |
| n.d. | n.d. | n.d. | 0.142 | 0.454 | 0.453 | 0.172 | 1.459 | 15.229 | 81.896 | E4-1 |
| n.d. | n.d. | n.d. | 0.109 | 0.219 | 0.557 | 0.195 | 1.861 | 15.196 | 81.704 | E4-2 |
| n.d. | n.d. | 0.011 | 0.153 | 0.072 | 0.138 | 0.331 | 4.056 | 16.600 | 78.157 | E5-1 |
| n.d. | n.d. | 0.008 | 0.113 | 0.050 | 0.121 | 0.291 | 4.218 | 15.866 | 78.726 | E5-2 |
| n.d. | n.d. | 0.129 | 0.063 | 0.947 | 0.066 | 0.346 | 3.863 | 16.642 | 77.861 | E6 |
| n.d. | 0.037 | 0.083 | 0.126 | 0.485 | 0.178 | 0.356 | 0.562 | 16.428 | 81.557 | E7-1 |
| n.d. | n.d. | 0.010 | n.d. | 0.168 | 0.171 | 0.494 | 4.616 | 16.692 | 77.433 | E7-2 |
Table 2.
Principal FTIR bands of natural V-rich green beryl from the North Muzart River area and their preliminary assignments.
Table 2.
Principal FTIR bands of natural V-rich green beryl from the North Muzart River area and their preliminary assignments.
| Preliminary Assignment | Band Position (cm−1) |
|---|
| Beryl framework vibrations (Si–O-, Si–O–Si-, O–Si–O-, and Be–O-related vibrations) | 453–1222 |
| Channel-water bending; mainly consistent with type-II water | ~1642 |
| Channel-water O–H stretching; mainly consistent with type-II water | ~3598 |
| Water-related combination band; may contain contributions from both type-I and type-II water | ~5270 |
| Water-related overtone/combination band; mainly consistent with type-II water | 7081–7097 |
| Weak type-I water-related overtone/combination band | ~7144 |
Table 3.
Comparison of representative absorption features of V-bearing natural and synthetic beryl.
Table 3.
Comparison of representative absorption features of V-bearing natural and synthetic beryl.
| Material/Study | Compositional Context | Representative Absorption Features (nm) | Interpretation/Comparison |
|---|
| North Muzart River (present study) | V-dominant; Cr2O3 not detected under present EDXRF conditions | ~429, ~617; weaker ~366, ~391, ~847 | Principal bands are interpreted as predominantly V-related; weaker features may involve Fe. |
| Malipo, China [18] | V-rich; Cr markedly lower than V | 432/611 (o-ray); 425/644 (e-ray); ~395 shoulder; ~830 | Closely comparable natural V-rich emerald; polarized spectra. |
| Nigeria [20] | V > Cr, although Fe is the predominant transition-metal component | ~427, ~610; ~371, ~810; Cr-related features near 645–684 in some samples | Illustrates overlapping contributions from V-, Cr-, and Fe-related absorption in natural beryl |
| Biron V-bearing synthetic beryl [27] | V-bearing; Cr- and Fe-free | 395, 430, 605, 645; ~680 sh. | Closer V-specific synthetic comparison; 395/430/605/645 nm attributed to V3+ at octahedral Al sites; ~680 nm shoulder uncertain. |
| Tairus hydrothermal synthetic emerald [27] | V- and Cu-bearing; Cr present only at relatively low levels | 395, 430, 605, 645 (V-related); 750, 920, 1180 (Cu-related) | Provides a synthetic V-bearing comparison; the visible V-related bands are accompanied by Cu-related absorption. |
| Disclaimer/Publisher’s Note: The statements, opinions and data contained in all publications are solely those of the individual author(s) and contributor(s) and not of MDPI and/or the editor(s). MDPI and/or the editor(s) disclaim responsibility for any injury to people or property resulting from any ideas, methods, instructions or products referred to in the content. |