3.1. Morphology and Structural Analysis
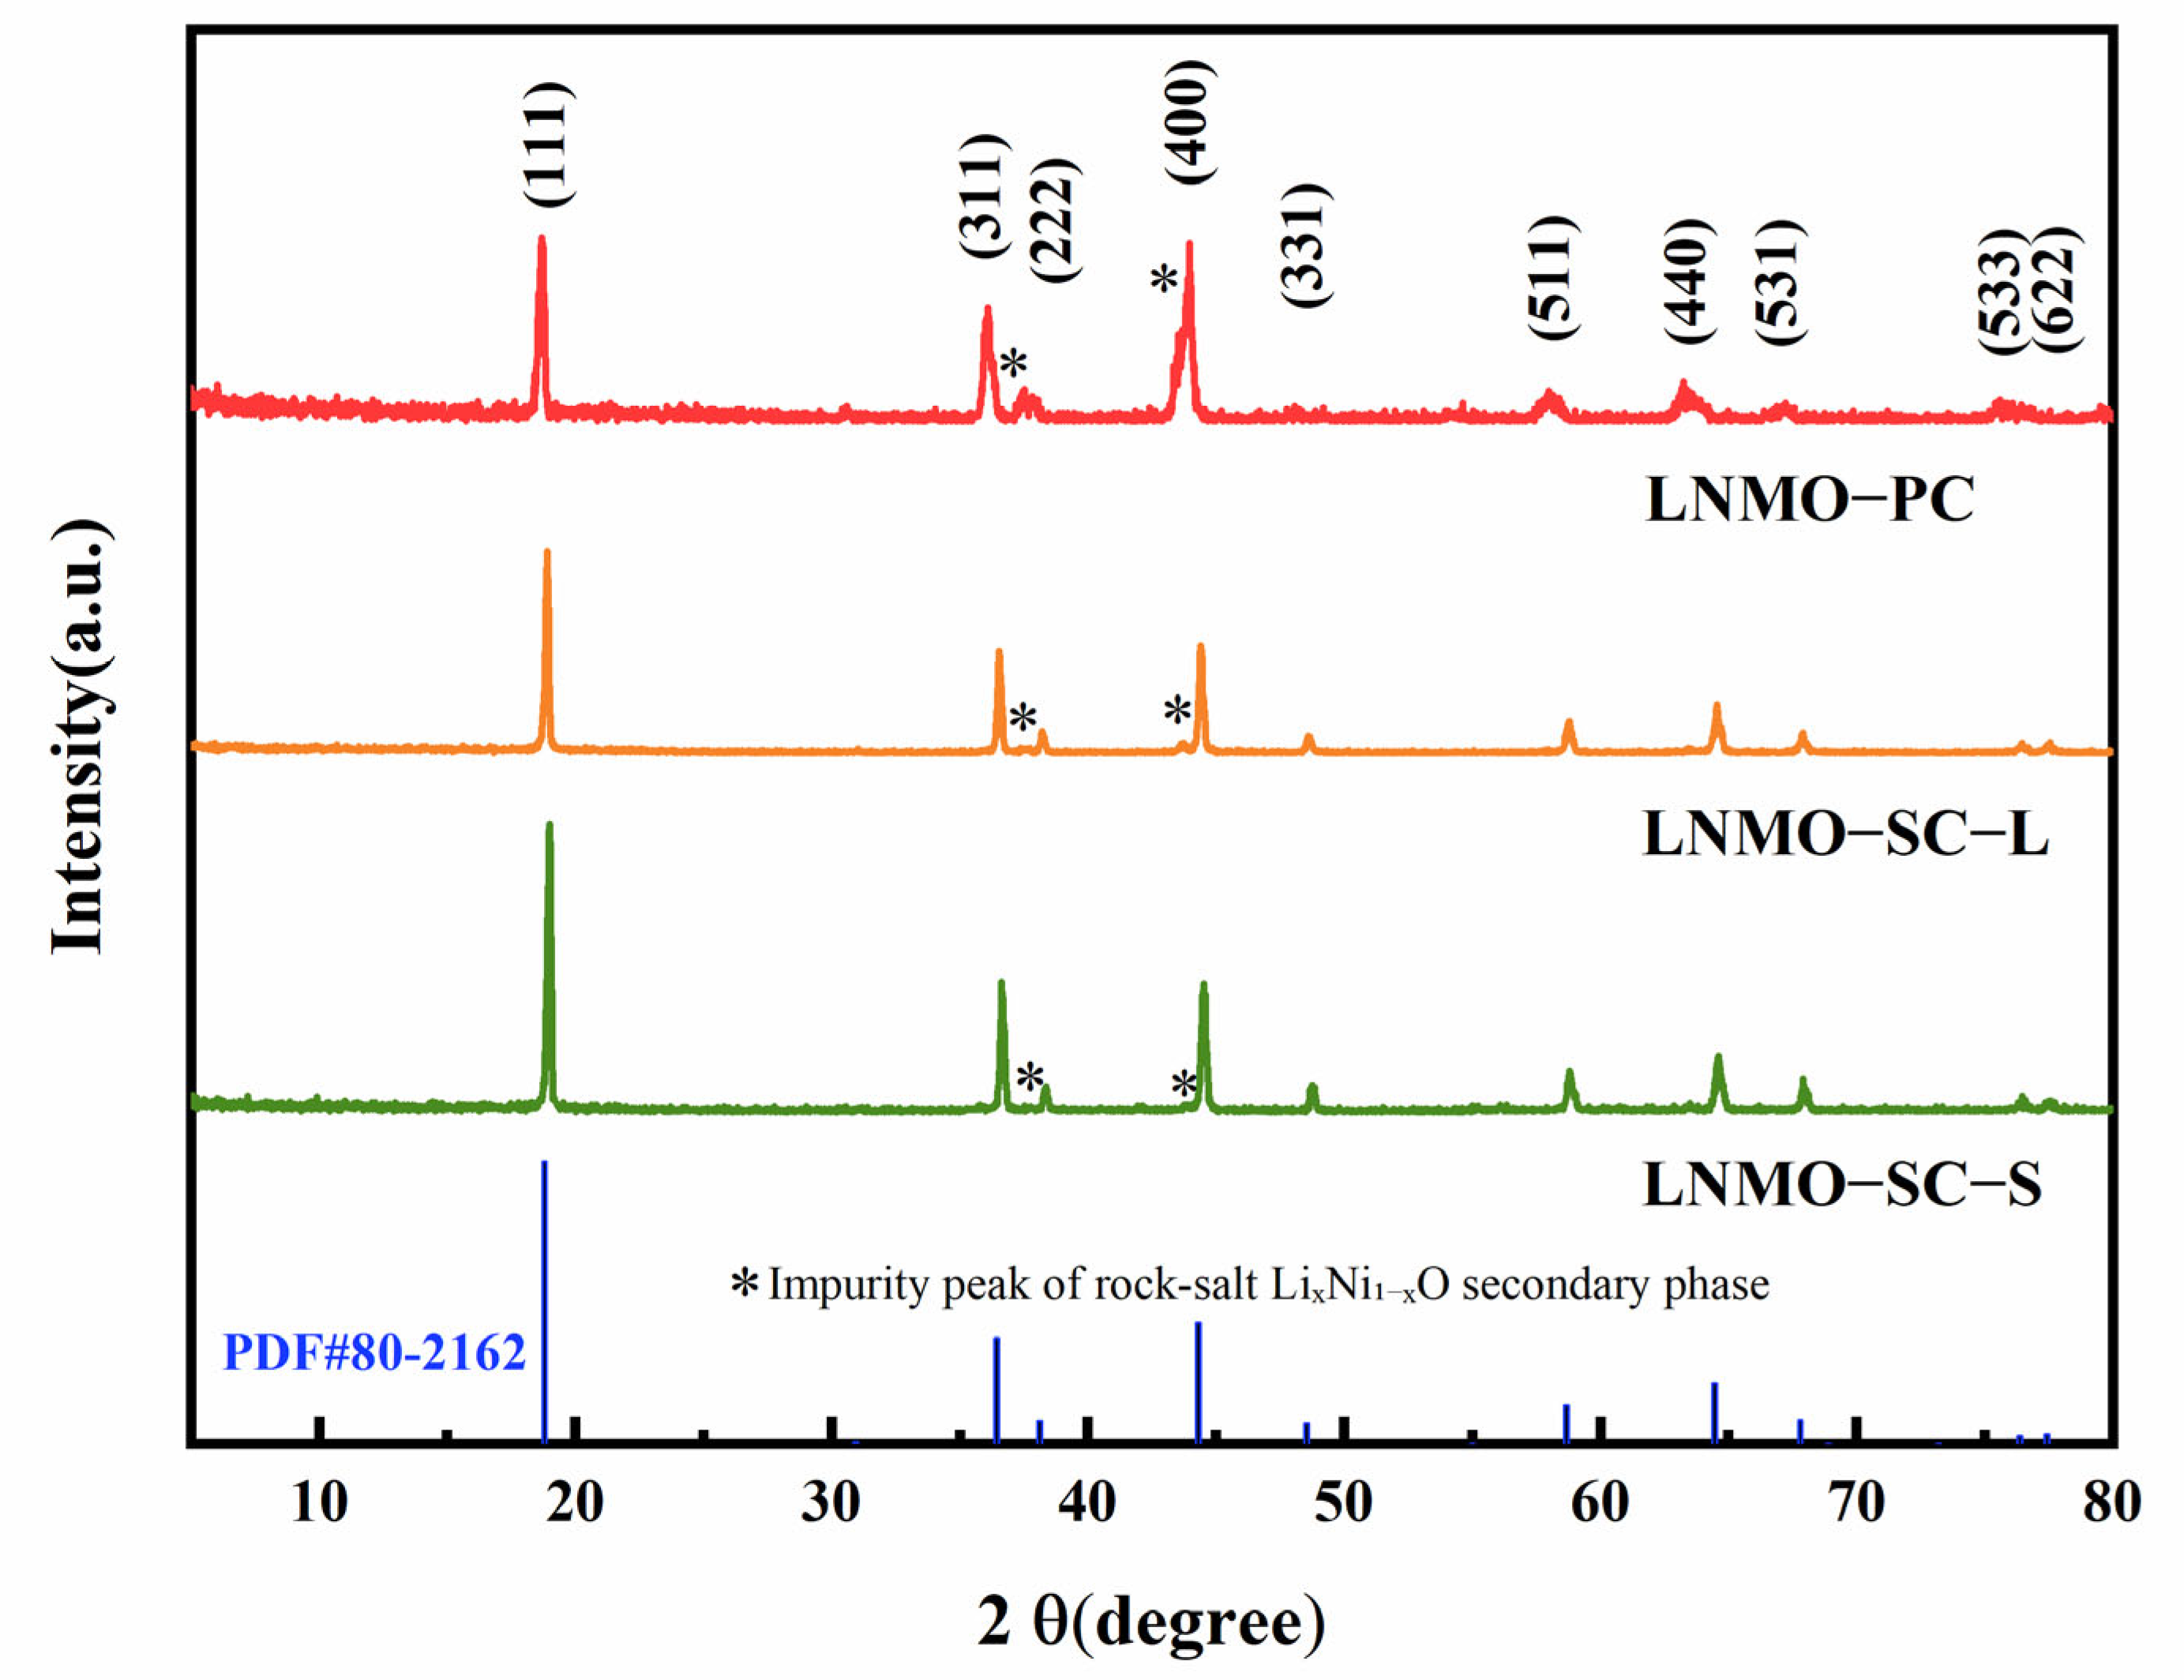
The crystal structures of LNMO-PC, LNMO-SC-L, and LNMO-SC-S were systematically characterized by XRD (
Figure 1). The diffraction peaks of all samples matched well with the spinel-type nickel manganese oxide standard card PDF#80-2162 (space group Fd-3m) [
24], confirming the successful synthesis of the spinel main phase. Weak diffraction peaks marked with * correspond to rock-salt Li
xNi
1−xO secondary impurity, whose peak intensity obeys LNMO-PC > LNMO-SC-L > LNMO-SC-S. Peak shifts and FWHM analysis further reveal structural discrepancies. Secondary polycrystalline aggregate LNMO-PC exhibits low-angle peak shifts and the broadest diffraction peaks, indicative of severe lattice expansion and grain-boundary-induced internal stress. LNMO-SC-L shows milder peak shifts and narrower peaks with reduced lattice strain. LNMO-SC-S matches the standard card almost perfectly with negligible peak offset, demonstrating minimal lattice distortion and superior atomic ordering. This structural feature effectively restrains lattice deformation and phase transition during cycling, contributing to outstanding electrochemical stability.
Full-spectrum Rietveld refinement was performed for three LNMO samples, with structural parameters summarized in
Table 2. Low R
wp values (8.1–8.5%) verify reliable fitting results. Refined lattice constant a and unit cell volume decrease in the order LNMO-PC > LNMO-SC-L> LNMO-SC-S. Abundant grain boundaries in LNMO-PC trigger severe tetrahedral Li/Ni mixing and abundant oxygen vacancies. Subsequent XPS confirms LNMO-PC possesses the highest Mn
3+ content (80.32%); the larger ionic radius of Mn
3+ causes lattice expansion, consistent with its low-angle peak shift observed by XRD. LNMO-SC-L displays intermediate lattice dimensions matching its moderate Mn
3+ proportion (75.67%). Low grain-boundary primary particle LNMO-SC-S has the lowest Mn
3+ fraction (71.93%) and the smallest lattice volume. The I
311/I
400 ratio, characterizing harmful tetrahedral Li/Ni mixing, declines as LNMO-SC-S (1.0087) > LNMO-SC-L (0.9802) > LNMO-PC (0.6811). More grain boundaries accelerate cation interdiffusion and lower this ratio. Submicron primary particles efficiently restrain Li/Ni cation mixing and deliver superior lithium site ordering. Grain boundaries act as nucleation sites for rock-salt Li
xNi
1−xO impurities, so impurity content ranks LNMO-PC > LNMO-SC-L > LNMO-SC-S. Excessive secondary phases in LNMO-PC induce irreversible capacity loss, while the continuous lattice of LNMO-SC-S inhibits impurity formation. In summary, particle morphology and grain boundary density govern structural differences across samples. Submicron primary particle (single-crystal morphology) LNMO-SC-S delivers highly ordered Li sites, minimal rock-salt impurities, and moderate Mn
3+ originating from mild octahedral Ni/Mn disorder. Appropriate Mn
3+ widens Li
+ migration channels to boost rate performance without severe Mn disproportionation, which explains its superior charge transfer kinetics and long-cycle stability in subsequent electrochemical tests.
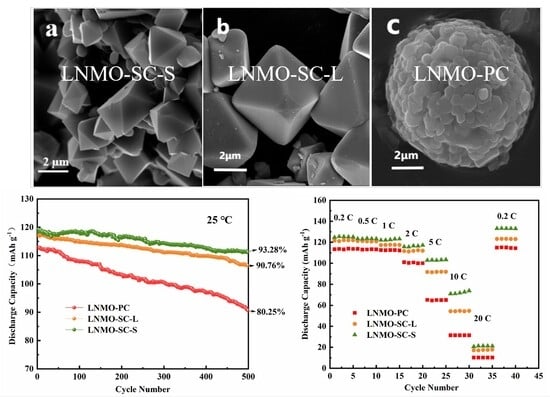
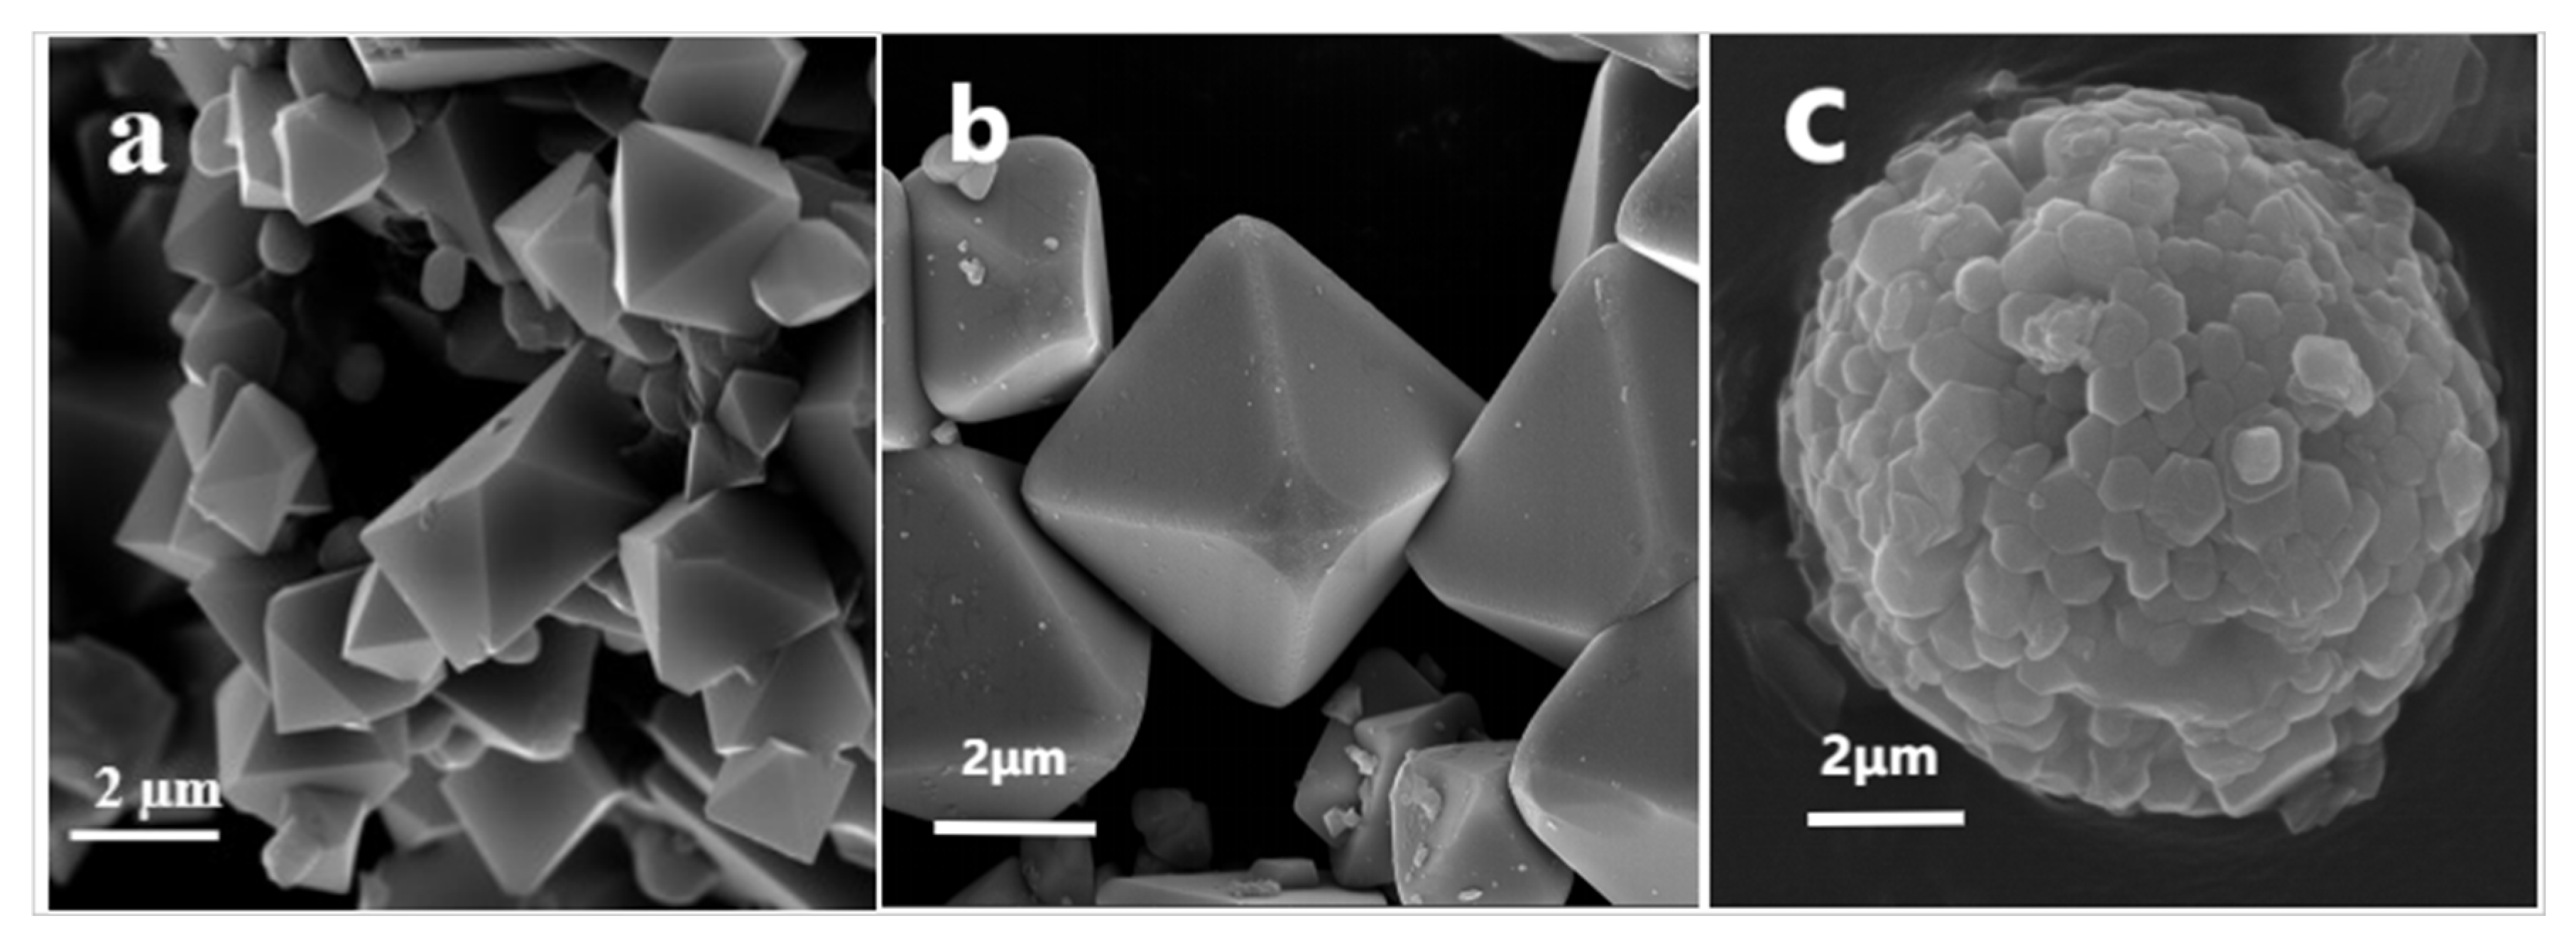
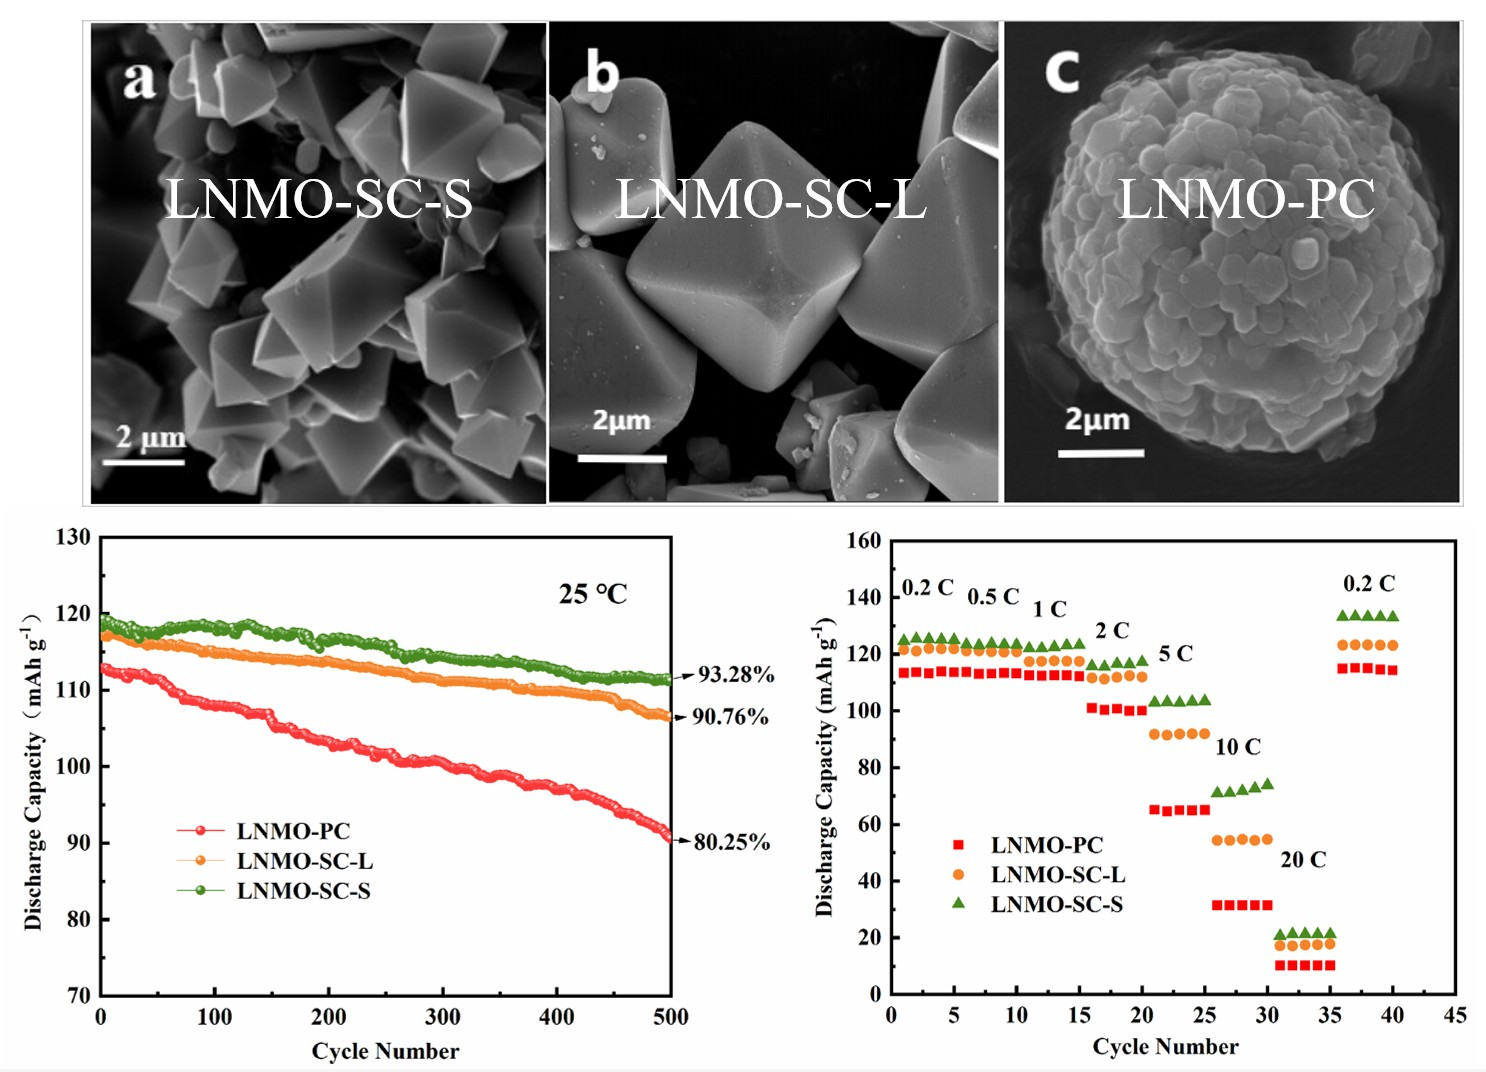
As displayed in
Figure 2a–c, three distinct particle morphologies are obtained from three synthetic routes, and obvious differences in particle exterior shapes can be observed. The sol–gel-synthesized LNMO-SC-S sample is composed of discrete, regular submicron primary particles with sharp crystal edges, smooth facets, and slight agglomeration, which is categorized as submicron primary particles in battery material studies. Such intact octahedral granular structure effectively shortens solid-state lithium-ion diffusion paths and mitigates concentration polarization; more importantly, this low grain-boundary primary particle avoids brittle fracture during electrode rolling and cycling volume expansion, maintaining stable ion/electron conductive networks as reported in ref. [
25]. The molten-salt product LNMO-SC-L also exhibits well-developed octahedral single-crystal morphology with much larger particle size and denser outer surfaces. The liquid molten salt medium promotes sufficient surface ion migration and complete crystal plane reconstruction during sintering, eliminating tiny surface pits, gaps, and micro-protrusions, thus forming a compact, defect-sparse outer surface. The molten salt medium facilitates complete crystal plane rearrangement and oriented crystal growth, yet the enlarged particle dimension prolongs lithium solid diffusion distance and restricts reaction kinetics compared with submicron octahedral particles. In contrast, LNMO-PC prepared via co-precipitation presents spherical polycrystalline aggregate morphology. These spherical secondary particles are assembled from abundant tiny primary crystallites, leading to rough surfaces and dense internal grain boundaries. A high density of grain boundaries brings extra interfacial resistance and tortuous Li
+ migration channels. Meanwhile, the stacked granular structure tends to crack and pulverize under compression and cyclic volume variation, accelerating performance degradation, which is consistent with the mechanism described in ref. [
26]. Different particle shapes intrinsically alter internal microstructural features, including grain boundary density, crystallite dimension, and lattice strain, and further produce divergent electrochemical behaviors. The subsequent XRD, FTIR, Raman, and XPS characterizations further quantify the structure–morphology correlation among the three morphologically distinct samples.
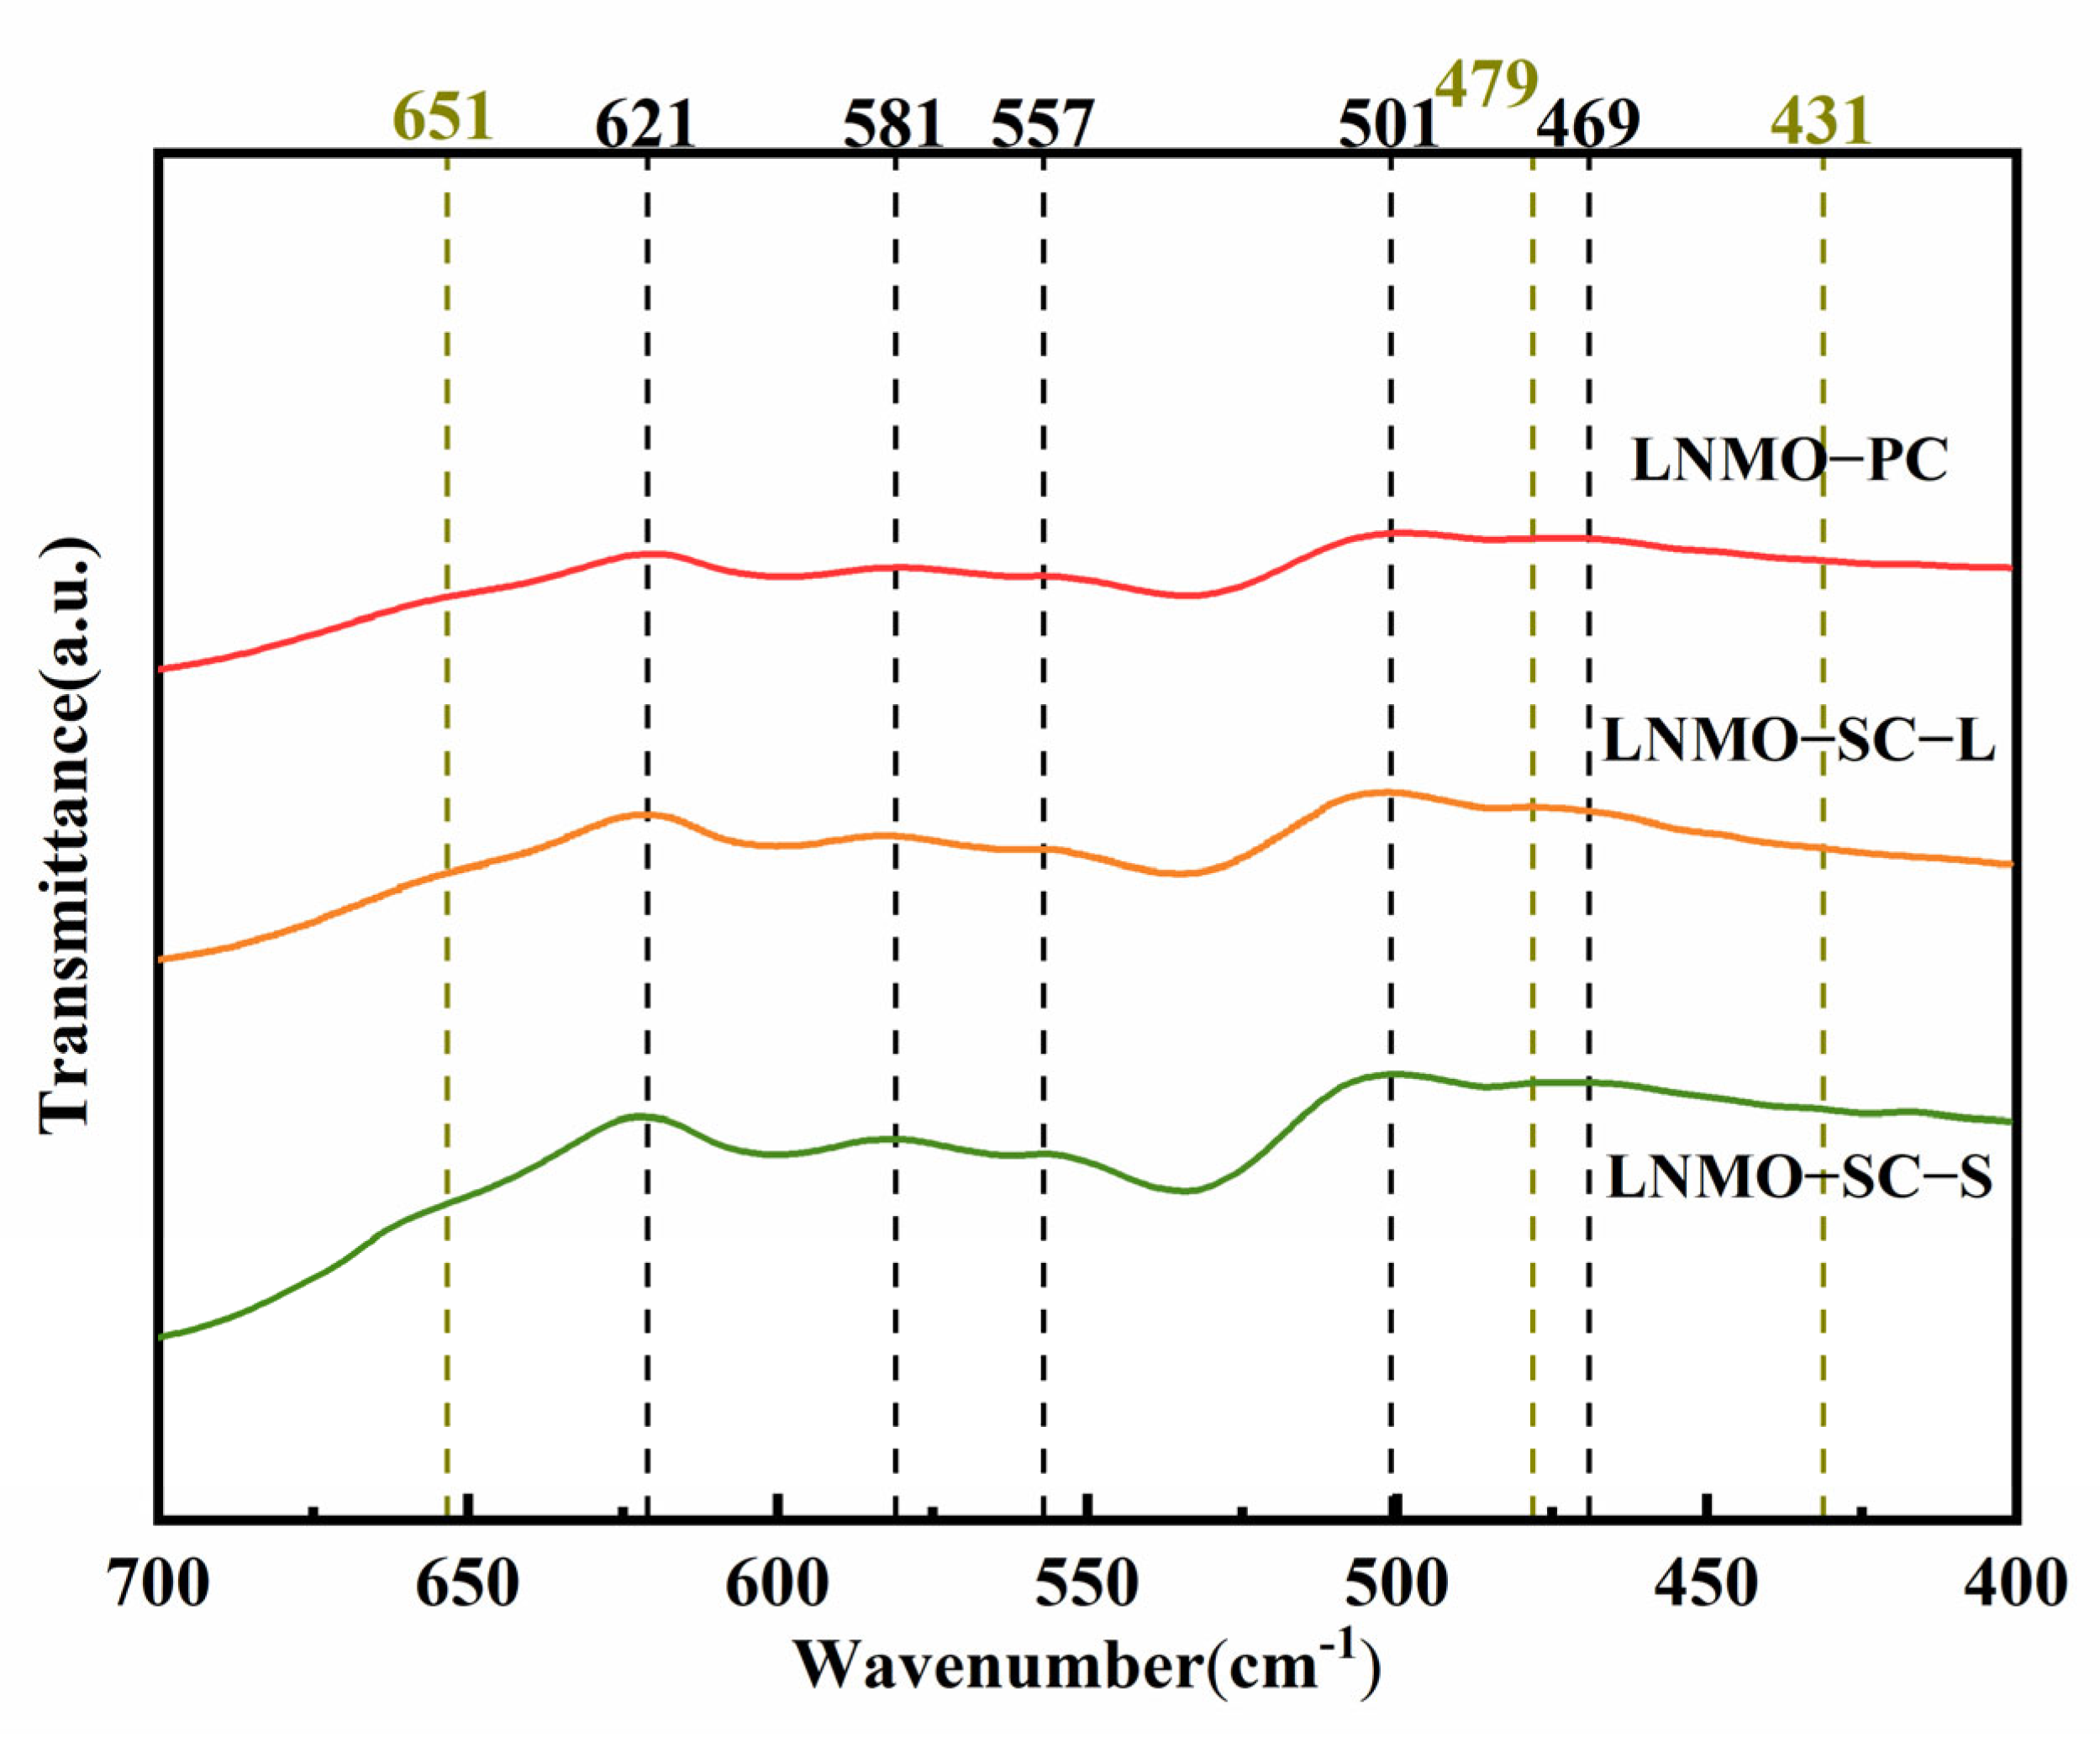
Based on FT-IR analysis (
Figure 3), the three samples, LNMO-PC, LNMO-SC-L, and LNMO-SC-S, all exhibit characteristics of the Fd-3m space group, with absorption peaks at 621 cm
−1, 581 cm
−1, 557 cm
−1, 501 cm
−1, and 469 cm
−1. The absorption peaks at 621 cm
−1 and 557 cm
−1 are associated with Mn–O vibrations, while the peaks at 581 cm
−1 and 501 cm
−1 correspond to Ni–O vibrations [
16]. The absorption peak intensity of F-type LNMO materials is lower than that of P-type LNMO materials. The shapes and intensities of the absorption peaks of the three samples differ, reflecting changes in their structural order. In LNMO-PC, the absorption peaks at 621 cm
−1 and 557 cm
−1 broaden, indicating that this sample contains more lattice defects and impurity phases, resulting in higher disorder and lower crystallinity. LNMO-SC-L has sharper and more concentrated absorption peaks, indicating higher crystallinity and reduced disorder. LNMO-SC-S has the sharpest absorption peaks with no noticeable shoulder peaks and also exhibits characteristic peaks of the P4
332 space group at 651, 479, and 431 cm
−1, indicating the highest crystallinity, lowest disorder, and most ordered structure [
4].
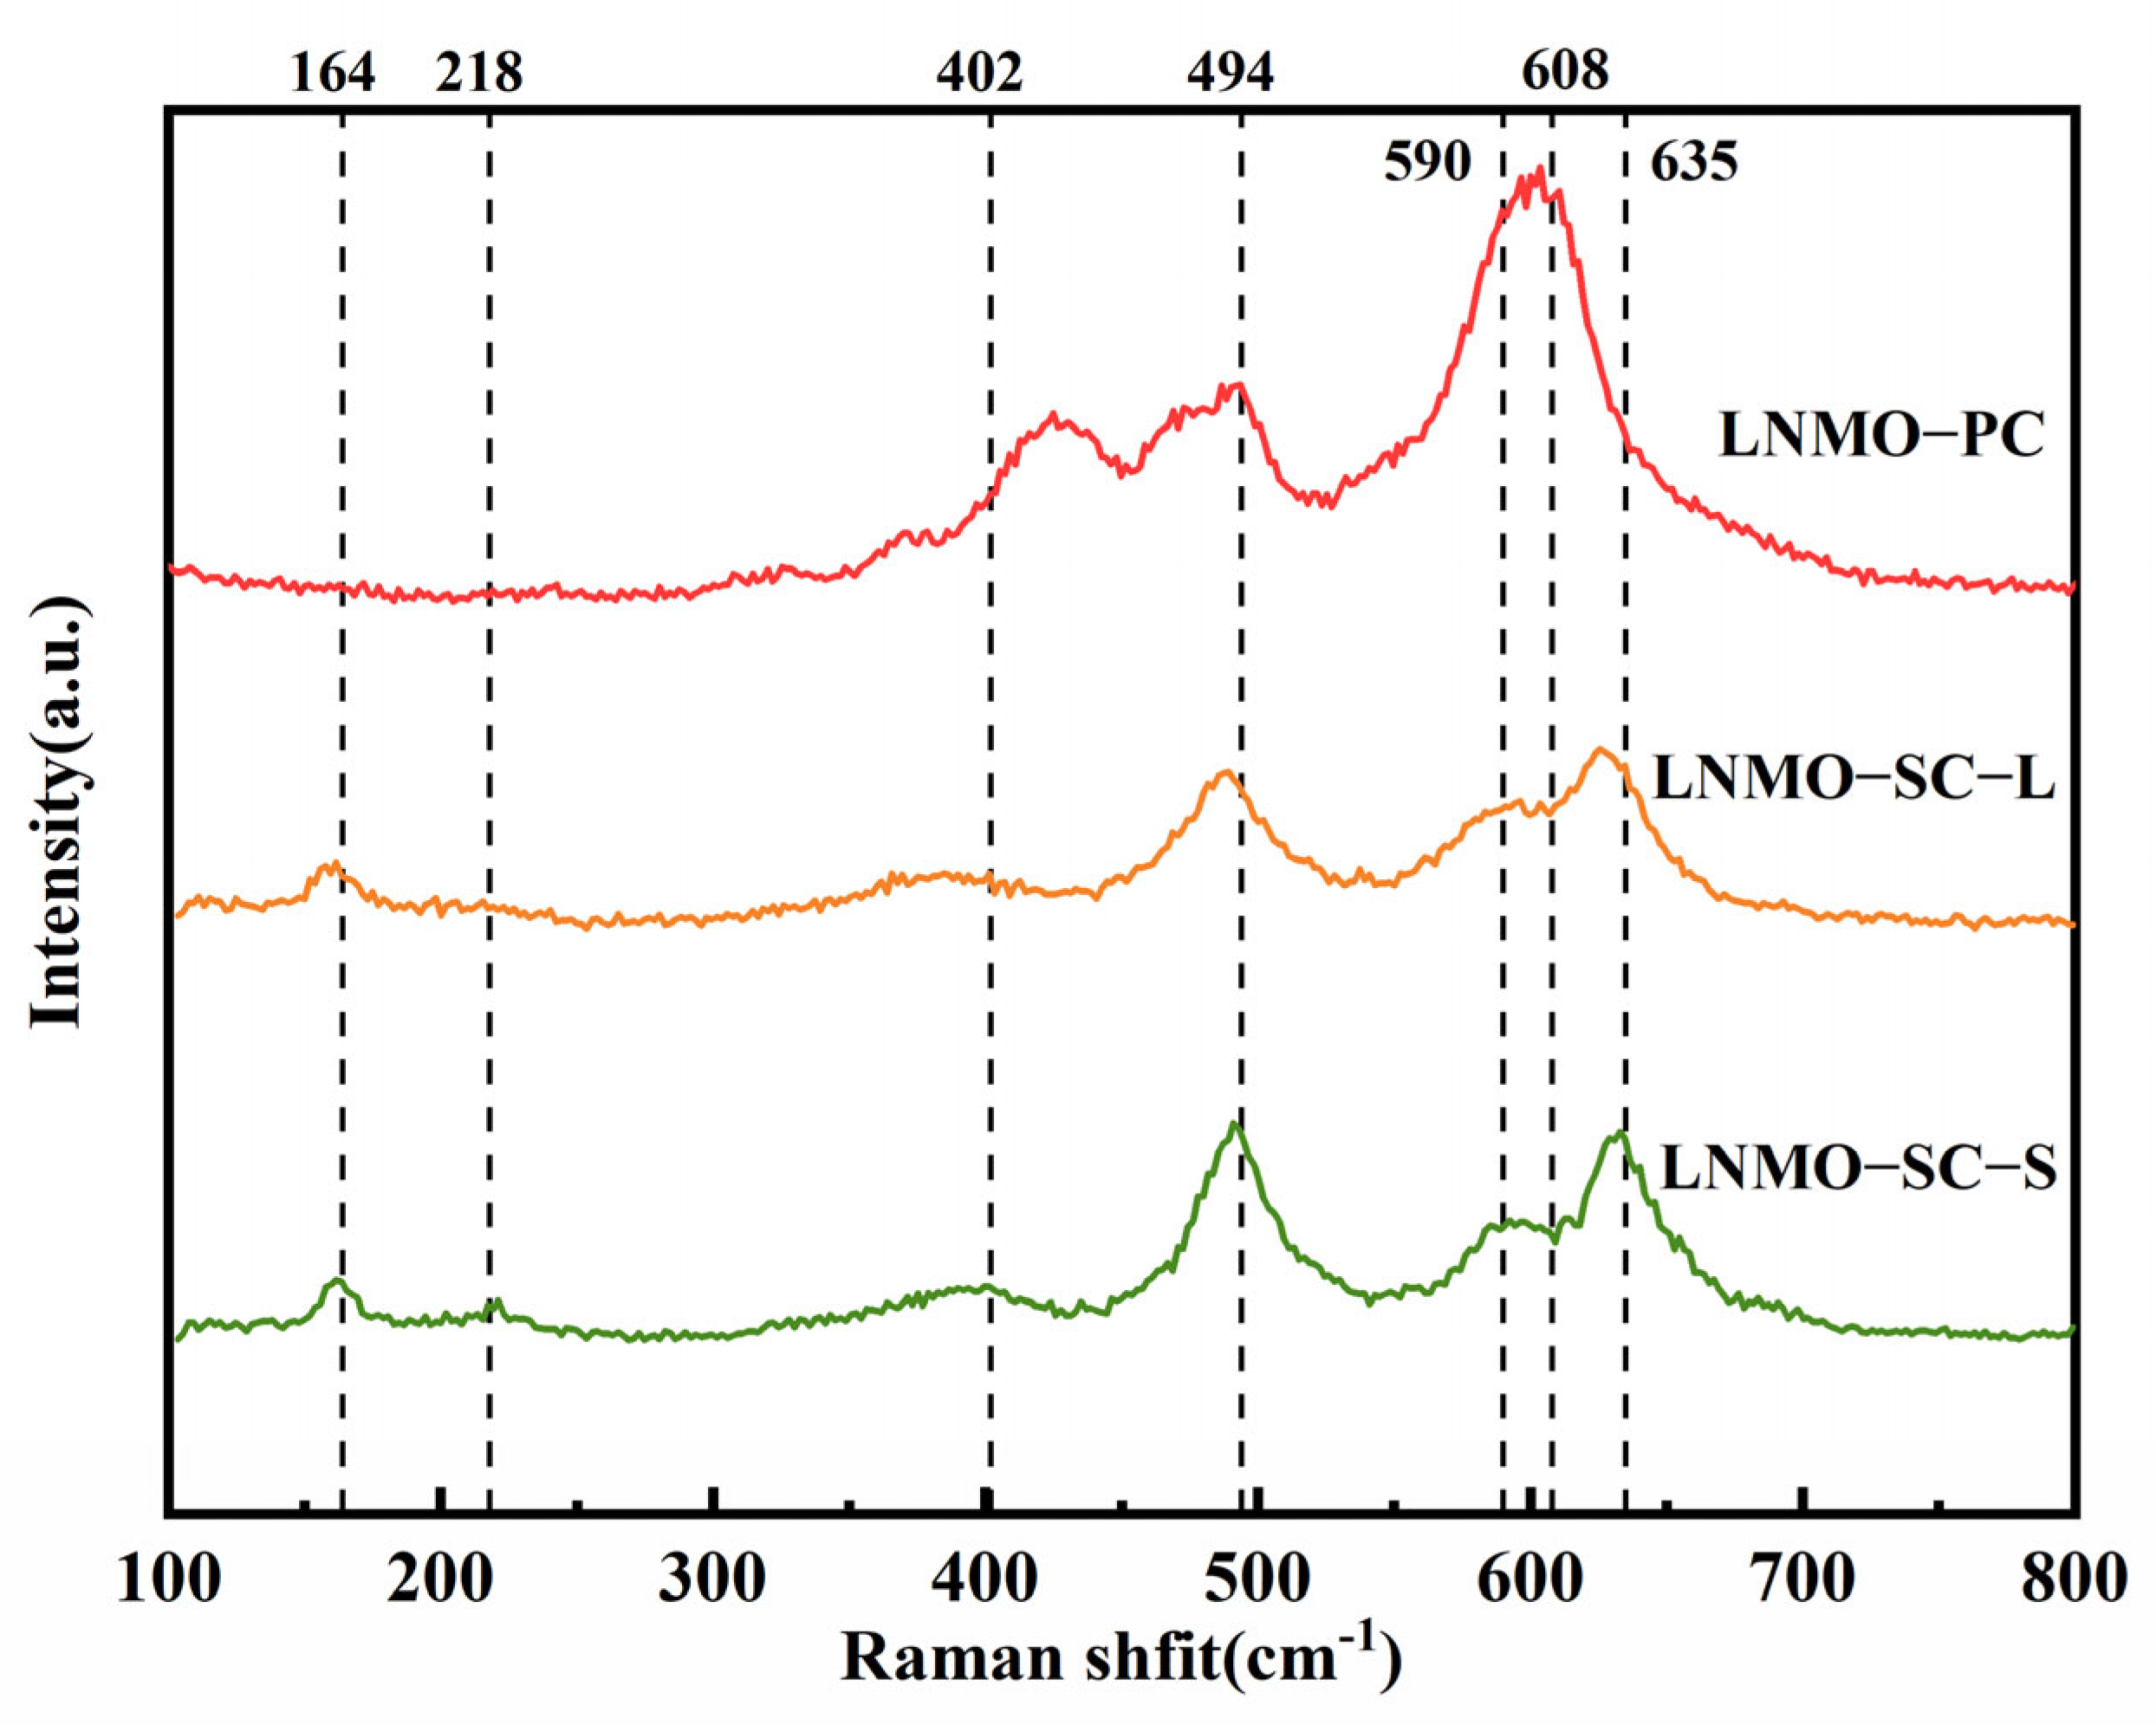
Raman spectroscopy revealed the short-range atomic arrangement and biphasic structural characteristics of LNMO-PC (secondary polycrystalline aggregates), LNMO-SC-L (micron-sized primary particles), and LNMO-SC-S (submicron primary particles) (
Figure 4). The peaks at 494 cm
−1 and 635 cm
−1 correspond to the stretching vibrations of Ni-O bonds and Mn-O bonds in the MnO
6 octahedra, respectively, which are characteristic peaks of the Fd-3m disordered spinel phase, indicating the presence of the Fd-3m space group in all three samples [
27]. The peaks at 164 cm
−1, 218 cm
−1, 402 cm
−1, 590 cm
−1, and 608 cm
−1 correspond to the characteristic vibrational modes of the P4
332 ordered spinel phase [
28]. From the spectrum, LNMO-PC shows almost no characteristic peaks of the P4
332 phase, with the Fd-3m disordered phase being dominant. The intensity of the A
1g peak at 608 cm
−1 is very high and accompanied by an obvious shoulder and peak broadening, reflecting the presence of a large number of oxygen vacancies and rock salt phase impurities in the lattice. The symmetry of the MnO
6 octahedra is disrupted, leading to the appearance of additional vibrational modes that overlap with the A
1g peak, causing an increase in peak intensity, peak broadening, and the appearance of a shoulder. In primary particle LNMO, which is highly ordered and has low defects, the vibrational modes of the MnO
6 octahedra are highly singular, with no additional signals overlapping. As a result, the A
1g peak intensity is lower, but the peak shape is sharp, and it may even be visually undetectable due to its weak signal. Both LNMO-SC-L and LNMO-SC-S clearly show the characteristic peaks of the P4
332 phase at 164 cm
−1, 218 cm
−1, 402 cm
−1, and 590 cm
−1, indicating the presence of significant ordered spinel phases in the primary particles. The P4
332 phase peaks in LNMO-SC-S are sharper and more stable, further confirming that its structure is the most ordered and has the highest crystallinity. The P4
332 phase peaks in LNMO-SC-L are slightly weaker, reflecting a lower degree of order compared to LNMO-SC-S. This result is consistent with the XRD characterization conclusion, clearly demonstrating the structural differences between secondary polycrystalline aggregates and primary particles in terms of bonding dimensions.
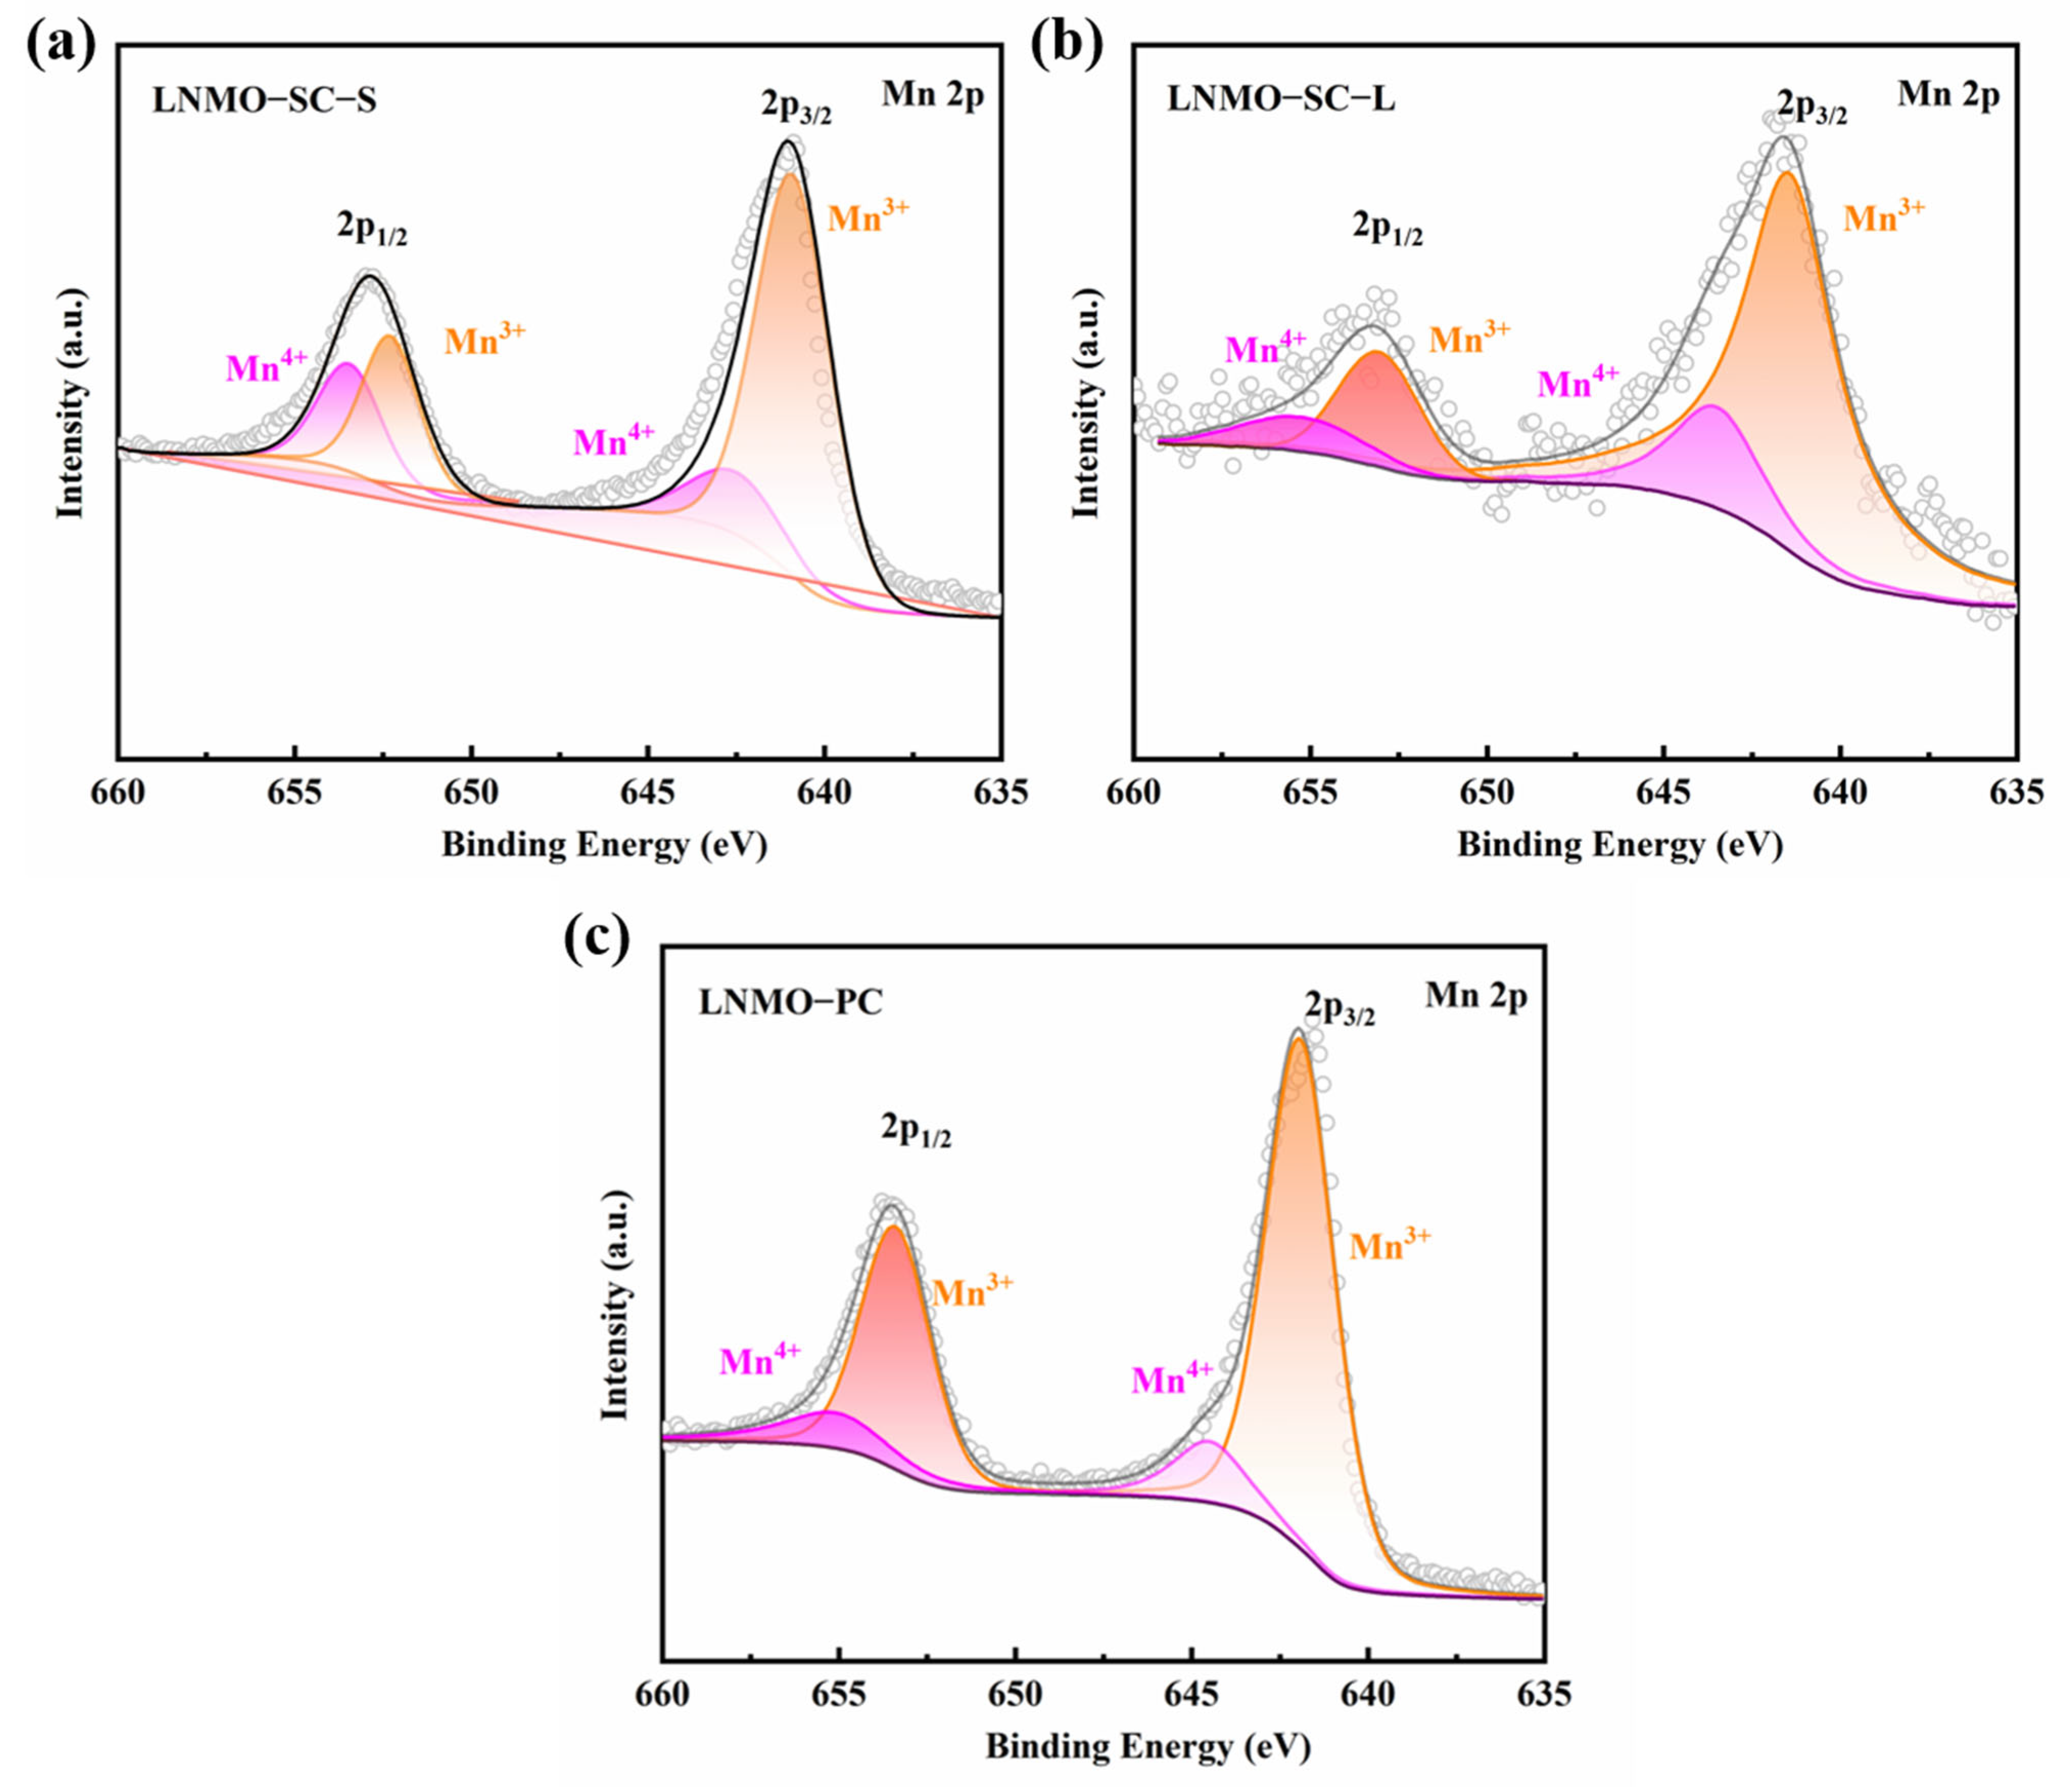
Figure 5 shows the Mn 2p XPS fine spectra of the three LNMO samples. After Gaussian–Lorentzian curve fitting of the Mn 2p
3/
2 and 2p
1/
2 peaks, the relative atomic percentages of Mn
4+ and Mn
3+ are quantitatively determined: LNMO-SC-S contains 28.07% Mn
4+ and 71.93% Mn
3+, LNMO-SC-L contains 24.33% Mn
4+ and 75.67% Mn
3+, and LNMO-PC contains 19.68% Mn
4+ and 80.32% Mn
3+. The proportion of Mn
4+ decreases in the order LNMO-SC-S > LNMO-SC-L > LNMO-PC, whereas Mn
3+ follows the reverse sequence. It is widely recognized that excessive Mn
3+ in LNMO triggers disproportionation reactions, producing soluble Mn
2+ that dissolves into the electrolyte and leads to irreversible capacity loss. Secondary polycrystalline aggregate LNMO-PC is filled with dense grain boundaries, which induce severe Li/Ni cation mixing and abundant oxygen vacancies. These lattice defects drive the transformation of large amounts of Mn
4+ into Mn
3+, leading to the highest Mn
3+ fraction and the most serious Mn dissolution issue. In contrast, primary particles eliminate such defect-induced valence deviation of manganese. The highest Mn
4+ content of LNMO-SC-S stabilizes the spinel lattice and facilitates the formation of a protective CEI film on the particle surface to restrain Mn leaching. Meanwhile, its moderate Mn
3+ derived from mild octahedral Ni/Mn disorder enlarges the lattice channels for Li
+ migration, improving rate performance without aggravating Mn disproportionation. LNMO-SC-L exhibits intermediate Mn
4+ and Mn
3+ contents, so its structural stability and electrochemical performance lie between the other two samples, consistent with all foregoing characterization results.
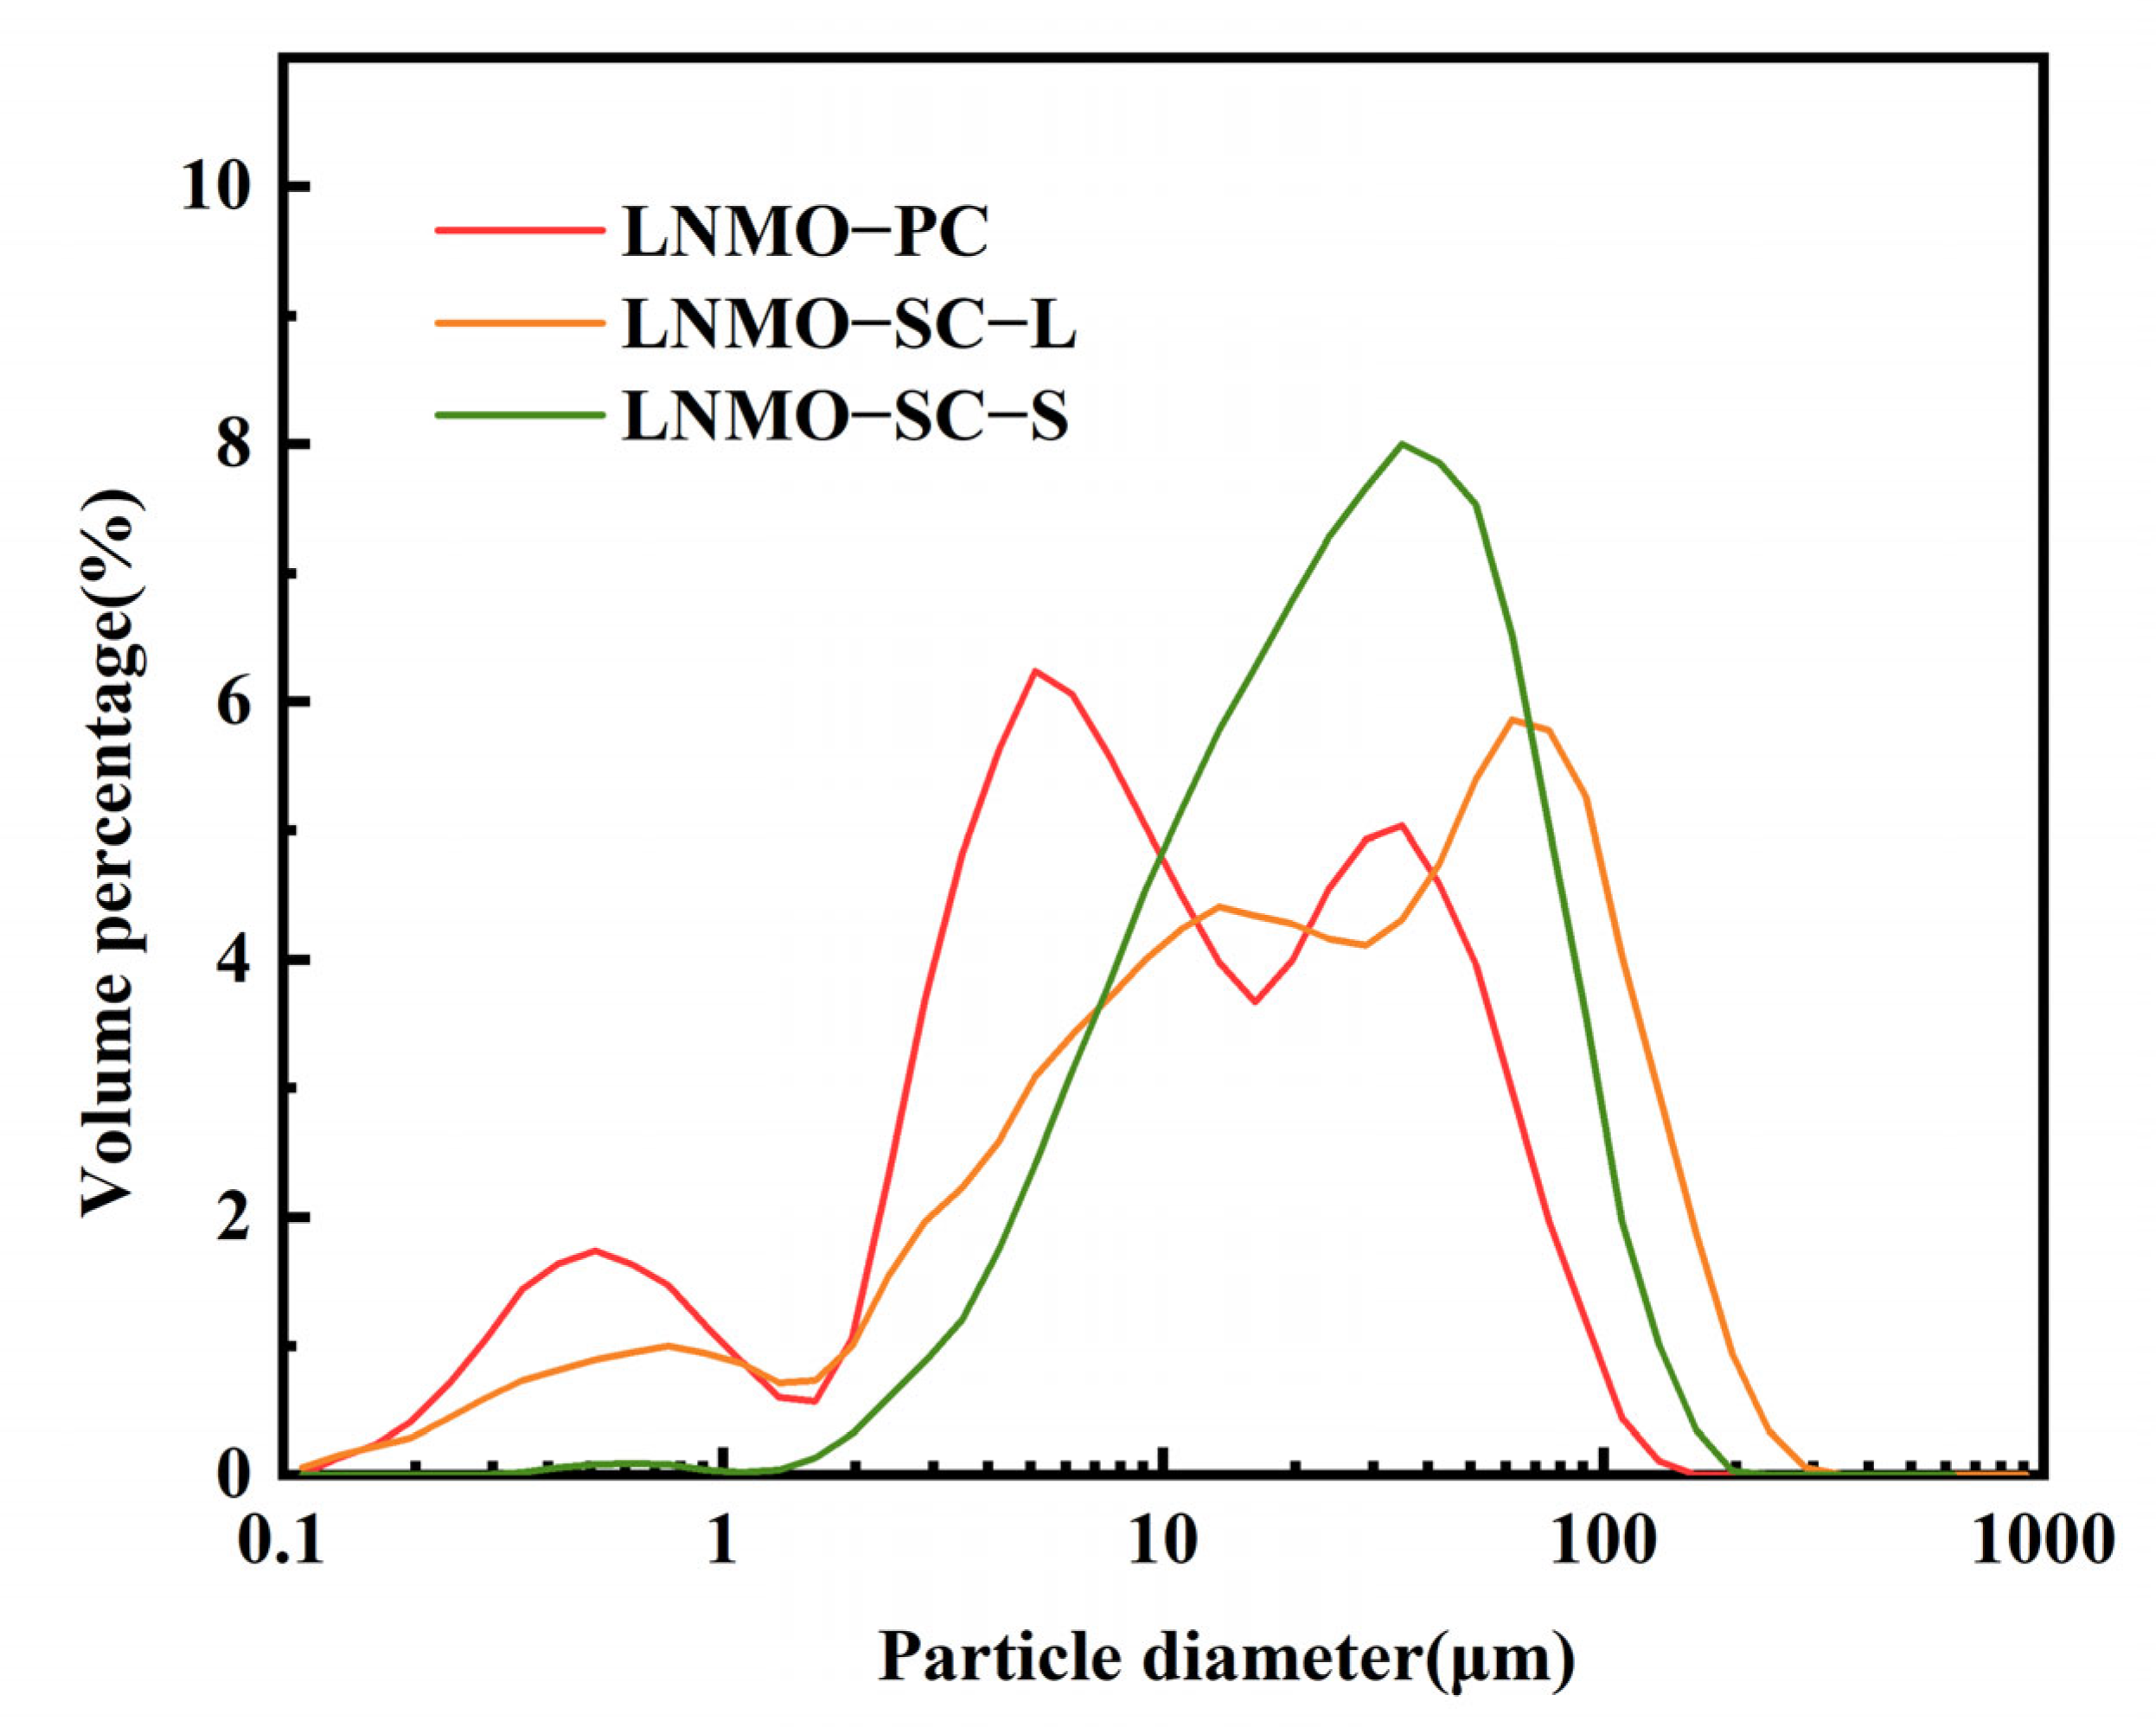
The particle size distribution curves of the three LNMO samples show significant differences (
Figure 6). Horizontal coordinates denote particle diameter, and vertical coordinates represent volume fraction; peak height reflects the proportion of particles at corresponding sizes. Laser scattering measures hydrodynamic agglomerate size in liquid, differing from primary particle morphology observed via SEM. The measured volume median diameters (D50) are 8.547 μm for LNMO-PC, 21.35 μm for LNMO-SC-L, and 25.77 μm for LNMO-SC-S, matching the order of dominant distribution peaks. Only LNMO-SC-S presents a unimodal curve, while LNMO-PC and LNMO-SC-L show multi-modal distributions induced by particle fragmentation and uneven agglomeration. As defined in the Introduction, primary particles LNMO-SC-S and LNMO-SC-L only form weak agglomerates during testing, whereas loosely stacked secondary polycrystalline aggregate LNMO-PC easily breaks into fine submicron grains under ultrasonication. The LNMO-PC sample exhibits a multi-modal distribution with wide size span and low uniformity. Its multiple peaks stem from fragmented microcrystals and incomplete spherical aggregates, dispersing particle volume across a broad range and lowering the main peak height. The broad distribution brings excessive specific surface area, aggravating electrolyte side reactions and interfacial resistance, thus deteriorating cycling and rate performance. The LNMO-SC-L sample has a narrower distribution with faint secondary peaks derived from slight agglomerate separation. Large octahedral crystals guarantee structural integrity yet lengthen Li
+ diffusion paths to slow ion transport. Uneven agglomeration leads to its lower D50 (21.35 μm) and weaker peak intensity relative to LNMO-SC-S. The LNMO-SC-S sample possesses the narrowest, most uniform size distribution with D50 of 25.77 μm and the highest dominant peak. Intact crack-free octahedral crystals resist ultrasonic fragmentation, so agglomerates concentrate within a narrow size range to form a sharp unimodal peak. SEM shows that its discrete primary octahedra are smaller than LNMO-PC spherical aggregates; the lack of fine broken grains increases its hydrodynamic median diameter. This balanced particle size shortens Li
+ diffusion pathways and suppresses side reactions, enabling optimal cycling stability and rate capability.
Based on the ICP-OES mass concentration results above, the molar ratios of Li, Ni, and Mn were further calculated. The actual Li/Ni/Mn molar ratios are listed as follows: LNMO-SC-S (1:0.502:1.503), LNMO-SC-L (1:0.508:1.526), and LNMO-PC (1:0.505:1.514). All three samples exhibit negligible deviations from the ideal stoichiometric ratio 1:0.5:1.5 of LiNi
0.5Mn
1.5O
4. The complete ICP mass concentration data and calculated molar stoichiometry are summarized in
Table 3. It can be clearly seen that the mass contents of Ni and Mn among the three samples show only tiny fluctuations, and their actual molar ratios are all close to the theoretical stoichiometric ratio Ni/Mn = 1:3. Meanwhile, the lithium content of each sample only presents slight deviation without obvious divergence. Overall, the elemental stoichiometric deviation of Li, Ni, and Mn in all three materials is negligible. This result eliminates inconsistent elemental proportion as a variable responsible for the distinctions in crystal structure and electrochemical performance of the samples.
3.2. Electrochemical Performance
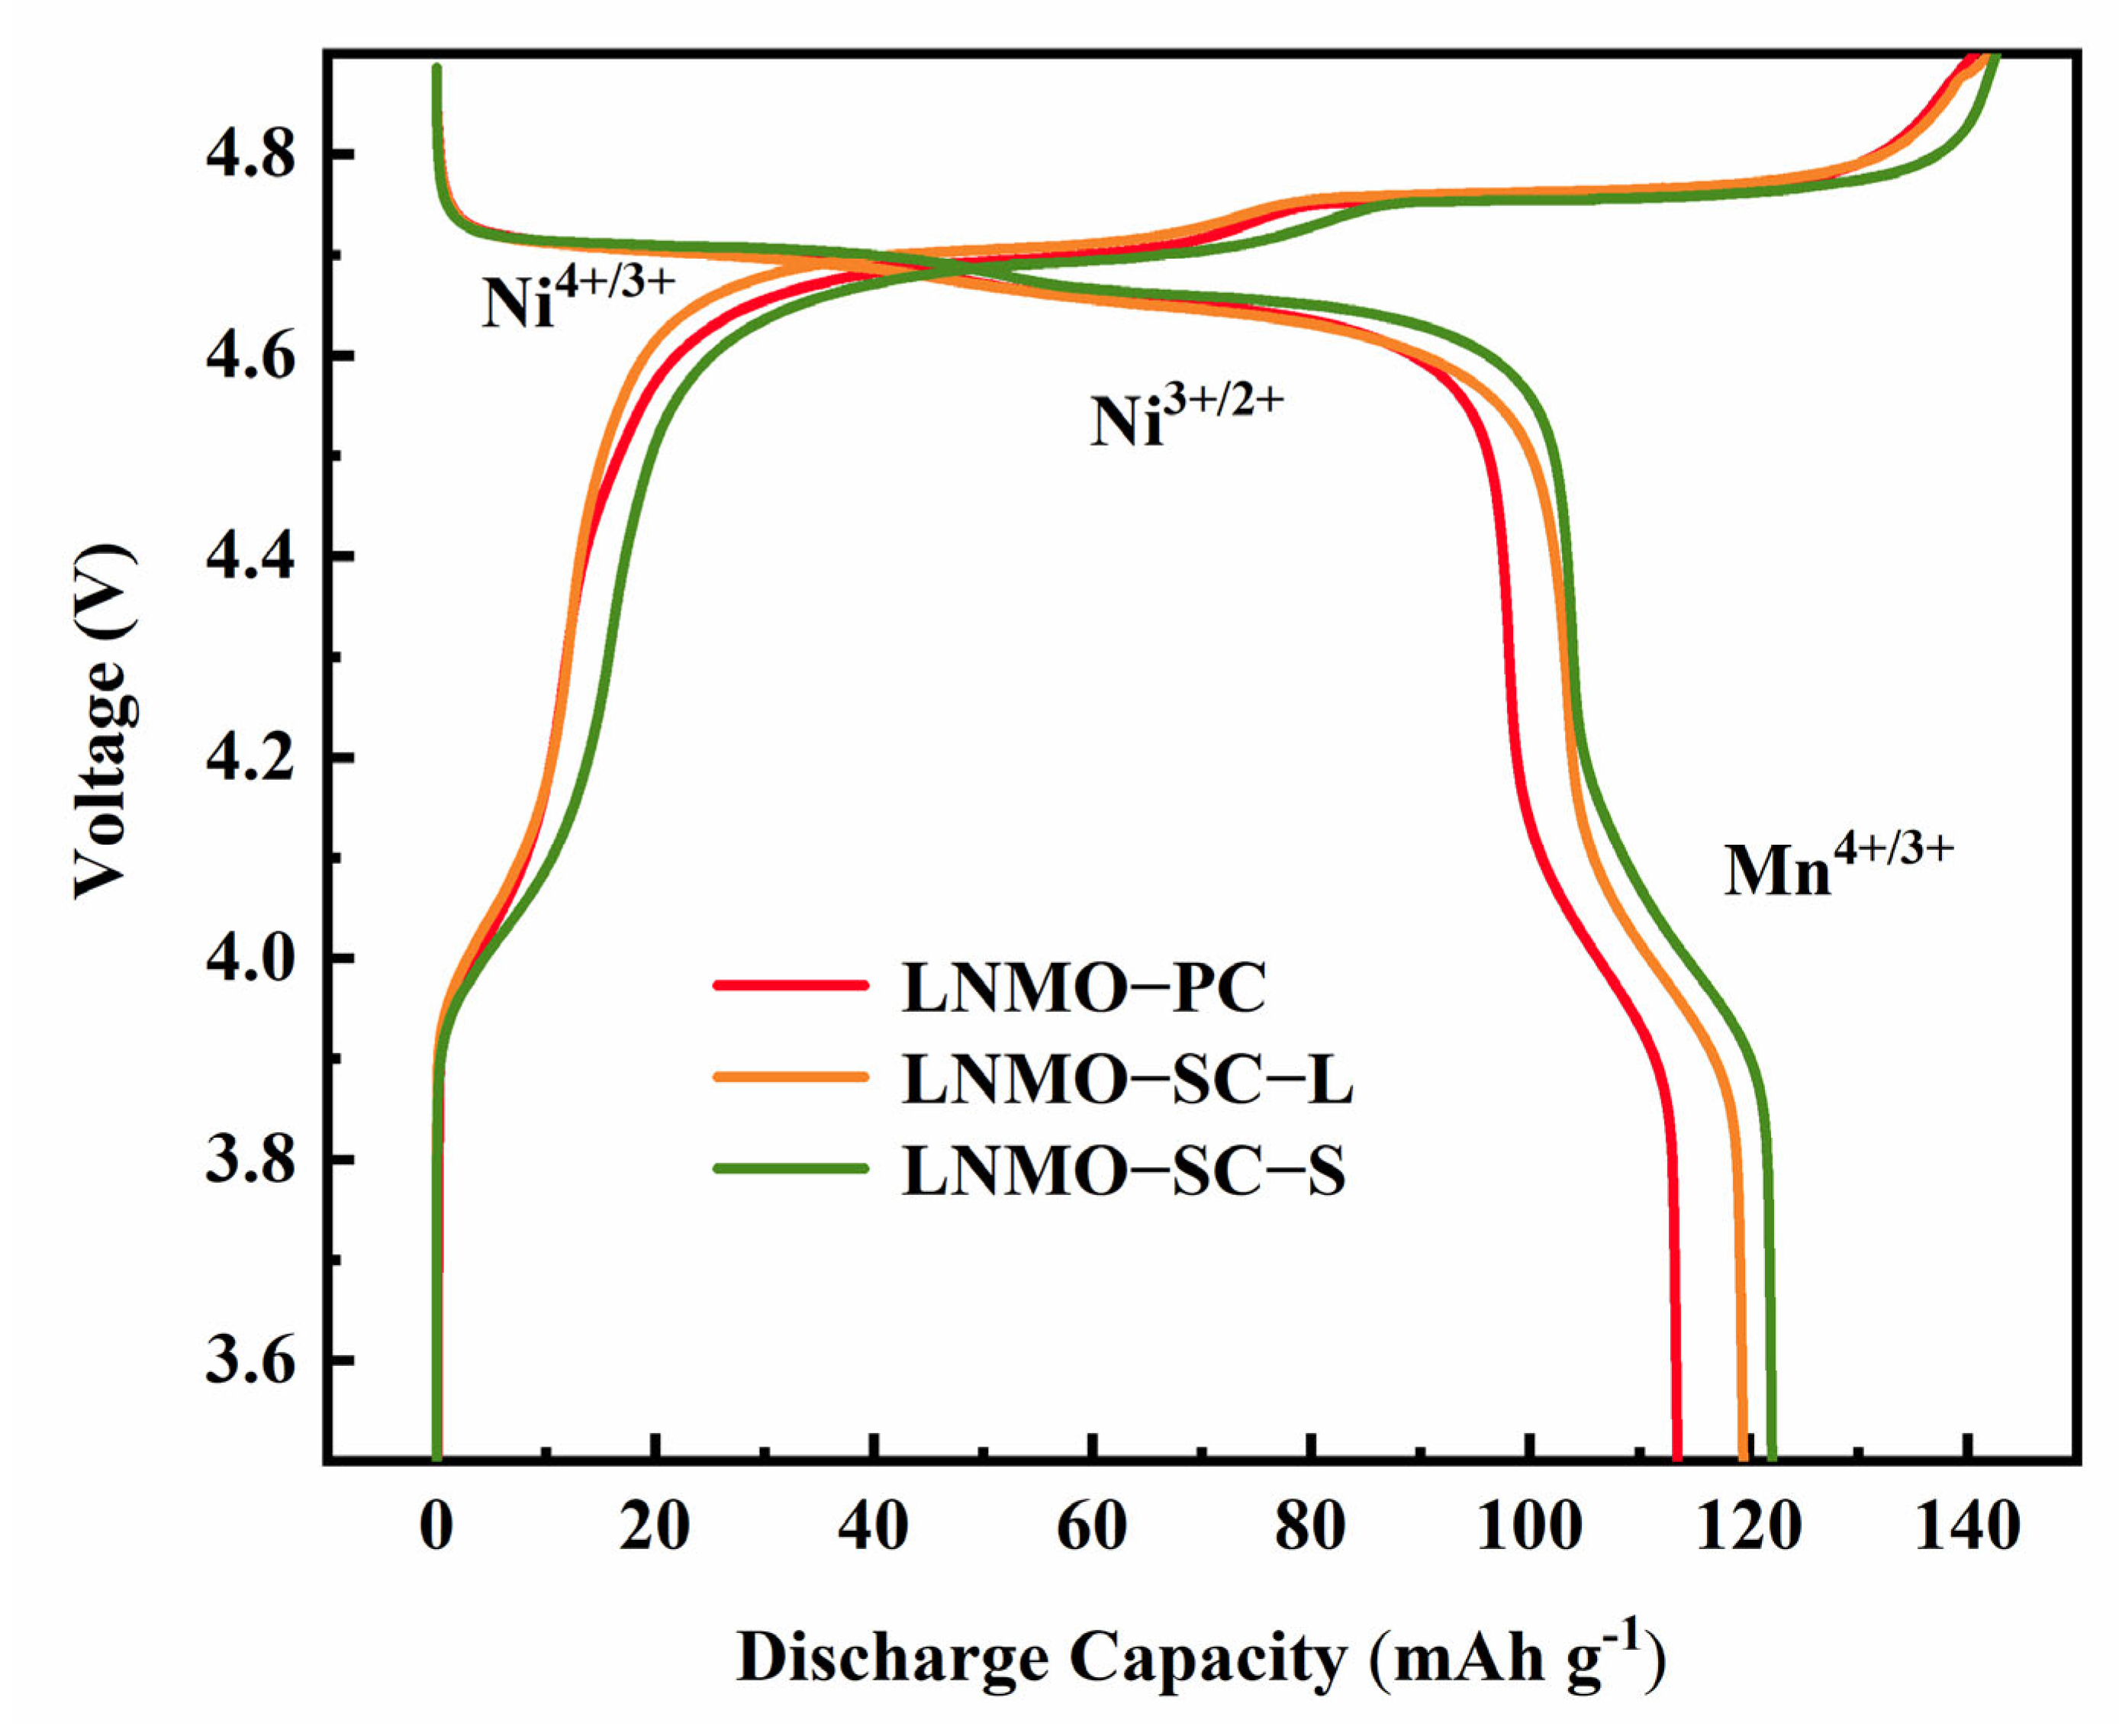
Figure 7 shows the first-cycle discharge curves of the three LNMO samples. The inflection points at approximately 4.7 V and 4.0 V correspond to the Ni
3+/Ni
4+, Ni
2+/Ni
3+, and Mn
3+/Mn
4+ redox couples, respectively [
29], indicating that all three samples have the spinel-type LNMO structure with the Fd-3m space group. Regarding discharge capacity, LNMO-SC-S has the highest discharge capacity (approximately 122.14 mAh g
−1) and the most stable voltage plateau. LNMO-SC-L has the second-highest capacity (approximately 119.50 mAh g
−1), while LNMO-PC has the lowest capacity (approximately 113.48 mAh g
−1), and the voltage drops more rapidly in the high-capacity region, indicating more irreversible capacity loss during the first cycle. When analyzing the first-cycle charge/discharge efficiency, the submicron primary particle (single-crystal morphology) LNMO-SC-S has the highest efficiency at 85.62%, suggesting it has the most reversible Li
+, which is closely related to its small particle size, high crystallinity, and good dispersion achieved through the sol–gel method. These features effectively shorten the Li
+ diffusion path and enhance electron transport efficiency. The submicron primary particle LNMO-SC-L limits Li
+ diffusion, resulting in slightly lower performance, with a first-cycle efficiency of 84.12%. The secondary polycrystalline aggregate LNMO-PC has the lowest efficiency at 80.69% due to the higher grain boundary resistance, which reduces reversibility and capacity. In conclusion, reducing particle size and optimizing crystallinity are effective ways to improve the first-cycle charge/discharge efficiency of LNMO [
30].
The long pseudo-plateau centered at approximately 4.7 V mainly corresponds to the two-electron redox process of Ni2+/Ni4+. As pointed out by previous crystallographic investigations on spinel LiNi0.5Mn1.5O4, this extended flat potential region is intrinsically associated with the coexistence of two crystalline phases with different lattice parameters during Li+ deintercalation rather than only originating from the single Ni redox pair. During high-voltage lithium extraction, continuous oxidation of Ni2+ to Ni4+ triggers lattice shrinkage, forming Li-rich and Li-poor spinel domains with distinct unit cell dimensions that coexist over a wide potential window; this biphasic equilibrium maintains a stable voltage and generates the prominent 4.7 V pseudo-plateau, accompanied by obvious spinel lattice rearrangement. The conversion from Ni2+ to Ni4+ breaks the electrostatic equilibrium of the MnO6 octahedral framework, causing subtle unit cell fluctuation and local rearrangement of Li and transition metal ions at tetrahedral and octahedral sites; such synchronous structural distortion, cation rearrangement and biphasic coexistence jointly generate the prominent pseudo-plateau near 4.7 V. The minor short plateau at ~4.0 V belongs to the weak Mn3+/Mn4+ redox pair and exerts little influence on the main lattice evolution and biphasic transition behavior.
Combined with the Rietveld refinement results, the structural reversibility of this high-voltage biphasic transition differs distinctly among three samples. LNMO-SC-S shows the highest I311/I400 value and negligible rock-salt impurities, indicating highly ordered occupation of Li tetrahedral sites and primary particles with sparse internal grain boundaries. This well-ordered, low-defect lattice effectively suppresses irreversible lattice mismatch and strain during the Li-rich/Li-poor biphasic transformation upon Ni redox, endowing the 4.7 V pseudo-plateau with excellent structural reversibility and stable biphasic cycling behavior. By contrast, LNMO-PC possesses abundant internal grain boundaries and severe Li/Ni tetrahedral mixing, as reflected by its lowest I311/I400 ratio and the largest amount of rock-salt secondary phase. These dense structural defects amplify lattice parameter mismatch between the two coexisting phases during repeated delithiation/lithiation cycles, readily accumulating irreversible lattice strain during the high-voltage biphasic structural transformation, which severely impairs the reversibility of the 4.7 V redox pseudo-plateau and accelerates capacity decay.
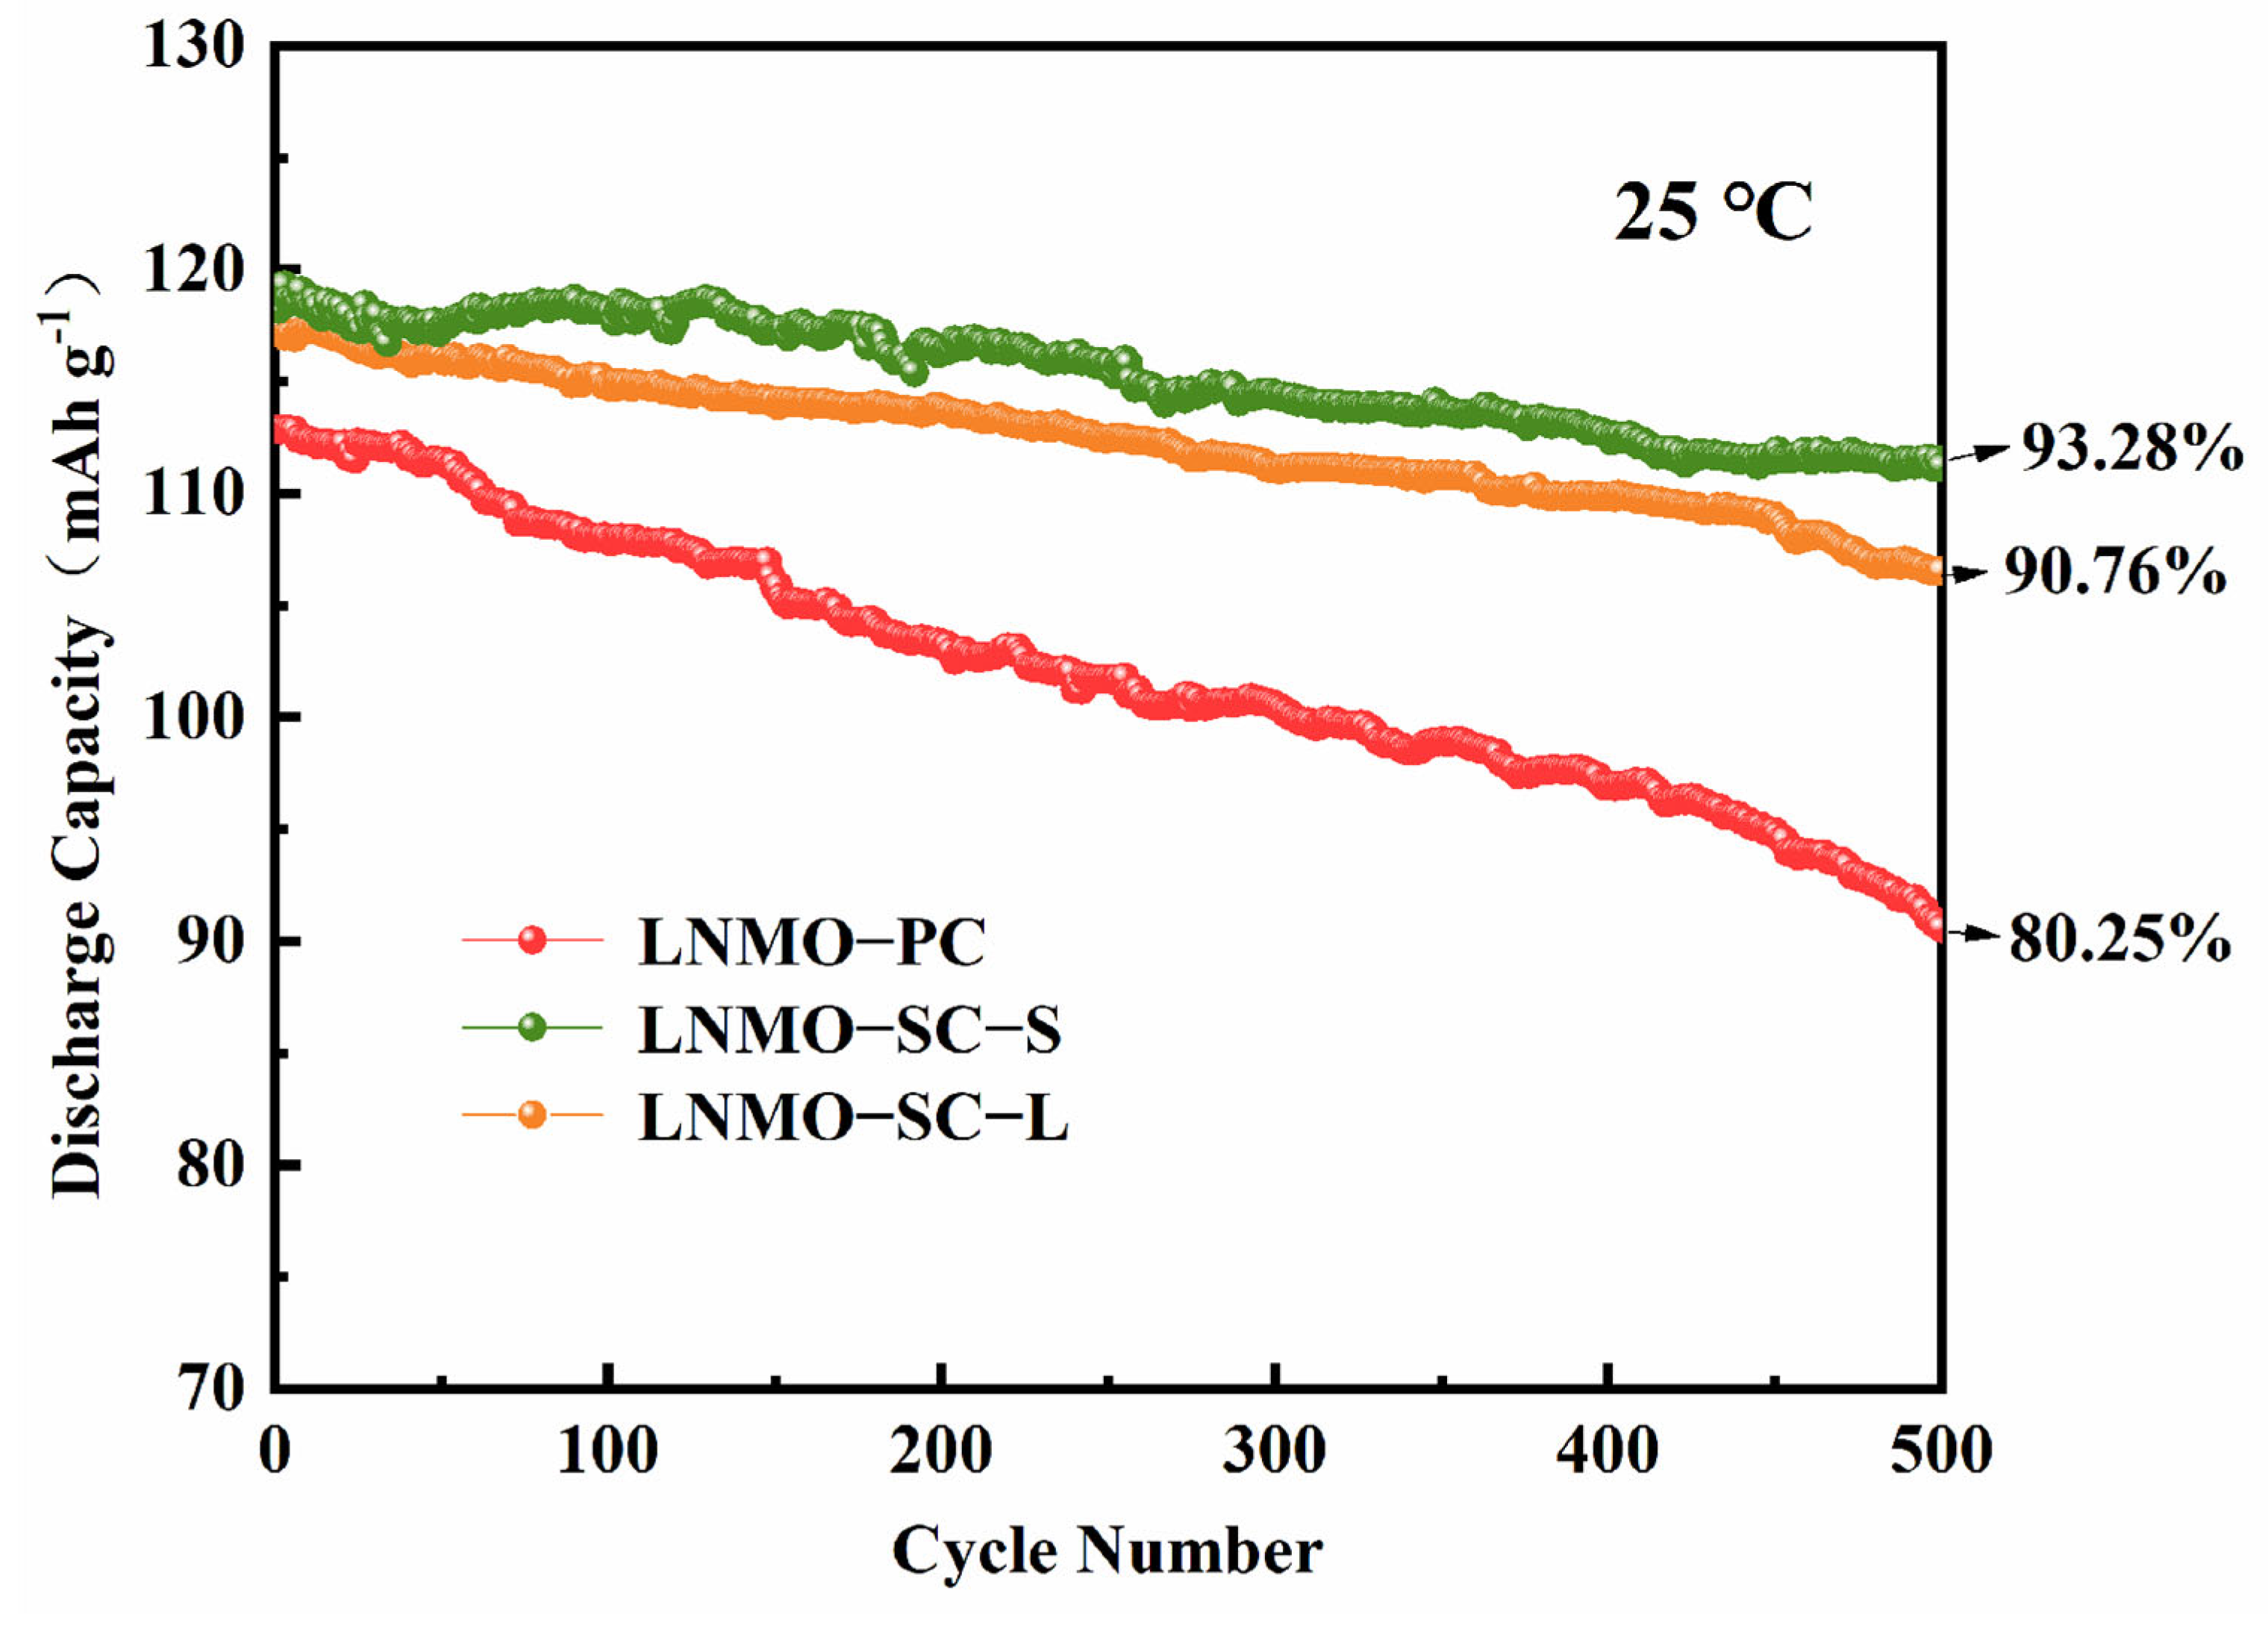
Figure 8 shows the long-cycle performance curves of secondary polycrystalline aggregate LNMO-PC prepared by the co-precipitation method, micron-sized primary particle LNMO-SC-L prepared by the molten salt method, and submicron primary particle LNMO-SC-S prepared by the sol–gel method at a 1 C rate and 25 °C. After 500 cycles, the capacity retention rates of the three samples were 80.25%, 90.76%, and 93.28%, corresponding to discharge capacities of approximately 90.58 mAh g
−1, 106.51 mAh g
−1, and 111.19 mAh g
−1, respectively. Among them, the submicron primary particle LNMO-SC-S exhibited the highest capacity retention and the most gradual capacity decay during cycling, which is closely related to the small particle size, high crystallinity, and good dispersion achieved through the sol–gel method. These factors effectively shorten the Li
+ diffusion path [
1], alleviate structural stress during cycling, and suppress grain boundary cracking and phase separation, significantly enhancing cycling stability. Although the micron-sized primary particle LNMO-SC-L exhibited relatively good structural stability, its larger particle size somewhat limited Li
+ diffusion efficiency, and internal stress was more likely to accumulate during long cycles, leading to a slightly lower capacity retention compared to the submicron primary particles. The secondary polycrystalline aggregate LNMO-PC, due to the presence of many grain boundaries, is prone to micro-crack propagation and structural fragmentation at the grain boundaries during repeated lithium intercalation/deintercalation, leading to loss of contact between the active material and the conductive network, resulting in rapid capacity decay.
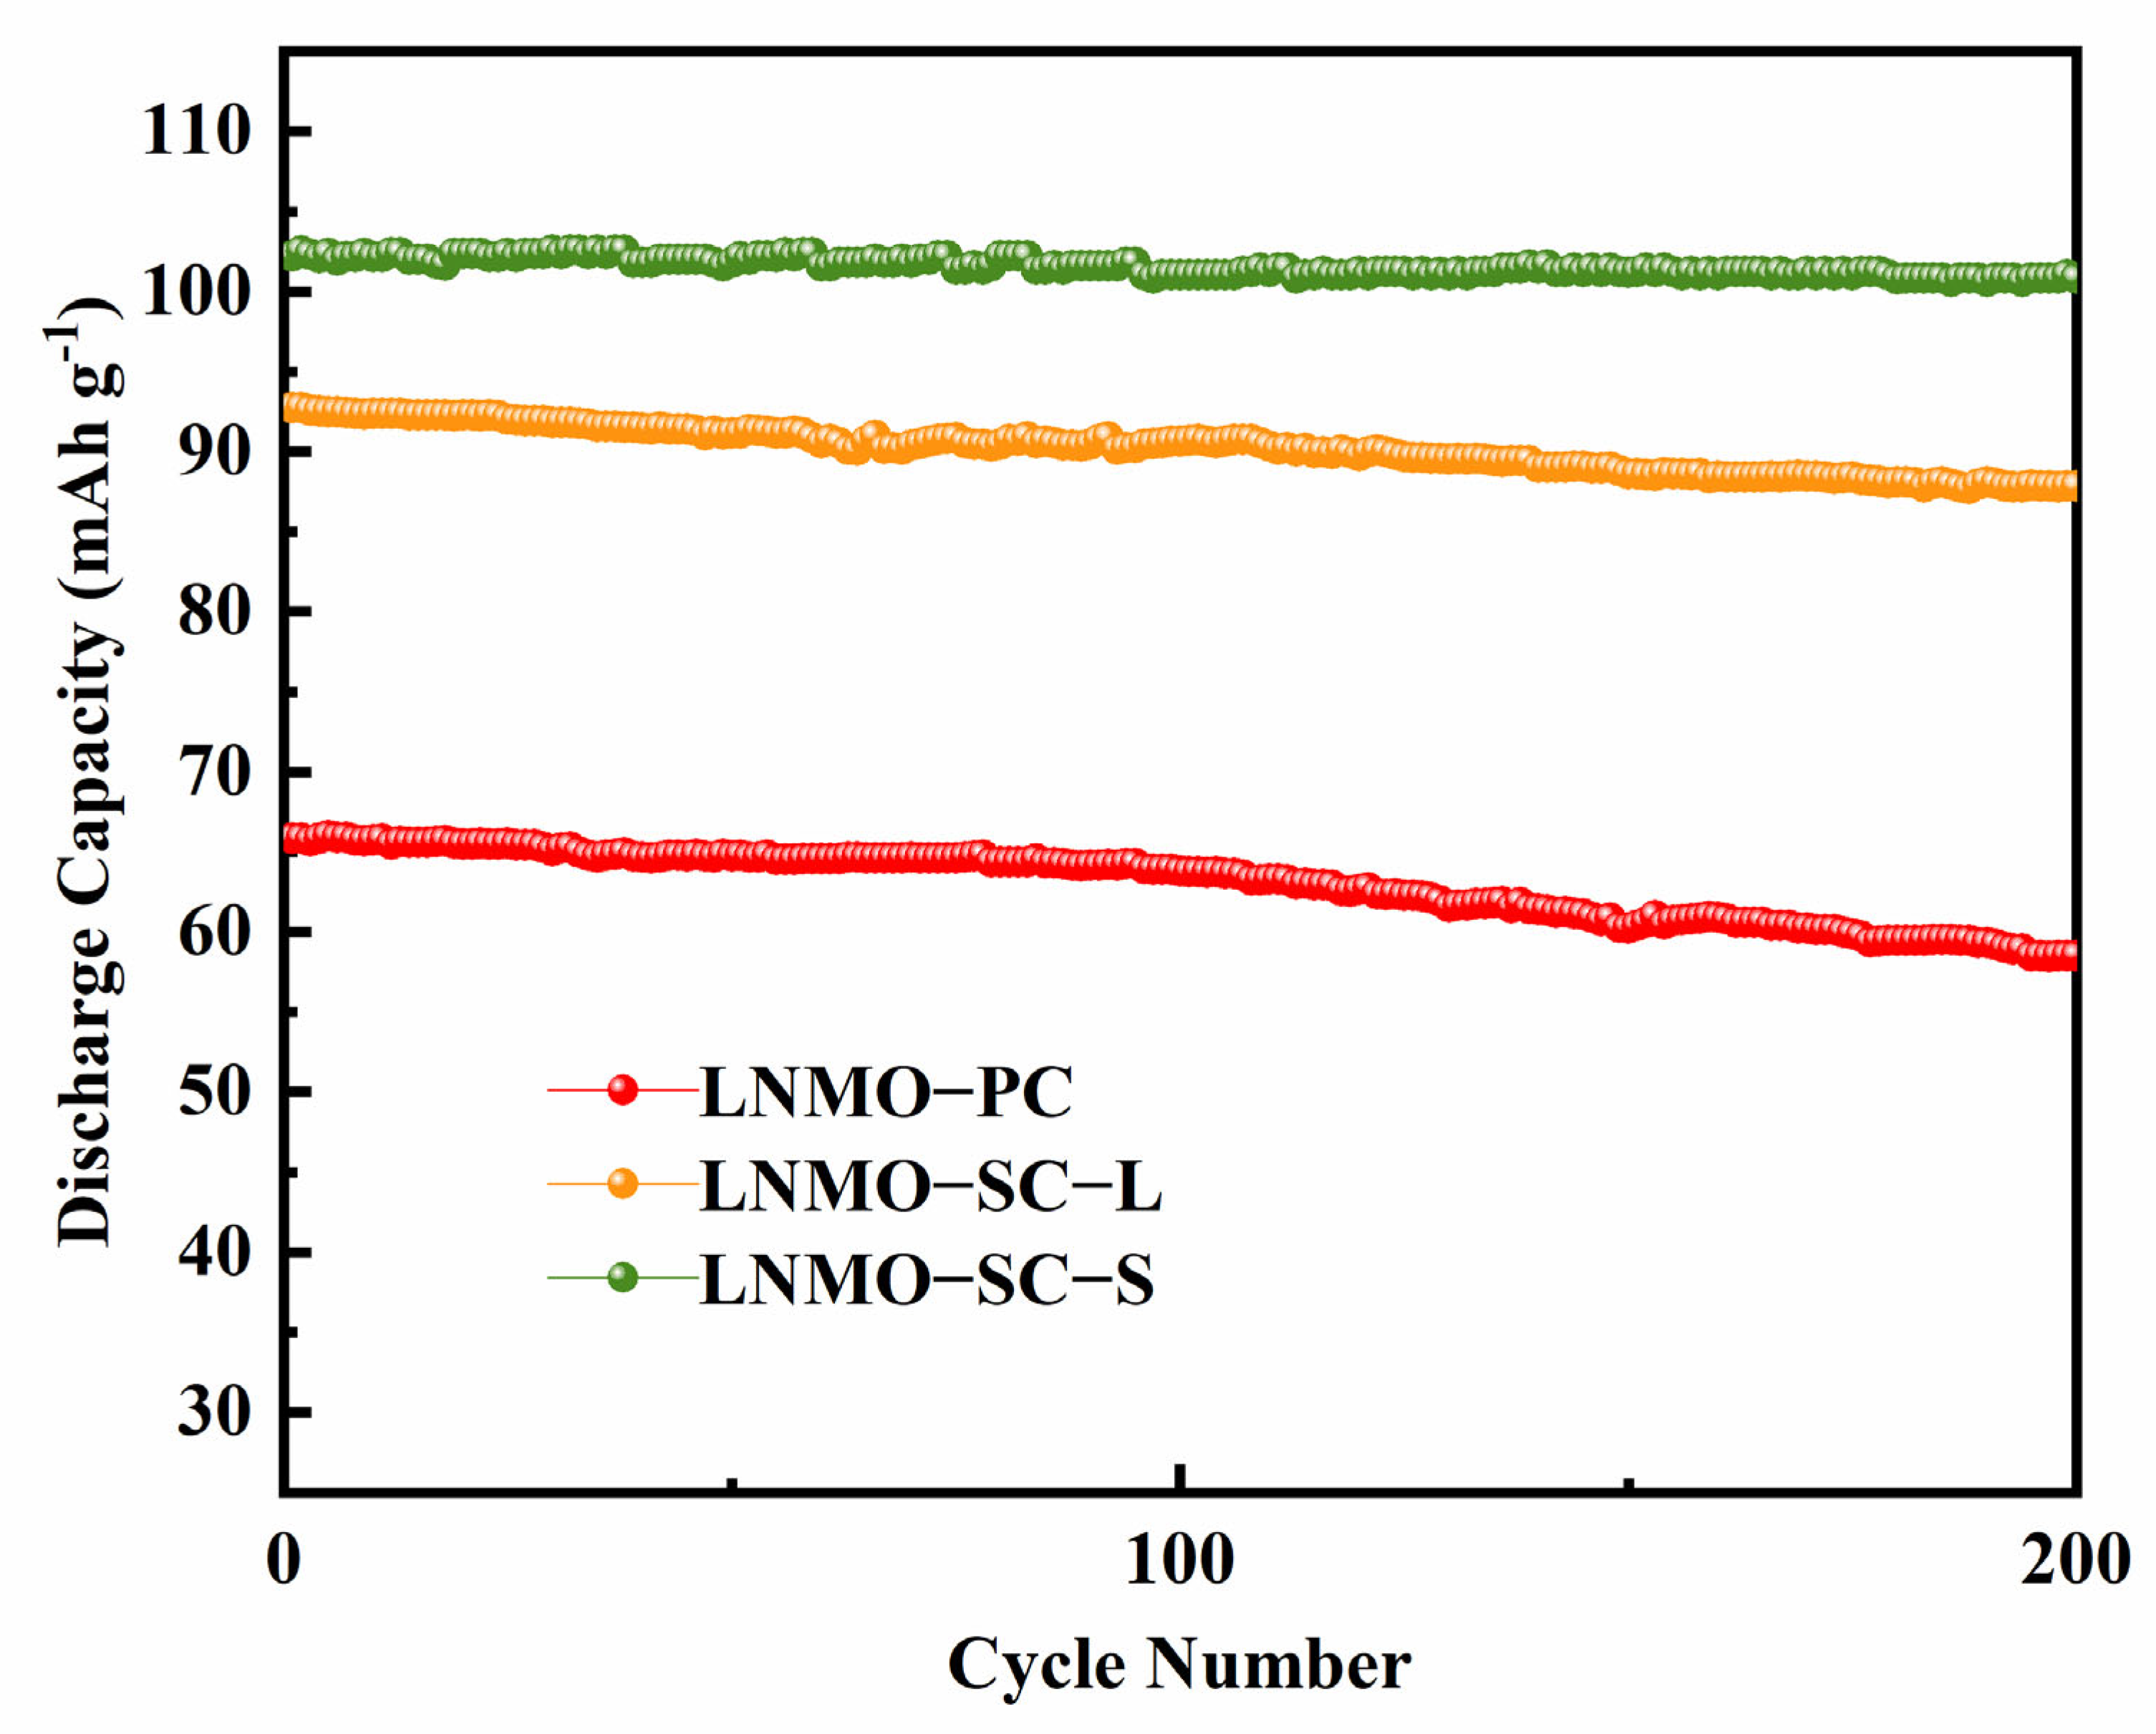
Figure 9 shows the cycling performance curves of three LNMO samples—LNMO-PC, LNMO-SC-L, and LNMO-SC-S—at a 5 C rate and 25 °C. As shown in the figure, there are significant differences in the discharge capacity and cycling stability of the three samples at high rates: LNMO-SC-S exhibits the best high-rate performance, with an initial discharge capacity of approximately 102 mAh g
−1, and after 200 cycles, its capacity remains stable with almost no noticeable decay. LNMO-SC-L has an initial discharge capacity of about 92 mAh g
−1, with a slight decrease in capacity during cycling, but the capacity generally stays around 90 mAh g
−1. In contrast, LNMO-PC has an initial discharge capacity of only about 65 mAh g
−1, and its capacity continuously declines as cycling progresses, dropping to about 58 mAh g
−1 after 200 cycles, exhibiting the worst high-rate performance. The submicron primary particle (single-crystal morphology) LNMO-SC-S benefits from the small particle size, high crystallinity, and good dispersion achieved by the sol–gel method, which effectively shortens the Li
+ diffusion path and enhances electron transport efficiency. As a result, it can still complete the lithium intercalation/deintercalation process quickly at a 5 C high rate, while alleviating structural stress and suppressing capacity decay, showing the best high-rate cycling performance. The micron-sized primary particle (single-crystal morphology) LNMO-SC-L maintains structural integrity, but its larger particle size somewhat limits the Li
+ diffusion rate, leading to slightly lower initial capacity at high rates compared to the submicron primary particles. However, its structure still effectively suppresses grain boundary cracking, maintaining good cycling stability. The secondary polycrystalline aggregate LNMO-PC, due to the presence of many grain boundaries, faces significantly increased Li
+ diffusion resistance at high rates, leading to a lower initial capacity. Additionally, during repeated lithium intercalation/deintercalation, micro-cracks tend to form at the grain boundaries, accelerating structural fragmentation and capacity decay, resulting in the worst high-rate cycling performance.
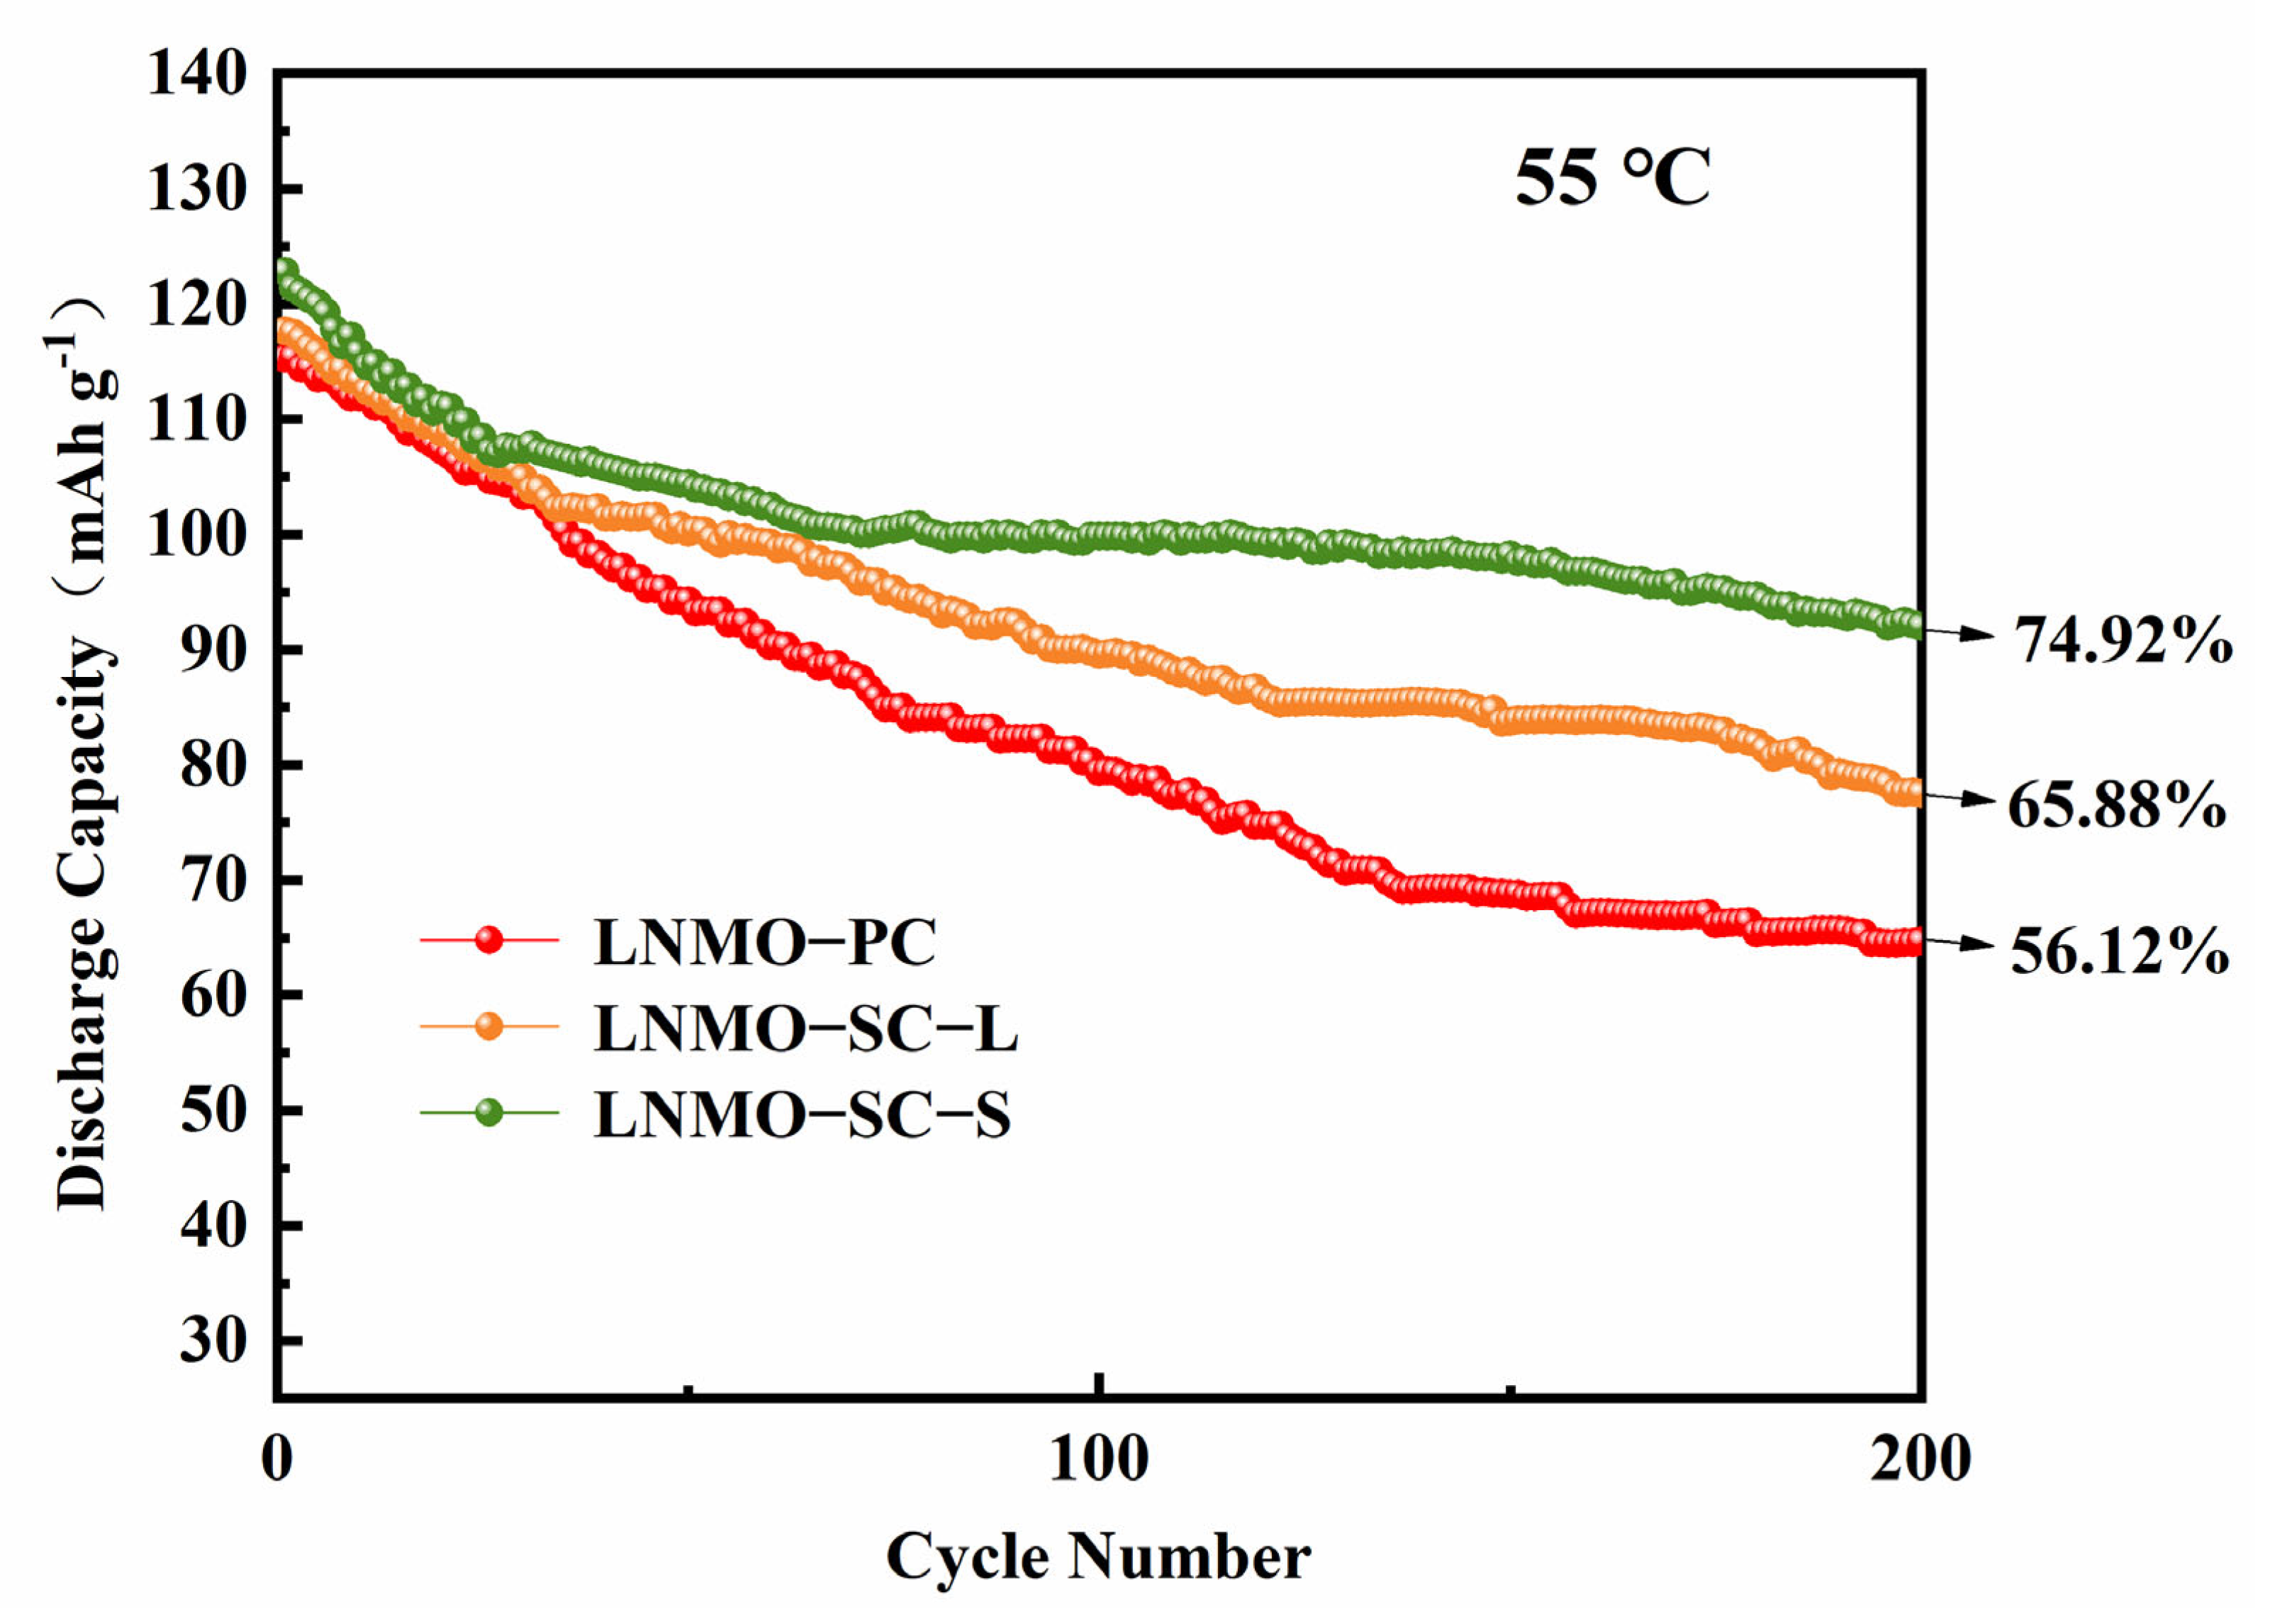
Figure 10 shows the cycling performance curves of three LNMO samples—LNMO-PC, LNMO-SC-L, and LNMO-SC-S—at a 1 C rate and 55 °C. After 200 cycles, the capacity retention rates of the three samples were 56.12%, 65.88%, and 74.92%, respectively, showing significant differences in high-temperature stability. Among them, the submicron primary particle LNMO-SC-S had the highest capacity retention and the best high-temperature cycling stability. The small particle size and high crystallinity of LNMO, prepared by the sol–gel method, significantly alleviate structural stress at high temperatures and suppress Mn
3+ disproportionation and Mn
2+ dissolution, thereby delaying material degradation and capacity fading. The micron-sized primary particle LNMO-SC-L is more likely to accumulate internal stress at high temperatures, resulting in a slightly lower capacity retention than the submicron primary particles. On the other hand, the secondary polycrystalline aggregate LNMO-PC, due to the presence of many grain boundaries, is more susceptible to micro-crack propagation and structural fragmentation at the grain boundaries under the combined effects of high temperature and repeated lithium intercalation/deintercalation. This accelerates Mn dissolution and electrolyte decomposition, leading to the deactivation of active materials, rapid capacity fading, and the poorest high-temperature stability.
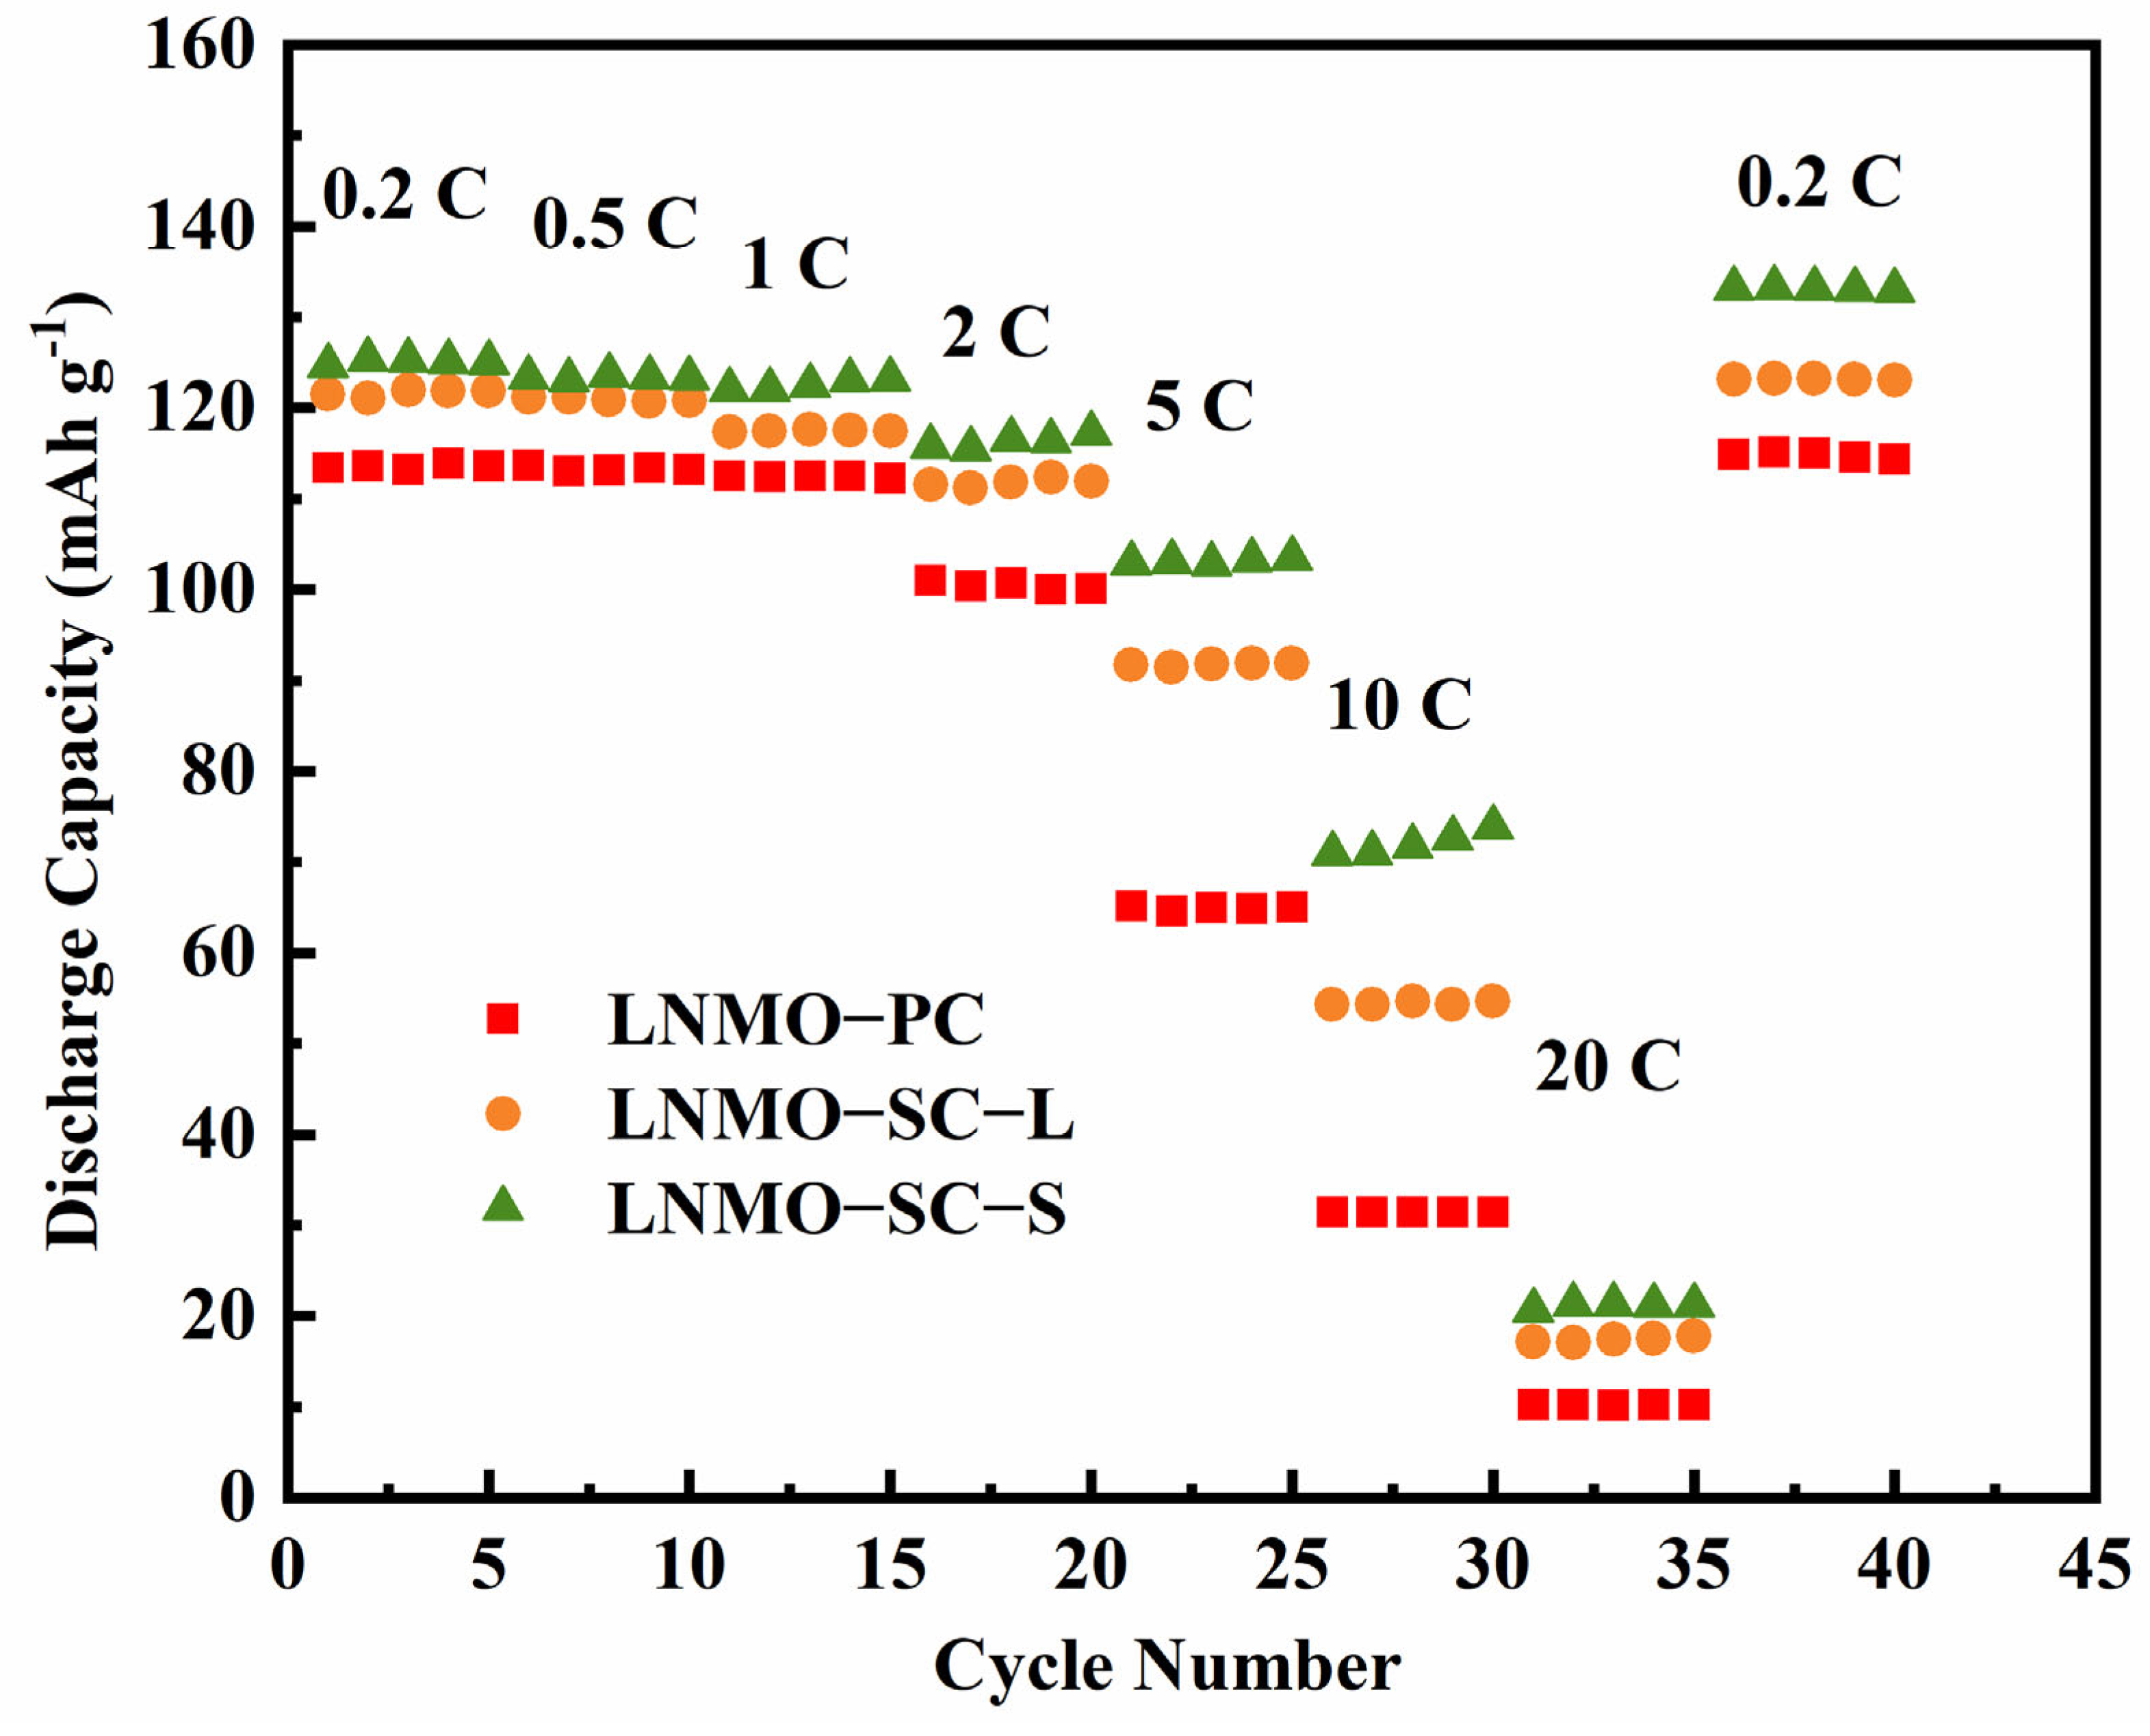
As seen in
Figure 11, there are significant differences in the discharge capacity and rate tolerance of the three samples at different rates. LNMO-SC-S exhibits the highest discharge capacity at all test rates and the most gradual capacity decay. At 0.2 C, the capacity is approximately 130 mAh g
−1, and at 20 C, it still maintains about 20 mAh g
−1, demonstrating the best high-rate performance. LNMO-SC-L shows intermediate rate performance, with capacity slightly lower than LNMO-SC-S at all rates; at 20 C, the capacity is about 15 mAh g
−1. LNMO-PC exhibits the poorest rate performance, with the capacity at all rates being the lowest among the three samples, and capacity decay is particularly severe at high rates (≥10 C), with the capacity dropping to about 10 mAh g
−1 at 20 C. This performance difference can be attributed to the structural characteristics brought about by different morphologies and preparation methods: the submicron primary particle LNMO-SC-S, with its small particle size achieved through the sol–gel method, enhances electron transport efficiency, enabling it to rapidly complete the lithium intercalation/deintercalation process at high rates and thus exhibiting the best rate performance. The micron-sized primary particle LNMO-SC-L somewhat limits the Li
+ diffusion rate, resulting in slightly lower capacity at high rates compared to the submicron primary particles. The secondary polycrystalline aggregate LNMO-PC, due to the presence of many grain boundaries, faces significantly increased Li
+ diffusion resistance at high rates, leading to rapid capacity decay and thus the worst rate performance.
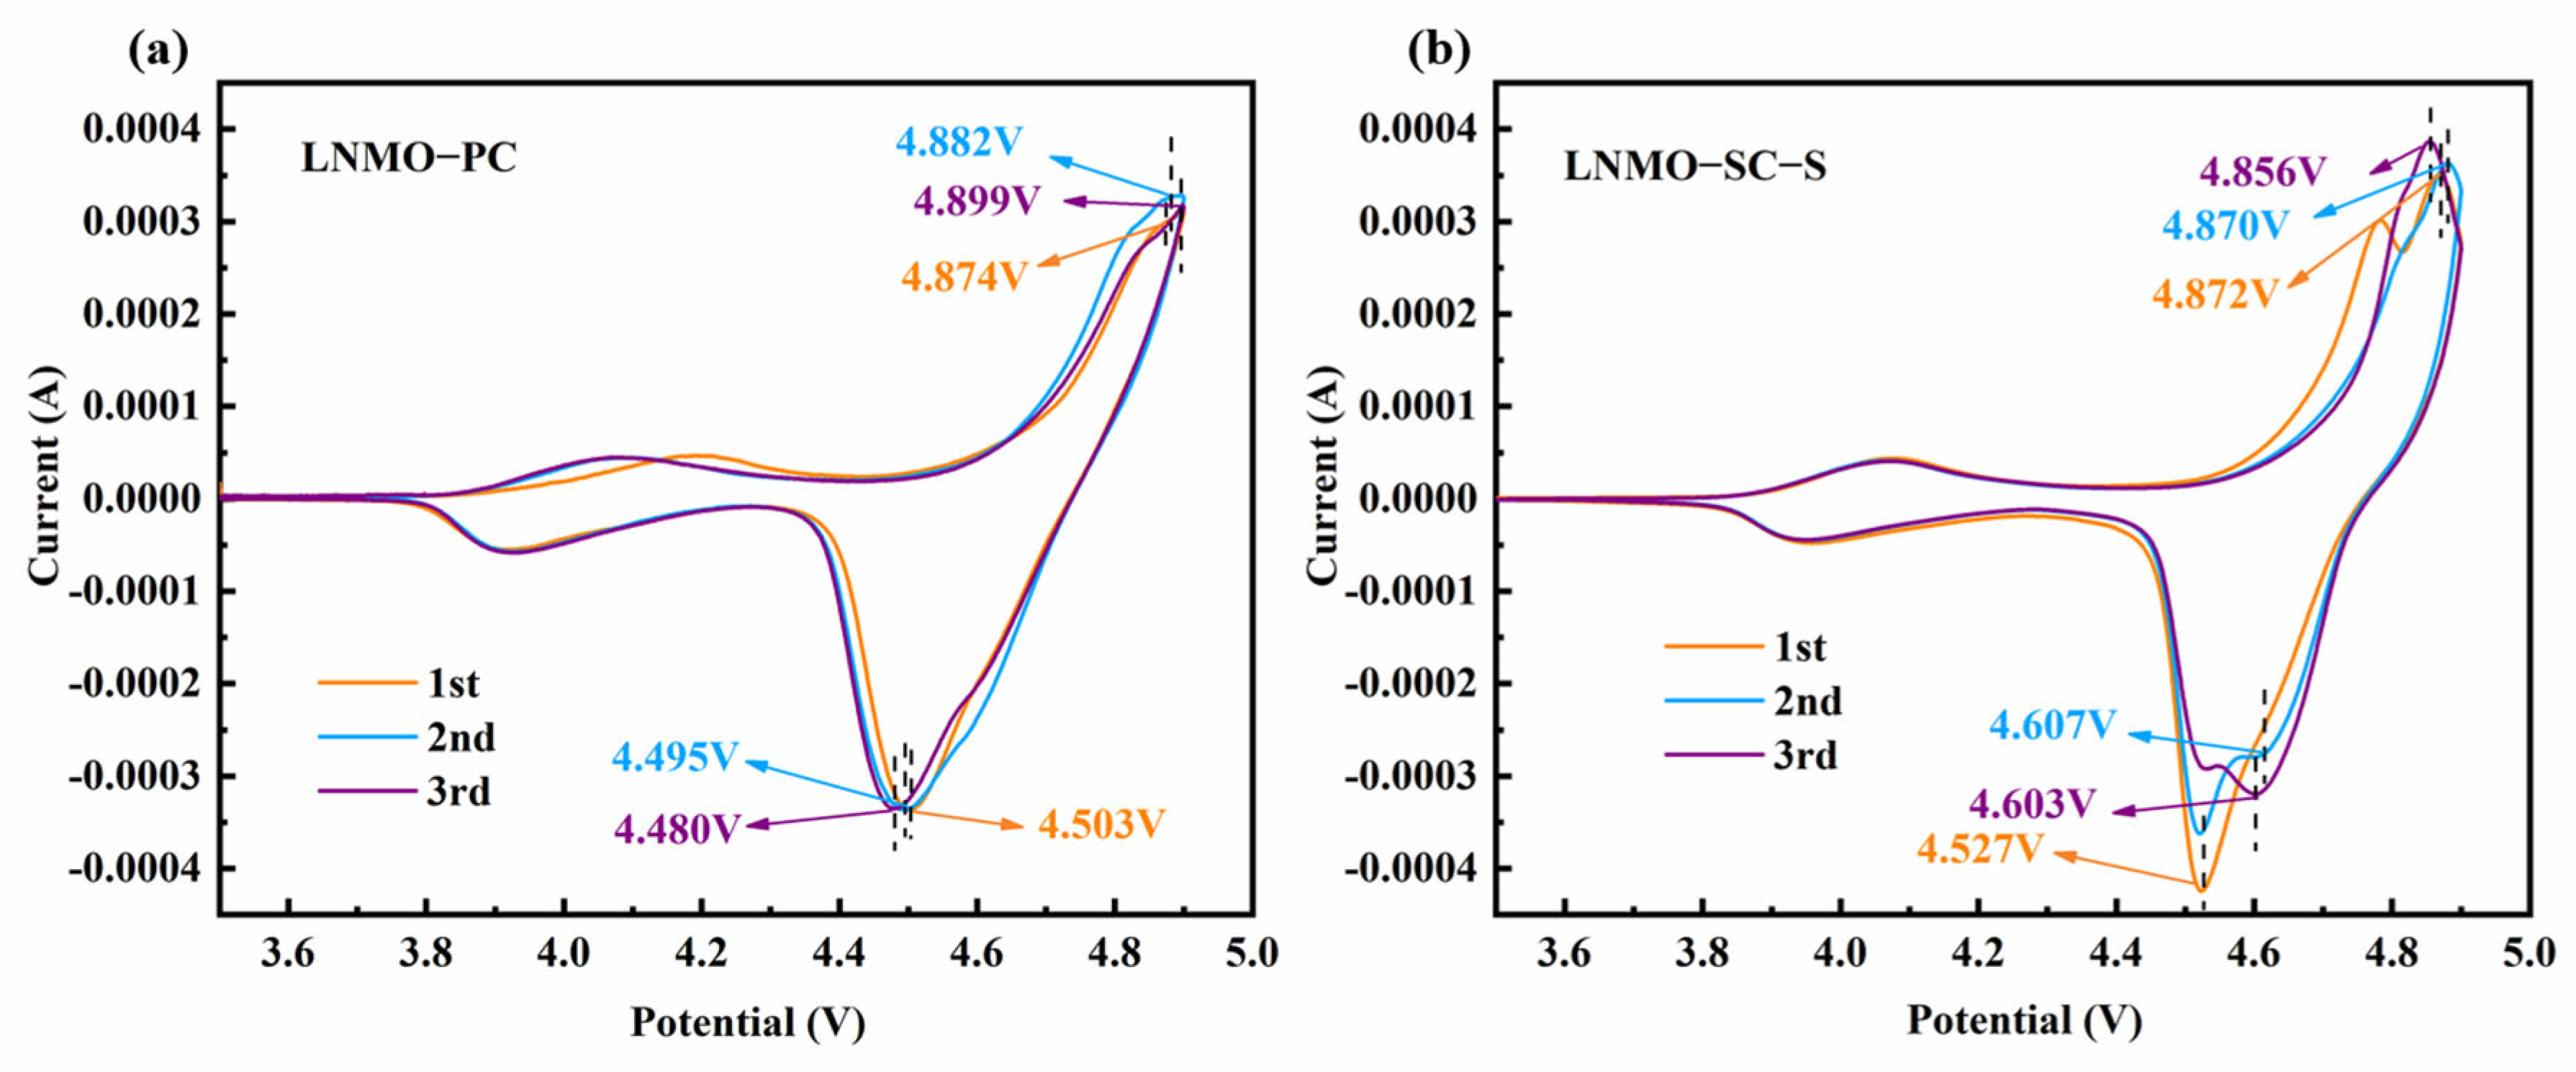
Figure 12a,b show the first three cycles of cyclic voltammetry (CV) curves for secondary polycrystalline aggregate LNMO-PC prepared by the co-precipitation method and submicron primary particle LNMO-SC-S prepared by the sol–gel method, respectively. The two main peaks around 4.7 V correspond to the Ni
2+/Ni
3+ and Ni
3+/Ni
4+ redox couples, indicating that both samples have the spinel-type LNMO structure with the Fd-3m space group. The small peak around 4.0 V is associated with the Mn
3+/Mn
4+ redox couple [
29]. The potential difference (ΔE = Epa − Epc) between the oxidation and reduction peaks can be used to characterize the degree of electrochemical polarization. The smaller the ΔE value, the better the reversibility of Li
+ insertion/extraction and the lower the polarization. According to the
Figure 12 and
Table 4, the ΔE value for LNMO-SC-S is significantly lower than that of LNMO-PC during the first three cycles, and it continues to decrease and stabilize as the number of cycles increases. In contrast, the ΔE value for LNMO-PC fluctuates more and is generally higher. This suggests that LNMO-SC-S has better Li
+ insertion/extraction reversibility and lower electrochemical polarization, further proving that submicron primary particles can effectively reduce polarization during battery cycling. This may be due to the small particle size, high crystallinity, and good dispersion of the submicron primary particles, which enhances the material’s conductivity, shortens the Li
+ diffusion path [
31], and thus improves reaction kinetics and structural stability.
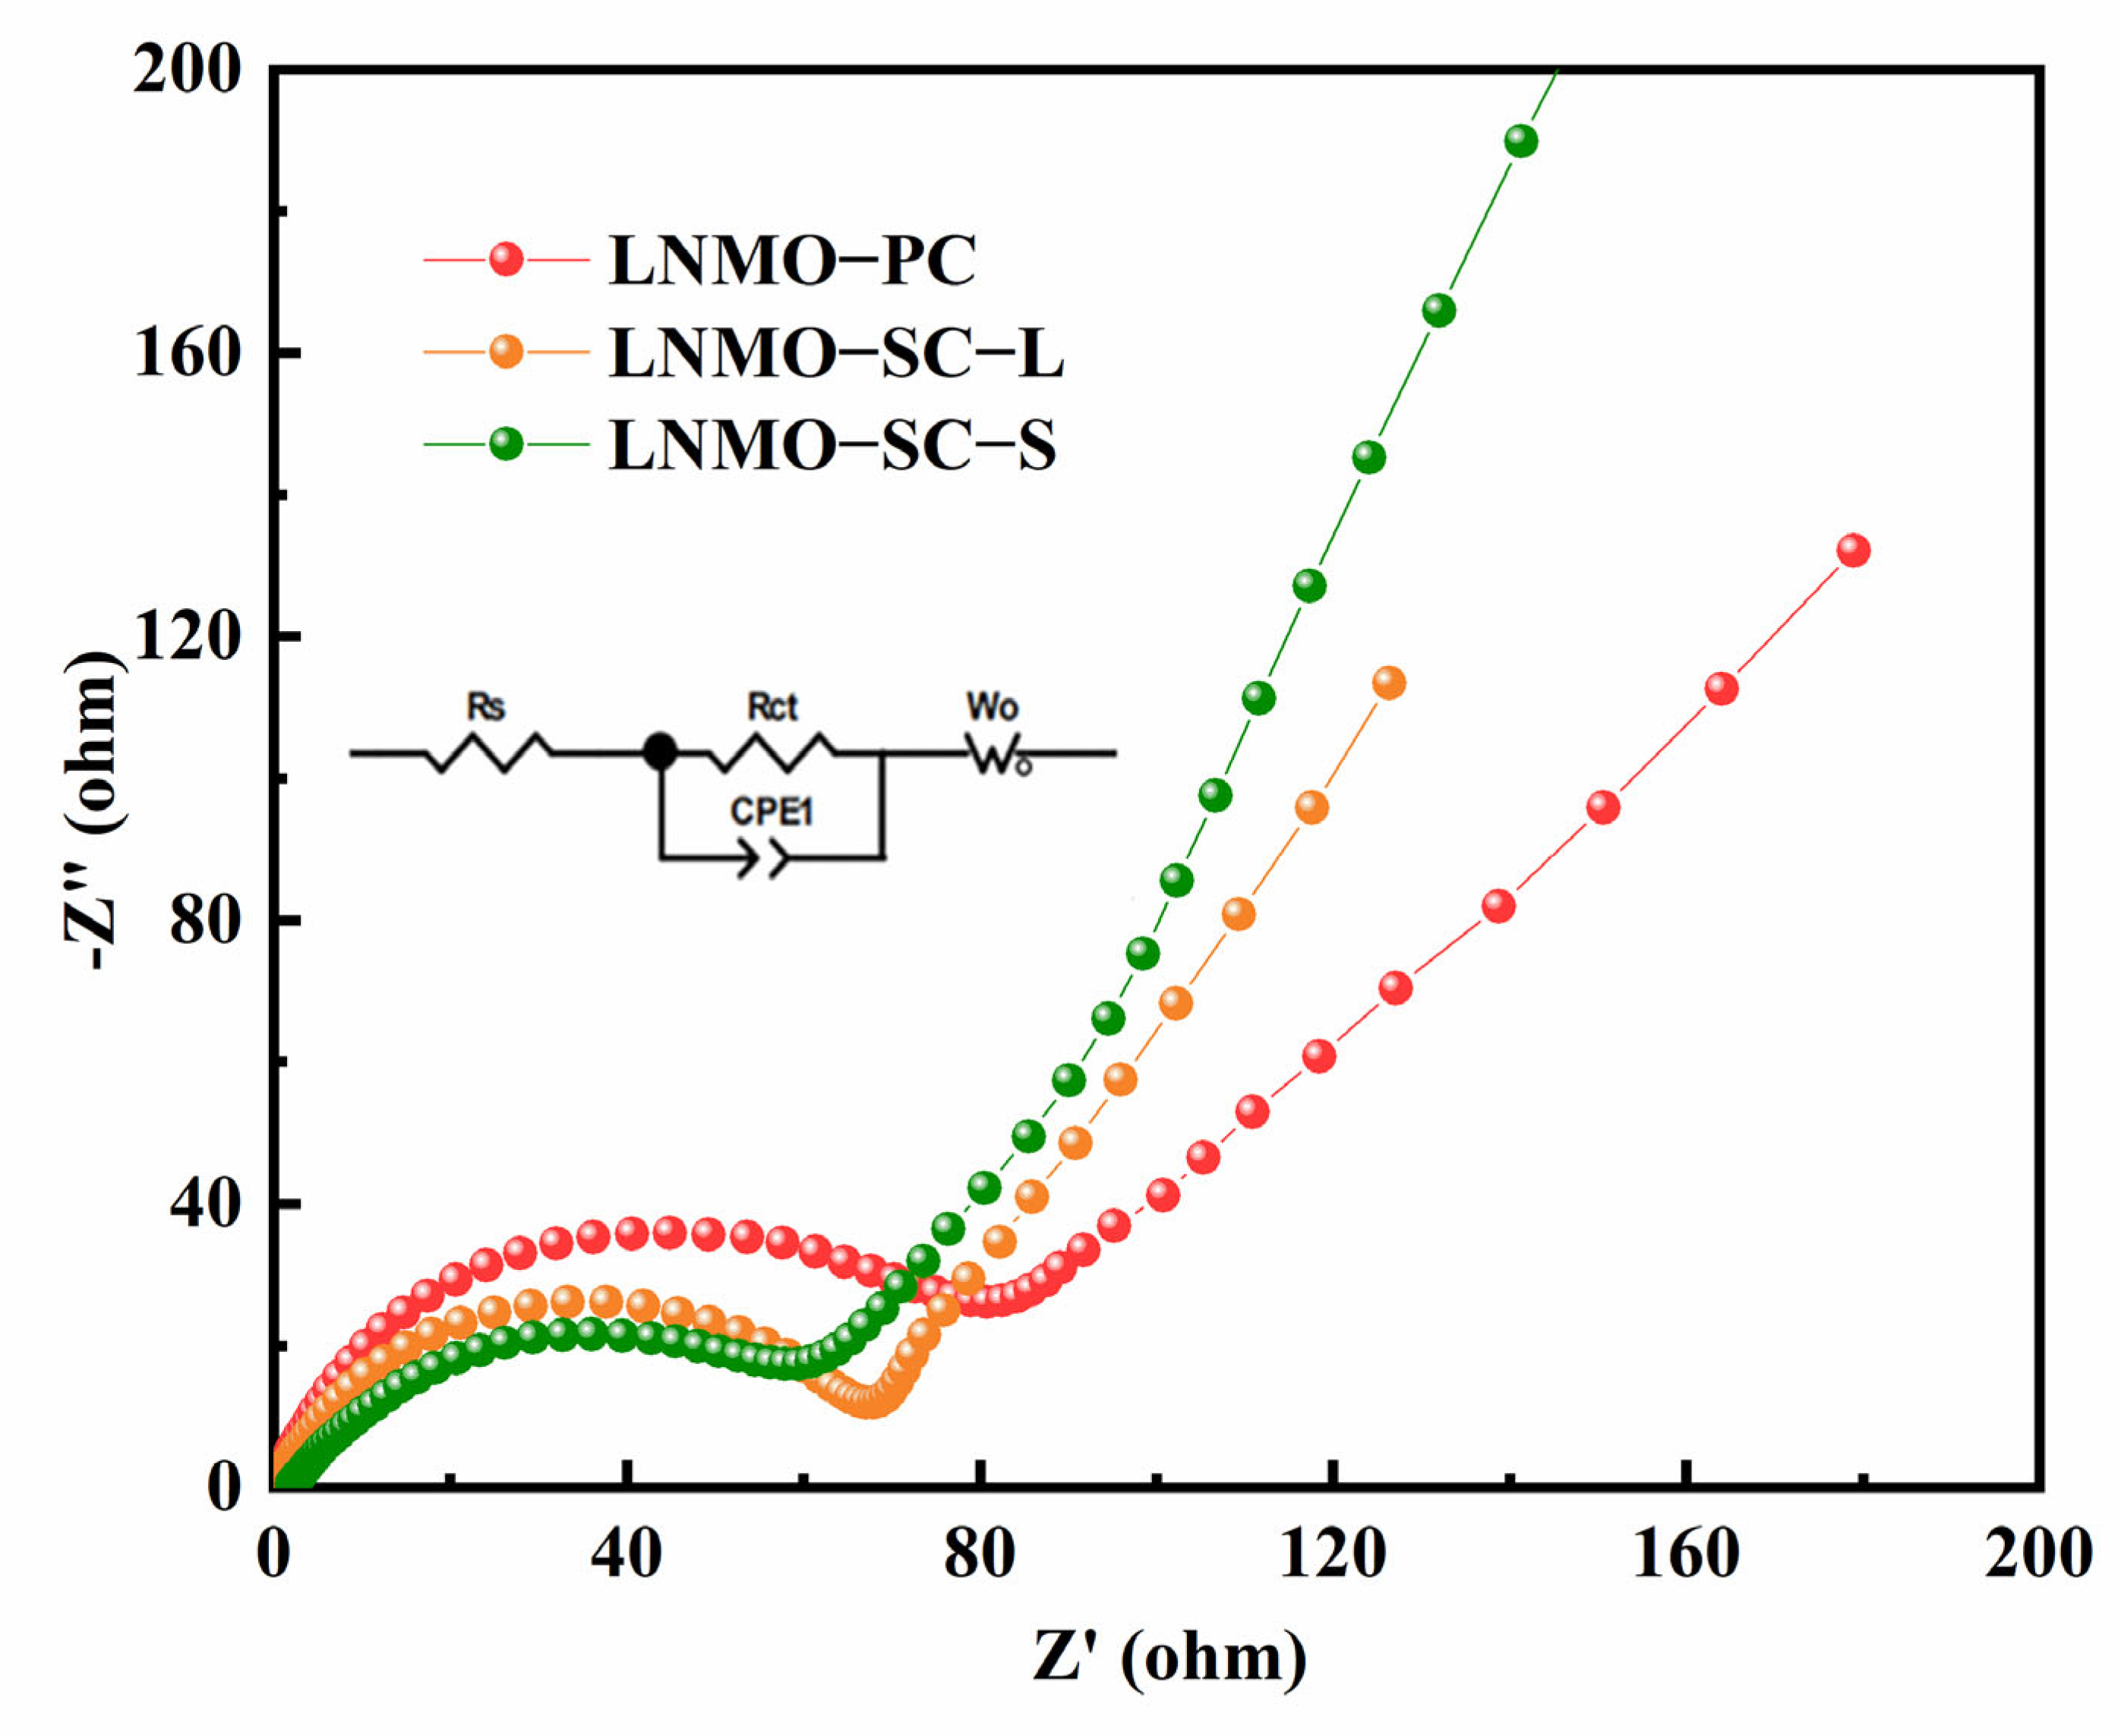
Figure 13 shows the electrochemical impedance spectra of the three LNMO samples. The Nyquist plot consists of a high-frequency semicircle and a low-frequency sloping line. After fitting with ZView, the Rct is the charge transfer resistance. The fitting results show that LNMO-SC-S has the smallest Rct (57.29 Ω), the shortest semicircle diameter, and the highest low-frequency slope, indicating the lowest charge transfer resistance and the fastest Li
+ diffusion kinetics. LNMO-SC-L has a moderate Rct (59.83 Ω), while LNMO-PC has the largest Rct (89.57 Ω), showing significantly higher charge transfer resistance. This difference is attributed to the submicron primary particles effectively shortening the Li
+ diffusion path and enhancing electron transport efficiency, while the numerous grain boundaries in the secondary polycrystalline aggregates increase the charge transfer resistance.
The submicron primary particle LNMO-SC-S possesses continuous, integrated crystal domains with negligible internal grain boundaries. The absence of massive grain boundaries effectively relieves cyclic lattice strain and restrains the generation of Jahn–Teller-active Mn3+, which fundamentally suppresses Mn disproportionation and irreversible manganese dissolution during repeated lithium insertion/extraction. Meanwhile, its uniform small particle size shortens solid-state Li+ migration distance, accelerates interfacial charge transfer kinetics, and reduces overall electrochemical polarization, as confirmed by the lowest fitted Rct value after long-term cycling.
In contrast, spherical secondary polycrystalline aggregate LNMO-PC is assembled from countless primary crystallites, creating abundant internal grain boundaries. These grain boundaries serve as defect sites that aggravate cation disorder, raise Mn3+ proportion, and introduce severe lattice distortion. During cycling, crack propagation along grain boundaries destroys structural integrity, triggers persistent interfacial side reactions, and causes rapid capacity decay. The micron-sized primary particle LNMO-SC-L avoids dense grain boundaries yet suffers from elongated lithium diffusion paths due to enlarged particle dimension, limiting its high-rate reaction kinetics.