


Abstract
Yb3+-containing glasses and glass-ceramics are attractive photonic materials because Yb3+ can act simultaneously as a near-infrared absorber, an energy-transfer sensitizer, a luminescent center, and a composition-dependent modifier of glass structure and crystallization. This brief review focuses on crystallization from parent glasses to glass-ceramics and examines glass-network chemistry, local Yb3+ coordination, phase separation, viscosity, heating rate, treatment temperature, holding time control nucleation, crystal growth, phase selection, rare-earth partitioning, transparency, and optical performance. Representative oxyfluoride, phosphate, oxyapatite, borosilicate, and aluminosilicate systems are compared using thermal analysis, X-ray diffraction, electron microscopy, vibrational spectroscopy, and optical spectroscopy. The available data show that Yb2O3 or YbF3 does not have a universal effect on crystallization: low concentrations can promote fluoride-rich clustering or lower the apparent crystallization barrier, whereas higher concentrations can increase packing density, stabilize the residual glass, change the competitive phase assemblage, or suppress crystallization. Crystallization-enhanced luminescence is most consistently obtained when Yb3+ and the activator partition into low-phonon-energy nanocrystals while crystal size and refractive-index mismatch remain sufficiently small to preserve transparency. This review also identifies major reporting gaps, including limited quantification of crystalline fraction, partition coefficients, luminescence lifetime, quantum efficiency, and long-term thermal stability. Practical design guidelines and unresolved questions are proposed to support the rational development of transparent Yb3+-containing glass-ceramics for lasers, sensing, optical amplification, and related photonic applications.
1. Introduction
1.1. Materials with and Without Yb3+ Ions
Numerous studies have been undertaken on the formation of crystal phases and crystalline fractions in glasses, the development of competing microstructures during crystallization, and the influence of atomic-size mismatch and composition on glass-forming ability [1,2,3,4,5,6,7,8]. A recent study by Contreras Jaimes and co-workers [9] examined bioactive glasses in the SiO2–P2O5–CaO–CaF2 quaternary system, focusing on how the orthophosphate-to-silicate ratio dictates phase development. Using a combination of XRD, solid-state NMR, and high-resolution imaging, they showed that phosphate-free compositions yield xonotlite, wollastonite, and cuspidine, whereas fluorapatite emerges only when P2O5 exceeds 2.4 mol%. Notably, crystallization remained marginal at low phosphate levels but intensified substantially above 3 mol% P2O5. The phosphate-free glass exhibited volume crystallization with nearly constant activation energy, while the high-phosphate variant displayed mixed surface–volume behavior and a declining activation energy with progressive conversion. These findings underscore the necessity of linking chemical makeup, thermal response, crystallization pathway, crystal fraction, grain size, and microstructure in rational glass-ceramic design [2,3,4,5,6,7,8,10,11,12,13].
Compared to the amount of research on SiO2-P2O5-CaO-CaF2 bioactive glasses without Yb3+ ions, systematic studies remain limited for glasses containing Yb3+ compounds, including Yb3+ glasses in which Yb2O3 or YbF3 acts as a functional constituent, although many reports have successfully identified the phases formed after heat treatment. Most studies adopt fixed concentrations for the major glass constituents and vary only the Yb3+-containing component or rare-earth codopant. The Yb3+ ion possesses a (4f)13(5s)2(5p)6 electronic configuration, in which the 4f electrons are effectively screened by the filled 5s and 5p subshells. This shielding renders the 4f→4f transitions largely insensitive to the surrounding ligand field. The ground state is 2F7/2, and the sole excited multiplet 2F5/2 lies approximately 10,000 cm−1 higher in energy. Consequently, Yb3+-doped glasses and glass-ceramics display a characteristic absorption band centered near 1000 nm. Moreover, when Yb3+ ions are positioned in close proximity to one another or to other lanthanides (e.g., Eu3+), the materials exhibit cooperative luminescence and sensitized upconversion via inter-ionic energy exchange [14,15,16,17,18,19,20,21,22,23,24,25].
Upconversion—often termed anti-Stokes emission—denotes the generation of higher-energy (shorter-wavelength) photons upon excitation with lower-energy (longer-wavelength) radiation. This phenomenon is frequently observed in various Ln3+-doped compounds, including those containing Yb3+. The upconversion property underpins applications in bioanalysis, theranostics (a technical term expressing the integration of therapeutics and diagnostics), biological imaging, optical sensing, optogenetics, super-resolution microscopy, barcoding, fingerprint detection, NIR vision, photochemical manipulation, optical trapping, additive manufacturing, laser technology, and NIR-II imaging [21,22,23,24,25,26,27,28,29,30,31,32,33,34,35]. For example, regarding the application to theranostics, the following report is presented [35]. Xu et al. reviewed recent advances in lanthanide-doped upconversion nanoparticles (Ln-UCNPs) as theranostic probes, emphasizing that their anti-Stokes luminescence, near-infrared excitation, large tissue-penetration depth, low photodamage, and efficient light-conversion capability make them attractive for biomedical diagnosis and treatment [35]. In particular, the higher-energy visible or ultraviolet light produced by Ln-UCNPs from NIR irradiation can be harnessed to trigger photosensitizers and photothermal agents, facilitating photodynamic therapy as well as photothermal therapy. Through surface modification and coupling with functional molecules, they can also act as drug-delivery vehicles, optical imaging probes, biosensors, and multimodal platforms for computed tomography, magnetic resonance imaging, fluorescence imaging, and image-guided therapy. These theranostic examples clearly indicate that Yb3+-sensitized upconversion materials are not only important for understanding energy-transfer and luminescence mechanisms but also provide a versatile materials basis for integrated diagnosis, treatment, and biomedical monitoring.
1.2. Microstructures of Glass, Glass-Ceramics, and Ceramics
Glass-ceramics can be formed from parent glasses via controlled nucleation and crystallization, both of which are induced by appropriate heat-treatment schedules. Depending on the thermal schedule and composition, the microstructure evolves from an amorphous glass to a glass-ceramic and, ultimately, to a more fully crystallized ceramic material [2,3,4,5]. A schematic illustration of the nucleation and crystallization processes in glass during thermal treatment is shown in Figure 1 [36]. During glass-ceramic formation, the crystalline phases, crystal sizes, residual glass composition, and spatial distribution of crystals are strongly governed by the parent-glass composition, nucleating agents, heating rate, holding temperature, and holding time [2,3,4,5,6,7,8].
Figure 1.
Schematic comparison of atomic arrangements in (a) an amorphous glass with randomly arranged atoms, (b) a glass-ceramic containing crystalline grains dispersed in a residual glass phase, and (c) a polycrystalline material composed of closely packed crystalline grains. The red and green spheres schematically distinguish two different atomic/ionic species and do not represent specific elements. The gray lines indicate local atomic connectivity, the blue outlines denote crystalline-grain boundaries, and the light-blue regions represent crystalline-grain regions. Reproduced with permission [36]. Copyright 2020, MDPI.
A glass is an amorphous solid lacking translational periodicity in its atomic arrangement (Figure 1a). A glass-ceramic is a two-phase material composed of one or more crystalline species dispersed in an amorphous residual phase (Figure 1b). Within this composite, the crystalline constituents—specifically their size, morphology, orientation, and abundance—dictate the resulting optical, thermal, mechanical, and chemical responses [2,3,6,7]. A fully crystalline ceramic (Figure 1c), by contrast, is essentially an assembly of crystal grains, with only a negligible glassy fraction at the grain boundaries. The ordered unit cells in each grain provide sharp XRD reflections, whereas the random orientation of grains produces a polycrystalline diffraction pattern.
1.3. Scope and Literature-Selection Strategy
This review draws on a focused selection of peer-reviewed studies published between 1959 and 2026. Web of Science, Scopus, and Google Scholar were searched using combinations of keywords including “ytterbium glass-ceramic crystallization,” “Yb2O3 glass crystallization,” “YbF3 oxyfluoride glass-ceramic,” “rare-earth partitioning,” “crystallization kinetics,” “Avrami,” “DSC,” “XRD,” “TEM,” “Raman,” “XANES,” “EXAFS,” “upconversion,” and other composition-specific terms. Primary studies were considered eligible if they reported at least two of the following: parent-glass composition, thermal treatment schedule, crystallization temperature or kinetic parameters, identified crystalline phase, microstructure or grain size, evidence of rare-earth partitioning, transparency, or luminescence. Studies devoted solely to single-crystal growth or ceramic-powder processing were excluded from the core analysis unless they provided essential measurement data on Yb3+ energy levels or phase identification. This selection strategy ensures that this review remains focused on the glass-to-glass-ceramic transformation rather than on general ceramic processing. The final body of literature was further enriched with mechanistic investigations into phase separation, interface-controlled growth, optical refrigeration, Yb-mediated phase selection, and optical thermometry [37,38,39,40,41,42,43,44,45,46,47,48,49,50,51,52,53,54,55,56,57,58,59,60,61].
This review is organized around composition–processing–structure–property relationships. Table 1 integrates crystallization conditions, kinetic and structural evidence, Yb3+ partitioning, optical performance, transparency, thermal stability, and principal reporting gaps, while distinguishing directly measured quantities from interpretations and explicitly marking data that were not reported. This is important because enhanced emission alone does not prove that Yb3+ has entered a crystalline phase, and the absence of sharp XRD peaks does not exclude a small fraction of very small or weakly scattering nanocrystals.
Table 1.
Comparative crystallization mechanisms, structural evidence, optical performance, and reporting gaps in representative Yb3+-containing glass systems. QE: quantum efficiency; PG: precursor glass; GC: glass-ceramic; UC: upconversion; n: the Avrami exponent.
2. Mechanistic Framework for Crystallization in Yb3+-Containing Glasses
Crystallization emerges from the interplay between thermodynamic driving force and atomic/ionic mobility. Upon cooling from the melt, the chemical-potential disparity between the supercooled liquid and a potential crystalline phase widens, yet the accompanying viscosity increase progressively hinders structural reconfiguration. For nucleation to proceed, the volumetric free-energy reduction must compensate for the energetic penalty associated with forming a crystal–glass interface. Growth, in turn, becomes kinetically accessible only when the relevant species can migrate through the adjacent glassy medium. As a consequence, the temperature at which nucleation peaks is typically lower than that for maximum growth—a relationship that underpins the common practice of two-step thermal treatments. In multicomponent glasses, phenomena such as liquid–liquid demixing, the clustering of network-modifying cations, or fluoride-enriched zone formation can diminish the effective interface energy and serve as heterogeneous nucleation promoters [1,2,3,4,5,6,7,8].
Yb3+ can influence each of these factors. Owing to its high field strength and specific coordination demands, Yb3+ may depolymerize one structural network while reinforcing another, alter the abundance of non-bridging oxygen species, modulate fluoride or phosphate bonding environments, and affect viscous flow. When Yb3+ partitions into a local region that compositionally prefigures the forthcoming crystalline phase, nucleation tends to be accelerated. Conversely, if Yb3+ enhances configurational entropy or stabilizes the residual amorphous framework, crystallization may be slower. The net outcome is system-dependent and must be determined within a well-defined compositional series; generalizations across silicate, phosphate, borate, and oxyfluoride systems are not warranted.
Heating rate introduces additional complexity in comparative studies. Under faster DSC or DTA ramps, the crystallization exotherm shifts upward in temperature because the system dwells for shorter durations within the window where nuclei and crystals can develop. Thus, the peak temperature is not a fixed intrinsic property. Furthermore, a given exotherm may reflect different underlying events, nucleation combined with growth, the growth of pre-existing nuclei, the concurrent formation of multiple phases, or surface-dominated crystallization. Reliable interpretation requires data collected over a range of heating rates, complemented by the phase-resolved characterization of specimens quenched before, at, and beyond each thermal signature [10,11,12,13].
2.1. Kinetic Analysis and Its Limits
The Kissinger method is widely employed to extract an apparent activation energy Ea from crystallization peaks recorded at various linear heating rates β. The relationship is given by
where Tp denotes the exotherm maximum, R is the gas constant, and C is a constant [10]. Alternative Ozawa-type treatments use a different functional form of β and can be applied either to peak shifts or to a specified fractional conversion [11]. The term “apparent” is used advisedly, as the derived Ea may reflect contributions from transport processes, interfacial reactions, and evolving phase compositions simultaneously. A reduction in Ea upon Yb addition can be interpreted as enhanced transformability only when the compared specimens follow identical reaction routes and yield the same crystalline product.
ln(β/Tp2) = −Ea/(RTp) + C
The Johnson–Mehl–Avrami–Kolmogorov framework relates the transformed fraction α to time t through
yielding an Avrami exponent n under stipulated assumptions. In glass research, n is commonly estimated from non-isothermal variants of this formalism [12,13]. Although values of n near unity are often linked to surface-dominated growth or one-dimensional/diffusion-controlled mechanisms, morphology, pre-existing nuclei, and time-dependent nucleation can generate comparable fitted numbers. Hence, inferring a specific mechanism solely from the Avrami exponent is unjustified. Such assignments must be corroborated by microscopy observations, particle-size dependence, and the progression of XRD patterns.
ln[−ln(1 − α)] = n ln(t) + C′
Viscosity measurements offer a crucial link between thermal signatures and the underlying structural behavior. A Vogel–Fulcher–Tammann parametrization may assist in comparing the temperature sensitivity of mobility, though extrapolation beyond the measured range carries considerable uncertainty [78]. Phase-change materials further demonstrate that crystallization pathways can alternate between glass-controlled and undercooled-liquid-controlled regimes [79]. For Yb3+-containing glass-ceramics, the most informative design strategy integrates viscosity, nucleation rate, growth kinetics, and phase identification rather than depending on a single thermal stability criterion such as ΔT = Tx − Tg.
The crystalline LiYb(MoO4)2 system is retained only as a limited benchmark for phase chemistry, site occupancy, and Yb3+ spectroscopy. Because it is prepared by solution-mediated crystal growth or powder-based solid-state synthesis, it does not provide direct evidence for nucleation from an amorphous glass. Figure 2 summarizes its chemically feasible preparation pathway and explicitly defines the conclusions that can and cannot be drawn from this crystalline benchmark [80].
Figure 2.
Author-created schematic illustrating the preparation pathway and interpretive scope of LiYb(MoO4)2 as a crystalline benchmark. (a) Formation of Li2MoO4 and Yb2(MoO4)3 intermediates from oxide/carbonate precursors, followed by their reaction to produce LiYb(MoO4)2 and subsequent crystal growth using a Li2Mo2O7 flux, top-seeded solution growth (TSSG), and slow cooling. A simplified polyhedral representation of the LiYb(MoO4)2 crystal structure is shown at the bottom. (b) Information that this crystalline benchmark can and cannot provide for interpreting glass-ceramic crystallization. The synthesis pathway was constructed by the authors using information reported in Ref. [80], and all graphical elements were created by the authors.
2.2. LiYb(MoO4)2 as a Structural and Spectroscopic Benchmark
LiYb(MoO4)2 is a tetragonal double molybdate in which Yb3+ occupies a stoichiometric lattice position rather than being present as a dilute dopant. This compound has drawn interest as a potential laser host, owing to the relatively uncomplicated electronic configuration of Yb3+, characterized by the 2F7/2 ground multiplet and the 2F5/2 excited multiplet. Its absorption features lie predominantly in the 0.9–1.0 μm range, with near-infrared emission centered near 1.0 μm [14,15,16,17,80,81]. The well-defined periodicity of this crystalline lattice serves as a useful reference for validating energy-level assignments and for detecting spectral modifications that arise from rare-earth ions occupying ordered sites. It does not, however, offer direct insight into the influence of Yb3+ on nucleation energetics or crystal-growth kinetics within an amorphous matrix.
Because LiYb(MoO4)2 undergoes incongruent melting at approximately 912 °C, Volkov and co-workers [80] adopted a flux-based approach using Li2Mo2O7, combined with top-seeded solution growth, rather than conventional Czochralski pulling. As summarized in Figure 2a, Li2MoO4 and Yb2(MoO4)3 were first prepared as intermediate compounds from Li2CO3, MoO3, and Yb2O3. These intermediates were subsequently reacted to form LiYb(MoO4)2, which was followed by crystal growth using a Li2Mo2O7 flux and slow cooling. Crystals approximately 12 mm in size were obtained by initiating growth just below the decomposition temperature. The simplified polyhedral representation at the bottom of Figure 2a illustrates the ordered crystalline structure of LiYb(MoO4)2. This route represents solution-mediated single-crystal growth rather than glass devitrification and is included only to establish a chemically feasible formation pathway and an ordered structural reference for Yb3+.
The oxidation-state balance of the precursor chemistry also requires clarification. In LiYb(MoO4)2, Mo is present as Mo6+ in the [MoO4]2− group; therefore, MoO3 is the direct oxidation-state-matched precursor used in the preparation route summarized in Figure 2a [80]. If MoO2 is employed in an alternative preparation route, the oxidation of Mo4+ to Mo6+ during heat treatment must occur and should be explicitly considered when interpreting the phase-formation mechanism. More generally, crystalline phases assigned in heat-treated glasses should be chemically compatible with the original batch composition and independently verified by phase-sensitive characterization rather than inferred from optical spectra alone.
Figure 2b clarifies the interpretive scope of crystalline LiYb(MoO4)2 in the present review. This crystalline benchmark provides useful reference information for assessing chemically feasible phase formation, crystalline-phase assignments, ordered Yb3+ site occupancy, and structural and spectroscopic characteristics. However, it does not directly demonstrate nucleation from an amorphous glass, nucleation or crystal-growth kinetics, surface versus bulk crystallization, or Yb3+ partitioning during glass devitrification.
2.3. Powder-Derived Reference Materials: Relevance and Limitations
Powder-derived LiYb1−xLnx(MoO4)2 has also been prepared by milling stoichiometric Li2CO3, MoO3, Yb2O3, and Ln2O3, followed by staged calcination and sintering in air [82]. In this route, precursor purity, particle size, mixing, temperature, and atmosphere determine the phase purity of the final crystalline material [83,84]. These processing variables are relevant to solid-state synthesis but do not directly explain nucleation within a glass. Accordingly, general descriptions of press types, green-body mechanics, calcination, and ceramic sintering are not considered further in this review. Such a synthesis method is illustrated in Figure 3.
Figure 3.
Schematic condensed preparation route for Ln3+-substituted LiYb(MoO4)2 crystals, where Ln denotes lanthanides such as Er and Eu. Green arrows indicate the processing sequence; the green region denotes the liquid milling medium; red-shaded regions indicate drying or heat treatment in air; red and black spheres represent powder particles and granules, respectively; the blue region represents uniaxial pressing; and PVB denotes the poly(vinyl butyral) binder used during granulation.
The above synthesis route was also used to prepare LiYb1-xErx (MoO4)2 (0.01 ≤ x ≤ 1) crystals by the present authors [82], where the starting materials of Er2O3, Yb2O3, and 99.9% Li2CO3 and MoO2 were weighted by an appropriate stoichiometric ratio, thoroughly mixed in an agate mortar, and transferred to a corundum crucible to sinter. The mixture powder was first pre-fired at 300 °C for 5 h and then at 500 °C for 5 h and finally heated at 800 °C for 8 h in air for preparation of the final products of the phosphors. During every step of the heat treatment, grinding and homogeneous mixing were employed.
The above powder-derived material method provides excellent crystallization formation, which is confirmed by the crystalline phase diagram measurement. XRD can verify the final crystalline phase, while microscopy and photoluminescence characterize morphology and optical response. For a glass-ceramic, however, these measurements alone cannot determine when nuclei first formed, whether crystallization occurred at the surface or throughout the volume, what fraction of the glass crystallized, or what proportion of Yb3+ entered the crystalline phase. The crystalline benchmark should therefore support phase and spectroscopic assignments but should not substitute for kinetic measurements or the direct analysis of Yb3+ partitioning.
2.4. Substitutional Chemistry and Its Relevance to Glass-Ceramics
Substitution of Ln3+ for Yb3+ in LiYb1−xLnx(MoO4)2 is facilitated by their identical charge and comparable coordination-dependent ionic radii. In LiYb1−xErx(MoO4)2, the tetragonal structure is retained over the investigated composition range, and the lattice parameters vary approximately with Er3+ content, consistent with the substitution of Er3+ at the Yb3+ site [82,85,86]. Figure 4 summarizes the corresponding XRD patterns and composition-dependent unit-cell parameters.
Figure 4.
(a) XRD patterns of LiYb1–xErx(MoO4)2 (x = 0.01–1.00), with the reference pattern; (b) variation in the unit-cell parameters as a function of x. Panels (a,b) are reproduced with permission from Ref. [82]. Copyright 2024, Elsevier B.V. (c) Schematic representation of the crystal structure of LiYb(MoO4)2, created by the authors. The structure is illustrated by taking into account the oxygen coordination geometries of the metal sites occupied by Yb, Mo, and Li ions.
This substitutional behavior is relevant to glass-ceramics because crystal-field splitting, emission line shapes, and lifetime components may indicate whether Yb3+ or a codoped activator has entered an ordered crystalline environment. Nevertheless, optical evidence remains indirect: similar spectra may arise from different local coordination environments, and an approximately linear change in lattice parameters does not quantify the fraction of rare-earth ions remaining in the residual glass. Direct or quantitative methods—including EXAFS/XANES, site-selective spectroscopy, spatially resolved elemental analysis, and multicomponent lifetime analysis—are required to determine rare-earth partitioning reliably. The LiYb(MoO4)2 system is therefore used only as a structural and spectroscopic reference and is not generalized as a model for the thermodynamics or kinetics of glass crystallization.
3. Optical Processes Relevant to Yb3+-Containing Glass-Ceramics
3.1. Upconverted Emission of Yb3+-Doped Crystals
3.1.1. Cooperative Luminescence (CL)
A broad emission feature centered at ~497 nm (20,120 cm−1) was first observed in YbPO4 by Nakazawa and Shionoya [87] in 1970. This signal appeared under near-infrared pumping near 1000 nm at ambient temperature, with the band spanning from ~480 nm to ~520 nm on its high- and low-energy sides, respectively. The emission energy is approximately twice the excitation energy, and its intensity increases nearly quadratically with pump power. This behavior was assigned to cooperative luminescence (CL), which originates from a pair of neighboring Yb3+ ions through a two-photon upconversion process [18,19,87]. This cooperative process follows the reaction scheme:
Yb3+(2F5/2) + Yb3+(2F5/2) → Yb3+(2F7/2) + Yb3+(2F7/2) + CL
This mechanism is thought to proceed through an intermediate [2F5/2 2F5/2] state, which arises from electronic coupling between two neighboring Yb3+ ions—one in the 2F5/2 excited level and the other also in the 2F5/2 state.
Since its initial observation in YbPO4, a broad cooperative-luminescence band near 500 nm has been reported in numerous Yb3+-containing crystals, glasses, ceramics, and solutions [18,19,20,87,88]. In Yb3+-doped phosphate glasses, the probability of cooperative luminescence increases as the average Yb3+–Yb3+ separation decreases, with pronounced cooperative emission reported when the separation is shorter than approximately 0.4 nm [88]. As schematically illustrated in Figure 5a, the shorter inter-ionic distance enhances electronic coupling between neighboring excited Yb3+ ions, whereas a larger separation suppresses the cooperative process. The resulting emission is characterized by a broad band centered near 500 nm. Narrow emission features associated with intentionally or unintentionally incorporated rare-earth ions may be superimposed on this band, as illustrated schematically in Figure 5b. Representative Tm3+-related emissions occur near 470, 474, and 480 nm, whereas Er3+-related emissions have been reported near 521, 525, and 528 nm [87,88].
Figure 5.
Author-created schematic illustrating the influence of Yb3+–Yb3+ separation and rare-earth impurities on cooperative luminescence. (a) Under 975 nm near-infrared excitation, a short Yb3+–Yb3+ separation (R ≲ 0.4 nm) promotes strong electronic coupling between neighboring excited Yb3+ ions and enhances cooperative luminescence near 500 nm, whereas a larger separation weakens the electronic coupling and suppresses the cooperative process. The asterisk (*) in “Yb3+” denotes an Yb3+ ion in its excited state. (b) Schematic spectral representation of the broad Yb3+ cooperative-luminescence band centered near 500 nm, with representative narrow Tm3+- and Er3+-related emission features superimposed. The spectrum is provided for conceptual illustration and does not represent digitized experimental data. The scientific concepts and representative wavelength assignments are based on Refs. [87,88], and all graphical elements were created by the authors.
A simplified model for the CL mechanism is shown in Figure 6 [18,19,87,88]. Two neighboring Yb3+ ions, Yb3+(1) and Yb3+(2), are simultaneously excited to the 2F5/2 state under pumping at 10,590 cm−1. The donor Yb3+(1) relaxes non-radiatively to the ground state and passes its energy to the adjacent Yb3+(2), which is already in the excited 2F5/2 state, promoting it to an intermediate Yb3+–Yb3+ dimer state denoted as [2F5/2 2F5/2] at approximately 21,180 cm−1 (= 2 × 10,590 cm−1). This cross-relaxation-type energy-transfer process is followed by radiative emission from the dimer state, producing CL.
Figure 6.
Schematic energy-level diagram illustrating cooperative luminescence (CL) from a Yb3+ dimer with a short Yb3+–Yb3+ separation. Under 944 nm excitation, cross-relaxation (CR) occurs between two neighboring Yb3+ ions, denoted Yb3+(1) and Yb3+(2), and CL is assumed to originate from Yb3+(2). Labels such as (1) denote crystal-field-split Stark substates of the 2F7/2 ground state, whereas labels such as (2′) denote substates of the 2F5/2 excited state. The corresponding energy gaps are labeled in cm−1.
3.1.2. Yb3+-Sensitized Rare-Earth Emission
In addition to the broad cooperative-luminescence band near 500 nm, narrow upconversion-emission features may appear when trivalent lanthanide ions such as Er3+, Ho3+, Tb3+, or Tm3+ are intentionally or unintentionally codoped into Yb3+-containing compounds, as schematically illustrated in Figure 7 [18,19,20,21,22,23,24,25,31,32,33,34,63,82,87,88]. Each upconversion emission typically exhibits a power-law relationship with the excitation power, I ∝ Pn, where P denotes the near-infrared pump intensity and the exponent n corresponds to the number of excitation quanta required to populate the emitting level [18,19,63]. Values of n between 1 and 2 usually indicate two-photon processes affected by saturation or cross-relaxation, whereas values approaching 3 indicate three-owhoton processes. The observed emissions are generally attributed to cooperative sensitization or to stepwise energy migration from excited Yb3+ pairs to Ln3+ acceptor ions. The reduction in CL in codoped systems suggests that energy transfer to Ln3+ ions competes efficiently with radiative CL from Yb3+ pairs [18,19,20,21,22,23,24,25,31,32,33,34].
Figure 7.
Upconversion spectrum of LiYb0.98Tm0.01Er0.01(MoO4)2 under 975 nm excitation, showing rare-earth emission superimposed on part of the broad Yb3+ cooperative-luminescence band. Reproduced with permission from Ref. [82]. Copyright 2024, Elsevier B.V.
3.2. Downconverted Yb3+ Emission Band
Yb3+ has the outer-electron configuration 4f135s25p6, with a 2F7/2 ground state and only one excited multiplet, 2F5/2 [14,15,16,17]. The shielding provided by the filled 5s2 and 5p6 subshells renders the 4f electrons largely insensitive to the host matrix, except for the Stark splitting that emerges in non-centrosymmetric crystal fields. At low temperature, the 2F5/2 → 2F7/2 emission and 2F7/2 → 2F5/2 absorption spectra can show several sharp Stark components [14,82,89]. At room temperature, however, vibronic coupling and thermal broadening often merge these components into a broad near-infrared emission band around 1000 nm, as illustrated for LiYb(MoO4)2-based crystals in Figure 8 [82,89,90].
Figure 8.
Cooperative-luminescence spectrum from LiYb0.695Eu0.30Ho0.005(MoO4)2 compared on an energy scale with its near-infrared Yb3+ 2F5/2 → 2F7/2 emission. A weak Ho3+ band is also present.
3.3. Stokes and Anti-Stokes Luminescence Bands in Er3+/Yb3+-Doped Oxyfluoride Glass-Ceramics
Representative Stokes and anti-Stokes emissions from Er3+/Yb3+-doped oxyfluoride glass-ceramics are shown in Figure 9. The spectra were obtained from NaGdF4-containing precursor glasses and glass-ceramics under 974 nm excitation [91]. In the visible region, the characteristic Er3+ upconversion emissions are assigned to the 2H11/2, 4S3/2 → 4I15/2 green transitions and the 4F9/2 → 4I15/2 red transition. In the near-infrared region, the emission features are associated mainly with the Yb3+ 2F5/2 → 2F7/2 transition near 1.0 μm and the Er3+ 4I13/2 → 4I15/2 transition around 1.5 μm. Compared with the precursor glass, the heat-treated glass-ceramic exhibits enhanced and better-resolved emission features, which supports the incorporation of Er3+ and Yb3+ ions into the low-phonon-energy NaGdF4 nanocrystals.
Figure 9.
Representative upconversion and near-infrared emissions of Er3+/Yb3+-doped NaGdF4-containing oxyfluoride glass-ceramics. (a) Visible upconversion emission spectra of Er3+-doped and Er3+/Yb3+-codoped 70Si7Gd precursor glasses and glass-ceramics heat-treated at 550 °C for 80 h under 974 nm excitation. (b) Near-infrared emission spectra of the Er3+/Yb3+-codoped precursor glass and corresponding glass-ceramic under 974 nm excitation, showing the Yb3+ 2F5/2 → 2F7/2 emission near 1.0 μm and the Er3+ 4I13/2 → 4I15/2 emission around 1.5 μm. Adapted from Ref. [91] under the terms of the Creative Commons Attribution 4.0 International License (CC BY 4.0). The original panels were reformatted and rearranged for presentation without alteration of the underlying spectral data.
Analogous simultaneous Stokes and anti-Stokes luminescence was reported for Er3+/Yb3+-codoped Pb4Yb3F17-containing oxyfluoride nanoglass-ceramics under 940 nm excitation [66]. Although the corresponding experimental spectrum is not reproduced here, the observation of Er3+ emissions under the preferential excitation of Yb3+ provides evidence for efficient Yb3+ → Er3+ energy transfer in this system.
The observation of Er3+ emission under excitation near the Yb3+ absorption band indicates efficient Yb3+ → Er3+ energy transfer. The initial resonant energy-transfer step can be expressed as 4I15/2 (Er3+)+ 2F5/2 (Yb3+)→4I11/2 (Er3+)+ 2F7/2 (Yb3+). A subsequent energy-transfer-upconversion step, 4I11/2 (Er3+)+ 2F5/2 (Yb3+)→4F7/2 (Er3+)+ 2F7/2 (Yb3+), populates the higher-lying Er3+ manifold. Multiphonon relaxation from 4F7/2 then populates the 2H11/2, 4S3/2, and 4F9/2 levels, giving rise to the characteristic green and red upconversion emissions. These principal excitation, energy-transfer, relaxation, and emission pathways are summarized in the author-created energy-level scheme shown in Figure 10.
Figure 10.
Author-created simplified energy-level scheme illustrating Yb3+-sensitized Er3+ upconversion under excitation within the Yb3+ absorption band. The diagram shows Yb3+ excitation, Yb3+ → Er3+ energy transfer to the 4I11/2 level, sequential energy-transfer upconversion to the 4F7/2 and higher-lying Er3+ levels, multiphonon relaxation, and the principal visible Er3+ emissions. The near-resonant Er3+–Er3+ cross-relaxation process 4S3/2 + 4I9/2 → 4F9/2 + 4F9/2 increases the population of the red-emitting 4F9/2 level [41].
Figure 10 presents an author-created simplified energy-level scheme for Yb3+-sensitized Er3+ upconversion in oxyfluoride glasses and glass-ceramics. The relevant Er3+ levels are located at approximately 10,000–10,500 cm−1 for 4I11/2, 12,500 cm−1 for 4I9/2, 15,200 cm−1 for 4F9/2, 18,300 cm−1 for 4S3/2, and 20,400 cm−1 for 4F7/2. In addition to sequential Yb3+ → Er3+ energy transfer, Er3+–Er3+ cross-relaxation can influence the relative intensities of the green and red emissions. In particular, the near-resonant process 4S3/2(Er3+) + 4I9/2(Er3+) → 4F9/2(Er3+) + 4F9/2(Er3+) increases the population of the red-emitting 4F9/2 level. This process can therefore contribute to an increase in the red-to-green intensity ratio, Rr/g.
In the Pb4Yb3F17-containing oxyfluoride nanoglass-ceramic investigated in Ref. [66], a weak upconversion emission was additionally observed at approximately 480 nm and was assigned to the Er3+ 4F7/2 → 4I15/2 transition. The 4F7/2 level can be populated through a two-step Yb3+-sensitized process: an initial Yb3+ → Er3+ energy-transfer step populates the Er3+ 4I11/2 level, followed by a second energy-transfer-upconversion step to 4F7/2. The emission near 407 nm was assigned to the 2H9/2 → 4I15/2 transition. Population of 2H9/2 may involve an additional Yb3+-sensitized upconversion step to a higher-lying Er3+ level, such as 2P3/2, followed by multiphonon relaxation to 2H9/2. These proposed pathways are included in the generalized mechanism shown in Figure 10.
4. Design and Characterization of Yb3+-Containing Glass-Ceramics
4.1. Nucleation, Phase Fraction, and Optical Transparency
The objective is to achieve a controlled population of crystals dispersed in a continuous glassy matrix—not merely to detect an XRD signal. Scattering behavior is governed by four interrelated factors: crystalline fraction, grain-size distribution, spatial uniformity, and refractive-index mismatch. When crystallites are significantly smaller than the wavelength of light, high transparency can be retained; however, aggregation or a wide size distribution may still introduce optical losses. Consequently, heat-treatment protocols must be optimized with respect to at least two performance metrics—crystallization and transparency—rather than against a single parameter such as peak intensity [92,93,94,95,96,97,98,99].
Rare-earth partitioning introduces a third consideration. Luminescence may be enhanced when Yb3+ and an activator ion are incorporated into a low-phonon fluoride nanocrystal, yet the high local concentration within such a confined phase can also promote cross-relaxation or clustering. Meanwhile, the composition of the residual glass evolves as crystallization proceeds, altering its viscosity, refractive index, and rare-earth solubility over the course of the same thermal schedule. These coupled effects explain why the most prolonged or highest-temperature anneal is rarely the optimum choice.
The crystalline fraction should ideally be quantified via Rietveld refinement using an internal standard or through a calibrated complementary technique. The Scherrer estimate derived from XRD peak broadening represents the coherent domain size, which does not necessarily correspond to the actual particle diameter observed in SEM. Reporting both quantities—along with the instrument-broadening correction and a size distribution extracted from imaging—helps prevent apparent discrepancies from being misinterpreted as evidence of a novel physical effect.
4.2. Capabilities and Limitations of Characterization Methods
DSC/DTA identifies thermal events and supports kinetic analysis, but overlapping exotherms and baseline choices can obscure multiple phases. XRD is phase-specific for sufficiently ordered and abundant crystals, yet very small, strained, or low-fraction nanocrystals may produce peaks too broad or weak for confident detection. TEM with selected-area electron diffraction can reveal such nanocrystals and distinguish surface from volume populations, although its field of view may not represent the bulk. Raman spectroscopy is sensitive to short-range network reorganization and can detect vibrational signatures unavailable from XRD, but band overlap and fluorescence backgrounds complicate quantification. A combined XRD–TEM–Raman strategy has directly demonstrated heat-treatment-induced NaYF4 nanocrystals and associated network changes in Ho3+/Yb3+ oxyfluoride glass-ceramics [100].
XANES can test oxidation state and near-edge coordination changes, whereas EXAFS yields average neighbor identities, distances, and coordination numbers around Yb. These methods are particularly valuable when Yb-rich clusters or nanophases are below the XRD detection limit; EXAFS has resolved the local environment and phosphate association of Yb3+ in phase-separated silica-based preforms [101]. Their limitation is ensemble averaging, so coexisting Yb sites may require model comparison or complementary spectroscopy. Photoluminescence, lifetime, and quantum-yield measurements probe the functional consequence of site changes, but optical enhancement alone is not proof of crystal incorporation. The strongest mechanistic claim is obtained when thermal, diffraction, imaging, local-structure, and optical evidence converge on the same sequence.
5. Representative Ln3+-Yb3+ Codoped Glass-Ceramics
5.1. Er3+- Yb3+ Codoped Fluoro-Aluminosilicate Glass-Ceramics
In 45SiO2-15Al2O3-12Na2O-21BaF2-7YF3-0.5ErF3-1YbF3 glass codoped with Er3+ and Yb3+, controlled heat treatment produces cubic BaYF5 nanocrystals [62]. That study is instructive because it connects phase formation, microstructure, transmission, and upconversion. Yb3+ absorbs near 980 nm and sensitizes Er3+, while the fluoride nanophase provides a lower-phonon environment than the oxide-rich matrix.
XRD establishes the crystalline phase, and transmission above 80% indicates that the heat-treated microstructure remains optically homogeneous on the wavelength scale (Figure 11). The transmittance spectra of both as-produced and heat-treated GC samples (measured over 275–1000 nm) provide complementary information to the Raman data. In Figure 11b, absorption features are observed at approximately 378, 487, 523, 541, 653, and 976 nm. The first five of these correspond to Er3+ transitions from the 4I15/2 ground state to the 4G11/2, 4F7/2, 2H11/2, 4S3/2, 4F9/2 excited levels, while the 976 nm line arises from the Yb3+ 2F7/2 → 2F5/2 transition. Notably, no absorption feature attributable to the BaYF5 crystalline phase is detected. This absence is consistent with the small dimensions of the precipitated BaYF5 nanocrystals—approximately 10 nm as shown in Figure 12B—which are substantially smaller than the wavelengths of visible light. This size regime explains why both the as-produced and heat-treated GC samples maintain high transmittance (>80%). By contrast, the presence of larger BaYF5 crystallites would be expected to introduce significant scattering losses and thereby reduce transparency.
Figure 11.
(a) XRD patterns of as-produced and heat-treated glass-ceramics with the cubic BaYF5 reference; (b) corresponding transmission spectra. Reproduced with permission from Ref. [62]. Copyright 2021, John Wiley and Sons.
Figure 12.
SEM micrographs of the as-produced (A) and heat-treated (B) Er3+–Yb3+ fluoro-aluminosilicate glass-ceramics. Reproduced with permission from Ref. [62]. Copyright 2021, John Wiley and Sons.
Electron microscopy showed approximately 25 nm domains in the as-produced material and particles near 60–65 nm after heat treatment, together with smaller newly precipitated domains (Figure 12) [62]. The XRD coherent-domain estimate and the image-based particle size are similar in scale but should not be treated as identical quantities. The coexistence of sizes suggests that nucleation continued while earlier particles grew.
This observation is mechanistically more informative than a single average size. Continued nucleation broadens the population and can preserve transparency if both populations remain nanoscale; excessive growth would increase scattering. Rare-earth partitioning into BaYF5 was inferred from the enhanced emission and crystal-field features, but a quantitative Yb3+ or Er3+ partition coefficient was not reported.
The case therefore supports a coupled design rule: annealing should maximize the fraction of rare-earth ions in the desired nanophase before particle coarsening compromises transmission. Quantitative phase fraction, lifetime, and absolute quantum efficiency would be needed to compare this optimum with other glass families.
UC Luminescent Behavior
One advantage of controlled glass crystallization is that it can place rare-earth ions into low-phonon-energy crystalline environments while maintaining the mechanical stability and processability of the glass matrix [92,93,94,95,96,97,98,99]. In Er3+–Yb3+ codoped systems, Yb3+ acts as a sensitizer under 940–980 nm excitation and transfers energy to Er3+, leading to population of the 4I11/2, 4F7/2, 2H11/2, 4S3/2, and 4F9/2 levels. The resulting green and red emissions are strongly affected by crystallite size, rare-earth partitioning, phonon energy, and cross-relaxation pathways [18,19,20,34,62,92,93,94,95,96,97].
Figure 13A presents the upconversion (UC) emission spectra of Er3+–Yb3+ codoped GC samples—both as-produced and heat-treated—under 980 nm excitation, recorded over the 500–700 nm range. Three characteristic emission peaks appear at 523 nm (2H11/2 → 4I15/2), 541 nm (4S3/2 → 4I15/2), and 653 nm (4F9/2 → 4I15/2). A notable feature is the distinct Stark splitting observed in both samples, particularly the resolved doublet at ~541 nm and ~549 nm within the 4S3/2 → 4I15/2 band. This splitting originates from the crystal-field-induced lifting of degeneracy in the 4I15/2 ground state, given that the emitting level is the lowest relaxed component of the 4S3/2 manifold even at room temperature.
Figure 13.
(A) Upconversion spectra of as-produced and heat-treated glass-ceramics; (B) pump-power dependence for the heat-treated sample; (C) proposed Er3+–Yb3+ energy-transfer pathways under 980 nm excitation. Reproduced with permission from Ref. [62]. Copyright 2021, John Wiley and Sons.
The heat-treated GC exhibits approximately twice the UC intensity of its as-produced counterpart. This enhancement is attributed to the preferential incorporation of Er3+ ions into the BaYF5 fluoride nanocrystals, where the lower phonon energy environment suppresses non-radiative multiphonon relaxation. The UC emission intensity (IUC) generally scales with excitation power (P) according to IUC ∝ Pn, where n denotes the number of 980 nm photons required to populate the emitting states (2H11/2, 4S3/2, or 4F9/2). Because n ≥ 2, the process corresponds to anti-Stokes emission. Figure 13B shows the logarithmic plot of IUC versus P; the fitted slopes are 1.95 for the 541 nm band and 1.88 for the 653 nm band, confirming that a two-photon mechanism dominates the UC process.
The underlying energy-transfer scheme is illustrated in Figure 13C. Upon 980 nm excitation, Yb3+ ions are initially promoted from the 2F7/2 ground state to the 2F5/2 excited level via ground-state absorption (GSA). These excited Yb3+ ions then relax non-radiatively, transferring energy to adjacent Er3+ ions and promoting them from 4I15/2 to 4I11/2 through a resonant ET1 process: 4I15/2 (Er3+) + 2F5/2 (Yb3+) → 4I11/2 (Er3+) + 2F7/2 (Yb3+). In parallel, Er3+ ions can also undergo direct GSA from 4I15/2 to 4I11/2. A subsequent ET2 step—4I11/2 (Er3+) + 2F5/2 (Yb3+) → 4F7/2 (Er3+) + 2F7/2 (Yb3+)—drives the system to the 4F7/2 level. From there, non-radiative relaxation populates the 2H11/2 and 4S3/2 emissive states, which then decay radiatively to 4I15/2, producing the 523 and 541 nm emissions. The 653 nm red emission (4F9/2 → 4I15/2) can be populated via two pathways: (i) non-radiative relaxation from 4S3/2, or (ii) an ET3 process—4I13/2 (Er3+) + 2F5/2 (Yb3+) → 4F9/2 (Er3+) + 2F7/2 (Yb3+)—following non-radiative decay from 4I11/2.
To summarize the UC behavior: the heat-treated GC shows a twofold enhancement over the as-produced GC, attributable to the more effective partitioning of both Er3+ and Yb3+ into the low-phonon BaYF5 environment. Notably, the heat-treated material remains stable against further crystallization, ensuring stable UC performance at operating temperatures, and exhibits promising temperature-sensing characteristics.
Attribution of the upconverted 523, 541, and 653 nm emissions to the two-photon excitation process under 980 nm LD excitation is also explained as follows. The 980 nm LD irradiation to the heat-treated GC sample of 45SiO2-15Al2O3 -12Na2O-21BaF2-7YF3-0.5ErF3-1YbF3 gives rise to the excitation of not only the Yb3+ of YbF3 but also the Er3+ of ErF3 because the two ions have a gap energy of ~10,206 cm−1 (corresponding to 980 nm). For instance, the energy separation between the 4I11/2 and 4I15/2 levels of Er3+ is approximately 10,000 cm−1, which matches the energy of a 980 nm photon and thus allows excitation from the ground state to the 4I11/2 manifold. From this intermediate level, a second 980 nm photon can promote the ion further to the 4F7/2 state, as the 4F7/2-4I11/2 gap (~11,000 cm−1) is also resonant with the excitation wavelength. Consequently, Er3+ can be raised to the 4F7/2 level through a two-photon absorption sequence. Subsequent non-radiative multiphonon relaxation then populates the lower-lying 2H11/2, 4S3/2, and 4F9/2 emitting states, which give rise to the 523, 541, and 653 nm emissions, respectively (Figure 13C).
An alternative two-photon pathway involves the initial excitation of Yb3+ from 2F7/2 to 2F5/2 by a 980 nm photon. The excited Yb3+ ion subsequently undergoes spontaneous 2F5/2→2F7/2 emission at ~980 nm, and this emitted photon can then be reabsorbed by an Er3+ ion to promote it from 4I11/2 to 4F7/2. This means that two 980 nm photons are used to excite into the 4F7/2 state, followed by the generation of the 523, 541, and 653 nm emissions finally.
5.2. Tb3+–Ho3+–Yb3+-Codoped Glass-Ceramics
Phosphate glasses with compositions (in mol %) consisting of seven constituents of 20Na2O-42ZnO-28P2O5-10B2O3-2.0Yb2O3-0.15Ho2O3-xTb4O7 (with x = 0.6, 0.8, 1.0, 1.2) were melted, annealed, and subsequently heat-treated at 600 °C to form a transparent NaZnPO4-containing glass-ceramic (GC600) [63]. The reported thermal markers were Tg ≈ 457 °C, onset Tx ≈ 537 °C, and a crystallization peak near 643 °C. These values define a processing window, but they do not alone identify whether nucleation began at Tg or quantify the crystalline fraction. The reported XRD results distinguish the predominantly amorphous precursor glass (PG) from the NaZnPO4-containing GC600 product [63]; the corresponding heat-treatment-induced phase evolution is summarized schematically in Figure 14. Yb3+ supplies near-infrared sensitization, while Ho3+ and Tb3+ provide multiple visible emitting levels. The system therefore tests how crystallization changes a multi-ion transfer network, but concentration quenching and cross-relaxation must be separated from the effect of the crystalline host.
Figure 14.
Author-created schematic summarizing the heat-treatment-induced conversion of the 20Na2O-42ZnO-28P2O5-10B2O3-2.0Yb2O3-0.15Ho2O3-1.0Tb4O7 precursor glass (PG) into the NaZnPO4-containing glass-ceramic (GC600). The thermal parameters and phase assignment are summarized from Refs. [38,63].
The crystallization behavior and upconversion optical properties of NaZnPO4:Yb3+/Tb3+/Ho3+ nanocrystals embedded in a glass matrix have been investigated in multicomponent systems [63]. These studies are important because Tb3+ and Ho3+ introduce additional green, red, and near-infrared emitting levels, while Yb3+ provides efficient sensitization under near-infrared excitation. Such multi-ion systems allow emission color tuning through energy transfer, cooperative sensitization, and cross-relaxation processes [18,19,20,31,32,33,34,63,67].
5.2.1. Crystallization and Upconversion Spectra
The PG samples with nominal composition 20Na2O-42ZnO-28P2O5-10B2O3-2.0Yb2O3-0.15Ho2O3-xTb4O7 with x = 0.6, 0.8, 1.0 and 1.2 mol% were excited by a 980 nm laser. The principal upconversion emission bands and their transition assignments are summarized in Figure 15a. Five intense bands are observed at 489, 546, 586, 621, and 659 nm. The first four are assigned to Tb3+ transitions (5D4→7F6, 7F5, 7F4, and 7F3), while the 659 nm band corresponds to the 5F5→5I8 transition of Ho3+. Two weaker violet emissions at 414 and 436 nm are also attributable to Tb3+ [63].
Figure 15.
Author-created summary of the upconversion behavior of Yb3+/Tb3+/Ho3+-doped precursor glasses and the corresponding GC600 glass-ceramic under 980 nm excitation: (a) principal Tb3+ and Ho3+ emission bands and their transition assignments; (b) qualitative effects of Tb4O7 content and crystallization, showing the maximum overall UC response at x = 1.0 mol%, concentration quenching at x = 1.2 mol%, weakening of the Ho3+ 659 nm emission with increasing x, and enhanced emission following the conversion of PG into GC600. The wavelengths, assignments, and qualitative trends are summarized from Ref. [63].
Among the four nominal Tb4O7 contents investigated, the strongest UC emission is observed for the sample with x = 1.0 mol%. Beyond this level, concentration quenching sets in and the Tb3+-related emission intensity declines. Concurrently, the Ho3+ emission intensity progressively decreases as the Tb3+ content rises from 0.6 to 1.2 mol%, which suggests a Ho3+ → Tb3+ energy-transfer pathway [63]. These qualitative composition-dependent trends are summarized in Figure 15b.
In comparison with the PG precursor, the GC600 sample derived from the same composition (x = 1.0 mol%) exhibits a substantially enhanced UC emission, as summarized in Figure 15b. This enhancement was attributed to the crystallization of NaZnPO4 nanocrystals with low phonon energy, which effectively suppresses non-radiative multiphonon relaxation and thereby promotes radiative transitions [63].
5.2.2. Two-Photon Excitation Process for the UC Emission
The log–log-plotted UC emission intensities (IUC) vs. pump power (P) in the GC600 sample suggest that the slopes are 1.57 for the 546 nm green band (Tb3+: 5D4 → 7F5) and 1.42 for the 659 nm red band (Ho3+: 5F5 → 5I8). The log–log plot indicates that IUC is proportional to Pn with n = 2, where n stands for the number of photons necessary to generate the UC emission, suggesting that a two-photon energy-transfer process with two 980 nm photons is involved to populate the 5D4 state of Tb3+ and also to populate the 5F5 state of Ho3+. The proposed Yb3+-sensitized pathways that populate the Tb3+ 5D4 and Ho3+ 5F5 emitting states are summarized in the author-created energy-level scheme shown in Figure 16.
Figure 16.
Author-created energy-level scheme illustrating Yb3+-sensitized Tb3+/Ho3+ upconversion under 980 nm excitation, including ground-state absorption (GSA), energy transfer (ET), energy-transfer upconversion (ETU), excited-state absorption (ESA), cross-relaxation (CR), non-radiative relaxation, and the principal Tb3+ and Ho3+ emissions. The proposed pathways and emission assignments are summarized from Ref. [63].
6. Comparative Analysis of Crystallization Mechanisms Across Yb3+-Containing Glass Families
6.1. CaF2 Nanocrystallization in Oxyfluoride Glasses
A glass of composition 47.4SiO2-19Al2O3-28.4CaF2-2TbF3-3.2YbF3 (mol%) was fabricated by melting a homogeneous powder mixture of the constituent oxides and fluorides in a covered Pt-Rh crucible at 1400 °C for 1 h in air [64]. The resulting melt was cast onto a steel plate, covered with another plate, and left to cool gradually to ambient temperature.
The as-quenched product was fully amorphous, as expected for this glass-forming system. Subjecting it to a thermal treatment at 660 °C for 2 h triggered crystallization, producing a glass-ceramic in which CaF2 nanocrystals were detected by XRD [64]. The corresponding transformation from the amorphous precursor to the CaF2-containing glass-ceramic is summarized schematically in Figure 17. Undoped versions of the glass remained amorphous after quenching and could also be crystallized upon heating but only at temperatures some 42 °C higher than their Tb/Yb-containing counterpart. This difference demonstrates that the introduction of TbF3 and YbF3 effectively promotes crystallization at lower temperatures.
Figure 17.
Author-created schematic summarizing the heat-treatment-induced formation of CaF2 nanocrystals in Tb3+/Yb3+-doped oxyfluoride glass at 660 °C for 2 h. The reported apparent activation energy, Ea ≈ 498 kJ mol−1, and Avrami exponent, n ≈ 1.01, indicate diffusion-controlled crystal growth. The kinetic parameters, phase assignment, and crystallization-temperature trend are summarized from Refs. [39,64].
The crystallization kinetics were investigated by DSC, which yielded an apparent activation energy of ~498 kJ/mol and an Avrami exponent of n = 1.01. These values point toward a diffusion-governed growth regime, with crystallites adopting needle- and plate-like morphologies of limited length. Figure 17 summarizes both the reported kinetic descriptors and the heat-treatment-induced phase evolution, while transmission electron microscopy provided independent confirmation of the CaF2 nanocrystalline phase within the glass-ceramic matrix [64].
6.2. Cluster-Assisted Formation of Multicomponent Fluoride Phases
6.2.1. Ca–Yb Fluoride Solid Solutions
The incorporation of Yb2O3 into NaF-CaF2-Al2O3-SiO2 glass does more than simply introduce an optically active ion. The trivalent cation can interact with fluoride-rich regions, maintain charge balance via local structural modifications, and be incorporated into a CaF2-derived lattice. This dual function—acting as a network modifier prior to crystallization and as a lattice constituent afterward—accounts for the observed dependence of the apparent activation energy and the resulting phase assemblage on Yb content [65].
Within the composition series examined, heat treatment yielded CaF2-related crystalline phases along with a Ca0.8Yb0.2F2.2 solid solution, with grain sizes in the range of 10–20 nm [65]. The apparent activation energy decreased monotonically with increasing Yb3+ loading. Because the crystalline product incorporates Yb, this trend is consistent with the idea that Yb-rich fluoride environments serve as precursors to the solid-solution phase.
This finding should not be overinterpreted as evidence that Yb3+ universally accelerates crystallization. Higher Yb content also modifies network connectivity, charge compensation mechanisms, and liquidus relationships. Disentangling catalytic nucleation from a shift in equilibrium phase stability requires compositionally matched series, quantitative phase-fraction analysis, and the local structural characterization of Yb prior to crystallization.
A related but lead-free example is provided by Yb3+/Er3+-codoped fluoro-borosilicate glasses, in which the partial replacement of SiO2 by B2O3 modifies the oxide–fluoride network and improves the selectivity of rare-earth-fluoride nanocrystallization [75]. In this system, Yb3+ acts not only as an optical sensitizer but also as a component of the precipitated KYb2F7 and KYb3F10 phases. The resulting phase evolution therefore provides direct evidence that rare-earth concentration, glass-network composition, and heat-treatment temperature jointly determine the identity of the nanocrystalline phase.
6.2.2. Yb3+-Induced Rare-Earth-Fluoride Nanocrystallization in Fluoro-Borosilicate Glasses
An open-access example that demonstrates the coupled effects of glass composition, Yb3+ addition, and heat-treatment temperature was reported for nominal (60 − x)SiO2–xB2O3–20KF–20ZnF2 glasses (x = 0–40 mol%) [75]. YbF3 and ErF3 were introduced to provide 1.0 mol% Yb3+ and 0.2 mol% Er3+, respectively. Partial substitution of B2O3 for SiO2 reduced the glass-preparation temperature and altered the competition between the fluoride phases precipitated during subsequent heat treatment.
The nominal 40SiO2–20B2O3–20KF–20ZnF2 composition, denoted as 40Si–20B, exhibited a particularly clear temperature-dependent phase evolution. As shown in Figure 18, the precursor glass displayed only a broad amorphous-scattering feature. After heat treatment at 460 and 500 °C for 10 h, the diffraction peaks were assigned predominantly to KYb2F7. Additional KYb3F10 reflections appeared after treatment at 540 °C, whereas KYb3F10 became the dominant detectable phase after treatment at 580 °C [75]. Thus, increasing the treatment temperature changed not only the extent of crystallization but also the identity of the Yb-containing fluoride phase.
Figure 18.
XRD patterns of the 1.0 mol% Yb3+/0.2 mol% Er3+-codoped 40Si–20B precursor glass and nanocrystallized glass-ceramics heat-treated at 460–580 °C for 10 h, showing the temperature-dependent evolution from KYb2F7 to KYb3F10. Adapted from Ref. [75] under the Creative Commons Attribution 4.0 International License (CC BY 4.0). Original Figure 2c of Ref. [75] was reformatted for presentation, and its panel designation was omitted; the underlying diffraction data were not altered.
Transmission electron microscopy of the sample treated at 580 °C showed nanocrystals approximately 5–30 nm in diameter that were dispersed within the residual glass matrix [75]. The reported lattice-fringe spacing of approximately 0.204 nm was assigned to the (440) plane of KYb3F10, providing microscopic support for the XRD phase assignment.
These results illustrate a dopant-associated crystallization pathway in which Yb3+ participates directly in the precipitated fluoride phases. Nevertheless, the simultaneous detection of a Yb-containing crystalline phase and enhanced luminescence does not establish the fraction of the total Yb3+ population incorporated into the nanocrystals. Quantitative phase analysis, spatially resolved compositional mapping, and site-selective spectroscopy would still be required to determine the partitioning of Yb3+ and Er3+ between the nanocrystals and the residual glass.
6.2.3. Spectroscopic Consequences of Network Modification and Nanocrystallization
A complementary view of the sensitivity of Yb3+ to the surrounding glass network is provided by the xTiO2–(60−x)GeO2–30BaO–9.5Ga2O3–0.5Yb2O3 system, where x ranges from 0 to 50 mol% [76]. XRD confirmed that all investigated compositions remained amorphous. Figure 19 shows the characteristic Yb3+ absorption associated with the 2F7/2 → 2F5/2 transition. A resolved feature near 976 nm is observed, while the band shape and spectral distribution vary with the GeO2/TiO2 ratio.
Figure 19.
Absorption spectra of Yb3+-doped titanate–germanate glasses with different GeO2/TiO2 molar ratios, including the characteristic Yb3+ 2F7/2 → 2F5/2 absorption near 976 nm. Adapted from Ref. [76] under the Creative Commons Attribution 4.0 International License (CC BY 4.0); original Figure 3a was reformatted for presentation, and its panel designation was omitted; the underlying spectral data were not altered.
The composition-dependent absorption profiles indicate that modification of the titanate–germanate network changes the distribution of local ligand fields and Stark components experienced by Yb3+. However, because all these samples remain XRD-amorphous, the spectral changes should not be interpreted as evidence of Yb3+ incorporation into a crystalline phase. Absorption spectroscopy is sensitive to the average Yb3+ environment, but it is not intrinsically phase-selective. Claims of Yb3+ partitioning into nanocrystals therefore require complementary diffraction, microscopy, lifetime, or site-selective spectroscopic evidence.
The spectroscopic consequences of controlled nanocrystallization can be evaluated more directly in the Yb3+/Er3+-codoped 40Si–20B fluoro-borosilicate system discussed above. Under 980 nm excitation, the precursor glass exhibits only weak upconversion emission, whereas the heat-treated samples show distinct Er3+ emission bands near 522, 540, and 650 nm, corresponding to the 2H11/2 → 4I15/2, 4S3/2 → 4I15/2, and 4F9/2 → 4I15/2 transitions, respectively [75].
As shown in Figure 20, the upconversion-emission intensity increases as the heat-treatment temperature rises from 460 to 580 °C. This enhancement occurs concurrently with the phase evolution from KYb2F7 to KYb3F10 identified by XRD. The low-phonon-energy fluoride environment reduces multiphonon relaxation and facilitates Yb3+-to-Er3+ energy transfer, providing a chemically plausible explanation for the enhanced green and red emissions.
Figure 20.
Upconversion emission spectra of the 1.0 mol% Yb3+/0.2 mol% Er3+-codoped 40Si–20B precursor glass and nanocrystallized glass-ceramics heat-treated at 460–580 °C for 10 h under 980 nm excitation. Adapted from Ref. [75] under the Creative Commons Attribution 4.0 International License (CC BY 4.0). Original Figure 3a was reformatted for presentation, and its panel designation was omitted; the underlying emission data were not altered.
The combined XRD and luminescence results establish a correlation between rare-earth-fluoride nanocrystallization and upconversion enhancement. Nevertheless, emission intensity is also affected by pump absorption, sample thickness, scattering, crystalline fraction, and the spatial distribution of the activator. Consequently, the stronger emission should not, by itself, be treated as a quantitative measurement of the fraction of Er3+ or Yb3+ incorporated into the crystalline phase.
6.2.4. Yb3+-Modified ZnAl2O4 Nanocrystals
In 58SiO2-16[(1 − x%)Al2O3 + x%Yb2O3]-15ZnO-7Li2O-4TiO2-0.2Sb2O3 glasses, ZnAl2O4 nanocrystals were already detectable in the Yb-free composition after quenching, and heat treatment at 720 °C further developed the phase [102]. AsYb2O3 replaced Al2O3, Yb3+ entered the spinel-related nanocrystals, and the reported symmetry changed from toward .
This system is a counterexample to a simple nucleating-agent narrative: crystallization occurs without Yb3+, while Yb substitution modifies the structure of an existing crystallization pathway. The relevant role of Yb3+ is therefore phase modification and site substitution rather than the initiation of nucleation. A composition series measuring nucleation density and phase fraction would be needed to determine whether Yb also changes the rate.
6.3. What Promotes Heterogeneous Nucleation?
A constituent can promote nucleation by creating a compositionally distinct region, lowering the crystal–glass interfacial energy, increasing the thermodynamic driving force for a particular phase, or changing mobility. These mechanisms must be distinguished from merely observing that a phase appears after the constituent is added. In a multicomponent glass, the effective nucleating species may be a cluster or separated nanophase rather than the nominal oxide itself.
The SiO2-Li2O-K2O-ZnO-P2O5 series provides a useful control [103]. Increasing P2O5 changes the balance between surface and volume crystallization and produces phosphate-rich precursors that favor fine-grained lithium disilicate microstructures. The effect is associated with glass-network reorganization, phase separation, and interfacial energetics.
For Yb3+ systems, the available studies collectively suggest three recurring routes: (i) Yb/F-rich clustering before a Yb-bearing fluoride phase; (ii) Yb3+ substitution into a phase that already nucleates in the host; and (iii) Yb-induced network changes that alter viscosity or phase competition without placing most Yb3+ in the crystals. Distinguishing these routes requires in situ thermal/diffraction measurements, TEM, Raman spectroscopy, and element-specific local-structure probes [2,3,4,5,6,7,8,10,11,12,13,94,97,98,99].
6.4. Additional Mechanistic Evidence from Recent Yb3+-Containing Glass-Ceramics
Several mechanistic studies beyond the core case studies sharpen the interpretation of Yb-containing systems. Lin et al. showed that amorphous phase separation can predetermine fluoride-rich regions that later crystallize, while Bhattacharyya et al. and Bocker et al. demonstrated that growth may become self-limited or interface-controlled when crystallization changes the composition and viscosity of the surrounding glass [37,38,39]. Zhao et al. connected fluoride-rich domains to nanocrystal formation using solid-state NMR, STEM-EDS, and molecular-dynamics simulation [40]. These studies support phase separation as a plausible precursor, but they also show that phase-separated domains should not be equated with crystals unless diffraction or lattice imaging confirms the long-range order.
Ali et al. found that enhanced Er3+/Yb3+ upconversion after CaF2 precipitation was associated with increased structural ordering and changed local symmetry rather than requiring complete migration of the rare-earth ions into the fluoride crystals [41]. A related Yb3+/CaF2 germanotellurite study detected 8–10 nm nanocrystallites, but the amount and site occupancy of Yb3+ remained only partly constrained [42]. Collectively, these reports reinforce the need to combine optical spectra with direct chemical mapping or element-selective local-structure measurements.
Yb-only phosphate systems provide a useful control because sensitizer-to-activator transfer is absent. Sen et al. showed that Al2O3/Y2O3 additions strengthen the phosphate network, slightly slows crystallization, and favor surface crystallization, while precipitation of a Yb-containing phosphate phase changes the 2F5/2 lifetime and emission bandwidth [43]. Hongisto et al. obtained transparent NaYbP2O7-containing glass-ceramics only in selected NaF-free compositions and showed that NaF redirects bulk crystallization toward surface crystallization [44]. Their later composition study demonstrated that Al2O3, TiO2, or ZnO shifts the phase assemblage toward Na5P3O10 and suppresses Yb-containing phosphate phases [49]. These results indicate that network connectivity and modifier/intermediate balance can dominate over Yb concentration in determining phase selection.
Optical-refrigeration studies add quantitative criteria that are often absent from upconversion reports. de Lima Filho et al. found that the cooling figure of merit depends non-monotonically on the degree of crystallization [45]. Fiber and bulk studies subsequently linked performance to photoluminescence quantum efficiency, background absorption, OH− content, scattering, temperature, and Yb3+ concentration [46,47,48]. These reports are particularly valuable because they measure absolute or near-absolute optical quantities; however, crystalline fraction and Yb partition coefficients should be linked more systematically to the measured cooling response.
Recent fluorosilicate and oxyfluoroborosilicate studies show that Yb3+ can be an active phase-forming constituent. Jamalaiah reported CaF2-containing Yb3+ glass-ceramics with useful 981 nm emission [50], while Fang et al. and Li et al. demonstrated controllable KYb3F10 precipitation and enhanced activator emission [51,53]. Long et al. used phase-separated fluoride-rich regions to alter activator distribution before crystallization [52]. The competitive formation of NaYbF4 and Na3ScF6 further shows that the Na/F ratio and competing-cation chemistry determine whether Yb enters the selected fluoride phase [60]. Xiang et al. extended this strategy by using B2O3 to lower the processing temperature and regulate KZnF3/KYb3F10 nanocrystallization [61]. These studies provide stronger evidence for Yb-induced phase selection than studies based only on DSC shifts, although such claims still require matched Yb-free controls and direct compositional mapping.
Ba4Y3F17, Ba3Gd2F12, ZnAl2O4, YOF, and GdOF glass-ceramics demonstrate that improved thermometric response can arise through lower phonon energy, changed site symmetry, crystallization-enhanced lifetime, or modified thermal coupling [54,55,56,57,58]. These studies report useful phase assignments and sensitivities, but application-level comparison remains difficult because excitation density, sample thickness, crystalline fraction, thermal cycling, and absolute quantum yield are not standardized. Pump-power-dependent measurements are especially important because the apparent fluorescence-intensity ratio and sensitivity may change when the upconversion pathway approaches saturation [57].
Finally, Blanc et al. demonstrated that nanoparticle composition can evolve before easily detectable crystallization [59]. This observation explains why early amorphous segregation may change the Yb3+ environment without producing sharp XRD peaks and provides a mechanistic link between glass-network heterogeneity and later phase selection. Taken together, the additional literature strengthens three conclusions: pre-nucleation segregation must be distinguished from crystallization; Yb3+ partitioning requires direct evidence; and optical enhancement should be evaluated together with crystalline fraction, transparency, lifetime, and absolute efficiency.
7. Composition Dependence: When Does Yb2O3 Promote or Suppress Crystallization?
Claims about the effect of Yb2O3 are often based on different base compositions, replacement schemes, and thermal protocols. A lower Tp in one glass and an amorphous XRD pattern in another are not contradictory unless the host network and phase field are comparable. The strongest evidence comes from a composition series in which Yb2O3 replaces a specified component while all other variables are fixed.
7.1. Yb-Free Barium–Zinc Borosilicate Kinetic Baseline
The crystallization kinetics of a barium–zinc borosilicate glass with the molar composition 40BaO-20ZnO-30B2O3-10SiO2 were examined using the Kissinger, Ozawa, and Augis–Bennett formalisms under non-isothermal conditions to determine the activation energy (Ec) and Avrami exponent (n) [10,11,12,13,70]. These non-isothermal approaches are commonly employed to elucidate crystallization mechanisms, distinguish between surface- and volume-dominated crystallization, and assess the relative crystallizability of different glass compositions [10,11,12,13].
For the first exothermic event, the local activation energy Ec(χ) fell from ~700 to ~500 kJ/mol as the crystallized fraction (χ) increased from 0.1 to 0.9. By contrast, the second exothermic peak exhibited a slight increase in Ec(χ), from ~490 to ~570 kJ/mol, over the same χ range. The corresponding Avrami exponent n(χ) rose from ~1 to ~1.4 for the first peak, while it declined from ~1.7 to ~1.4 for the second peak. SEM observations of sintered samples revealed that crystallization begins at the particle surfaces, with lamellar crystallites growing inward at elevated temperatures, accompanied by quasi-spherical nano-sized crystallites. The dependence of the local activation energy on the crystallized fraction suggests that the overall process involves multiple kinetic steps during sintering and crystallization.
7.2. Yb2O3-Doped Barium Titanium Borate Glasses
The composition dependence of the parent-glass structure can be illustrated using the open-access Yb2O3-doped barium titanium borate system reported by Marzouk et al. [77]. The investigated compositions were 54.250B2O3–8.320TiO2–37.430BaO for the undoped glass and related compositions containing 0.258, 0.769, and 1.275 mol% Yb2O3.
The XRD patterns shown in Figure 21 contain broad amorphous-scattering features without sharp Bragg reflections, confirming that all four as-prepared samples remained non-crystalline. The structural and physical trends discussed for this series therefore describe the modification of the parent-glass network rather than the development of a glass-ceramic phase.
Figure 21.
XRD spectra of Yb3+-doped barium titanium borate glasses containing 0–1.275 mol% Yb2O3; the broad amorphous-scattering features confirm the absence of detectable long-range crystalline order. Reproduced from Ref. [77] under the Creative Commons Attribution 4.0 International License (CC BY 4.0).
As shown in Figure 22, the measured density increased from 3.652 to 3.761 g cm−3 as the Yb2O3 content increased. The molar volume changed non-monotonically: it initially decreased from 27.875 to 27.784 cm3 mol−1 and subsequently increased to approximately 28.06 cm3 mol−1 at the highest Yb2O3 concentration [77]. Consequently, the density increase should not be interpreted simply as uniform network compaction; both the larger molar mass of Yb2O3 and composition-dependent changes in network packing contribute to the observed behavior.
Figure 22.
Density and molar volume of Yb3+-doped barium titanium borate glasses as functions of Yb2O3 content. Reproduced from Ref. [77] under the Creative Commons Attribution 4.0 International License (CC BY 4.0).
Raman and FTIR measurements showed that Yb2O3 addition modified the distributions of BO3 and BO4 structural units. A characteristic broad Yb3+ absorption band near 977 nm, assigned to the 2F7/2 → 2F5/2 transition, became more intense with increasing Yb2O3 content. Over the same composition range, the optical band gap decreased from approximately 3.198 to 3.115 eV, whereas the calculated linear refractive index increased from approximately 2.346 to 2.367 [77].
These results confirm that Yb2O3 acts as an optically and structurally active component even when no crystalline phase is detected. However, the amorphous XRD patterns do not establish whether Yb2O3 promotes or suppresses subsequent crystallization. Resolving that question would require a matched heat-treatment series supported by DSC, quantitative XRD, and electron-microscopy measurements. The present results should therefore be interpreted as evidence for the composition-dependent modification of the precursor-glass network rather than direct evidence of Yb-induced nucleation.
8. Multiphase Crystallization and Phase Competition
8.1. Phosphate–Fluoride Glass
Yb3+-doped phosphate glasses with compositions (100 − x)(0.75NaPO3-0.25CaF2)-xYb2O3, with x = 3.0, were synthesized by a standard melt-quenching technique followed by a two-step thermal treatment [68]. The glass was first heat-treated at 320 °C, above the Tg (glass-transition temperature), and then heated at temperatures between 400 and 440 °C, corresponding to the crystallization range [68]. This system is useful for examining multiphase crystallization in phosphate–fluoride glasses containing Yb3+ [3,10,11,12,13,68].
The temperature-dependent phase evolution reported for the Yb3+-doped phosphate–fluoride glass is summarized schematically in Figure 23. Experimental XRD results reported in Ref. [68] showed that the as-prepared glass exhibited broad amorphous-scattering features without detectable sharp Bragg reflections. Heat treatment at 400 °C, close to the onset crystallization temperature (Tx), resulted in the preferential precipitation of CaF2. When the heat-treatment temperature was increased to approximately 450 °C, near the reported crystallization-peak temperature (Tp = 452 °C), additional reflections assigned to NaPO3 and Na2Ca2(P2O7)F2 appeared, indicating multiphase crystallization [68]. A similar crystallization sequence has been reported for Er3+-doped glasses in the same system, in which CaF2 precipitated before the phosphate-containing phases [104]. SEM observations further supported the formation of crystalline domains. The lower traces in Figure 23 are qualitative diffraction signatures intended to illustrate the reported phase evolution and should not be interpreted as experimental XRD patterns.
Figure 23.
Author-generated schematic of the temperature-dependent crystallization pathway in Yb3+-doped phosphate–fluoride glass. (a) The as-prepared glass exhibits an amorphous structure; (b) CaF2 precipitates preferentially after heat treatment at 400 °C; and (c) additional NaPO3 and Na2Ca2(P2O7)F2 phases emerge near 450 °C, resulting in multiphase crystallization. The lower traces are qualitative diffraction signatures rather than experimental XRD patterns. The phase evolution is summarized based on Refs. [43,68].
SEM observations indicate that crystallization occurs throughout the glass volume when heat treatment is performed near Tx, and the resulting crystals are approximately spherical. Elemental mapping identifies these crystals as CaF2, consistent with the XRD analysis. Increasing the heat-treatment temperature increases the number of crystals while reducing their average size. Yb3+ remains broadly distributed throughout the material, suggesting that part of the Yb3+ population is incorporated into the CaF2 crystals while the remainder stays in the residual glass matrix. Phosphate-rich crystals were not observed in SEM images of the sample treated at 450 °C, although they were detected by XRD, suggesting preferential surface crystallization. The emission spectra further indicate that CaF2 precipitation has little effect on the Yb3+ near-infrared 2F5/2 → 2F7/2 emission, whereas formation of NaPO3 and Na2Ca2(P2O7)F2 substantially reduces the emission intensity.
8.2. Ytterbium Aluminosilicate Glass
The 15Yb2O3-25Al2O3-60SiO2 system represents the opposite composition limit: Yb2O3 is a major constituent rather than a dilute additive [69,85,97,105,106,107]. The as-prepared bulk glass combines a high Tg (847 °C), low room-temperature thermal conductivity, and substantial mechanical strength. At 1200 °C, it crystallizes into Yb3Al5O12, Yb2Si2O7, and Al6Si2O13.
The formation of two Yb-bearing phases demonstrates that Yb3+ can be incorporated directly into the crystalline assemblage when its concentration is high. Phase selection is governed by the Yb2O3–Al2O3–SiO2 stoichiometry and heat treatment, not by a generic “Yb nucleating-agent” effect. Competing phases also mean that a single optical or mechanical trend cannot be assigned to one crystal without quantitative phase analysis.
Rare-earth aluminosilicate glasses are of interest for plasma-resistant components because rare-earth fluorides formed at exposed surfaces can have low volatility [69,105]. This application is relevant to the stability of the material but is secondary to the crystallization mechanism. The present review therefore retains only the composition–phase–property connection and removes the extended semiconductor-processing description.
The phosphate–fluoride and aluminosilicate cases define two ends of a design spectrum. At low Yb content, Yb3+ may partition only partly into an early fluoride nanophase; at high content, several Yb-rich oxide phases can consume most of the glass. Between these limits, controlling phase competition is more important than maximizing a nominal nucleation rate.
8.3. Integrated Roles of Yb3+ in Crystallization and Luminescence
The preceding examples demonstrate that Yb3+ cannot be assigned a single universal function in glasses and glass-ceramics. Depending on the parent-glass composition, Yb3+ concentration, local coordination environment, codopants, and heat-treatment schedule, it may act as a glass-network modifier, participate in nucleation precursors, serve as an optical sensitizer, or function as an emitting center and a component of Yb-rich clusters. These four composition-dependent roles and their relationships with crystallization and luminescence are summarized in Figure 24.
Figure 24.
Schematic summary of the four major roles of Yb3+ in crystallization and luminescence of glasses and glass-ceramics: network modifier, participant in nucleation precursors, sensitizer, and activator/cluster center. The same Yb3+ component can therefore influence both phase formation and optical response, depending on glass composition, local coordination, clustering, and heat-treatment schedule.
As a glass-network modifier, Yb3+ can alter the connectivity and packing of the parent-glass network. Its relatively high field strength and coordination requirements may change the population of non-bridging oxygen atoms, modify the association of fluoride or phosphate species, and influence viscosity, density, and the thermal stability window. However, the direction and magnitude of these changes depend on the host network. Yb2O3 may depolymerize one glass network while strengthening or stabilizing another; therefore, it should not be assumed to exert the same structural effect in silicate, phosphate, borate, and oxyfluoride glasses [43,44,49,65,87,88].
Yb3+ may also participate in the formation of nucleation precursors when it becomes enriched in modifier-rich, fluoride-rich, or phosphate-rich regions. If the local composition and coordination of these regions resemble those of the emerging crystalline phase, the effective crystal–glass interfacial barrier may be reduced, and nucleation may become more favorable. This behavior is particularly relevant when Yb3+ can enter CaF2-related solid solutions or form Yb-containing phases such as Pb4Yb3F17, Yb3Al5O12, or Yb2Si2O7. Conversely, when Yb3+ stabilizes the residual glass, increases configurational disorder, or is incompatible with the initially precipitating phase, it may slow crystallization or redirect the process toward competing crystalline phases. Yb3+ should therefore be described as a composition-dependent participant in nucleation rather than as a universal nucleating agent [37,38,39,40,41,42,43,44,50,51,52,53,59,60,61,64,65,66,67,68,69,102].
The third role is optical sensitization. Yb3+ efficiently absorbs near-infrared radiation in the approximately 900–1000 nm range through the 2F7/2 → 2F5/2 transition and can subsequently transfer excitation energy to neighboring activator ions such as Er3+, Ho3+, or Tb3+. Controlled incorporation of Yb3+ and the activator into a low-phonon-energy crystalline phase may reduce non-radiative relaxation and enhance upconversion emission. Nevertheless, stronger steady-state emission does not by itself prove that Yb3+ has entered the nanocrystals, because heat treatment can also change pump absorption, scattering, activator–sensitizer distances, and the composition of the residual glass [18,19,20,41,51,52,53,54,55,56,57,58,62,63,64,65,66,67].
Finally, Yb3+ can itself act as an optically active center through the 2F5/2 → 2F7/2 near-infrared emission. At higher local concentrations, neighboring Yb3+ ions may form pairs or clusters that support cooperative luminescence. Such aggregation can be beneficial when cooperative emission is the desired function, but it may also enhance energy migration, cross-relaxation, and concentration quenching. The optimal Yb3+ concentration is therefore determined by a balance among pump absorption, rare-earth partitioning, inter-ionic distance, multiphonon relaxation, and clustering [18,19,20,50,51,52,53,87,88,89,90].
The four roles shown in Figure 24 are not independent. Network modification can create compositionally distinct precursor regions; these regions may subsequently nucleate Yb-containing nanocrystals; crystallization then redistributes Yb3+ and codoped activators between the crystalline phases and the residual glass; and this redistribution changes both energy-transfer efficiency and concentration-quenching behavior. Accordingly, composition and heat treatment must be optimized jointly. A reliable interpretation requires thermal analysis, phase identification, microscopy, local-structure measurements, and quantitative optical characterization to follow the same Yb3+ population from the parent glass to the final glass-ceramic.
9. Conclusions
The surveyed evidence supports a conditional, rather than universal, picture of Yb3+-controlled crystallization. Yb3+ can promote fluoride-rich precursor formation, enter CaF2-related or Pb4Yb3F17 nanocrystals, substitute into spinel- or oxyapatite-related lattices, or remain largely in the residual glass while modifying its network and viscosity. Which role dominates is determined by the parent composition, Yb3+ concentration, charge-compensation chemistry, and thermal schedule.
9.1. Practical Design Guidelines
First, define the target phase and the intended Yb3+ site before selecting a heat treatment. A fluoride nanophase designed to host Yb3+/Er3+ requires different precursor chemistry from an oxide glass intended to crystallize Yb3Al5O12. Phase diagrams and chemically plausible oxidation states should constrain the proposed pathway.
Second, separate nucleation from growth experimentally. Use multiple heating rates to estimate apparent kinetics, then arrest samples across each thermal event and correlate DSC/DTA with XRD, TEM, and Raman measurements. An Avrami exponent or a ΔT value should be treated as supporting evidence rather than a stand-alone mechanism.
Third, optimize a multi-objective response. Crystal fraction and luminescence should be evaluated together with transmission, size distribution, and thermal stability. The best glass-ceramic is commonly obtained before the strongest XRD peak or longest anneal, because coarsening and secondary phases can reduce optical performance.
Fourth, determine where Yb3+ resides. Steady-state emission enhancement is not sufficient proof of incorporation. EXAFS/XANES, site-selective spectroscopy, lifetime components, elemental mapping, or another direct/quantitative method should be used to distinguish crystal-hosted Yb3+ from clusters and residual-glass sites [98,100,101].
Fifth, report negative and non-monotonic results. A composition in which Yb2O3 suppresses a phase, shifts the crystallization peak upward, or preserves an amorphous structure is mechanistically valuable. Such data reveal the boundary between nucleation promotion, network stabilization, and phase competition.
For codoped systems, optical optimization also requires control of Yb-Yb and Yb-Ln distances. Increasing Yb3+ can not only improve pump absorption but also strengthen clustering, cooperative luminescence, cross-relaxation, or concentration quenching. Composition and heat treatment must therefore be designed jointly.
A minimum comparative dataset should include the complete parent-glass composition, replacement basis, Tg/Tx/Tp at specified heating rates, nucleation and growth schedules, phase identity, crystalline fraction, image-based size distribution, Yb3+ partitioning, transmission, lifetime, absolute quantum efficiency, and stability after repeated thermal exposure.
9.2. Unresolved Questions and Reporting Priorities
The largest unresolved question is the identity of the earliest Yb-associated precursor. Fluoride-rich clusters, phosphate-rich domains, and modifier-related non-bridging-oxygen environments are frequently inferred but rarely observed before XRD-detectable crystals form. In situ total scattering, synchrotron X-ray absorption, small-angle scattering, and high-resolution microscopy on time-resolved samples could close this gap.
A second gap is comparability. Activation energies obtained by different non-isothermal methods are often compared without confirmation of identical transformed fractions or phase pathways. Community reporting of raw thermal curves, fitting intervals, uncertainty, and phase evolution would make cross-study comparisons more defensible.
A third gap is quantitative structure–optical correlation. Many studies report relative intensity enhancement but omit absorbed pump power, lifetime, quantum efficiency, and crystalline fraction. Without these quantities, it is difficult to determine whether crystallization improved intrinsic radiative efficiency or merely changed absorption and scattering.
Finally, environmental and manufacturing constraints should enter materials selection early. Lead- and cadmium-containing oxyfluoride systems offer clear mechanistic examples but present volatility and toxicity concerns. Lead-free compositions, scalable heat treatments, reproducible nanocrystal distributions, and long-term optical stability are necessary for translation.
In summary, Yb3+ is best viewed as a composition-dependent participant in a coupled glass-network, crystallization, and energy-transfer system. Treating it only as an optical dopant or universally as a nucleating agent obscures the central mechanism. Progress will come from measurements that follow the same Yb population from the parent glass, through the precursor stage, into the final crystal and residual matrix.
The revised framework turns the available case studies into testable design rules while making the limitations explicit. It also explains why nominally conflicting effects of Yb2O3 can coexist across glass families: the host network determines whether Yb3+ lowers an interfacial barrier, alters mobility, enters the product phase, or stabilizes the amorphous state.
Author Contributions
Conceptualization, X.Q. and T.T.; methodology, X.Q.; validation, X.Q., X.Y., Z.Q. and T.T.; formal analysis, X.Q. and X.Y.; investigation, X.Q., X.Y. and Z.Q.; resources, X.Q. and T.T.; data curation, X.Q. and Z.Q.; writing—original draft preparation, X.Q.; writing—review and editing, X.Q., X.Y., Z.Q. and T.T.; visualization, X.Q. and Z.Q.; supervision, X.Q., T.T.; project administration, X.Q.; funding acquisition, X.Q. All authors have read and agreed to the published version of the manuscript.
Funding
This research was funded by the Suzhou University of Technology Talent Start-up Fund and the National Natural Science Foundation of China, grant number 62375028. The APC was funded by Suzhou University of Technology.
Data Availability Statement
No new data were created or analyzed in this study. Data sharing is not applicable to this article.
Acknowledgments
One of the authors (T.T.) thanks Zhejiang University for its kind support for the present study. During the preparation of this manuscript, the authors used ChatGPT (GPT-5.6 Sol, OpenAI, San Francisco, CA, USA) to assist with language refinement and the graphical redrawing of selected schematic figures. The tool was not used to generate or alter experimental data. All scientific content, graphical elements, and interpretations were reviewed and approved by the authors, who take full responsibility for the published work.
Conflicts of Interest
The authors declare no conflict of interest.
References
- Jalali, P.; Li, M. Competing microstructure and crystalline phase formation and their roles in glass formability: A molecular dynamics study. Intermetallics 2004, 12, 1167–1176. [Google Scholar] [CrossRef] [Scilit]
- Höland, W.; Beall, G.H. Glass-Ceramic Technology, 2nd ed.; Wiley: Hoboken, NJ, USA, 2012. [Google Scholar] [CrossRef] [Scilit]
- Beall, G.H.; Pinckney, L.R. Nanophase glass-ceramics. J. Am. Ceram. Soc. 1999, 82, 5–16. [Google Scholar] [CrossRef] [Scilit]
- Stookey, S.D. Catalyzed crystallization of glass in theory and practice. Ind. Eng. Chem. 1959, 51, 805–808. [Google Scholar] [CrossRef] [Scilit]
- Mullin, J.W. Crystallization, 4th ed.; Butterworth-Heinemann: Oxford, UK, 2001. [Google Scholar]
- Doremus, R.H. Glass Science, 2nd ed.; Wiley: New York, NY, USA, 1994. [Google Scholar]
- Varshneya, A.K.; Mauro, J.C. Fundamentals of Inorganic Glasses, 3rd ed.; Elsevier: Amsterdam, The Netherlands, 2019. [Google Scholar] [CrossRef] [Scilit]
- Shelby, J.E. Introduction to Glass Science and Technology, 2nd ed.; Royal Society of Chemistry: Cambridge, UK, 2005. [Google Scholar]
- Contreras Jaimes, A.T.C.; Kirste, G.; Patzig, C.; de Souza e Silva, J.M.; Massera, J.; Karpukhina, N.; Hill, R.G.; de Pablos-Martín, A.; Brauer, D.S. Phosphate/silicate ratio allows for fine-tuning of bioactive glass crystallisation and glass-ceramic microstructure. Glass Eur. 2024, 2, 1–26. [Google Scholar] [CrossRef] [Scilit]
- Kissinger, H.E. Reaction kinetics in differential thermal analysis. Anal. Chem. 1957, 29, 1702–1706. [Google Scholar] [CrossRef] [Scilit]
- Ozawa, T. Kinetic analysis of derivative curves in thermal analysis. J. Therm. Anal. 1970, 2, 301–324. [Google Scholar] [CrossRef] [Scilit]
- Matusita, K.; Sakka, S. Study on crystallization kinetics in glass by differential thermal analysis. Thermochim. Acta 1979, 33, 351–354. [Google Scholar] [CrossRef] [Scilit]
- Matusita, K.; Sakka, S. Kinetic study on crystallization of glass by differential thermal analysis—Criterion on application of Kissinger plot. J. Non-Cryst. Solids 1980, 38–39, 741–746. [Google Scholar] [CrossRef] [Scilit]
- DeLoach, L.D.; Payne, S.A.; Chase, L.L.; Smith, L.K.; Kway, W.L.; Krupke, W.F. Evaluation of absorption and emission properties of Yb3+-doped crystals for laser applications. IEEE J. Quantum Electron. 1993, 29, 1179–1191. [Google Scholar] [CrossRef] [Scilit]
- Fan, T.Y. Heat generation in Nd:YAG and Yb:YAG. IEEE J. Quantum Electron. 1993, 29, 1457–1459. [Google Scholar] [CrossRef] [Scilit]
- Paschotta, R.; Nilsson, J.; Tropper, A.C.; Hanna, D.C. Ytterbium-doped fiber amplifiers. IEEE J. Quantum Electron. 1997, 33, 1049–1056. [Google Scholar] [CrossRef] [Scilit]
- Hönninger, C.; Paschotta, R.; Morier-Genoud, F.; Moser, M.; Keller, U. Ultrafast ytterbium-doped bulk lasers and laser amplifiers. Appl. Phys. B 1999, 69, 3–17. [Google Scholar] [CrossRef] [Scilit]
- Auzel, F. Upconversion and anti-Stokes processes with f and d ions in solids. Chem. Rev. 2004, 104, 139–174. [Google Scholar] [CrossRef] [Scilit] [PubMed]
- Pollnau, M.; Gamelin, D.R.; Lüthi, S.R.; Güdel, H.U.; Hehlen, M.P. Power dependence of upconversion luminescence in lanthanide and transition-metal-ion systems. Phys. Rev. B 2000, 61, 3337–3346. [Google Scholar] [CrossRef] [Scilit]
- Suyver, J.F.; Aebischer, A.; Biner, D.; Gerner, P.; Grimm, J.; Heer, S.; Krämer, K.W.; Reinhard, C.; Güdel, H.U. Novel materials doped with trivalent lanthanides and transition metal ions showing near-infrared to visible photon upconversion. Opt. Mater. 2005, 27, 1111–1130. [Google Scholar] [CrossRef] [Scilit]
- Haase, M.; Schäfer, H. Upconverting nanoparticles. Angew. Chem. Int. Ed. 2011, 50, 5808–5829. [Google Scholar] [CrossRef] [Scilit] [PubMed]
- Chen, G.; Qiu, H.; Prasad, P.N.; Chen, X. Upconversion nanoparticles: Design, nanochemistry, and applications in theranostics. Chem. Rev. 2014, 114, 5161–5214. [Google Scholar] [CrossRef] [Scilit] [PubMed]
- Bünzli, J.-C.G. Lanthanide luminescence for biomedical analyses and imaging. Chem. Rev. 2010, 110, 2729–2755. [Google Scholar] [CrossRef] [Scilit] [PubMed]
- Eliseeva, S.V.; Bünzli, J.-C.G. Lanthanide luminescence for functional materials and bio-sciences. Chem. Soc. Rev. 2010, 39, 189–227. [Google Scholar] [CrossRef] [Scilit] [PubMed]
- Wang, F.; Banerjee, D.; Liu, Y.; Chen, X.; Liu, X. Upconversion nanoparticles in biological labeling, imaging, and therapy. Analyst 2010, 135, 1839–1854. [Google Scholar] [CrossRef] [Scilit] [PubMed]
- Malhotra, K.; Hrovat, D.; Kumar, B.; Qu, G.; Van Houten, J.; Ahmed, R.; Piunno, P.A.E.; Gunning, P.T.; Krull, U.J. Lanthanide-doped upconversion nanoparticles: Exploring a treasure trove of NIR-mediated emerging applications. ACS Appl. Mater. Interfaces 2023, 15, 2499–2528. [Google Scholar] [CrossRef] [Scilit] [PubMed]
- Han, S.; Deng, R.; Xie, X.; Liu, X. Enhancing luminescence in lanthanide-doped upconversion nanoparticles. Angew. Chem. Int. Ed. 2014, 53, 11702–11715. [Google Scholar] [CrossRef] [Scilit] [PubMed]
- Wilhelm, S. Perspectives for upconverting nanoparticles. ACS Nano 2017, 11, 10644–10653. [Google Scholar] [CrossRef] [Scilit] [PubMed]
- Resch-Genger, U.; Gorris, H.H. Perspectives and challenges of photon-upconversion nanoparticles—Part I: Routes to brighter particles and quantitative spectroscopic studies. Anal. Bioanal. Chem. 2017, 409, 5855–5874. [Google Scholar] [CrossRef] [Scilit] [PubMed]
- Gorris, H.H.; Resch-Genger, U. Perspectives and challenges of photon-upconversion nanoparticles—Part II: Bioanalytical applications. Anal. Bioanal. Chem. 2017, 409, 5875–5890. [Google Scholar] [CrossRef] [Scilit] [PubMed]
- Zhou, J.; Liu, Q.; Feng, W.; Sun, Y.; Li, F. Upconversion luminescent materials: Advances and applications. Chem. Rev. 2015, 115, 395–465. [Google Scholar] [CrossRef] [Scilit] [PubMed]
- Liu, X.; Deng, R.; Zhang, Y.; Wang, Y.; Chang, H.; Huang, L.; Liu, X. Probing the nature of upconversion nanocrystals: Instrumentation matters. Chem. Soc. Rev. 2015, 44, 1479–1508. [Google Scholar] [CrossRef] [Scilit] [PubMed]
- Qin, X.; Xu, J.; Wu, Y.; Liu, X. Energy-transfer editing in lanthanide-activated upconversion nanocrystals: A toolbox for emerging applications. ACS Cent. Sci. 2019, 5, 29–42. [Google Scholar] [CrossRef] [Scilit] [PubMed]
- Cheng, X.; Tu, D.; Zheng, W.; Chen, X. Energy transfer designing in lanthanide-doped upconversion nanoparticles. Chem. Commun. 2020, 56, 15118–15132. [Google Scholar] [CrossRef] [Scilit] [PubMed]
- Xu, D.; Li, C.; Li, W.; Lin, B.; Lv, R. Recent advances in lanthanide-doped up-conversion probes for theranostics. Front. Chem. 2023, 11, 1036715. [Google Scholar] [CrossRef] [Scilit] [PubMed]
- Fu, L.; Engqvist, H.; Xia, W. Glass-ceramics in dentistry: A review. Materials 2020, 13, 1049. [Google Scholar] [CrossRef] [Scilit] [PubMed]
- Lin, C.G.; Bocker, C.; Rüssel, C. Nanocrystallization in oxyfluoride glasses controlled by amorphous phase separation. Nano Lett. 2015, 15, 6764–6769. [Google Scholar] [CrossRef] [Scilit] [PubMed]
- Bhattacharyya, S.; Bocker, C.; Heil, T.; Jinschek, J.R.; Höche, T.; Rüssel, C.; Kohl, H. Experimental evidence of self-limited growth of nanocrystals in glass. Nano Lett. 2009, 9, 2493–2496. [Google Scholar] [CrossRef] [Scilit] [PubMed]
- Bocker, C.; Rüssel, C.; Avramov, I. Transparent nanocrystalline glass-ceramics by interface-controlled crystallization. Int. J. Appl. Glass Sci. 2013, 4, 174–181. [Google Scholar] [CrossRef] [Scilit]
- Zhao, J.; Ma, R.; Chen, X.; Kang, B.; Qiao, X.; Du, J.; Fan, X.; Ross, U.; Roiland, C.; Lotnyk, A.; et al. From phase separation to nanocrystallization in fluorosilicate glasses: Structural design of highly luminescent glass-ceramics. J. Phys. Chem. C 2016, 120, 17726–17732. [Google Scholar] [CrossRef] [Scilit]
- Ali, M.A.; Ren, J.; Liu, X.; Qiao, X.; Qiu, J. Understanding enhanced upconversion luminescence in oxyfluoride glass-ceramics based on local structure characterizations and molecular dynamics simulations. J. Phys. Chem. C 2017, 121, 15384–15391. [Google Scholar] [CrossRef] [Scilit]
- Zanane, H.; Velázquez, M.; Denux, D.; Goldner, P.; Ferrier, A.; Kermaoui, A.; Kellou, H.; Lahaye, M.; Buffière, S.; Weill, F. Yb3+- and CaF2 nanocrystallites-containing oxyfluorogermanotellurite glass-ceramics. Opt. Mater. 2019, 90, 108–117. [Google Scholar] [CrossRef] [Scilit]
- Sen, R.; Boetti, N.N.G.; Hokka, M.; Petit, L. Optical, structural and luminescence properties of oxyfluoride phosphate glasses and glass-ceramics doped with Yb3+. J. Non-Cryst. Solids X 2019, 1, 100003. [Google Scholar] [CrossRef] [Scilit]
- Hongisto, M.; Veber, A.; Boetti, N.G.; Danto, S.; Jubera, V.; Petit, L. Transparent Yb3+-doped phosphate glass-ceramics. Ceram. Int. 2020, 46, 26317–26325. [Google Scholar] [CrossRef] [Scilit]
- de Lima Filho, E.S.; Krishnaiah, K.V.; Ledemi, Y.; Yu, Y.-J.; Messaddeq, Y.; Nemova, G.; Kashyap, R. Ytterbium-doped glass-ceramics for optical refrigeration. Opt. Express 2015, 23, 4630–4640. [Google Scholar] [CrossRef] [Scilit] [PubMed]
- Krishnaiah, K.V.; Ledemi, Y.; Genevois, C.; Véron, E.; Sauvage, X.; Morency, S.; de Lima Filho, E.S.; Nemova, G.; Allix, M.; Messaddeq, Y.; et al. Ytterbium-doped oxyfluoride nano-glass-ceramic fibers for laser cooling. Opt. Mater. Express 2017, 7, 1980–1994. [Google Scholar] [CrossRef] [Scilit]
- Maia, L.J.Q.; Thomas, J.; Ledemi, Y.; Krishnaiah, K.V.; Seletskiy, D.; Messaddeq, Y.; Kashyap, R. Photonic properties of novel Yb3+-doped germanium-lead oxyfluoride glass-ceramics for laser cooling applications. Front. Optoelectron. 2018, 11, 189–198. [Google Scholar] [CrossRef] [Scilit]
- Thomas, J.; Maia, L.J.Q.; Krishnaiah, K.V.; Ledemi, Y.; Boisvert, J.-S.; Hlil, A.; Seletskiy, D.; Messaddeq, Y.; Kashyap, R. Optical properties of ytterbium-doped oxyfluoride glass-ceramics—Concentration and temperature dependence studies for optical refrigeration applications. J. Lumin. 2021, 238, 118278. [Google Scholar] [CrossRef] [Scilit]
- Hongisto, M.; Linros, O.; Danto, S.; Jubera, V.; Petit, L. Impact of Al2O3, TiO2 and ZnO addition on the crystallization of Yb3+-doped phosphate glass-ceramic. Mater. Res. Bull. 2023, 157, 112032. [Google Scholar] [CrossRef] [Scilit]
- Jamalaiah, B.C. Yb3+-doped oxyfluoroborosilicate glasses and glass ceramics containing CaF2 nanocrystals for 981 nm near infrared fiber lasers. J. Mater. Sci. Mater. Electron. 2024, 35, 1594. [Google Scholar] [CrossRef] [Scilit]
- Fang, Z.; Li, J.; Long, Y.; Guan, B.-O. High-efficiency luminescence in optical glass via the controllable crystallization of KYb3F10 nanocrystals depending on the dopants. Opt. Lett. 2020, 45, 3030–3033. [Google Scholar] [CrossRef] [Scilit] [PubMed]
- Long, Y.; Li, J.; Fang, Z.; Guan, B.-O. Modulation of activator distribution by phase-separation of glass for efficient and tunable upconversion luminescence. RSC Adv. 2020, 10, 12217–12223. [Google Scholar] [CrossRef] [Scilit] [PubMed]
- Li, J.; Long, Y.; Zhao, Q.; Zheng, S.; Fang, Z.; Guan, B.-O. Nano-crystallization of Ln-fluoride crystals in glass-ceramics via inducing of Yb3+ for efficient near-infrared upconversion luminescence of Tm3+. Nanomaterials 2021, 11, 1033. [Google Scholar] [CrossRef] [Scilit] [PubMed]
- Li, Y.; Wang, W.; Pan, Y.; Chen, H.; Cao, Q.; Wei, X. Upconversion luminescence and optical thermometry properties of transparent oxyfluoride glass ceramics embedded with Ba4Y3F17:Yb3+,Er3+ nanocrystals. CrystEngComm 2020, 22, 6302–6309. [Google Scholar] [CrossRef] [Scilit]
- Li, L.; Wang, W.; Chen, H.; Li, S.; Zhang, Q.; Pan, Y.; Li, Y. Optical thermometry based on upconversion luminescence of Ba3Gd2F12:Yb3+/Er3+ nanocrystals embedded in glass ceramics. J. Non-Cryst. Solids 2021, 573, 121142. [Google Scholar] [CrossRef] [Scilit]
- Liang, H.; Luo, Z.; Lei, W.; Zhang, P.; Liu, S.; Zhou, Z.; Lu, A. Preparation, crystallization kinetics, and optical temperature sensing properties of Er3+–Yb3+ co-doped fluorosilicate glass-ceramics containing ZnAl2O4 crystals. J. Alloys Compd. 2022, 895, 162673. [Google Scholar] [CrossRef] [Scilit]
- Wang, W.; Li, L.; Chen, H.; Wei, X.; Jia, J.; Pan, Y.; Li, Y. Upconversion luminescence and effect of pump power on optical thermometry of Yb3+/Er3+ co-doped YOF self-crystallization glass ceramics. Opt. Mater. 2023, 135, 113330. [Google Scholar] [CrossRef] [Scilit]
- Xie, J.; Cao, Q.; Su, T.; Zhong, Y.; Wang, W.; Pan, Y.; Wei, X.; Li, Y. Optical thermometry based on up-conversion luminescence of self-crystallized glass-ceramics containing GdOF:Yb3+,Er3+ nanocrystals. Appl. Phys. A 2024, 130, 944. [Google Scholar] [CrossRef] [Scilit]
- Blanc, W.; Martin, I.; François-Saint-Cyr, H.; Bidault, X.; Chaussedent, S.; Hombourger, C.; Lacomme, S.; Le Coustumer, P.; Neuville, D.R.; Larson, D.; et al. Compositional changes at the early stages of nanoparticles growth in glasses. J. Phys. Chem. C 2019, 123, 29008–29014. [Google Scholar] [CrossRef] [Scilit]
- Chen, D.; Peng, Y.; Li, X.; Zhong, J.; Huan, P. Competitive nanocrystallization of Na3ScF6 and NaYbF4 in aluminosilicate glass and optical spectroscopy of Ln3+ dopants. Ceram. Int. 2018, 44, 15666–15673. [Google Scholar] [CrossRef] [Scilit]
- Xiang, Y.; Long, Y.; Cen, P.; Liu, S.; Fang, Z.; Jiao, R. Controllable nano-crystallization in fluoroborosilicate glass ceramics for broadband visible photoluminescence. Nanomaterials 2025, 15, 144. [Google Scholar] [CrossRef] [Scilit] [PubMed]
- Li, Z.; Zhou, D.C.; Jensen, L.R.; Qiu, J.B.; Zhang, Y.F.; Yue, Y. Er3+–Yb3+ ions doped fluoro-aluminosilicate glass-ceramics as a temperature-sensing material. J. Am. Ceram. Soc. 2021, 104, 4471–4478. [Google Scholar] [CrossRef] [Scilit]
- Chen, Y.; Xiong, Y.; Huang, H.; Yang, B. Crystallization behavior and up-conversion optical characteristics based on NaZnPO4:Yb3+/Tb3+/Ho3+ nanocrystals embedded in glass matrix. J. Alloys Compd. 2021, 887, 161344. [Google Scholar] [CrossRef] [Scilit]
- Huang, L.; Qin, G.; Arai, Y.; Jose, R.; Suzuki, T.; Ohishi, Y.; Yamashita, T.; Akimoto, Y. Crystallization kinetics and spectroscopic investigations on Tb3+ and Yb3+ codoped glass ceramics containing CaF2 nanocrystals. J. Appl. Phys. 2007, 102, 093506. [Google Scholar] [CrossRef] [Scilit]
- Lu, A.; Long, W.; Chen, Y. Effect of Yb3+ ions content on crystallization of NaF-CaF2-Al2O3-SiO2 oxyfluoride glasses. Mater. Lett. 2012, 68, 501–503. [Google Scholar] [CrossRef] [Scilit]
- Gugov, I.; Muller, M.; Russel, C. Transparent oxyfluoride glass-ceramics co-doped with Er3+ and Yb3+: Crystallization and upconversion spectroscopy. J. Solid State Chem. 2011, 184, 1001–1007. [Google Scholar] [CrossRef] [Scilit]
- Liu, S.; Luo, Z.; Zhang, P.; Liu, X.; He, P.; Liang, H.; Lu, A. Crystallization behavior and enhanced fluorescence properties of Yb3+/Ho3+/Tb3+ co-doped transparent glass-ceramics containing oxyapatite-type Na3YSi2O7 crystals. J. Alloys Compd. 2022, 924, 166573. [Google Scholar] [CrossRef] [Scilit]
- Bardins, M. Ytterbium Doped Glass-Ceramics for Photonics. Bachelor’s Thesis, Tampere University, Tampere, Finland, 2024. Available online: https://trepo.tuni.fi/bitstream/handle/10024/160864/BardinsMatiss.pdf?sequence=2 (accessed on 2 July 2026).
- Zhang, Y.; Chen, J.; Zhang, H.; Lei, Y. Bulk ytterbium aluminosilicate glass with excellent mechanical properties and plasma etching resistance. J. Non-Cryst. Solids 2024, 642, 123159. [Google Scholar] [CrossRef] [Scilit]
- Lopes, A.S.; Monteiro, R.C.C.; Soares, R.S.; Lima, M.M.R.A.; Fernandes, M.H.V. Crystallization kinetics of a barium-zinc borosilicate glass by a non-isothermal method. J. Alloys Compd. 2014, 591, 268–274. [Google Scholar] [CrossRef] [Scilit]
- Almutairi, A.M.; Abulyazied, D.; Abomostafa, H.; Taha, T.; Abouhaswa, A.S. Tailoring the structural, optical, mechanical, and magnetic properties of borosilicate glass/Yb2O3 composites. J. Mater. Sci. Mater. Electron. 2024, 35, 1578. [Google Scholar] [CrossRef] [Scilit]
- El-Shamy, N.T.; Mahrous, E.M.; Alghamdi, S.K.; Tommalieh, M.J.; Nasr, M.H.; Abomostafa, H.M.; Abulyazied, D.E.; Abouhaswa, A.S. The influence of ytterbium oxide (Yb2O3) substitution in cadmium bismuth borate glasses: An approach to improve structural, optical, and radiation shielding efficiency. Ceram. Int. 2025, 51, 6319–6329. [Google Scholar] [CrossRef] [Scilit]
- Prabhu, N.S.; Somashekarappa, H.M.; Sayyed, M.I.; Osman, H.; Alamri, S.; Khandaker, M.U.; Kamath, S.D. Structural and Optical Modifications in the BaO–ZnO–LiF–B2O3–Yb2O3 Glass System after γ-Irradiation. Materials 2021, 14, 6955. [Google Scholar] [CrossRef] [Scilit] [PubMed]
- Kaushik, C.P.; Mishra, R.K.; Sengupta, P.; Kumar, A.; Das, D.; Kale, G.B.; Raj, K. Barium borosilicate glass—A potential matrix for immobilization of sulfate bearing high-level radioactive liquid waste. J. Nucl. Mater. 2006, 358, 129–138. [Google Scholar] [CrossRef] [Scilit]
- Zhao, Q.; Li, J.; Zha, T.; Zhang, P.; Long, Y.; Fang, Z. Low-Temperature Fluoro-Borosilicate Glass for Controllable Nano-Crystallization in Glass Ceramic Fibers. Nanomaterials 2023, 13, 1586. [Google Scholar] [CrossRef] [Scilit] [PubMed]
- Kowalska, K.; Pisarska, J.; Pisarski, W.A. Yb3+-Doped Titanate–Germanate Glasses for Near-IR Luminescence Applications: Synthesis, Characterization, and the Influence of TiO2 Concentration. Materials 2024, 17, 5874. [Google Scholar] [CrossRef] [Scilit] [PubMed]
- Marzouk, S.Y.; Azooz, M.A.; Elsaghier, H.M.; Zidan, N.A.; Abbas, W. Structural and Optical Properties of Barium Titanium Borate Glasses Doped with Ytterbium. J. Mater. Sci. Mater. Electron. 2022, 33, 18054–18071. [Google Scholar] [CrossRef] [Scilit]
- Ikeda, M.; Aniya, M. Understanding the Vogel-Fulcher-Tammann law in terms of the bond strength-coordination number fluctuation model. J. Non-Cryst. Solids 2013, 371–372, 53–57. [Google Scholar] [CrossRef] [Scilit]
- Pries, J.; Wei, S.; Wuttig, M.; Lucas, P. Switching between crystallization from the glassy and the undercooled liquid phase in phase change material Ge2Sb2Te5. Adv. Mater. 2019, 31, 1900784. [Google Scholar] [CrossRef] [Scilit] [PubMed]
- Volkov, V.; Cascales, C.; Kling, A.; Zaldo, C. Growth, structure, and evaluation of laser properties of LiYb(MoO4)2 single crystal. Chem. Mater. 2005, 17, 291–300. [Google Scholar] [CrossRef] [Scilit]
- Zayhowski, J.J. Microchip lasers. Opt. Mater. 1999, 11, 255–267. [Google Scholar] [CrossRef] [Scilit]
- Qiao, X.; Liu, Y.; Yang, X.; Tsuboi, T. Structural, luminescence and upconversion properties in Er-doped LiYb(MoO4)2 solid solution. Ceram. Int. 2025, 51, 6926–6936. [Google Scholar] [CrossRef] [Scilit]
- Szymanski, N.J.; Nevatia, P.; Bartel, C.J.; Zeng, Y.; Ceder, G. Autonomous and dynamic precursor selection for solid-state materials synthesis. Nat. Commun. 2023, 14, 6956. [Google Scholar] [CrossRef] [Scilit] [PubMed]
- Webber, K.G.; Clemens, O.; Buscaglia, V.; Malič, B.; Bordia, R.K.; Fey, T.; Eckstein, U. Review of the opportunities and limitations for powder-based high-throughput solid-state processing of advanced functional ceramics. J. Eur. Ceram. Soc. 2024, 44, 116780. [Google Scholar] [CrossRef] [Scilit]
- Shannon, R.D. Revised effective ionic radii and systematic studies of interatomic distances in halides and chalcogenides. Acta Crystallogr. A 1976, 32, 751–767. [Google Scholar] [CrossRef] [Scilit]
- Vegard, L. Die Konstitution der Mischkristalle und die Raumfüllung der Atome. Z. Phys. 1921, 5, 17–26. [Google Scholar] [CrossRef] [Scilit]
- Nakazawa, E.; Shionoya, S. Cooperative luminescence in YbPO4. Phys. Rev. Lett. 1970, 25, 1710–1712. [Google Scholar] [CrossRef] [Scilit]
- Auzel, F.; Goldner, P. Towards rare-earth clustering control in doped glasses. Opt. Mater. 2001, 16, 93–103. [Google Scholar] [CrossRef] [Scilit]
- Hehlen, M.P.; Güdel, H.U. Optical spectroscopy of the dimer system Cs3Yb2Br9. J. Chem. Phys. 1993, 98, 1768–1775. [Google Scholar] [CrossRef] [Scilit]
- dos Santos, P.V.; Vermelho, M.V.D.; Gouveia, E.A.; de Araujo, M.T.; Gouveia-Neto, A.; Ribeiro, S.; Messaddeq, Y. Blue cooperative luminescence in Yb3+-doped tellurite glasses excited at 1.064 μm. J. Chem. Phys. 2002, 116, 6772–6776. [Google Scholar] [CrossRef] [Scilit]
- Velázquez, J.J.; Gorni, G.; Balda, R.; Fernández, J.; Pascual, L.; Durán, A.; Pascual, M.J. Non-Linear Optical Properties of Er3+–Yb3+-Doped NaGdF4 Nanostructured Glass-Ceramics. Nanomaterials 2020, 10, 1425. [Google Scholar] [CrossRef] [Scilit] [PubMed]
- Wang, Y.; Ohwaki, J. New transparent vitroceramics codoped with Er3+ and Yb3+ for efficient frequency upconversion. Appl. Phys. Lett. 1993, 63, 3268–3270. [Google Scholar] [CrossRef] [Scilit]
- Tick, P.A.; Borrelli, N.F.; Cornelius, L.K.; Newhouse, M.A. Transparent glass ceramics for 1300 nm amplifier applications. J. Appl. Phys. 1995, 78, 6367–6374. [Google Scholar] [CrossRef] [Scilit]
- Dejneka, M.J. Transparent oxyfluoride glass ceramics. MRS Bull. 1998, 23, 57–62. [Google Scholar] [CrossRef] [Scilit]
- Gonçalves, M.C.; Santos, L.F.; Almeida, R.M. Rare-earth-doped transparent glass ceramics. Comptes Rendus Chim. 2002, 5, 845–854. [Google Scholar] [CrossRef] [Scilit]
- Boulard, B.; Van, T.T.T.; Łukowiak, A.; Bouajaj, A.; Gonçalves, R.R.; Chiappini, A.; Chiasera, A.; Blanc, W.; Durán, A.; Turrell, S.; et al. Photonic glass-ceramics: Consolidated outcomes and prospects. Proc. SPIE 2015, 9364, 93640Z. [Google Scholar] [CrossRef] [Scilit]
- Pisarski, W.A. Rare earth doped glasses/ceramics: Synthesis, structure, properties and their optical applications. Materials 2022, 15, 8099. [Google Scholar] [CrossRef] [Scilit] [PubMed]
- Gorni, G.; Velázquez, J.J.; Mosa, J.; Mather, G.C.; Serrano, A.; Vila, M.; Castro, G.R.; Bravo, D.; Balda, R.; Fernández, J.; et al. Transparent sol-gel oxyfluoride glass-ceramics with high crystalline fraction and study of RE incorporation. Nanomaterials 2019, 9, 530. [Google Scholar] [CrossRef] [Scilit] [PubMed]
- Fedorov, P.P.; Luginina, A.A.; Popov, A.I. Transparent oxyfluoride glass ceramics. J. Fluor. Chem. 2015, 172, 22–50. [Google Scholar] [CrossRef] [Scilit]
- Liu, Q.; Tian, Y.; Wang, C.; Huang, F.; Jing, X.; Zhang, J.; Zhang, X.; Xu, S. Different dominant transitions in holmium and ytterbium codoped oxyfluoride glass and glass ceramics originating from varying phonon energy environments. Phys. Chem. Chem. Phys. 2017, 19, 29833–29839. [Google Scholar] [CrossRef] [Scilit] [PubMed]
- Oppo, C.I.; Corpino, R.; Ricci, P.C.; Paul, M.C.; Das, S.; Pal, M.; Bhadra, S.K.; Yoo, S.; Kalita, M.P.; Boyland, A.J.; et al. Incorporation of Yb3+ ions in multicomponent phase-separated fibre glass preforms. Opt. Mater. 2012, 34, 660–664. [Google Scholar] [CrossRef] [Scilit]
- Duan, M.; Hu, Y.; Xia, M.; Liu, C.; Xie, J.; Wang, J.; Han, J.; Zhao, X. Structural and spectroscopic properties of Yb3+-doped zinc aluminate nanocrystals in silicate glass-ceramics. J. Non-Cryst. Solids 2017, 457, 93–96. [Google Scholar] [CrossRef] [Scilit]
- von Clausbruch, S.C.; Schweiger, M.; Höland, W.; Rheinberger, V. The effect of P2O5 on the crystallization and microstructure of glass-ceramics in the SiO2-Li2O-K2O-ZnO-P2O5 system. J. Non-Cryst. Solids 2000, 263–264, 388–394. [Google Scholar] [CrossRef] [Scilit]
- Ojha, N.; Szczodra, A.; Boetti, N.G.; Massera, J.; Petit, L. Nucleation and growth behavior of Er3+-doped oxyfluorophosphate glasses. RSC Adv. 2020, 10, 25703–25716. [Google Scholar] [CrossRef] [Scilit] [PubMed]
- Ahmad, S.; Herrmann, M.; Mahmoud, M.M.; Leiste, H.; Lippmann, W.; Seifert, H.J. Crystallisation studies of RE2O3-Al2O3-SiO2 glasses under long heat-treatment conditions. J. Alloys Compd. 2016, 688, 762–774. [Google Scholar] [CrossRef] [Scilit]
- Wu, C.H.; Chen, J.Z. Ultrafast atmospheric-pressure-plasma-jet processed conductive plasma-resistant Y2O3/carbon-nanotube nanocomposite. J. Alloys Compd. 2015, 651, 357–362. [Google Scholar] [CrossRef] [Scilit]
- Cruz, M.E.; Castro, Y.; Durán, A. Transparent oxyfluoride glass-ceramics obtained by different sol-gel routes. J. Sol-Gel Sci. Technol. 2022, 102, 523–533. [Google Scholar] [CrossRef] [Scilit]
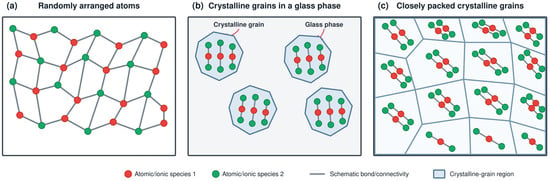
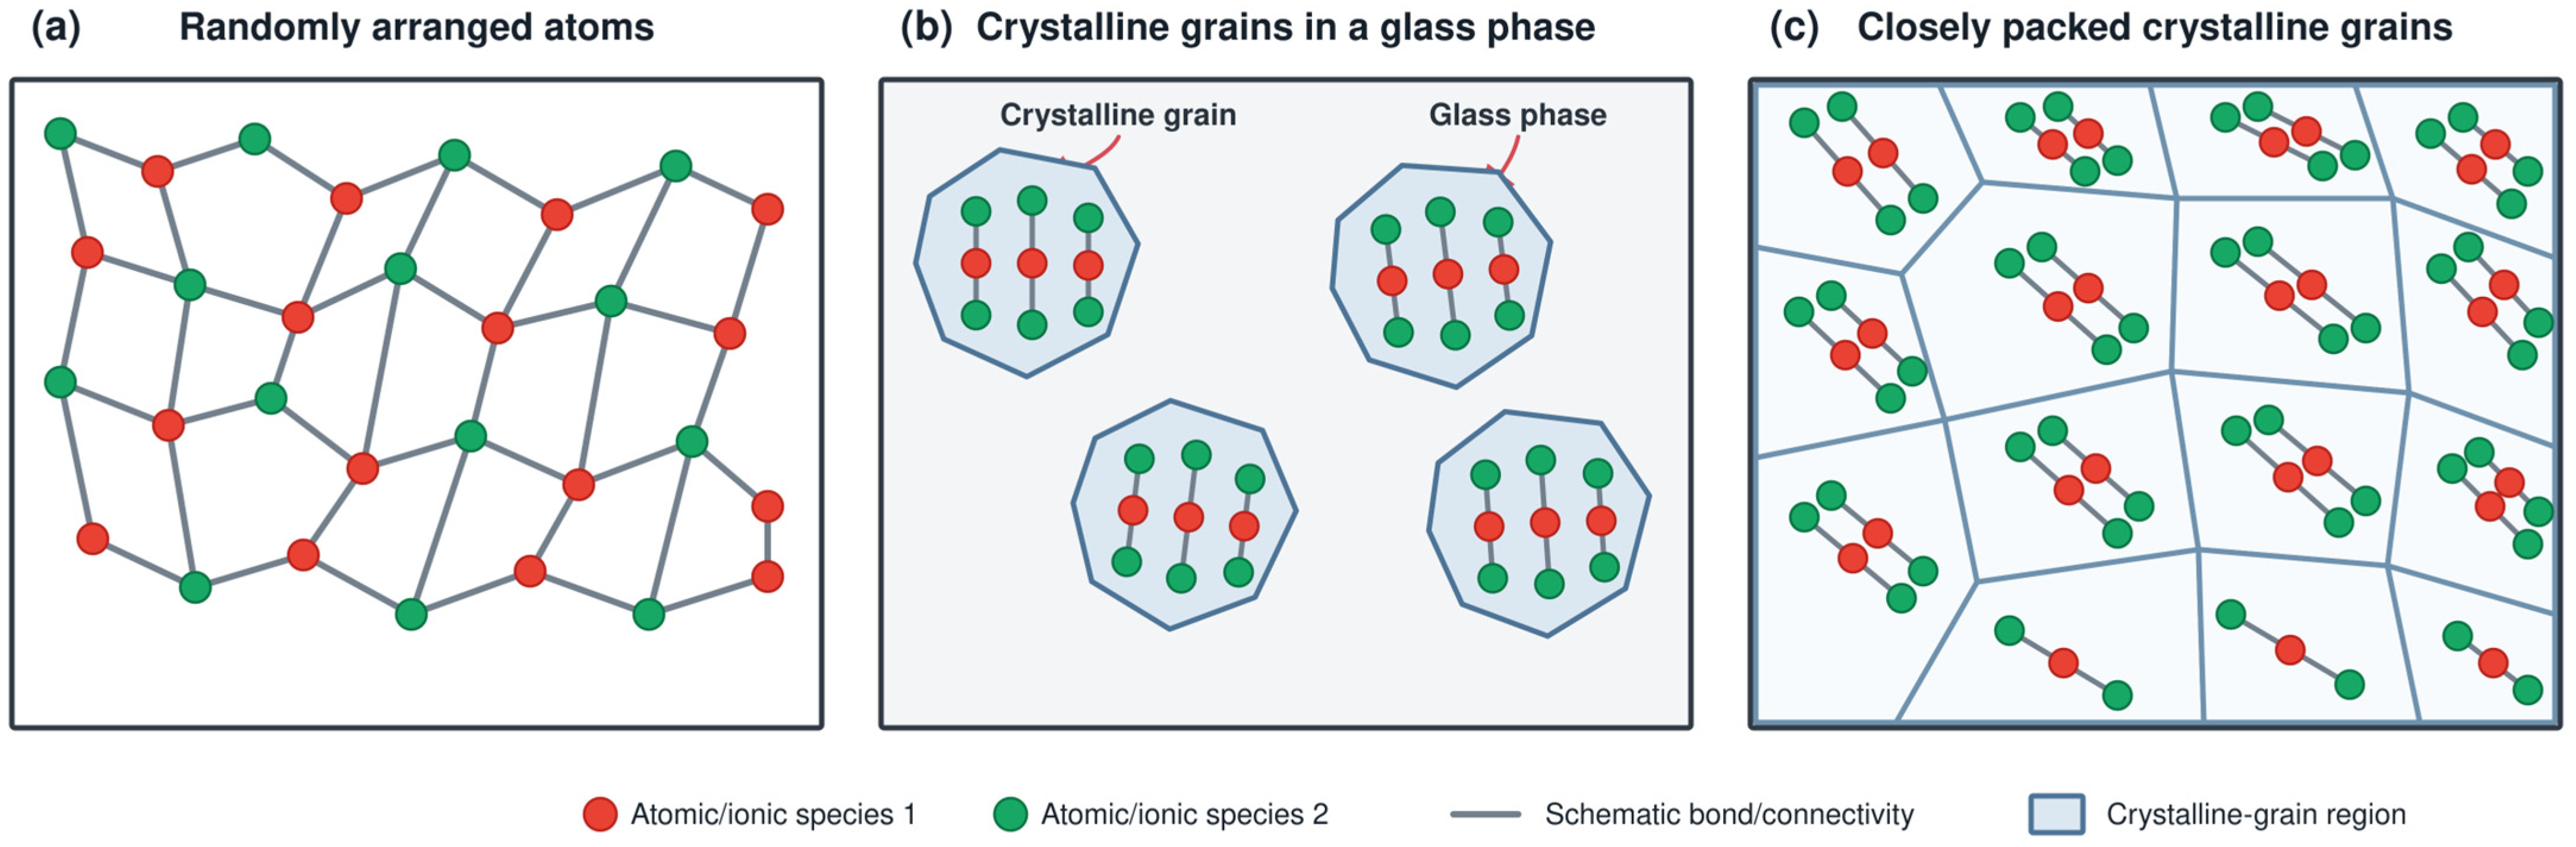
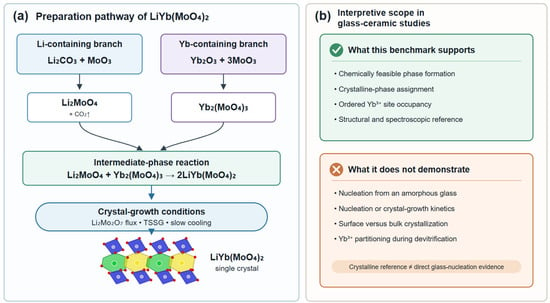
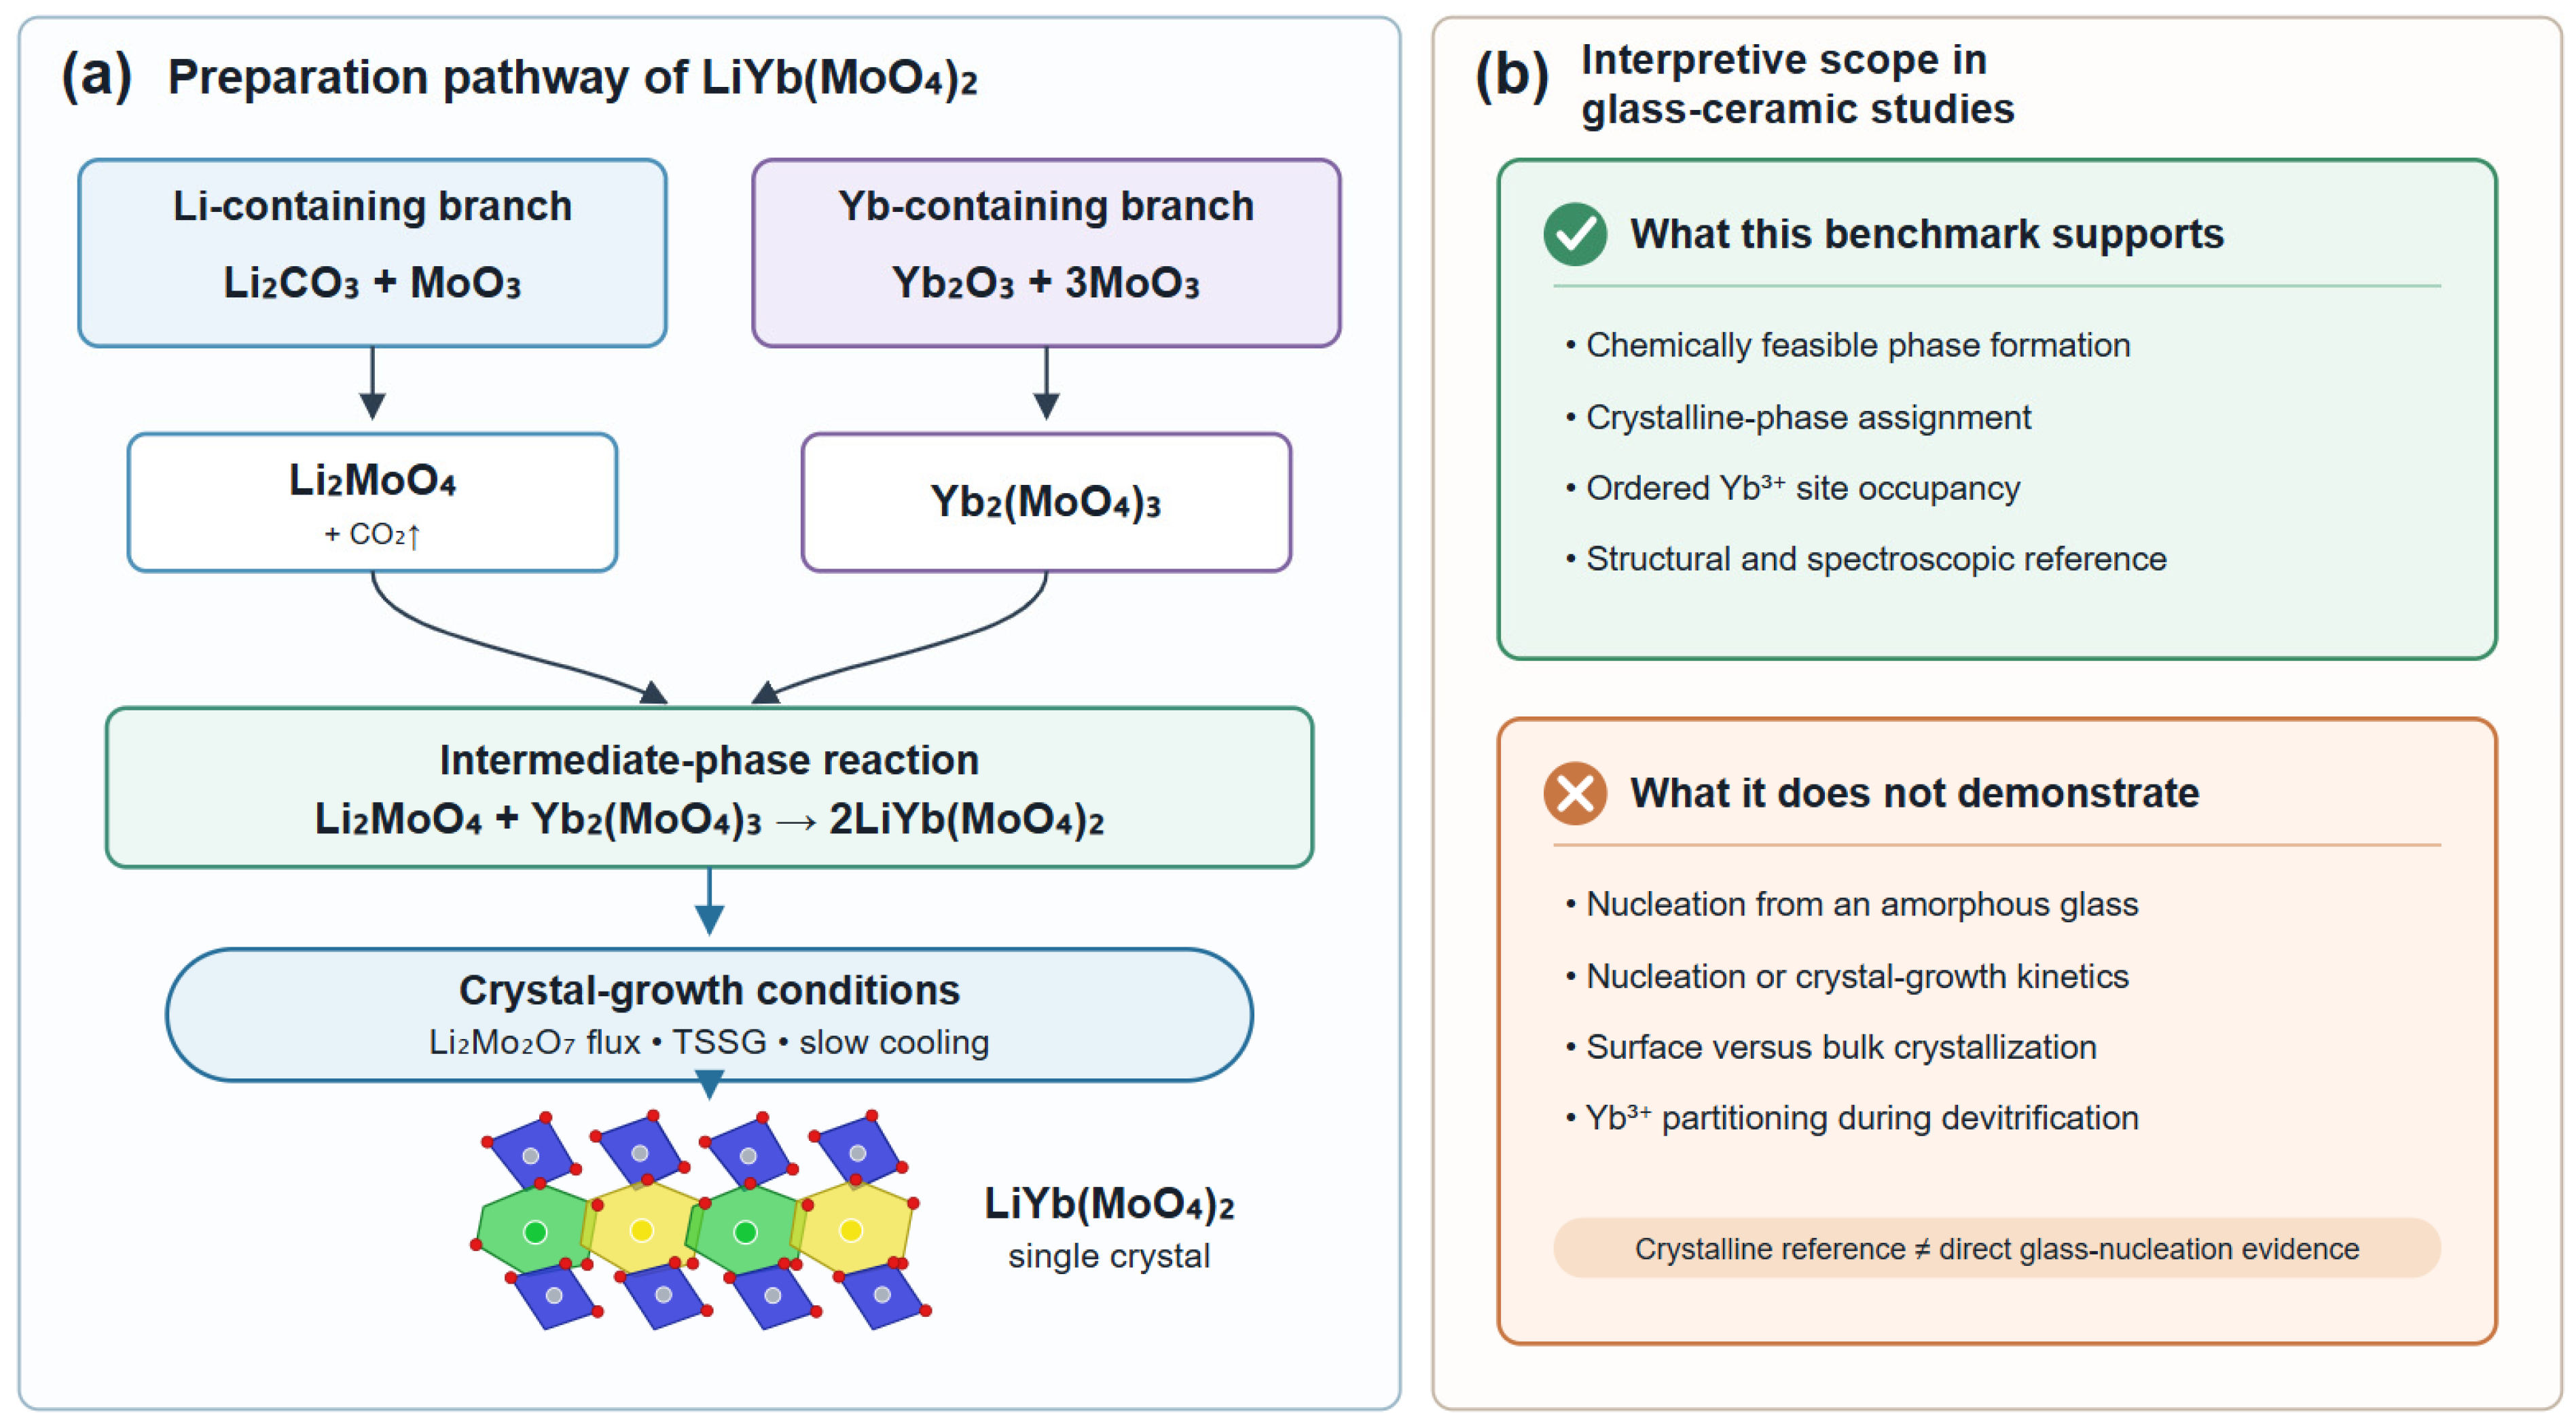
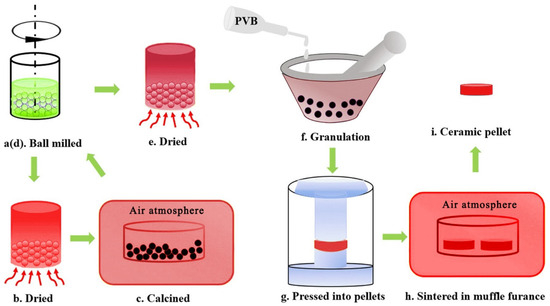
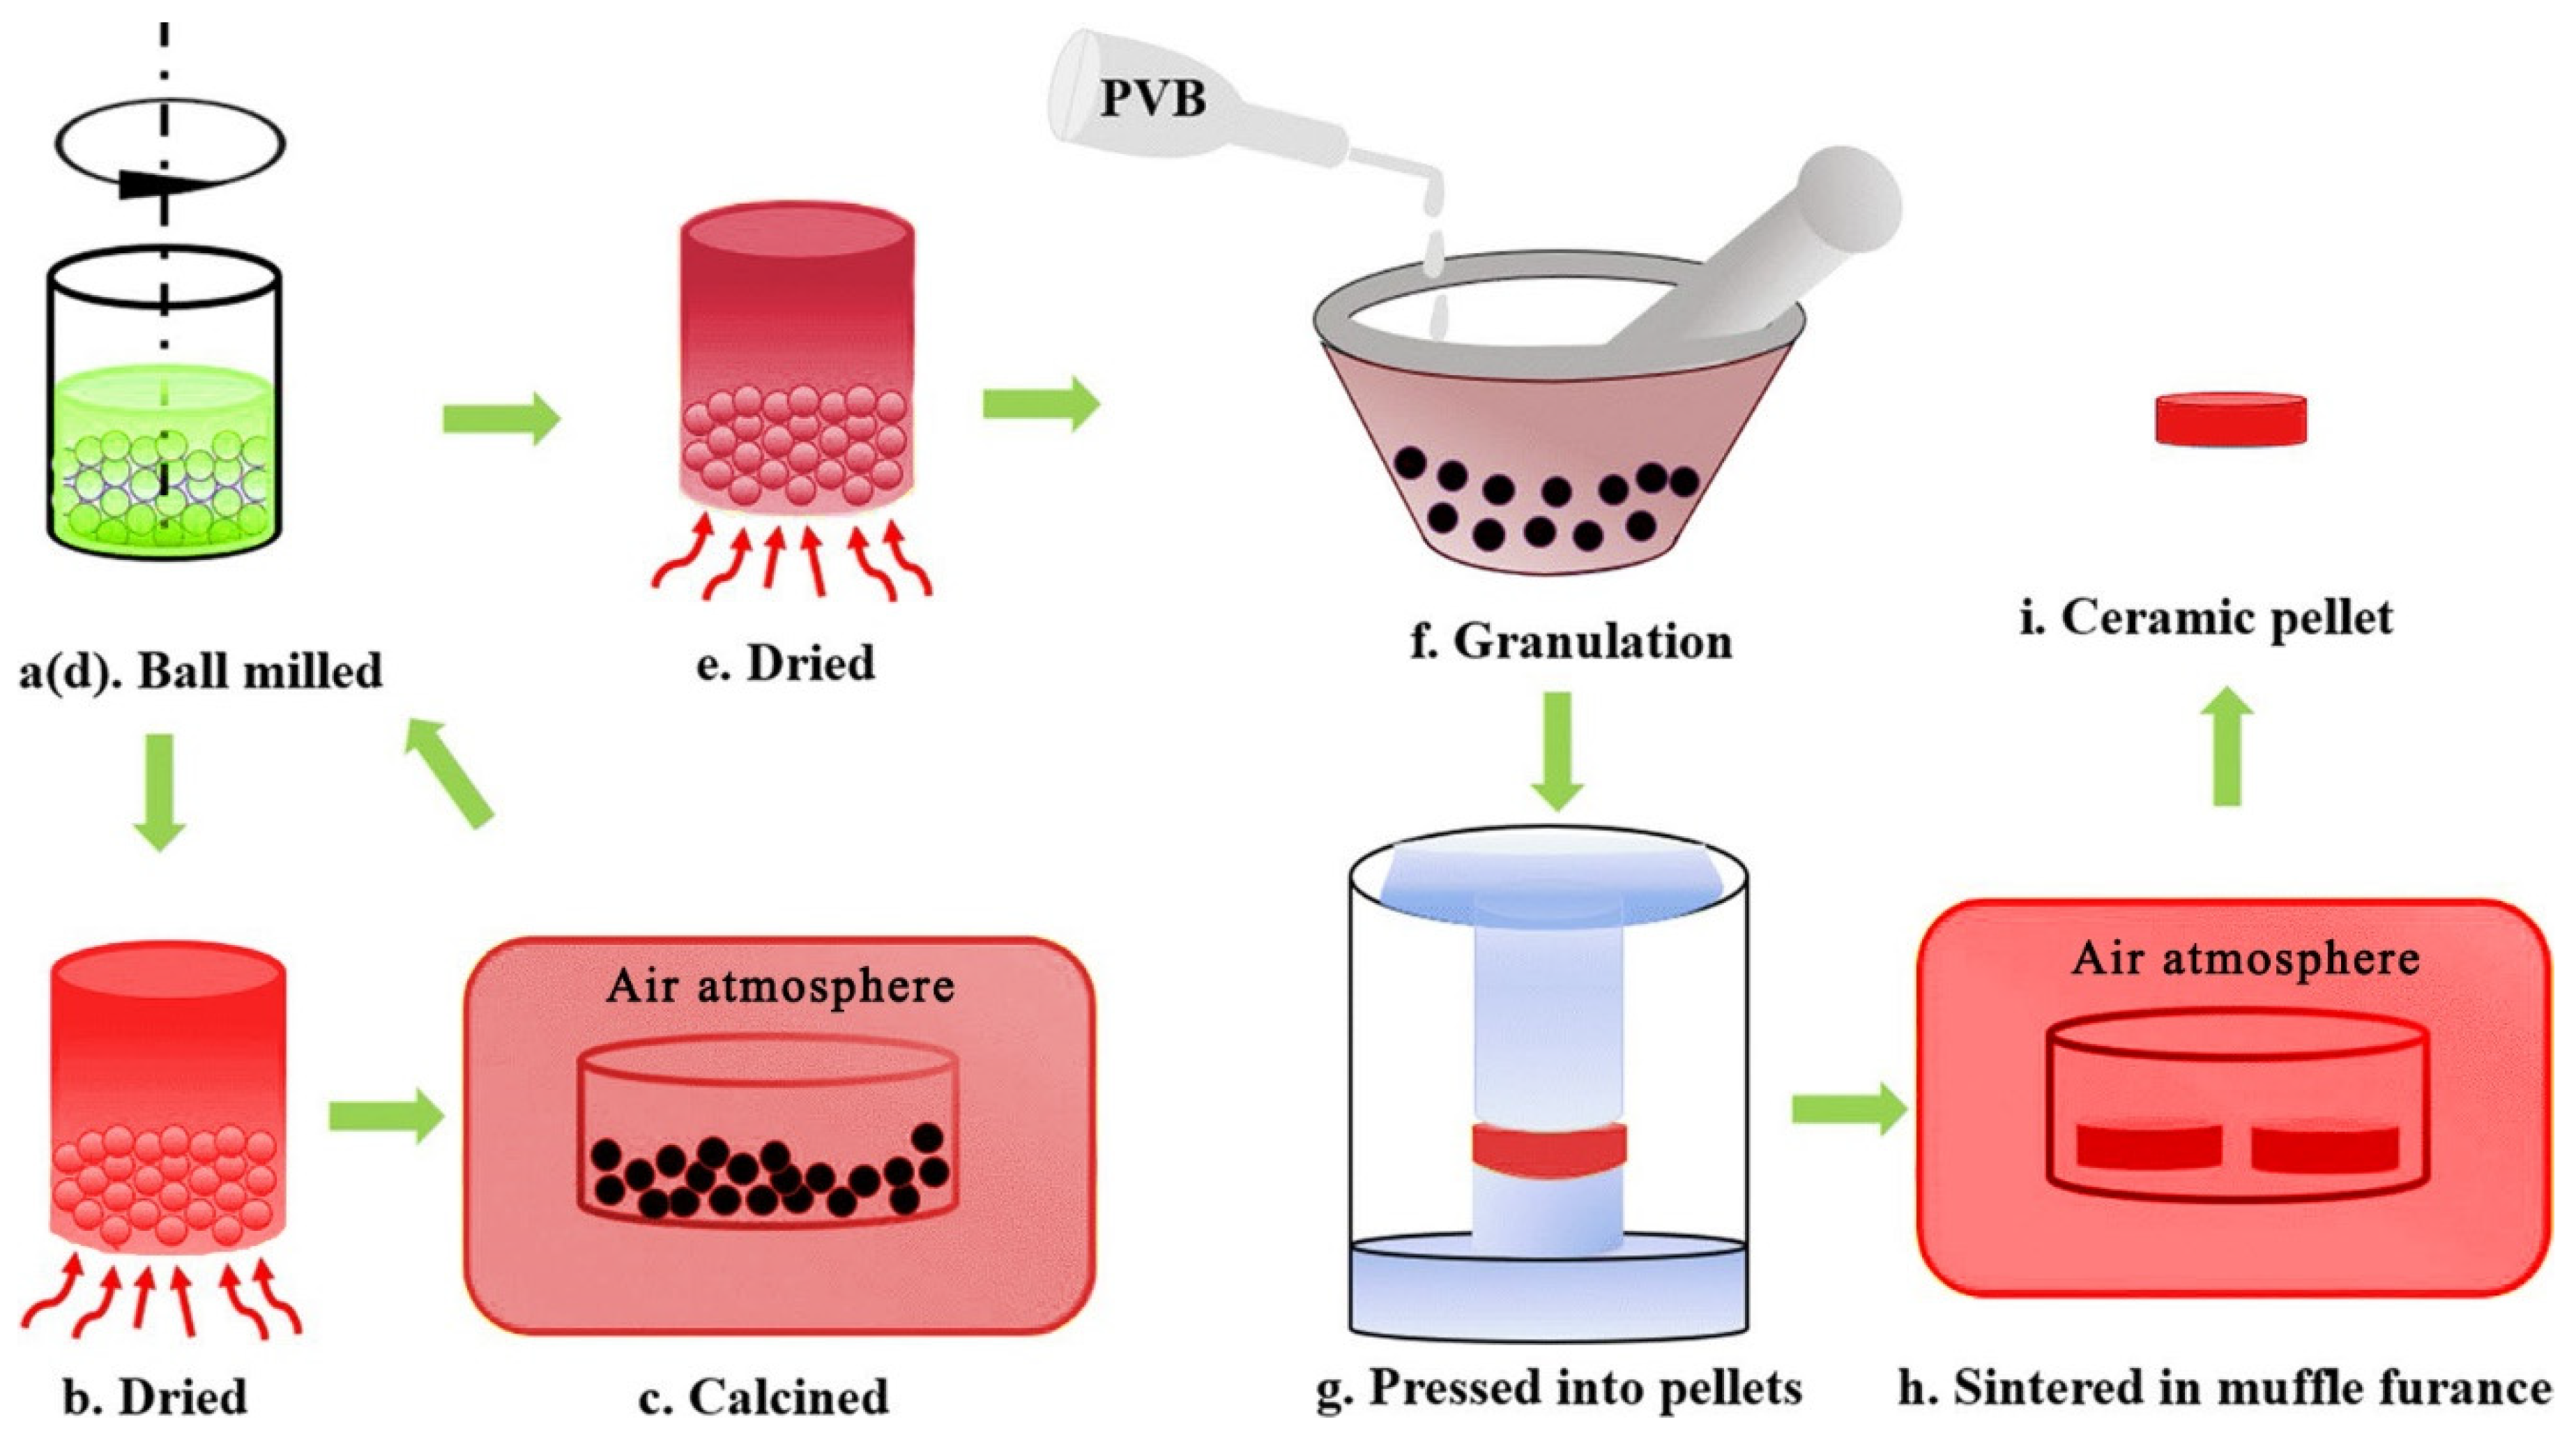
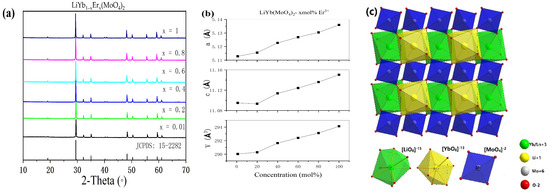
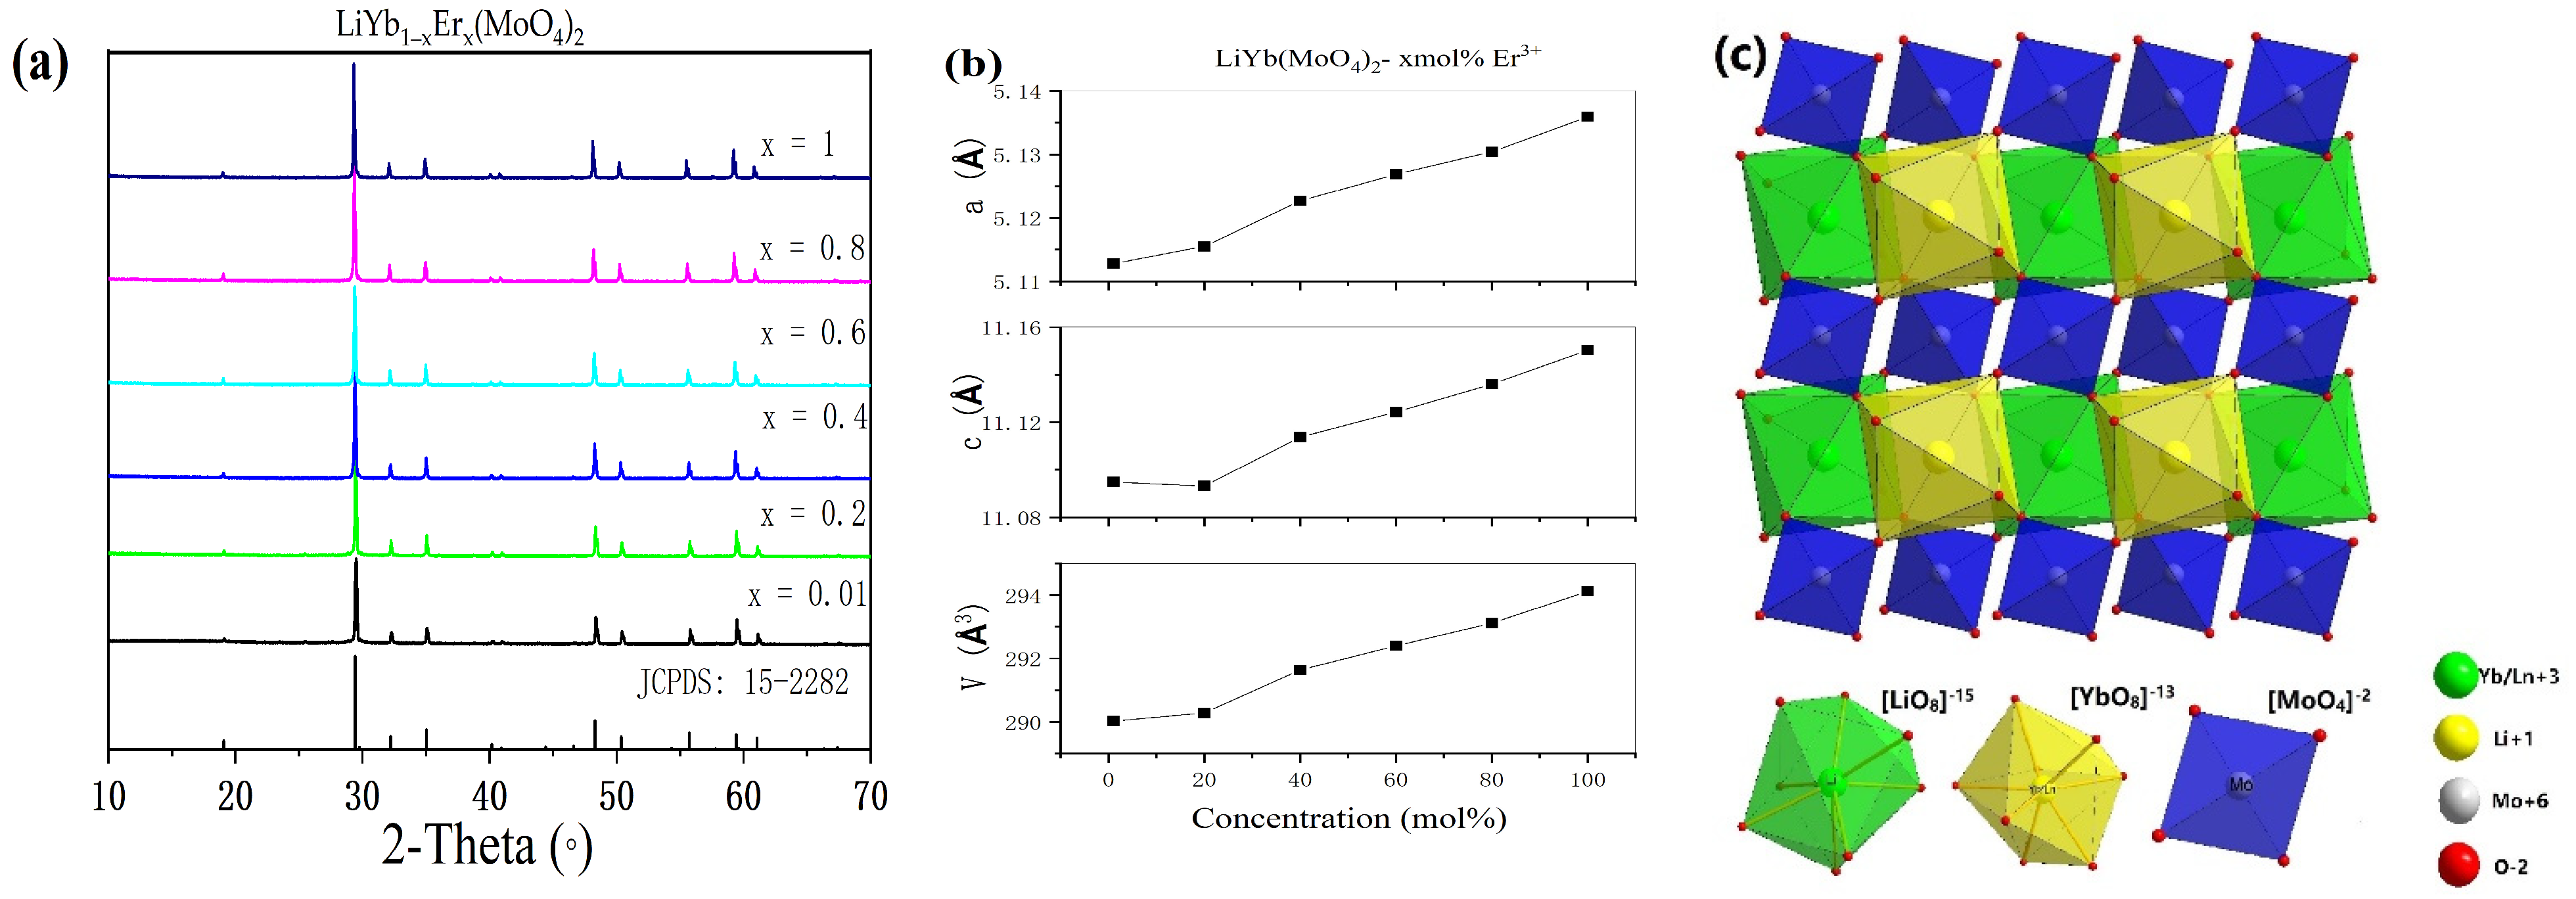
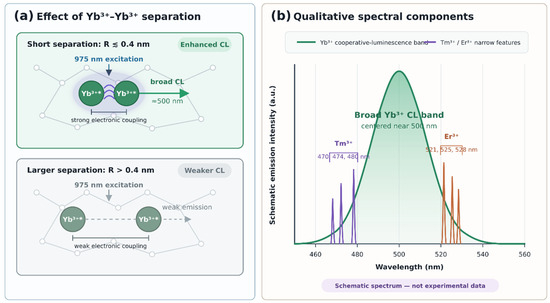
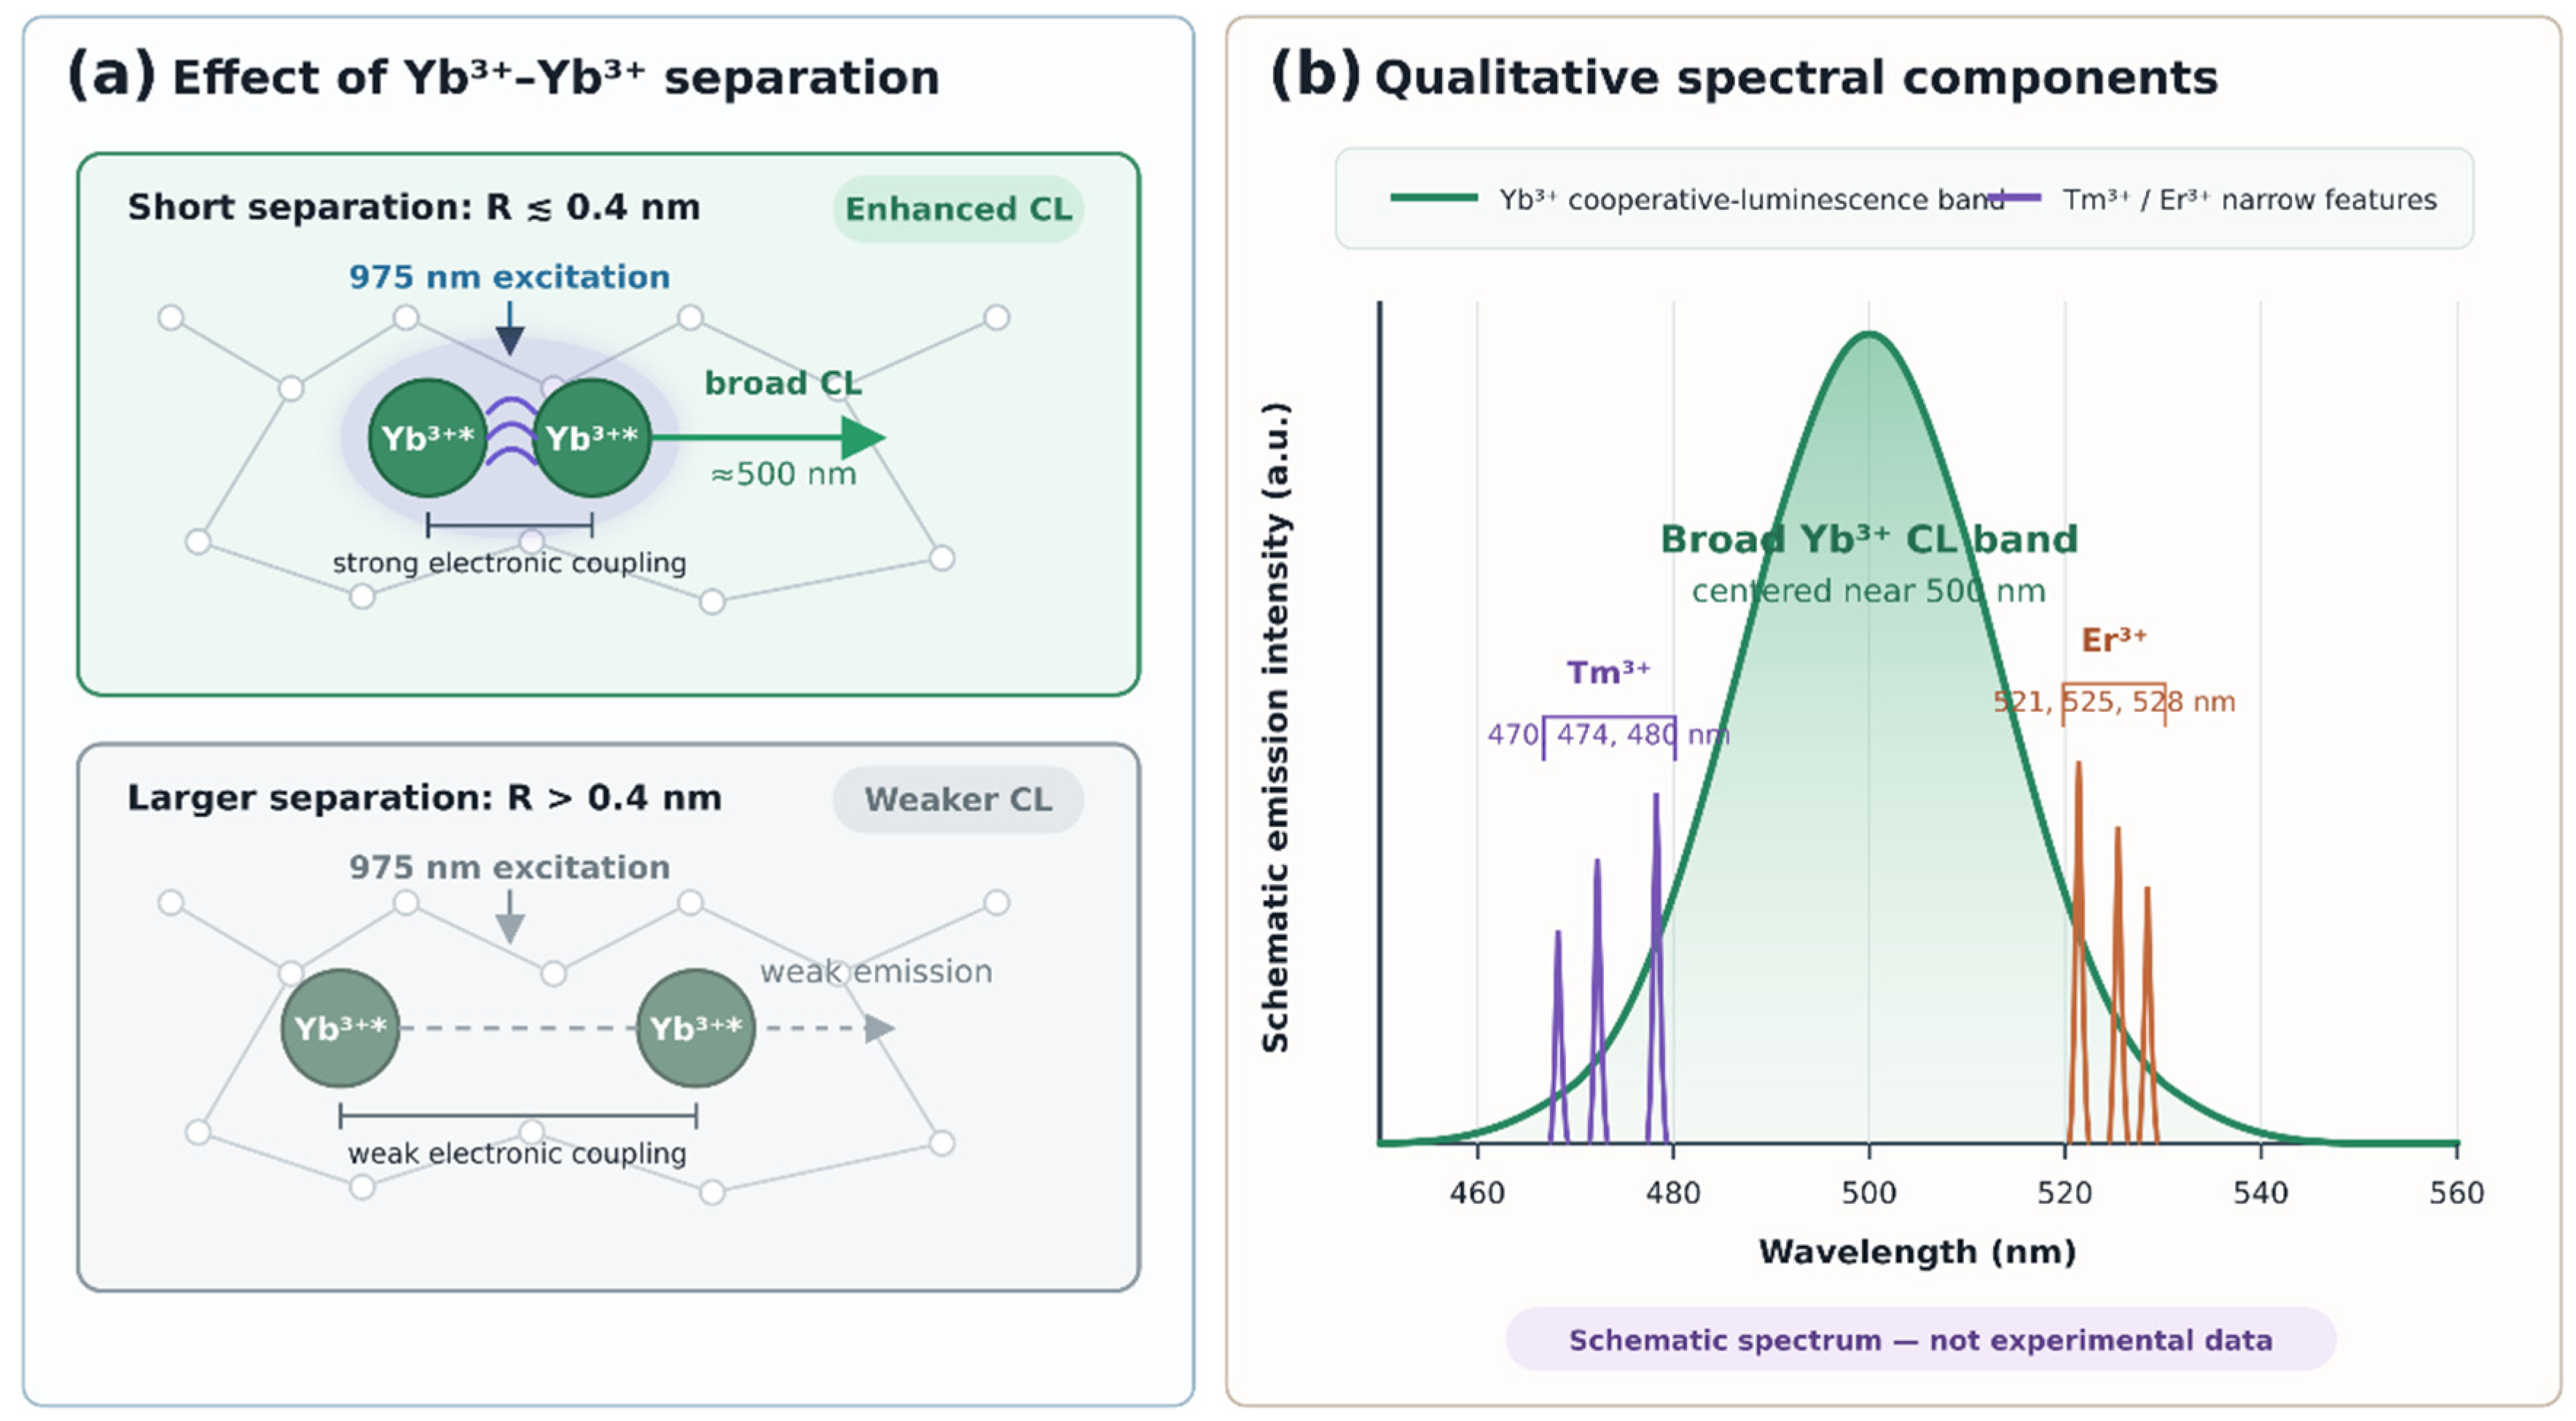
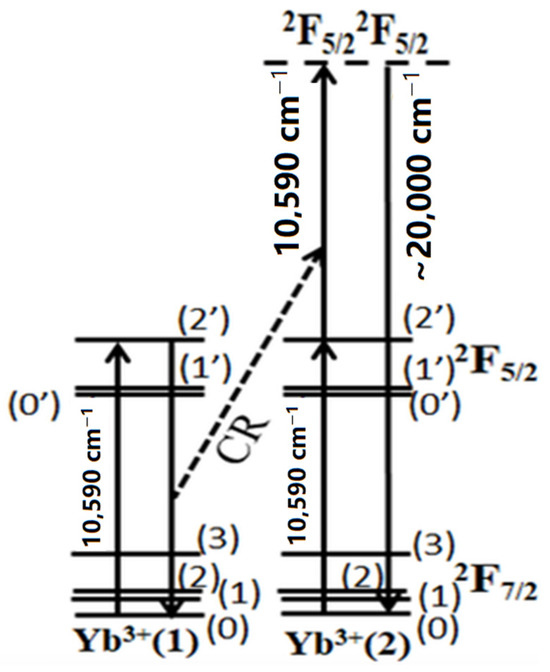
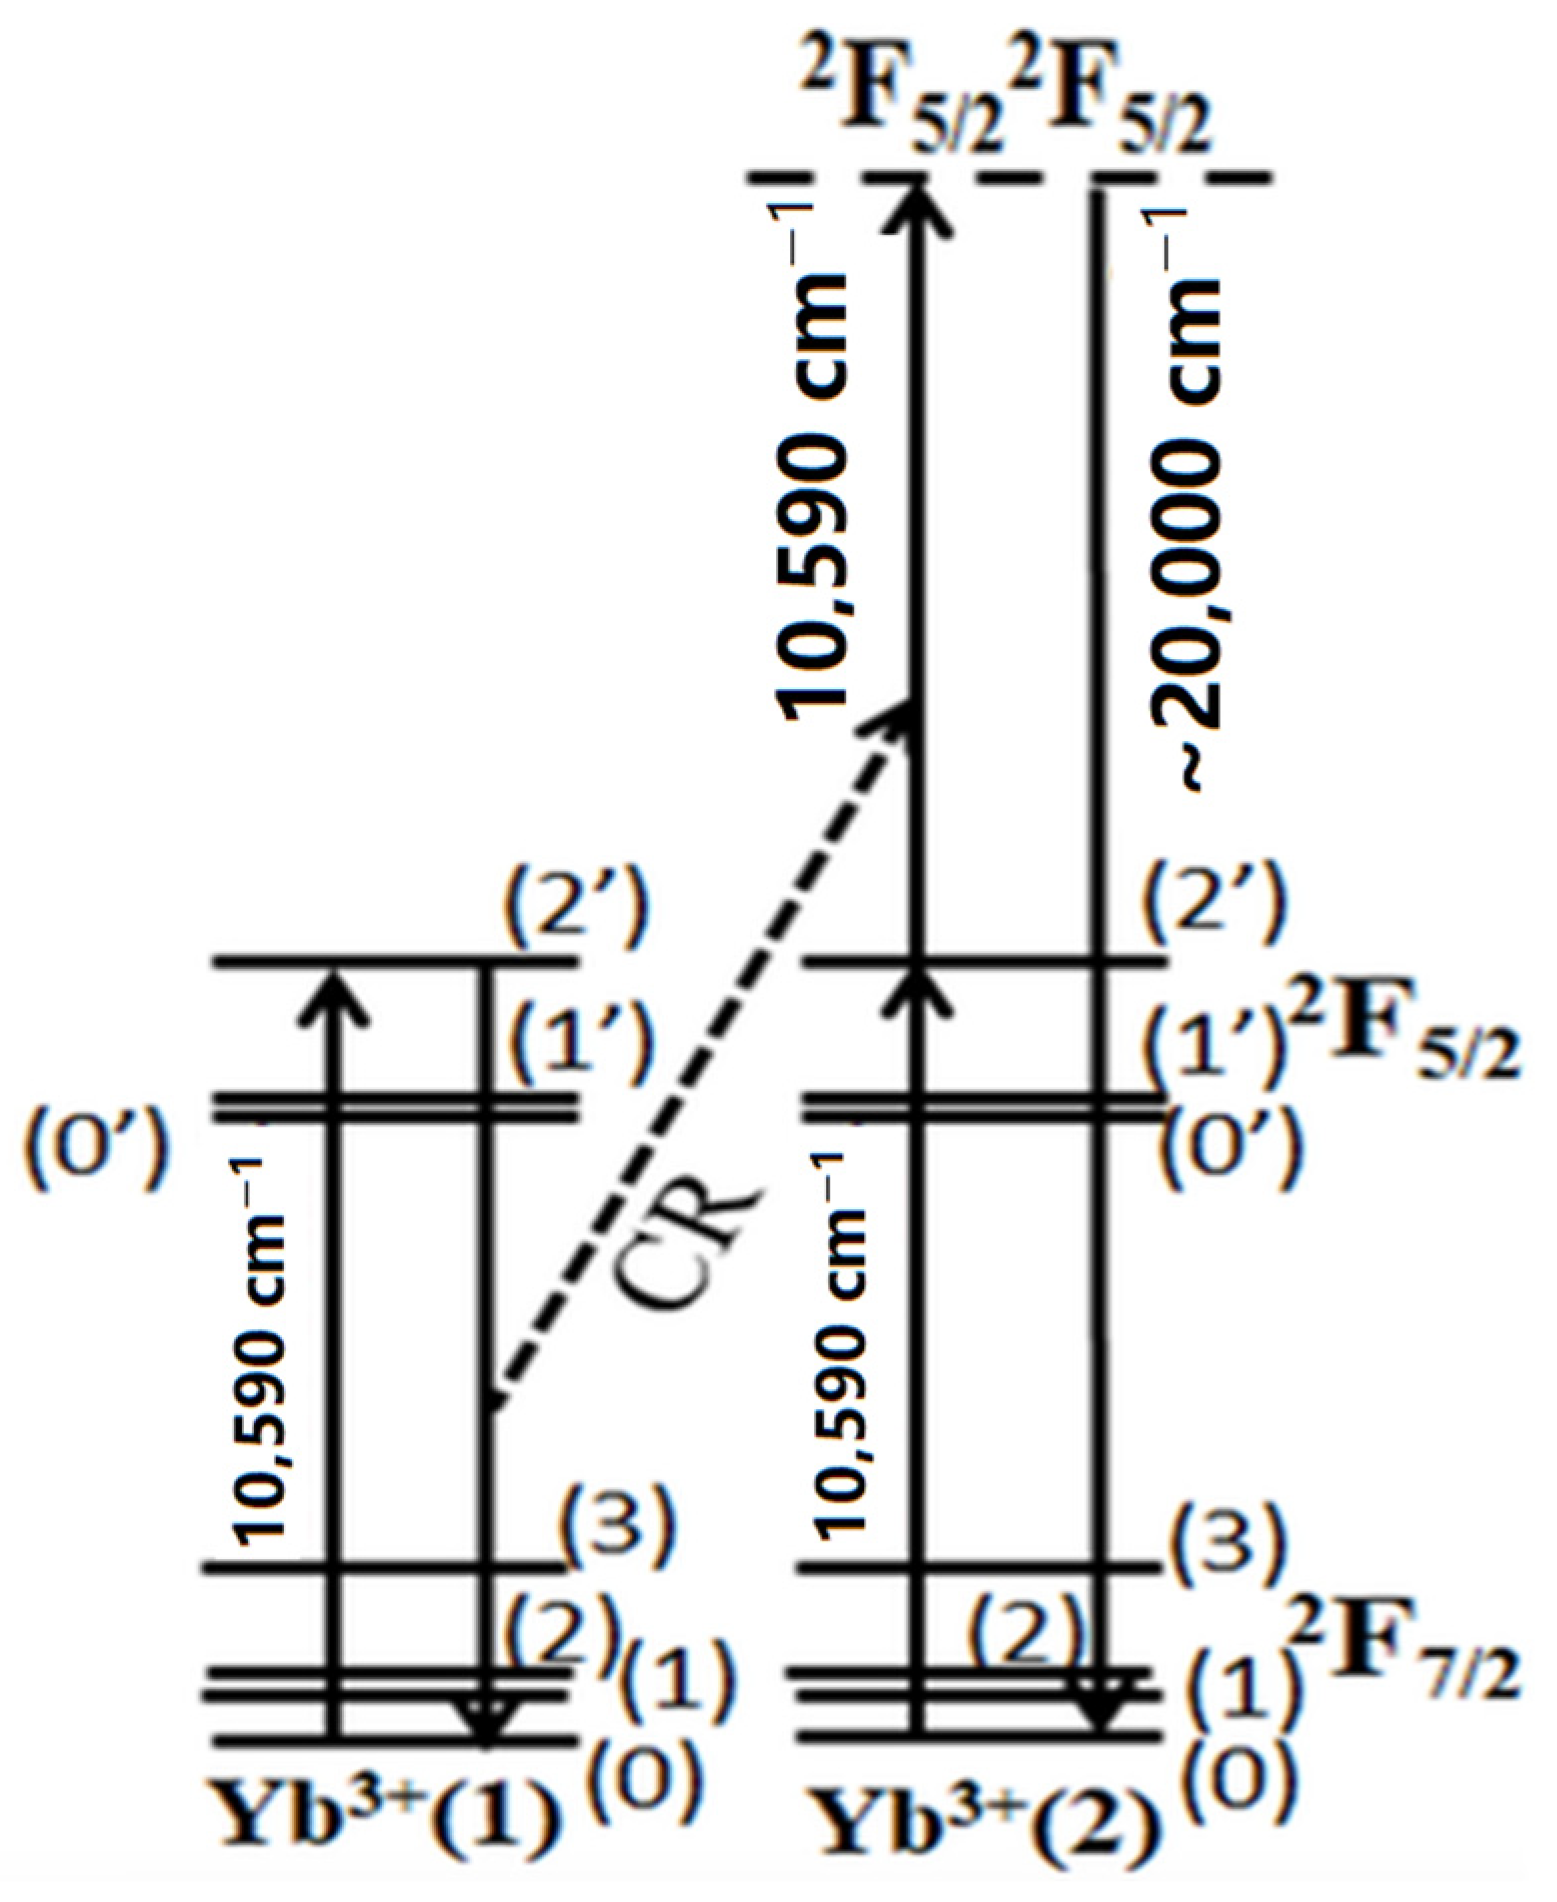
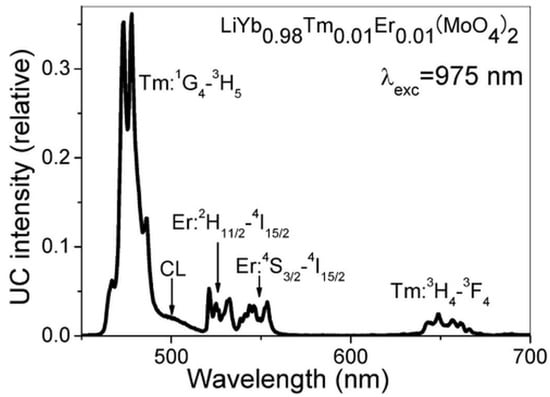
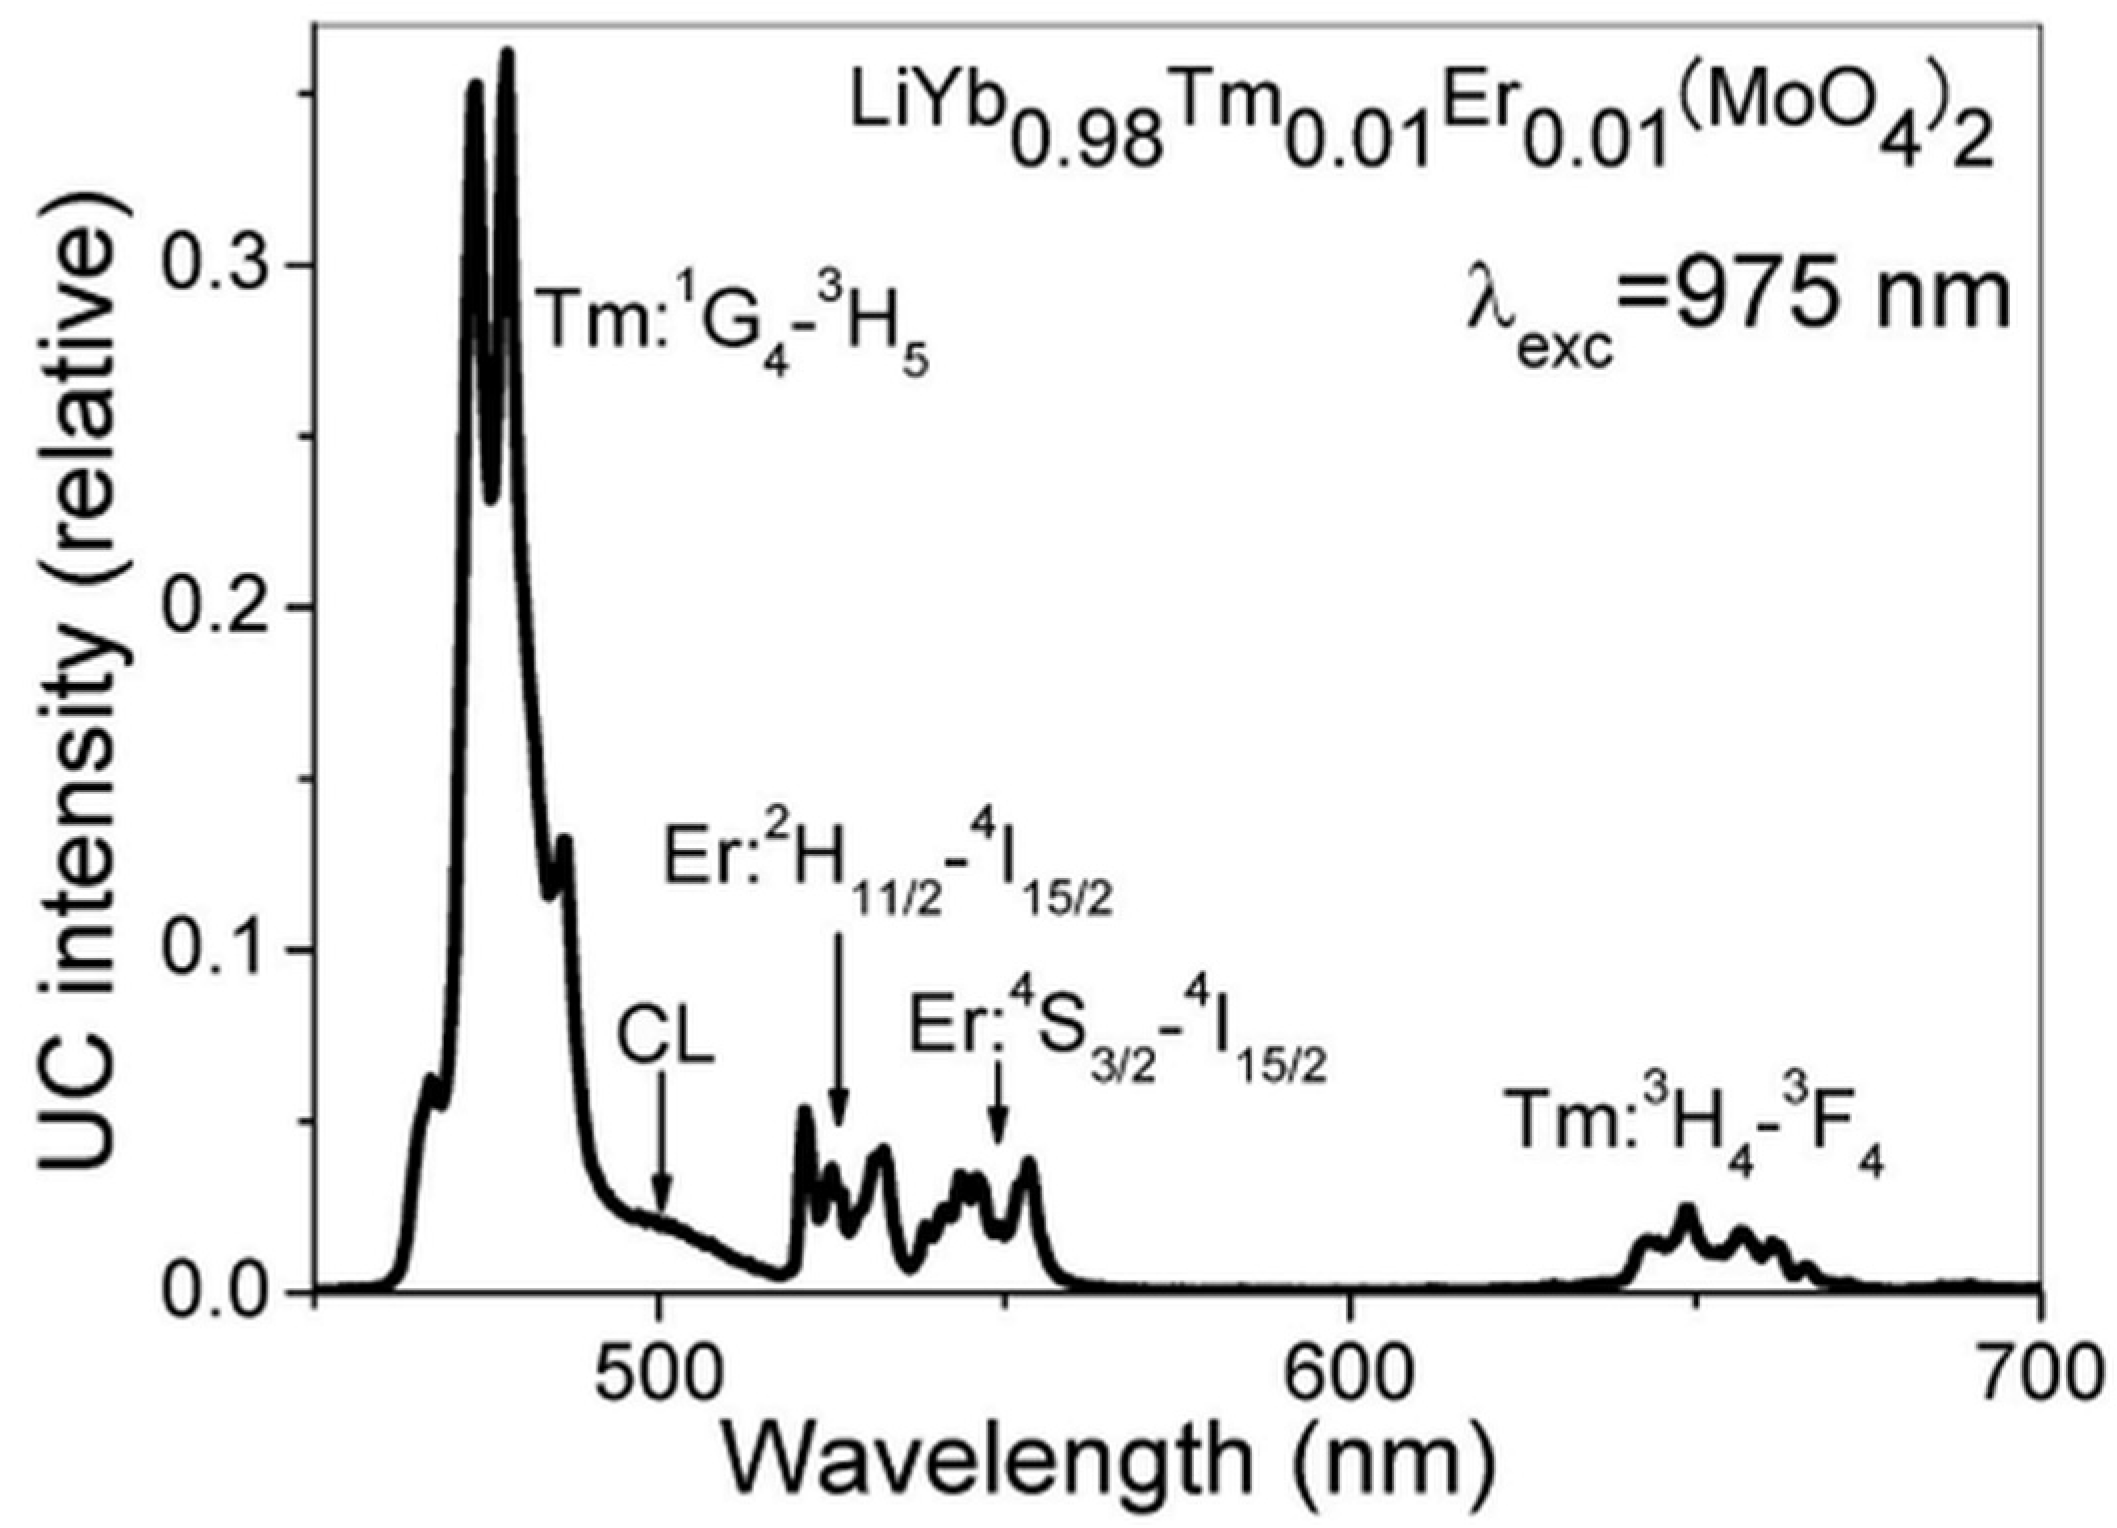
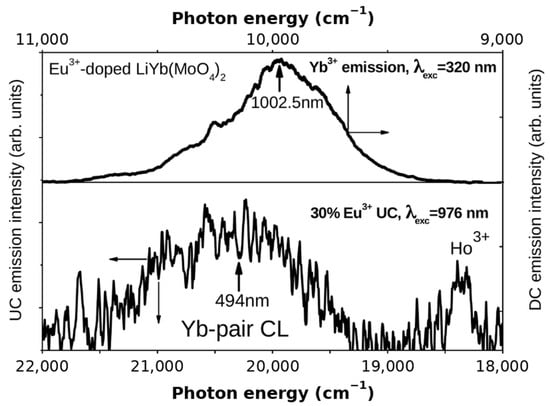
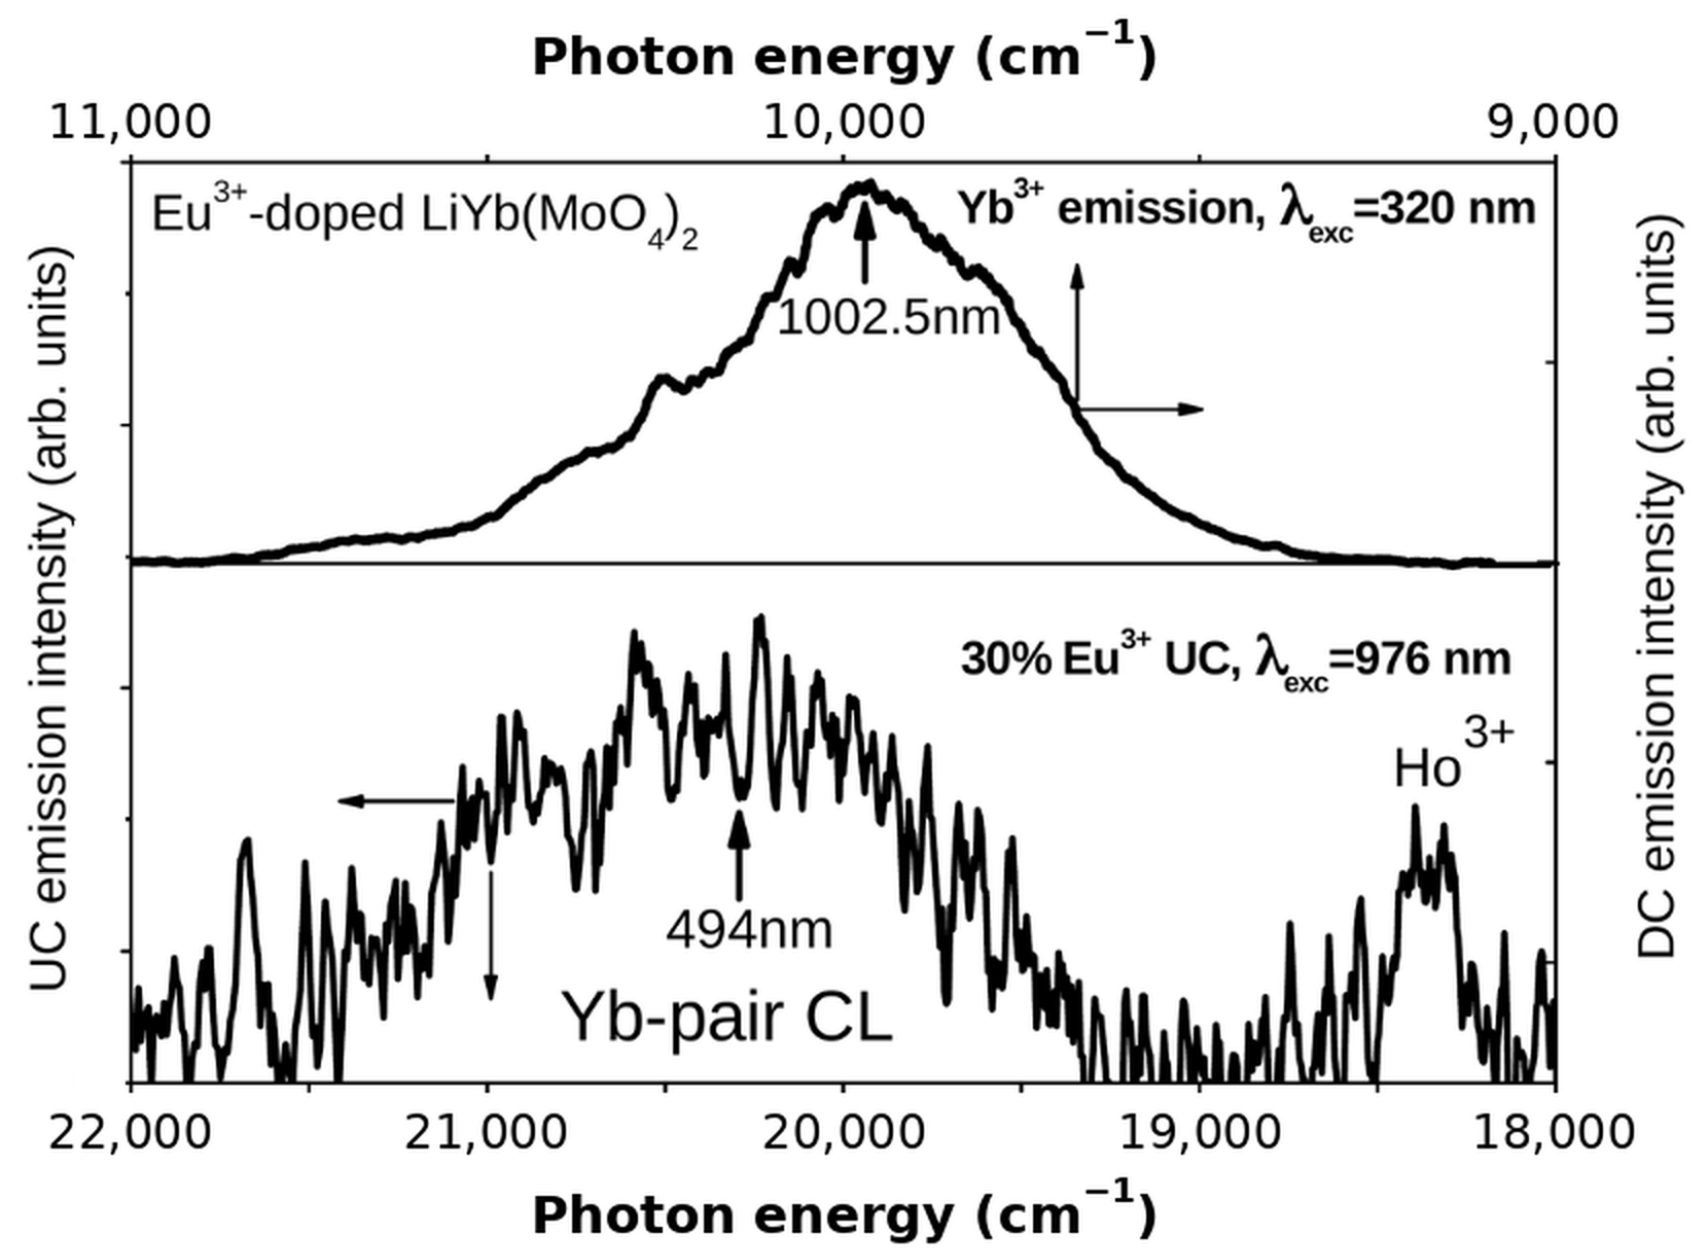
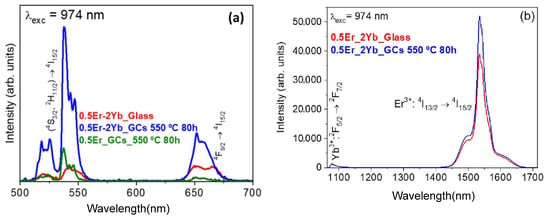
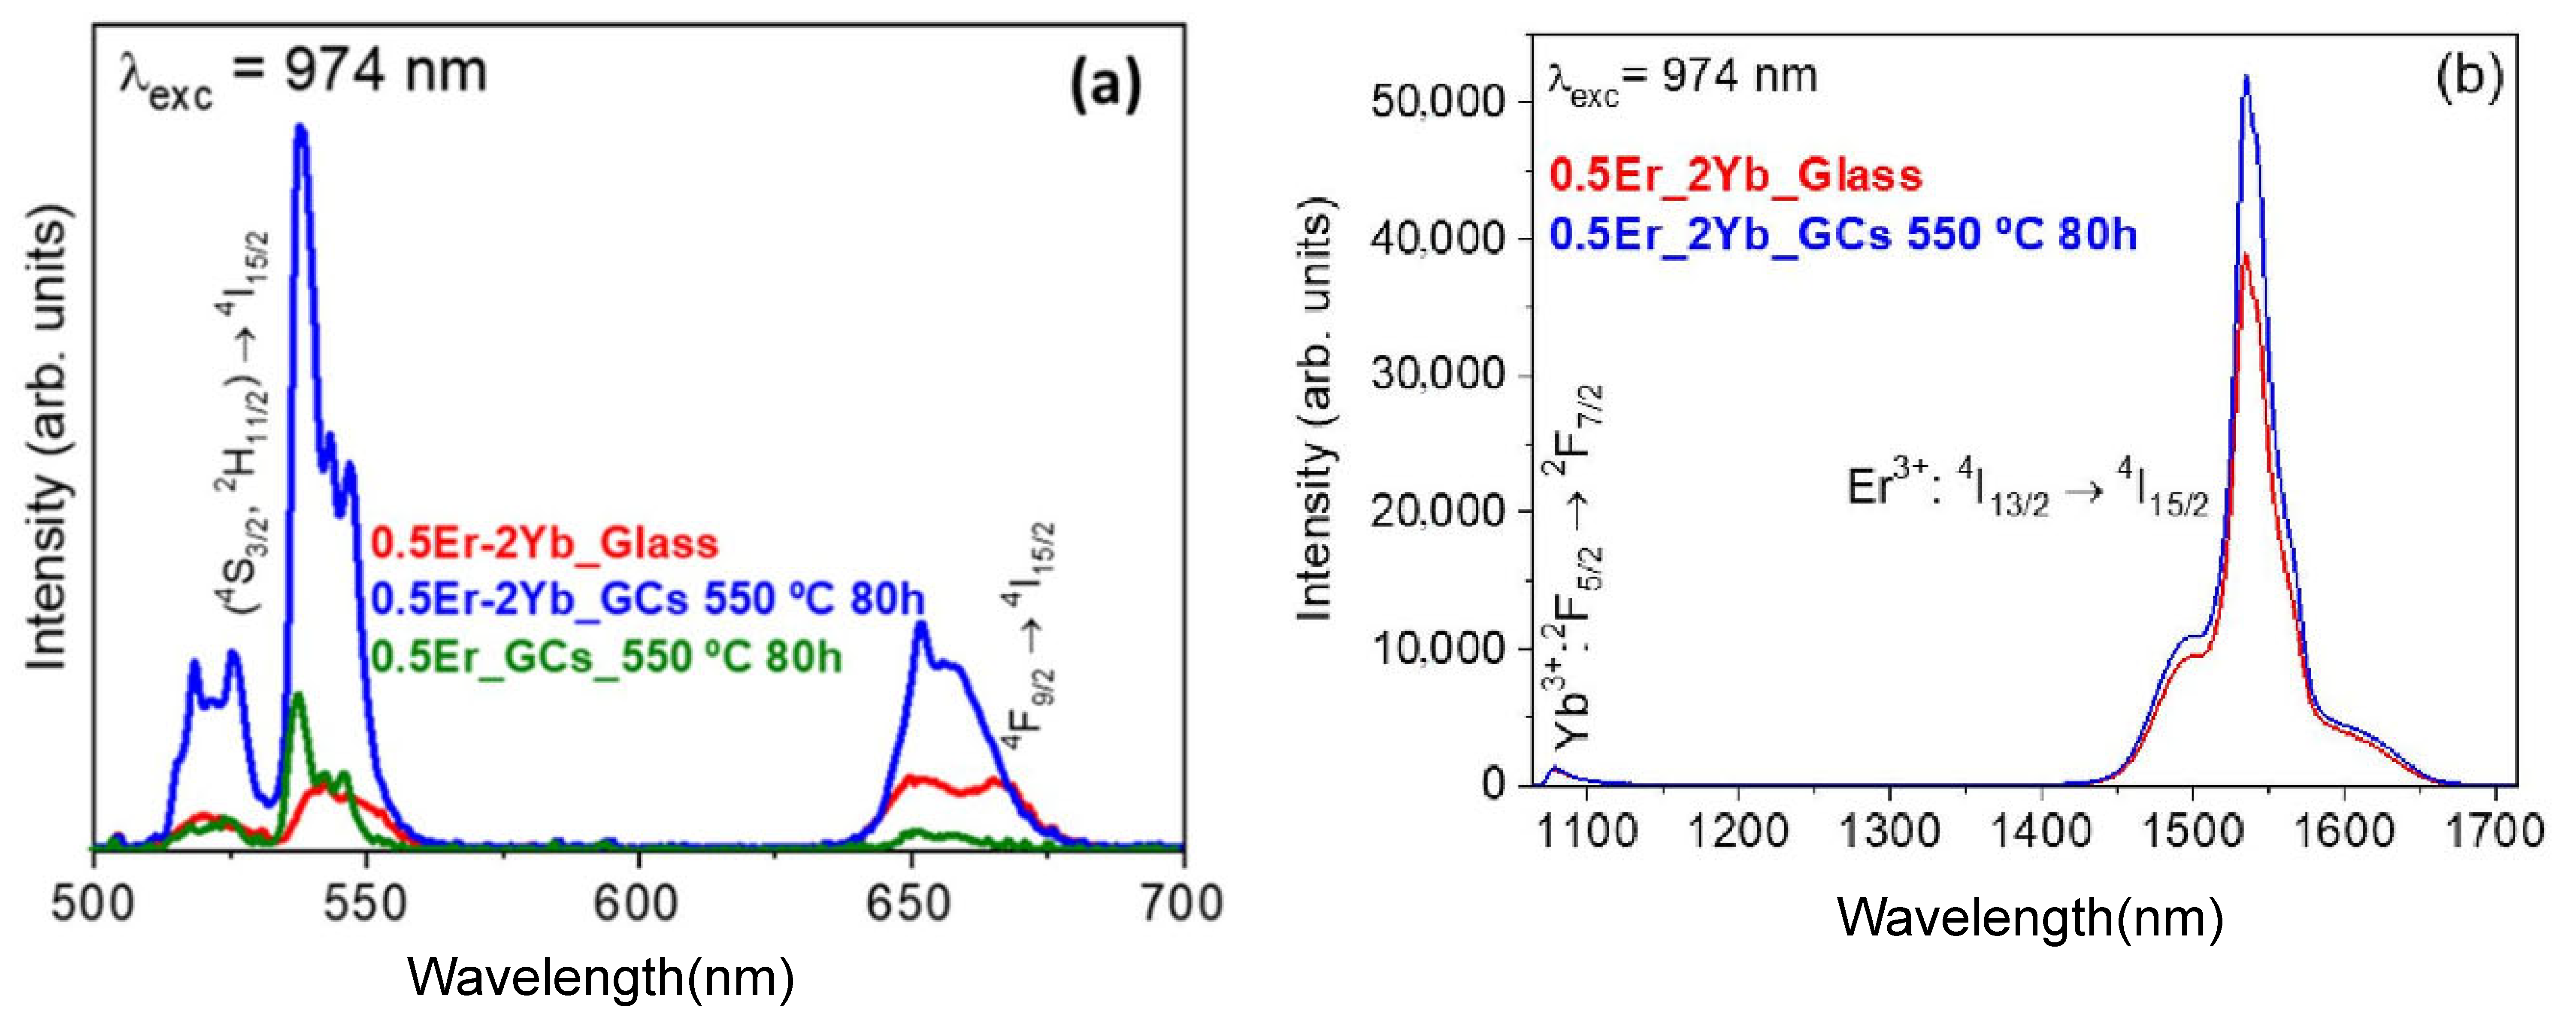
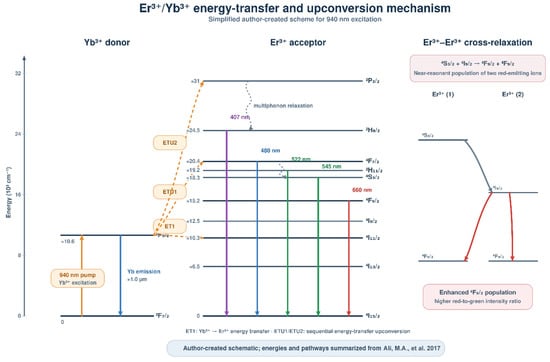
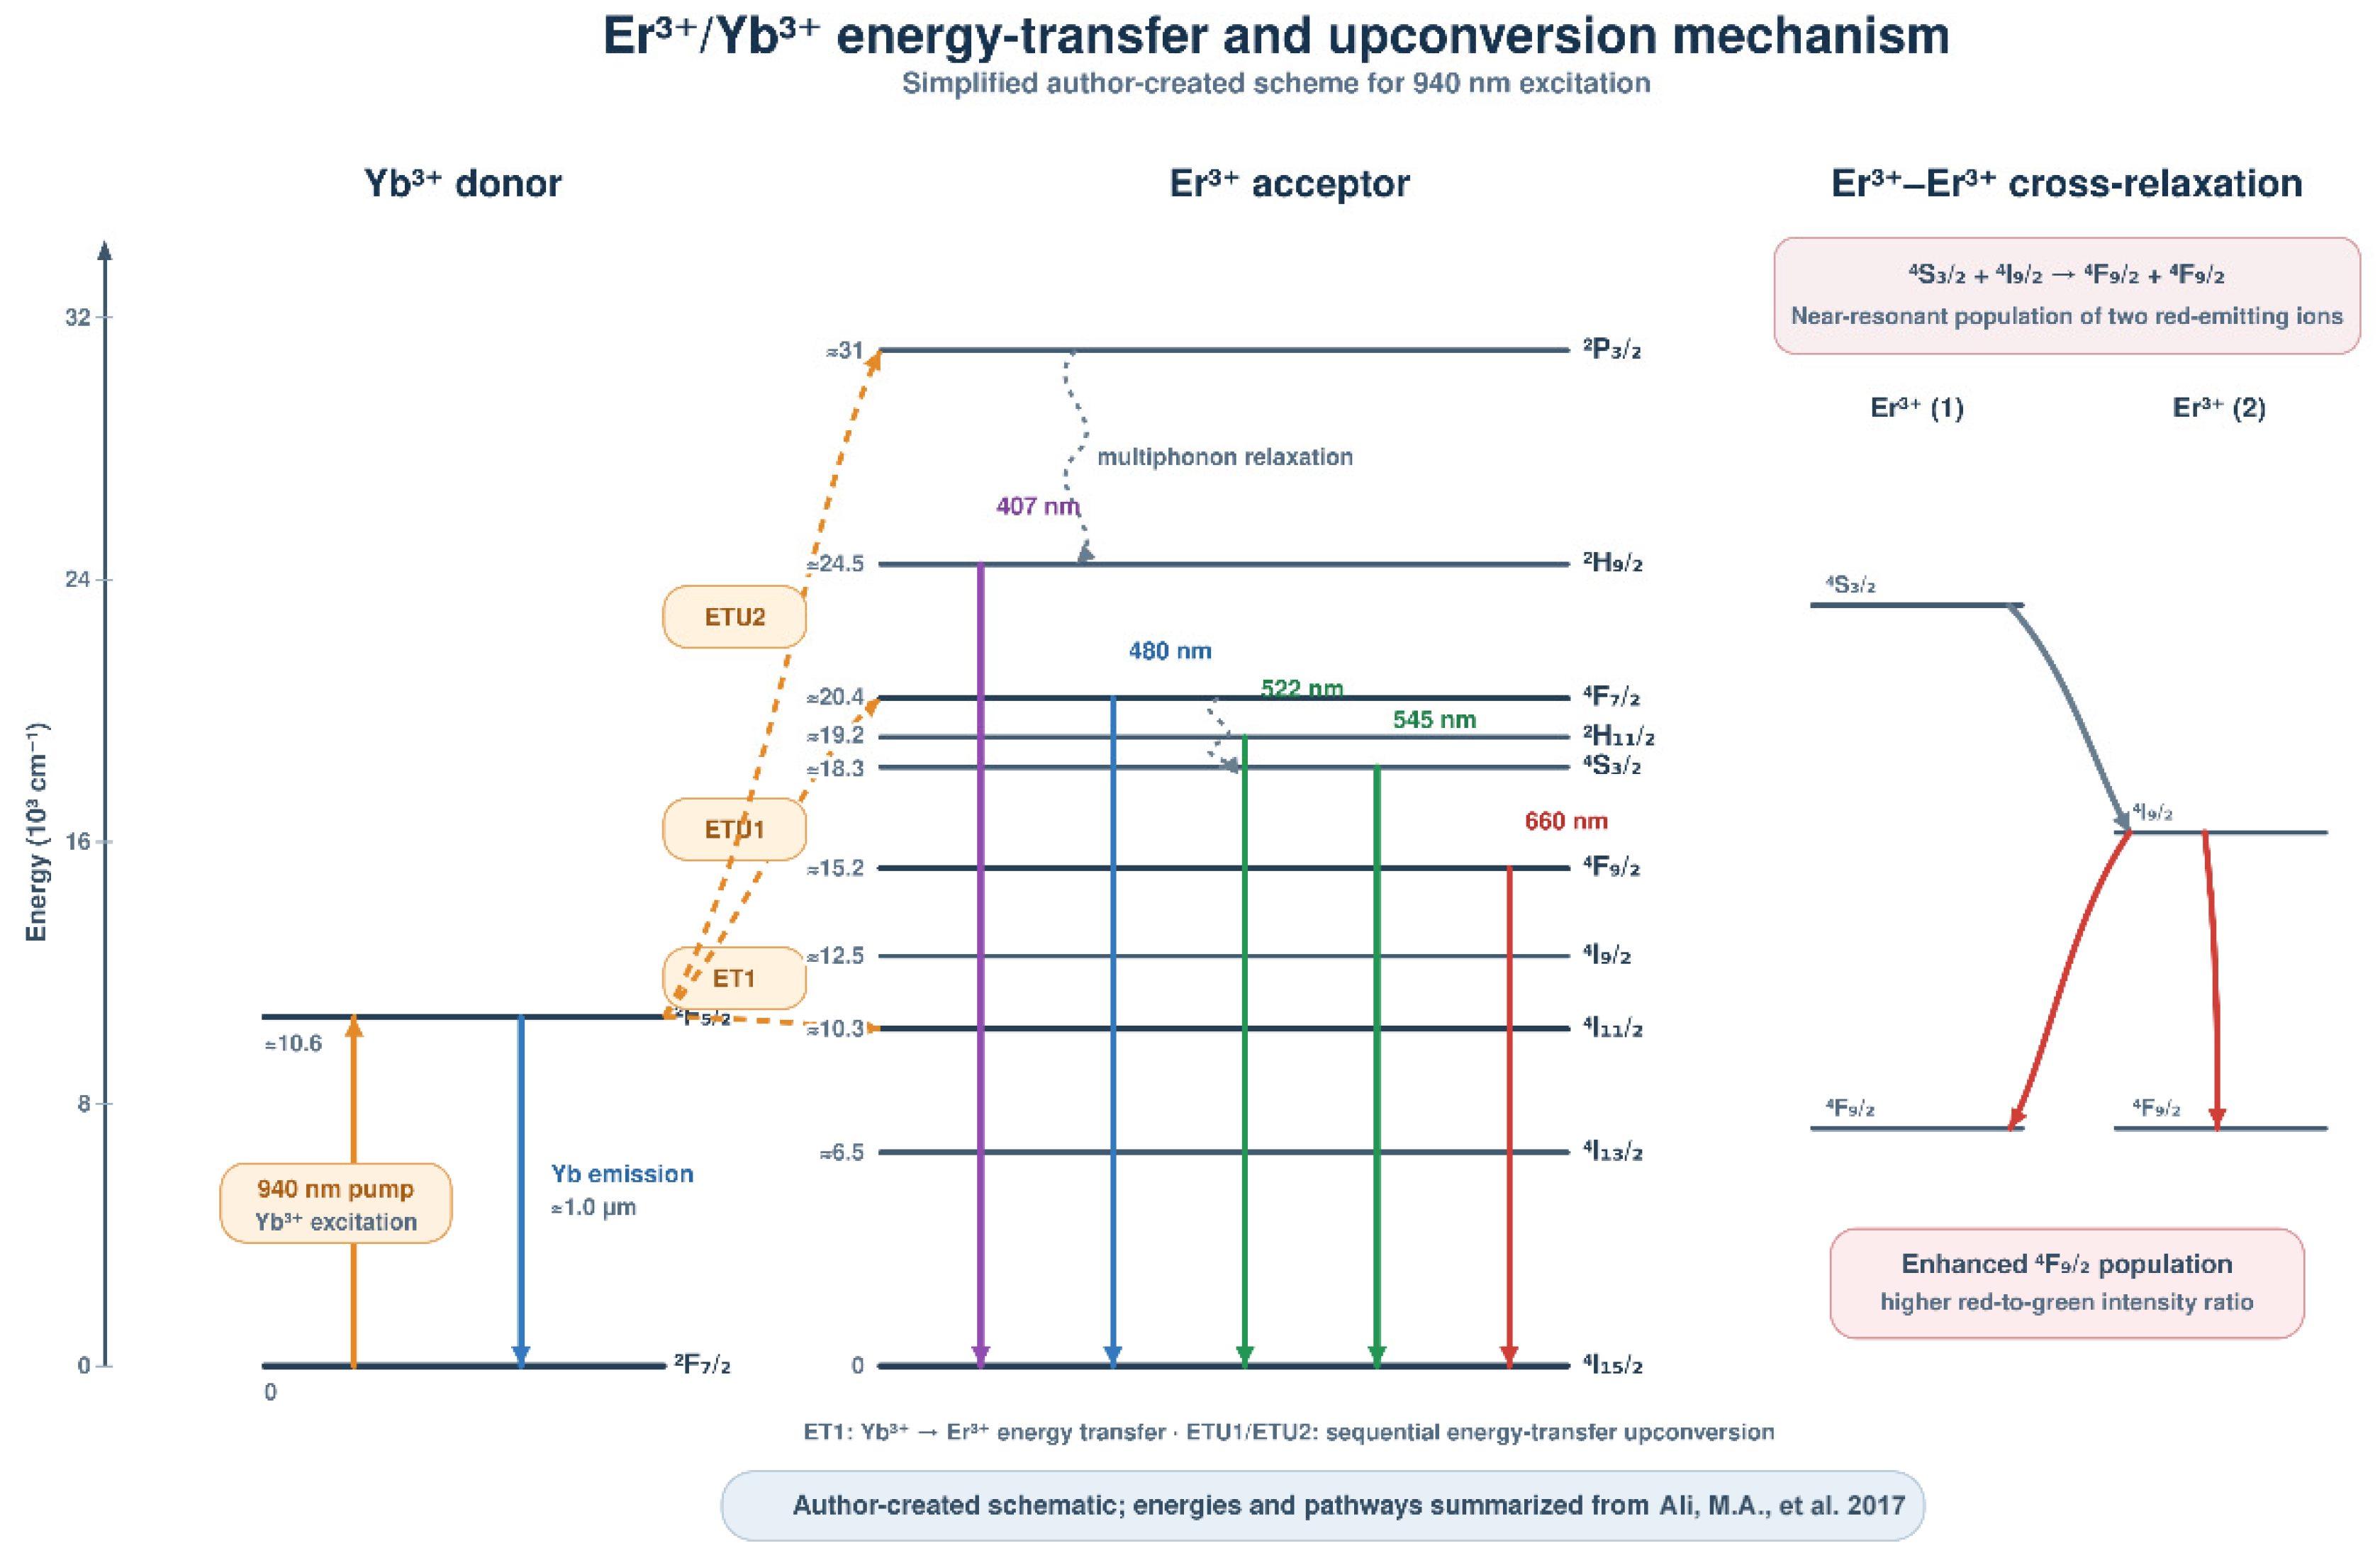
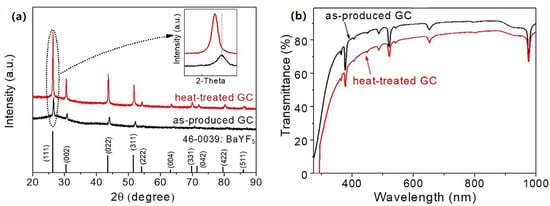
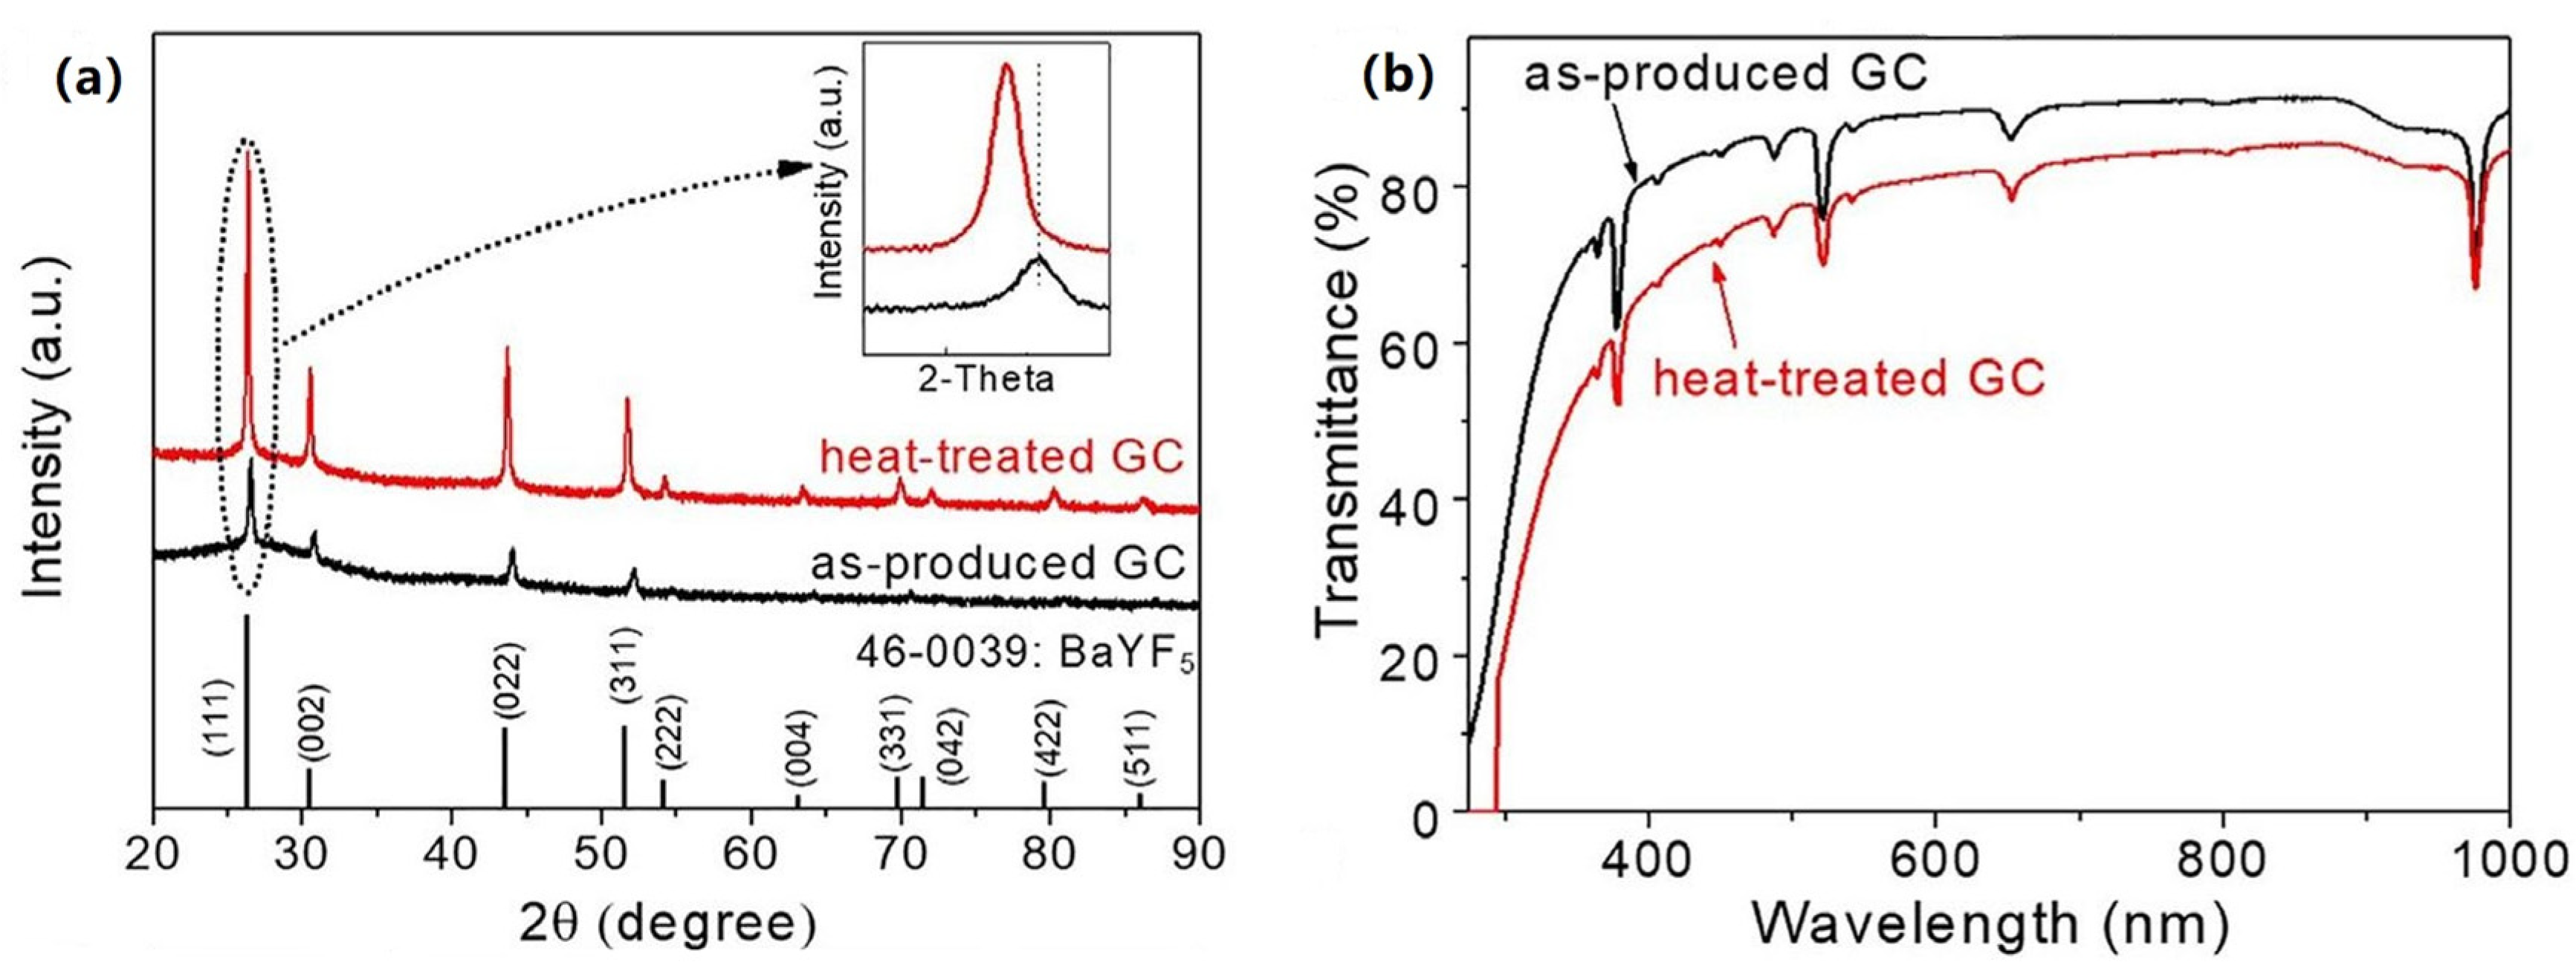
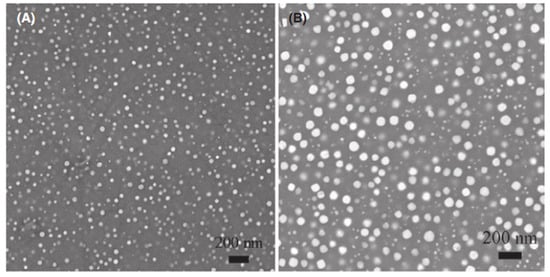
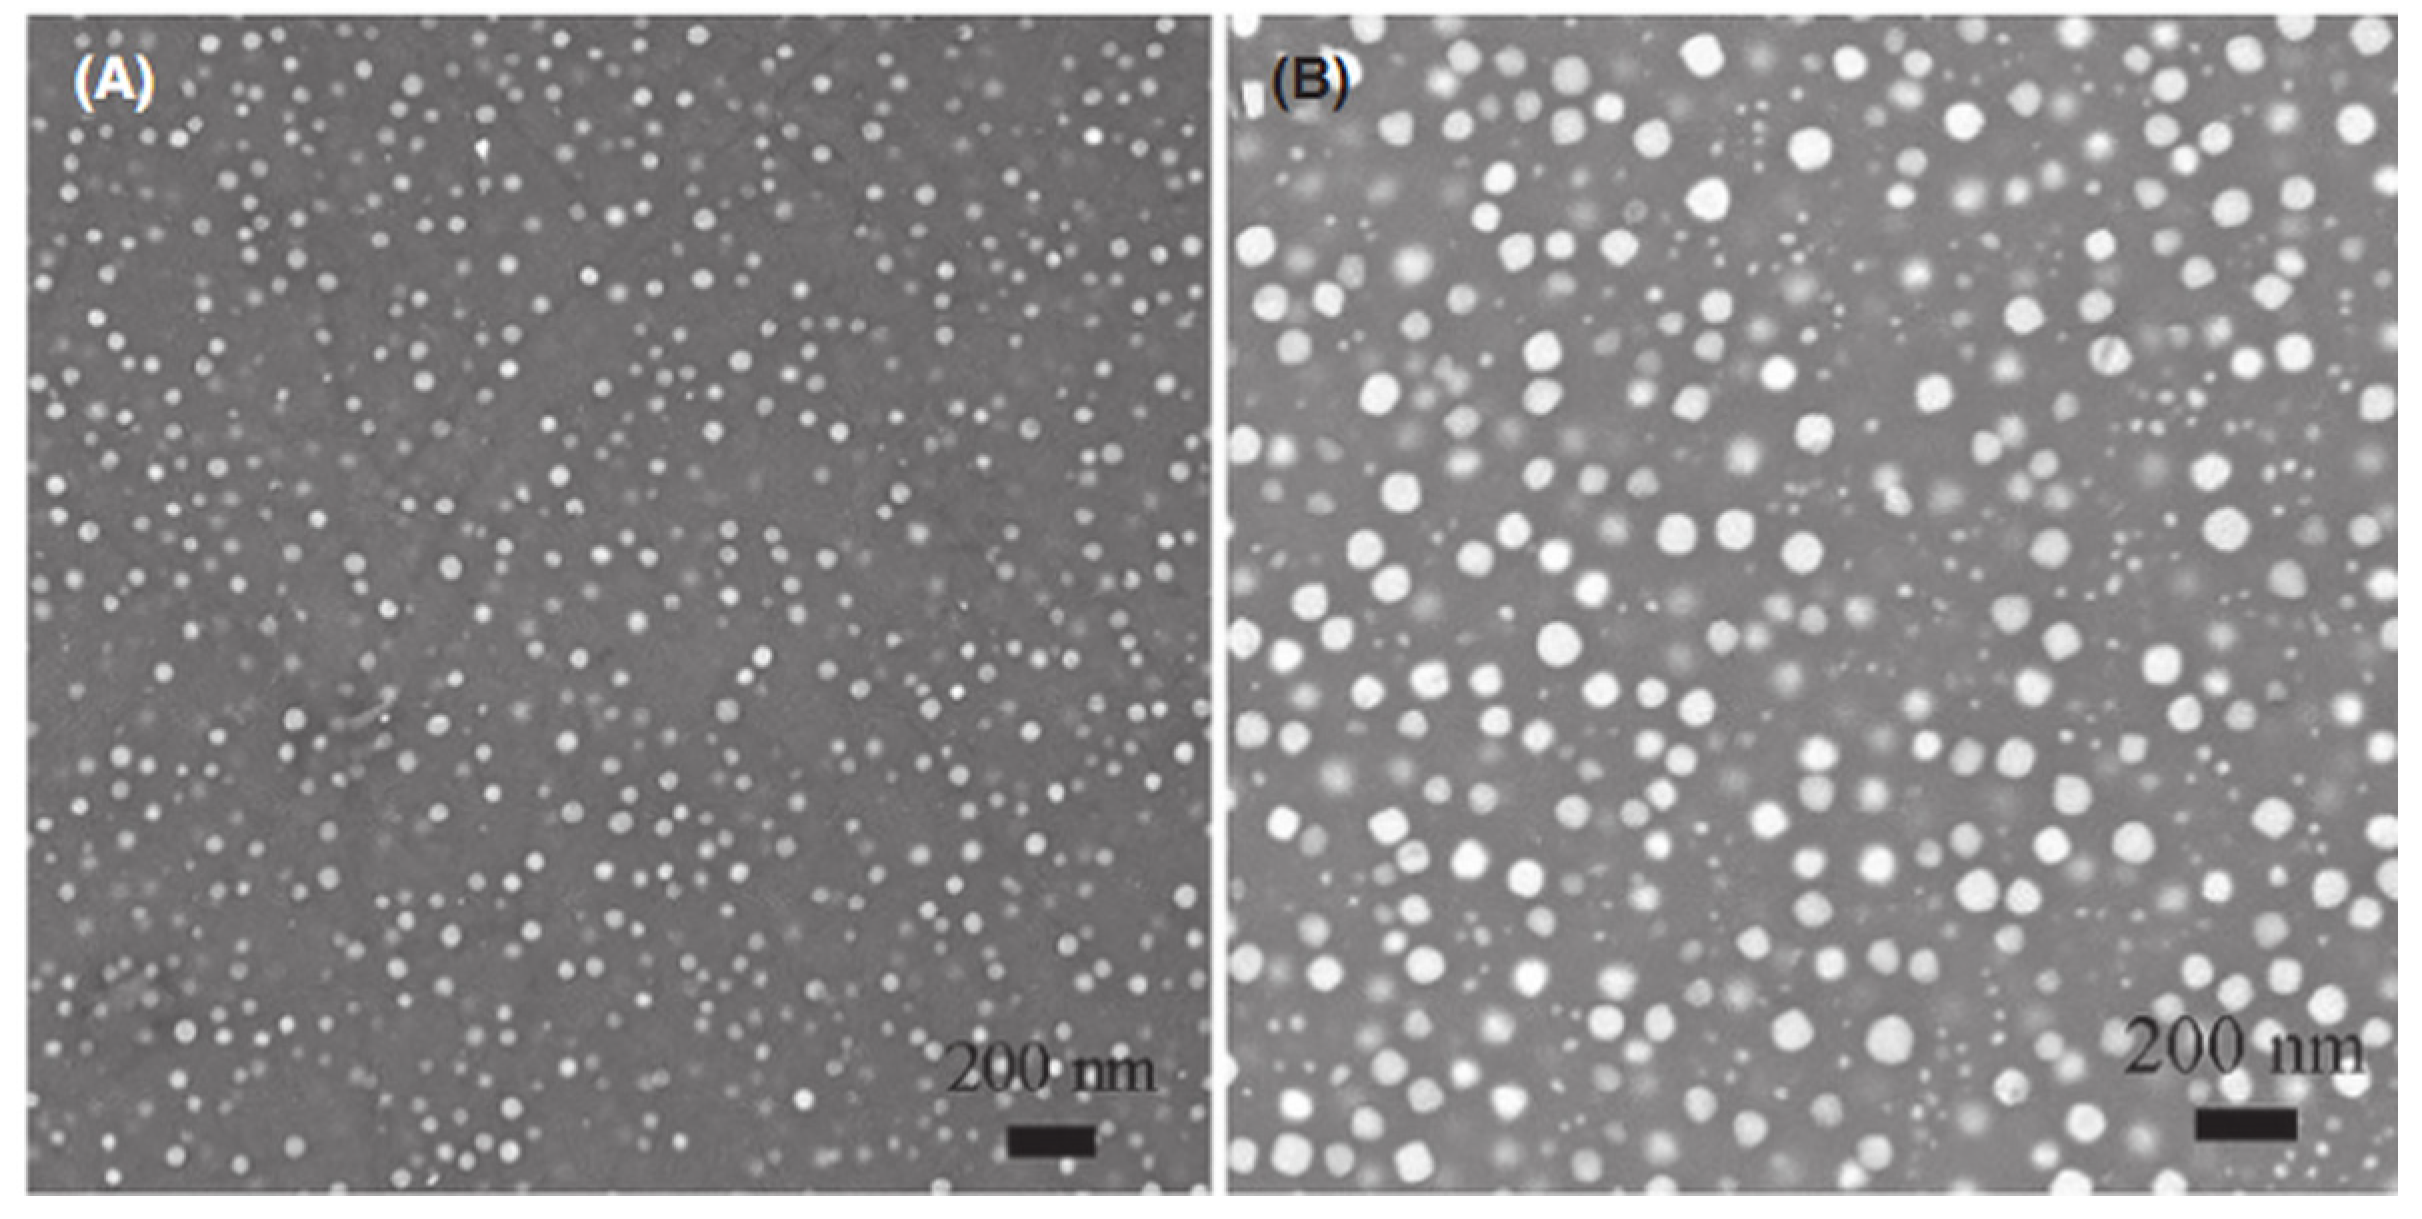
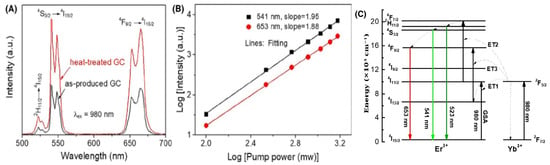
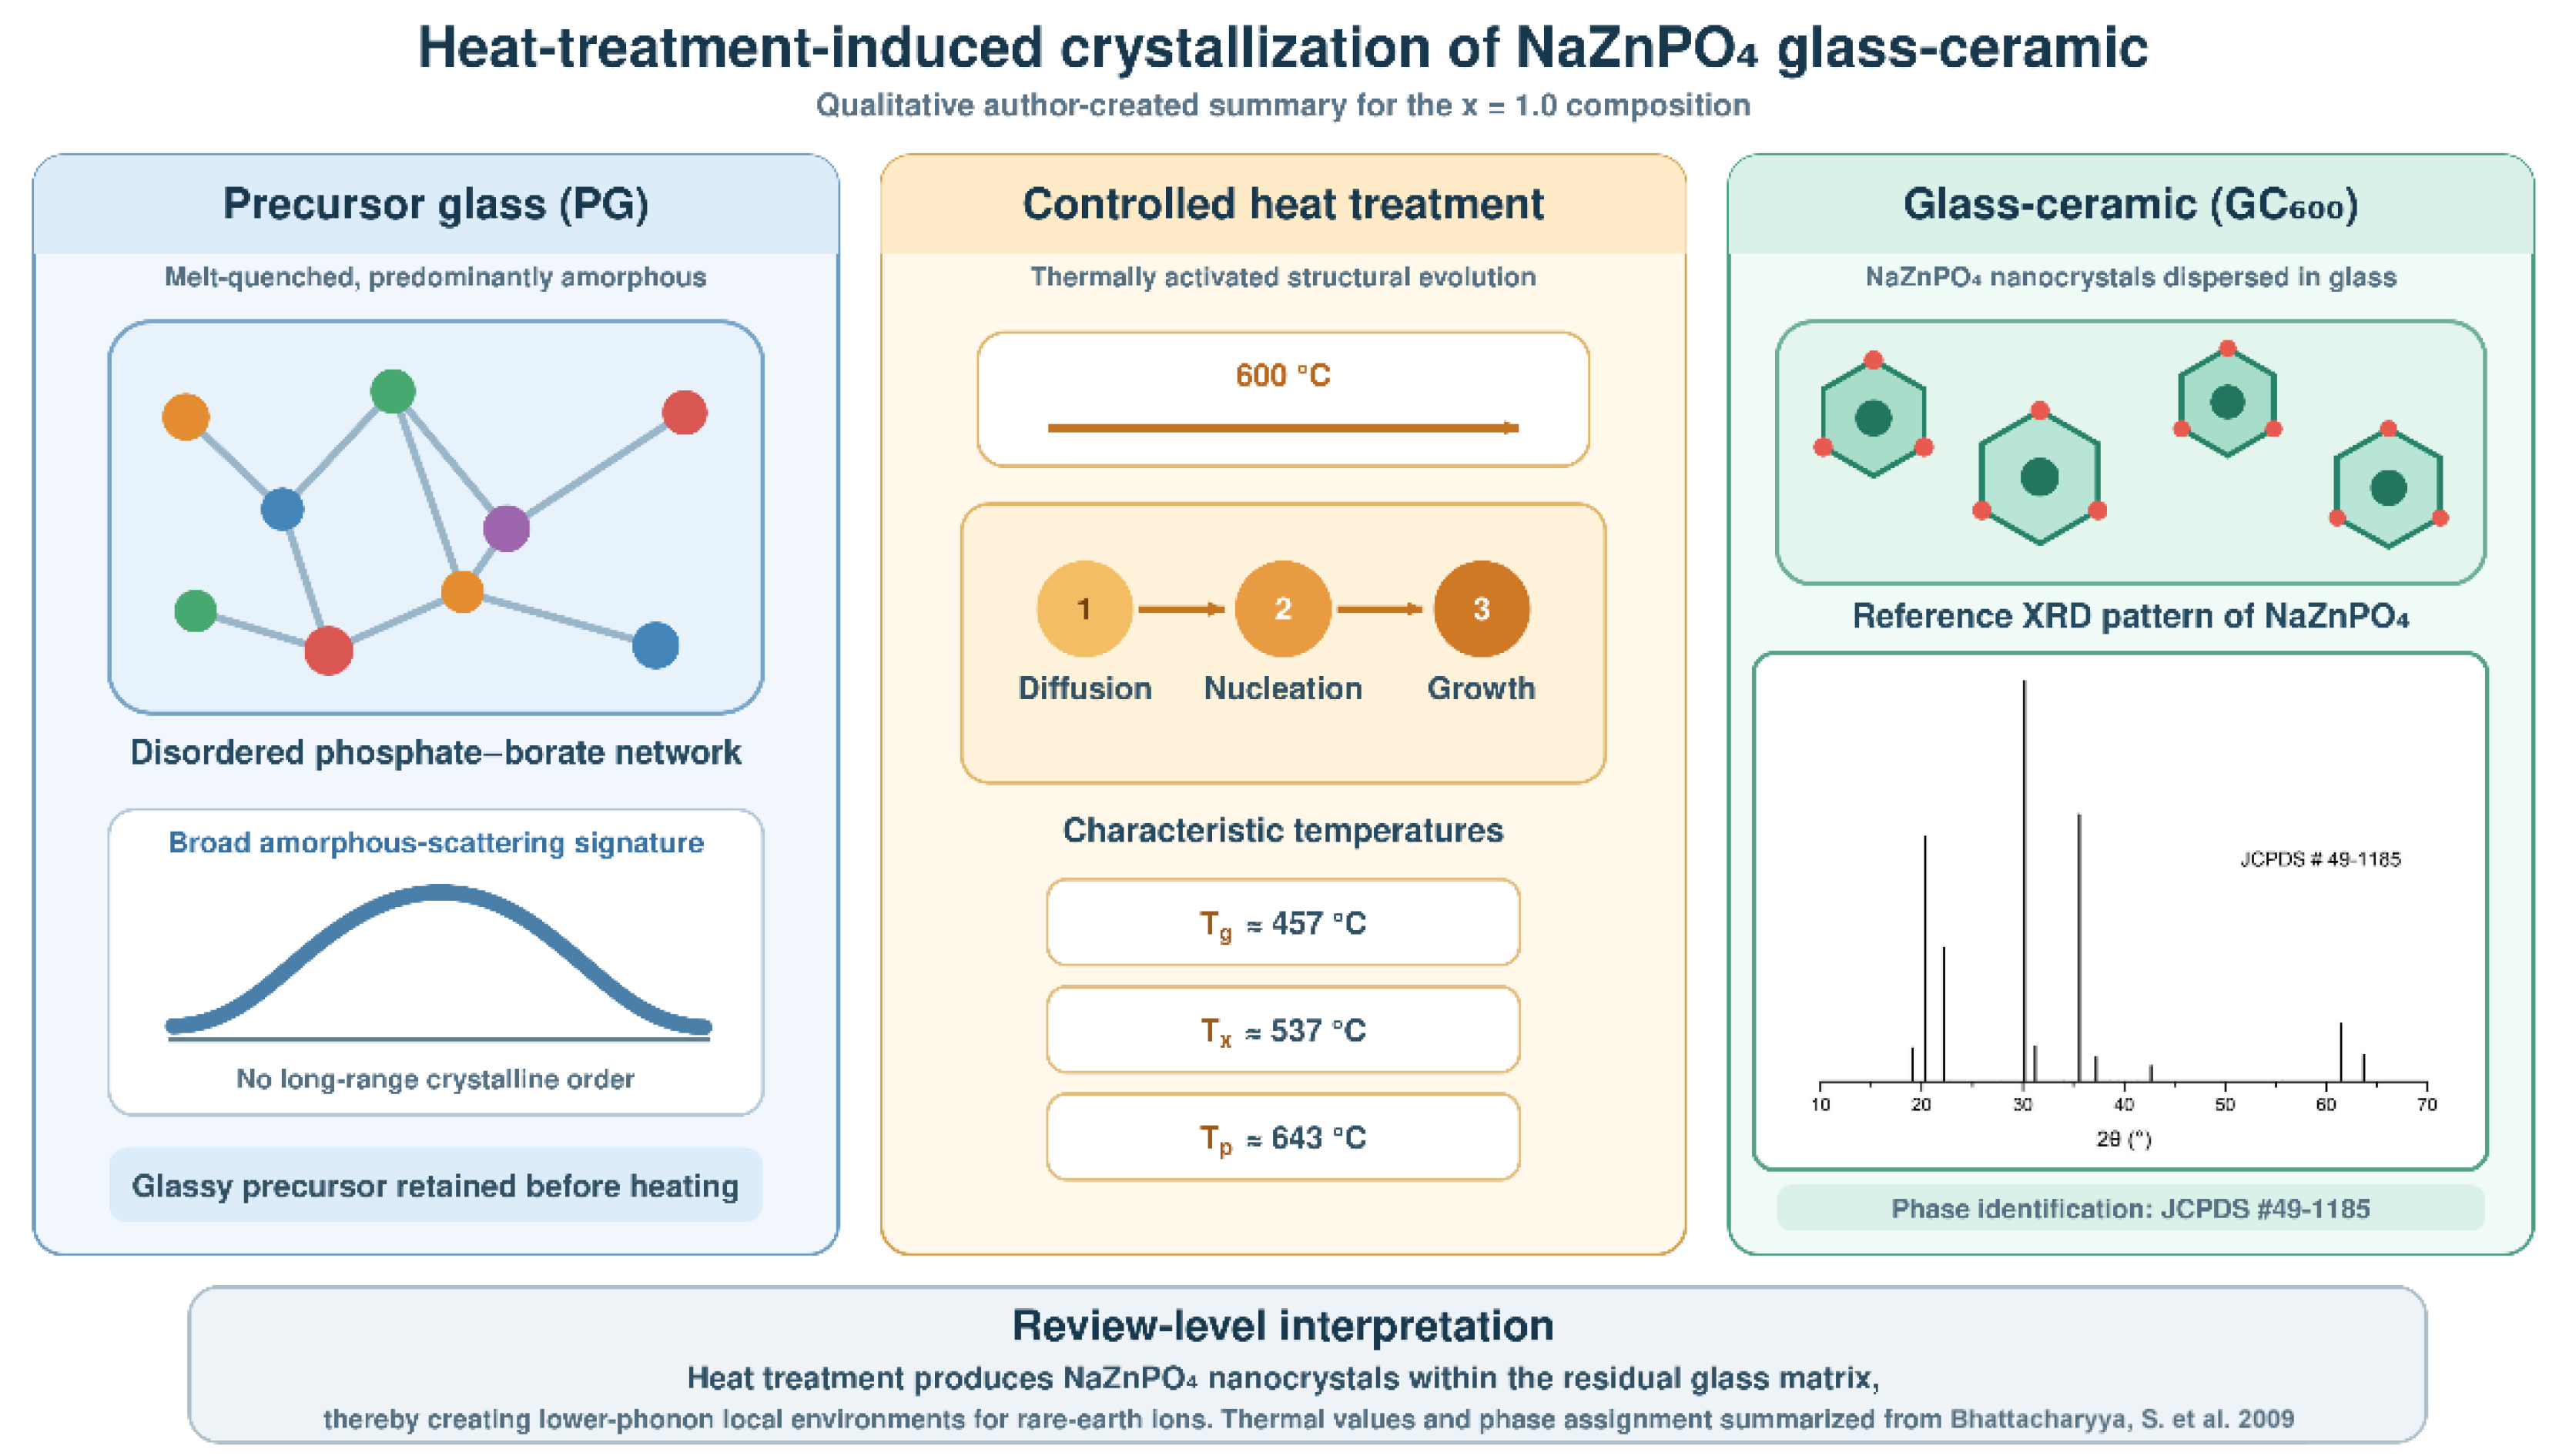
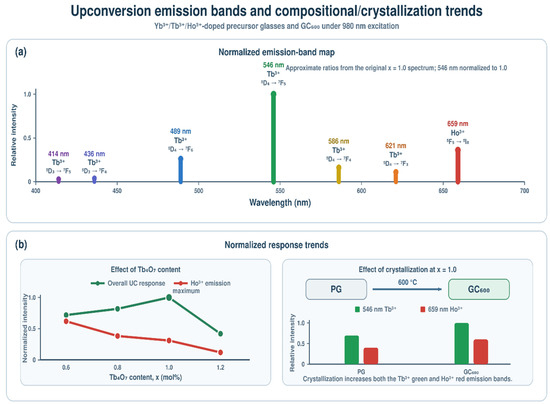
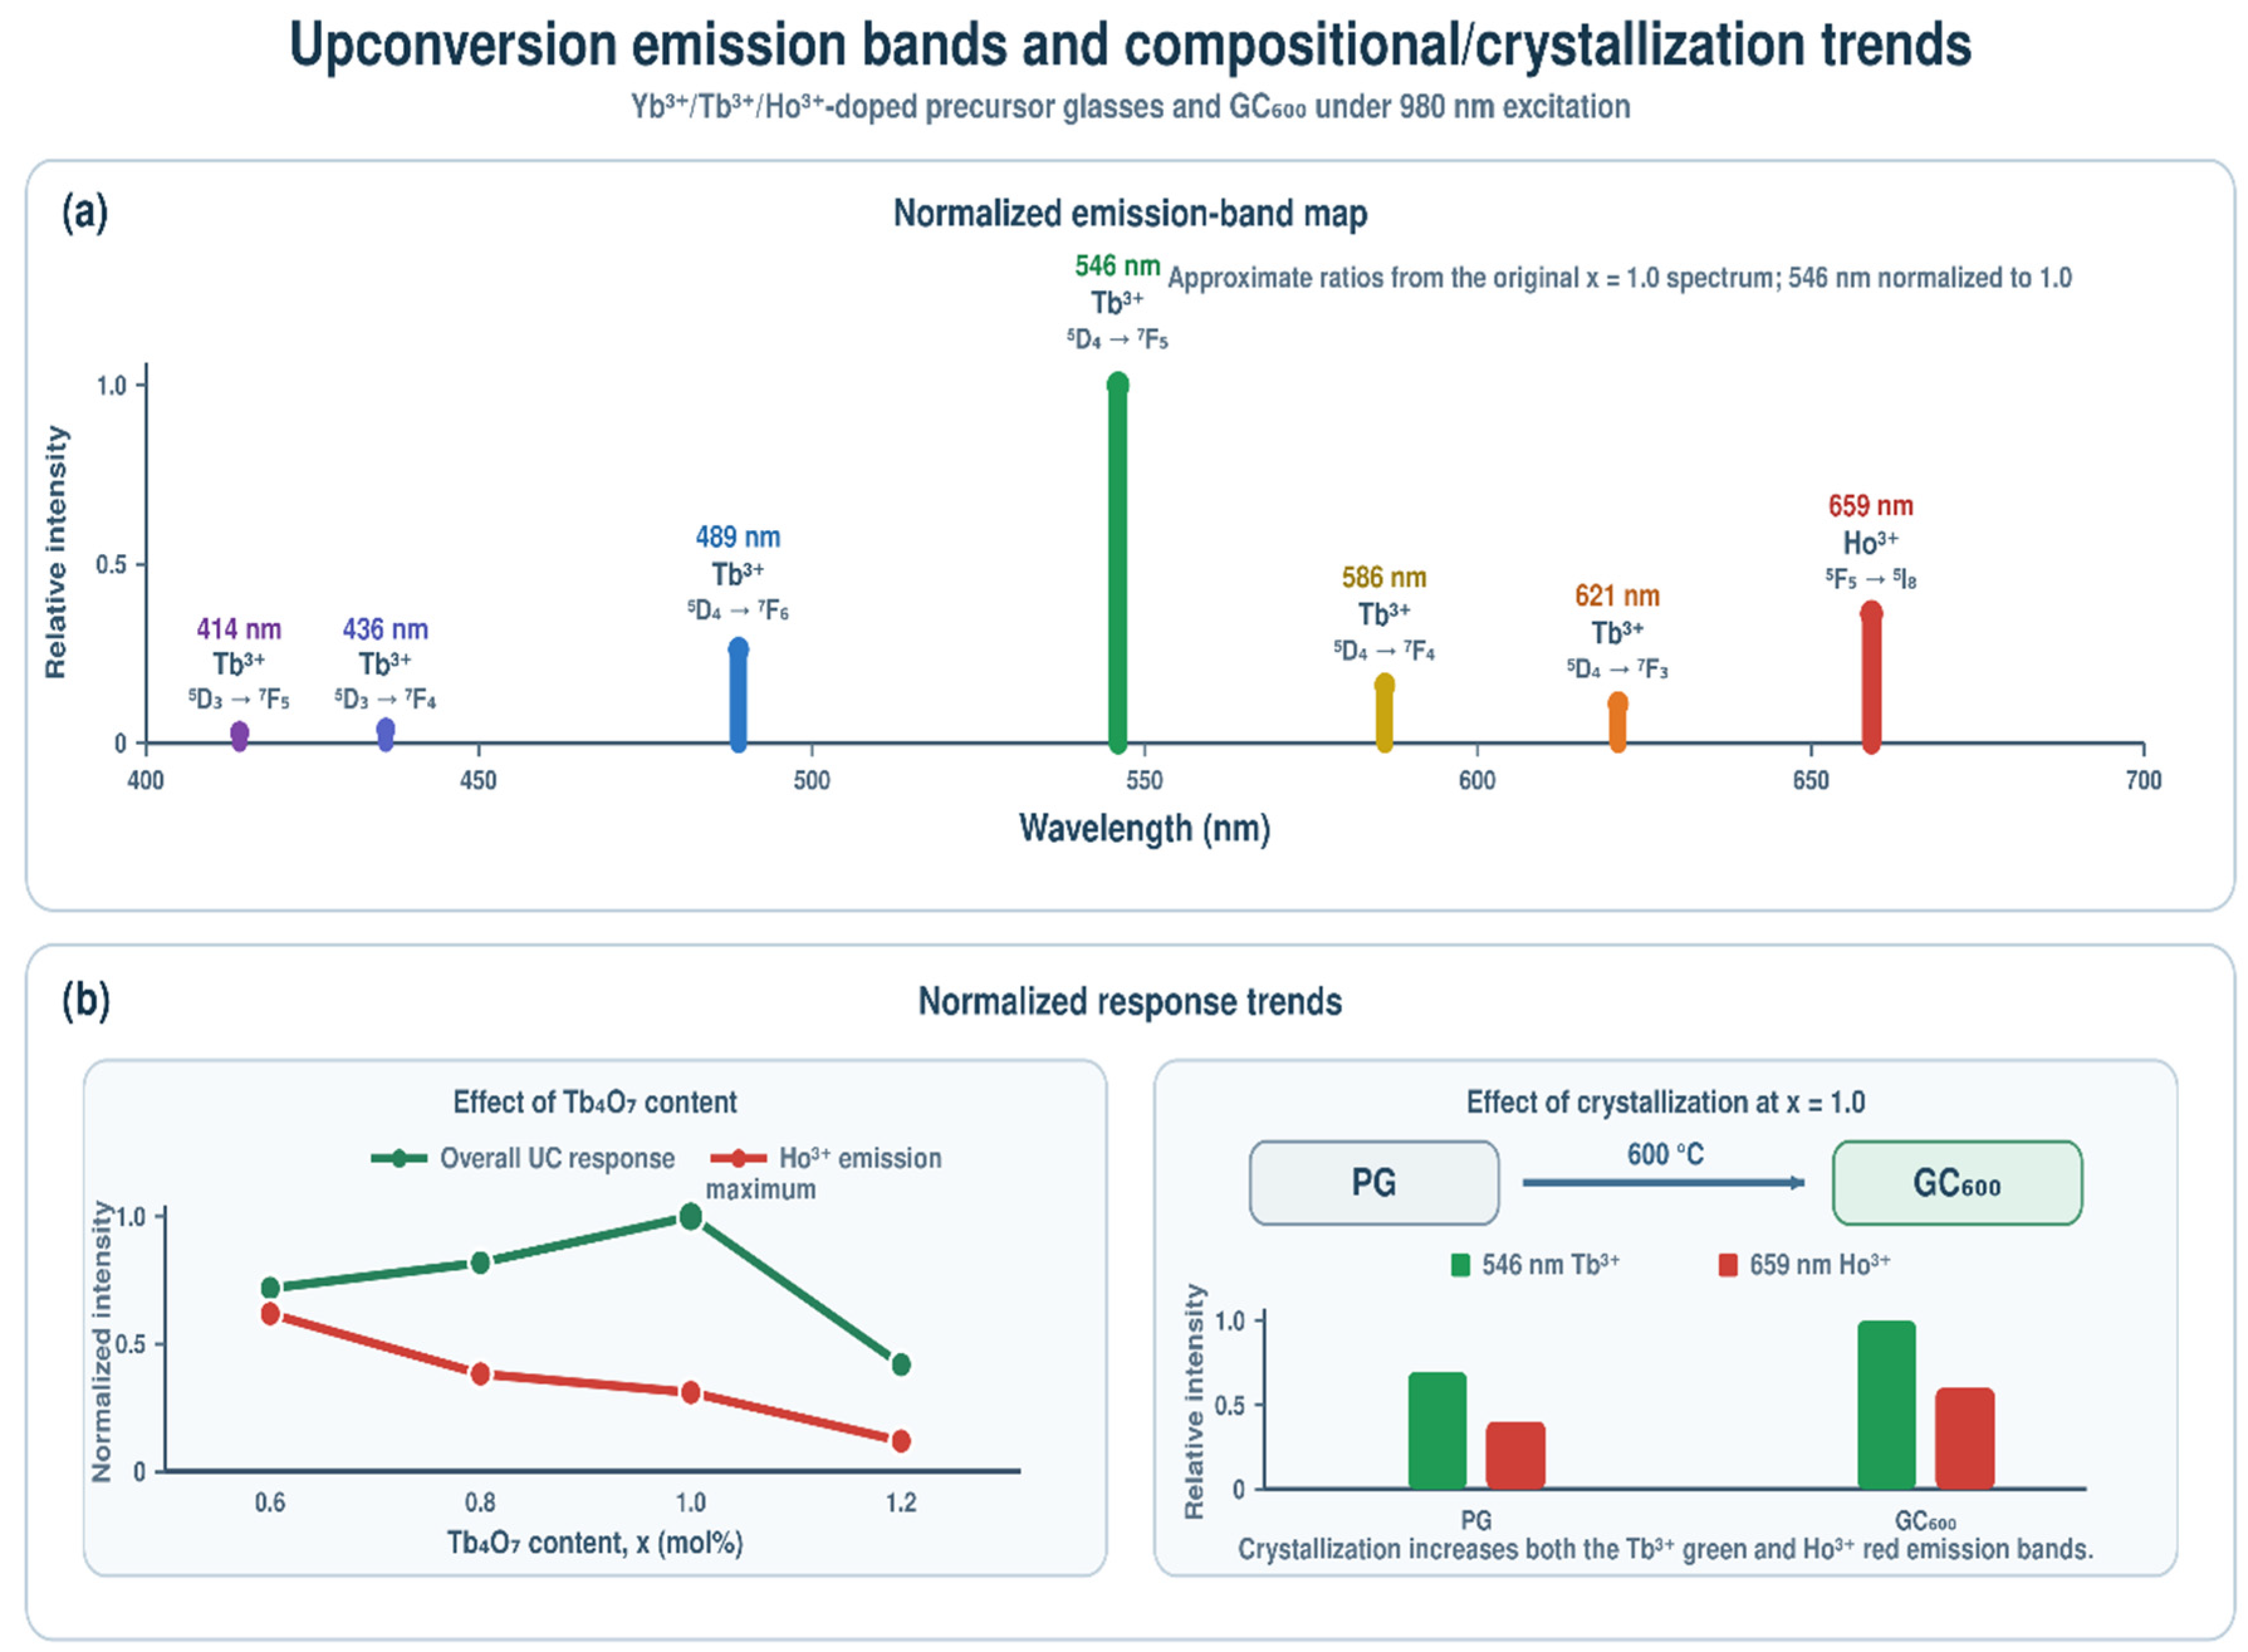
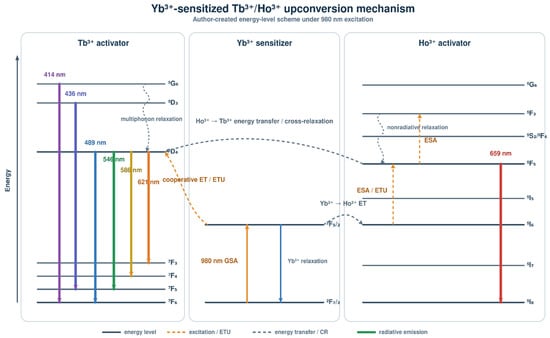
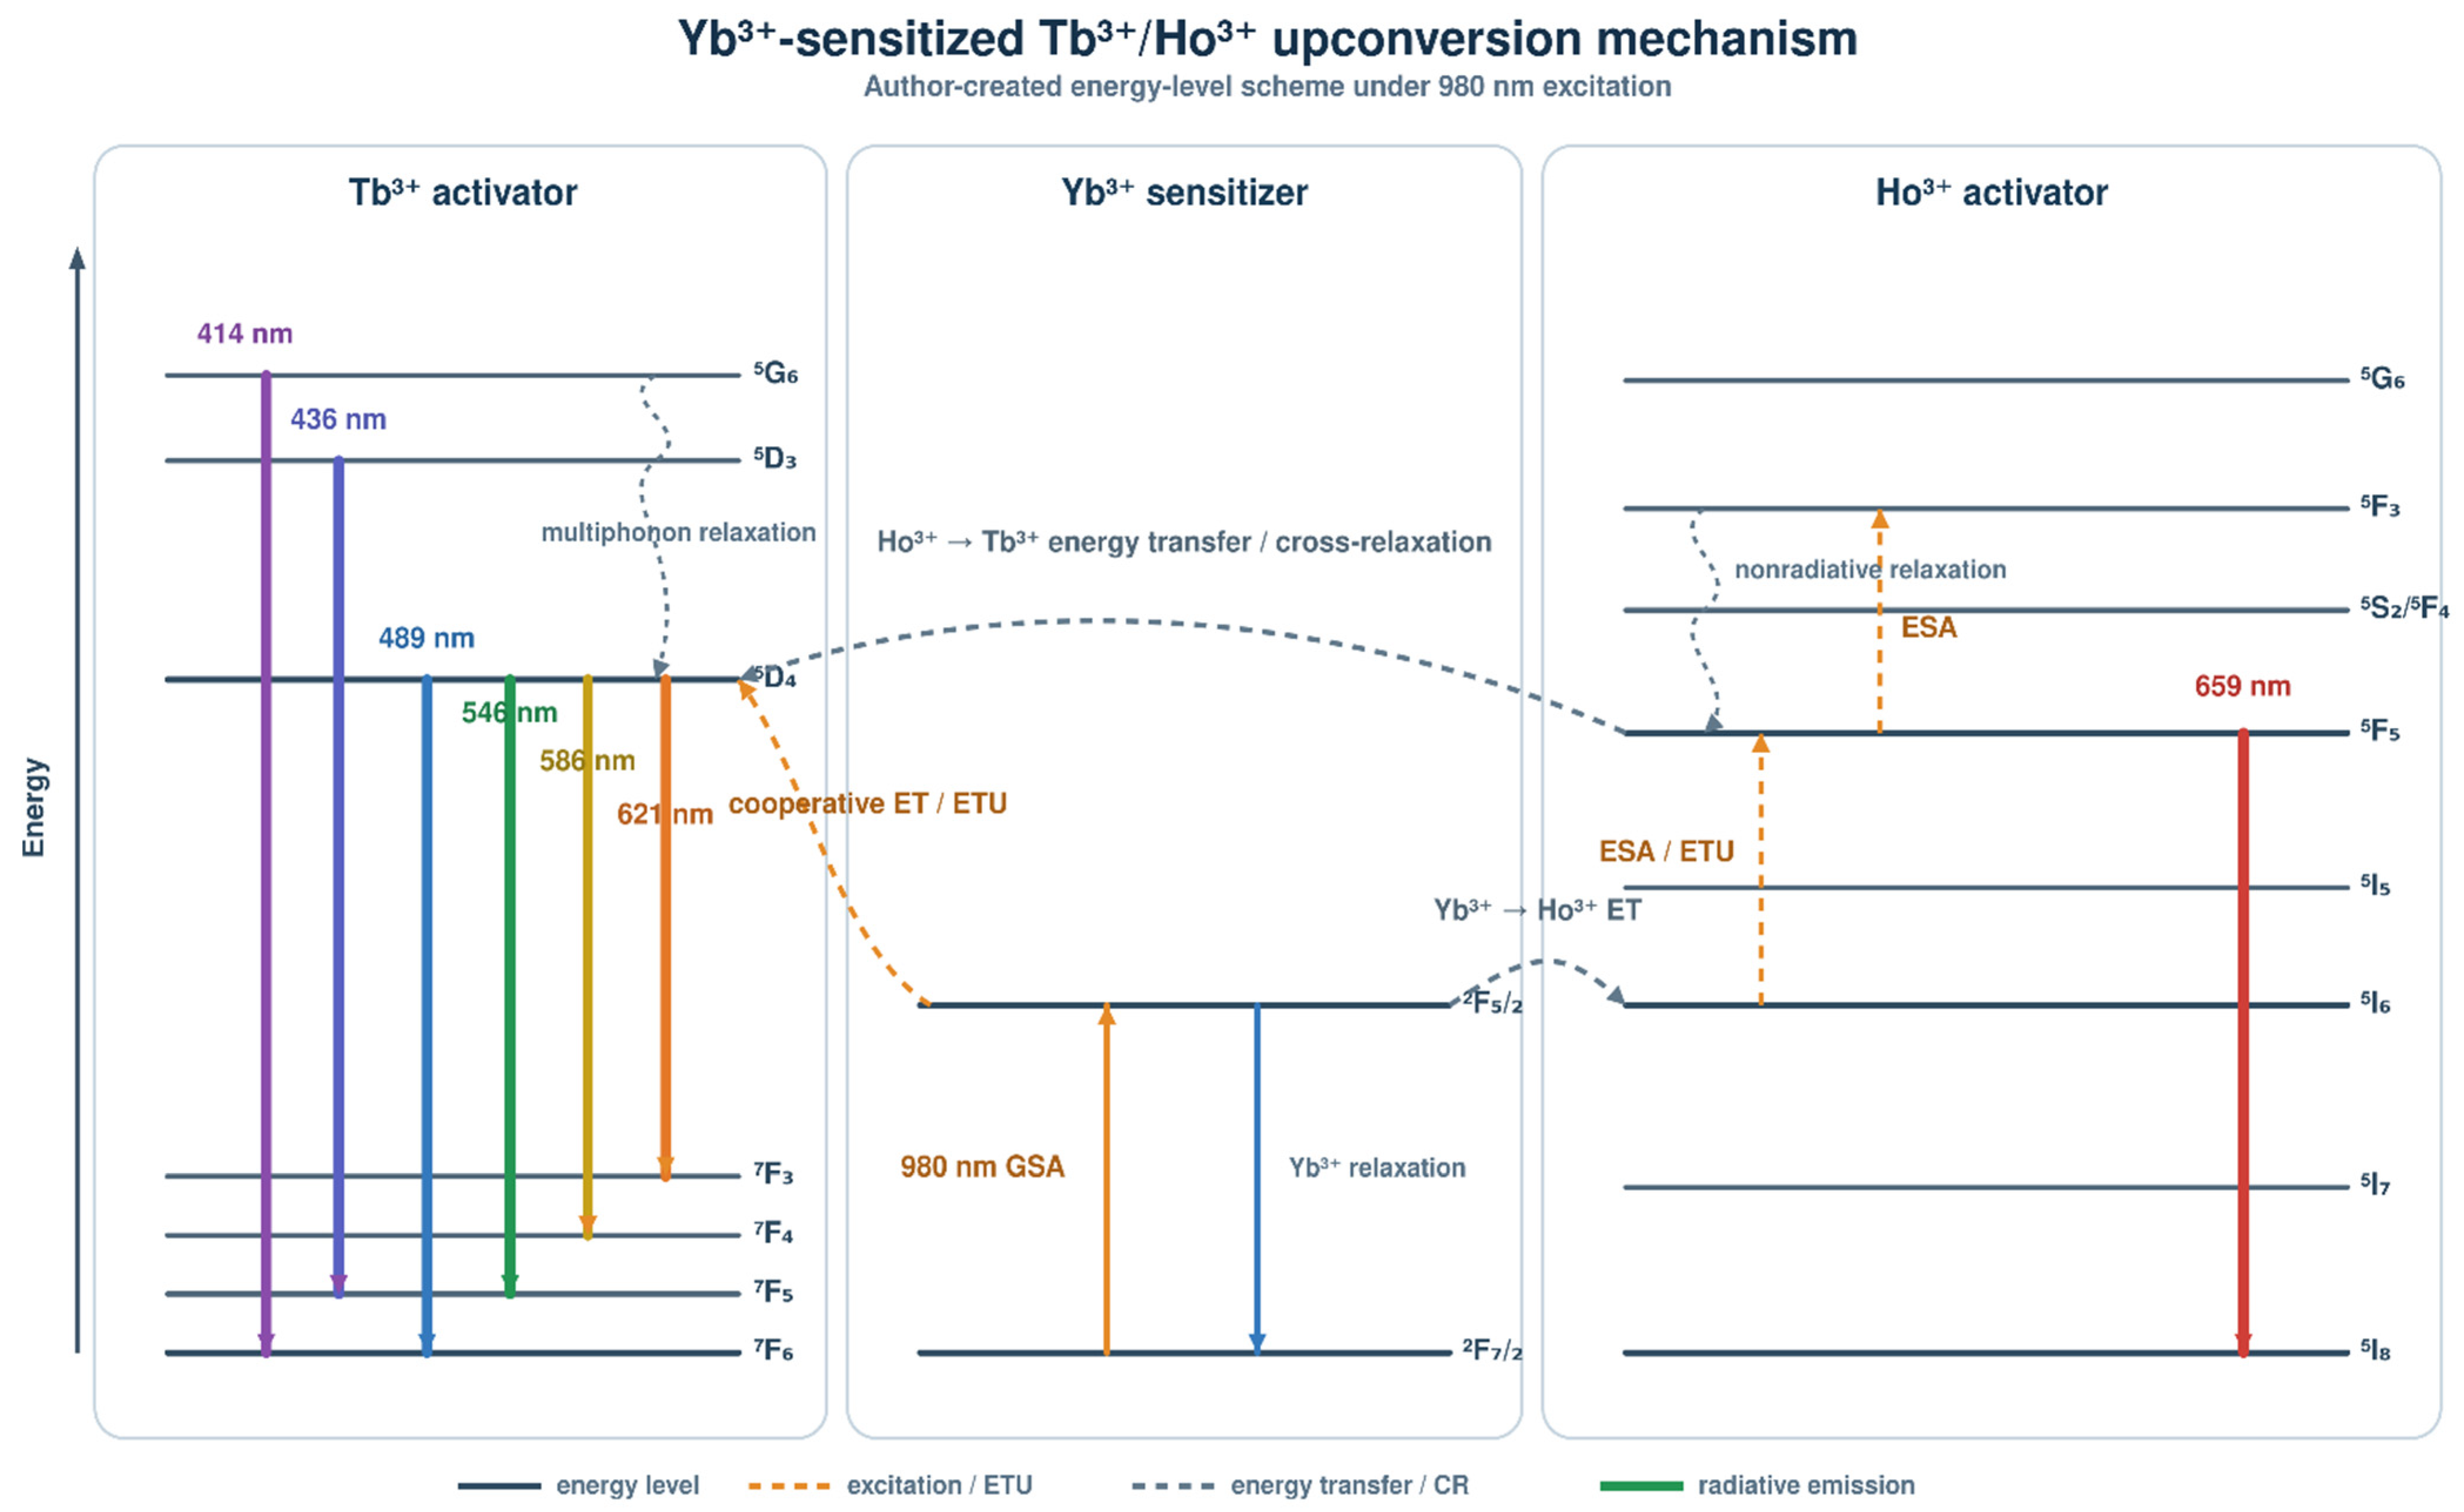
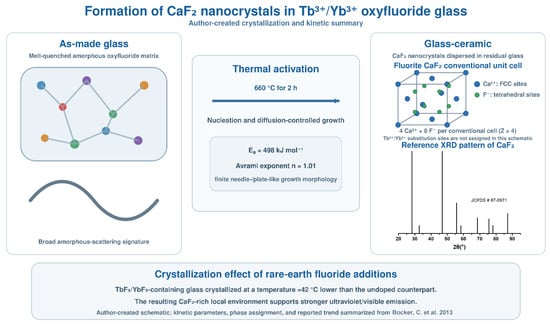
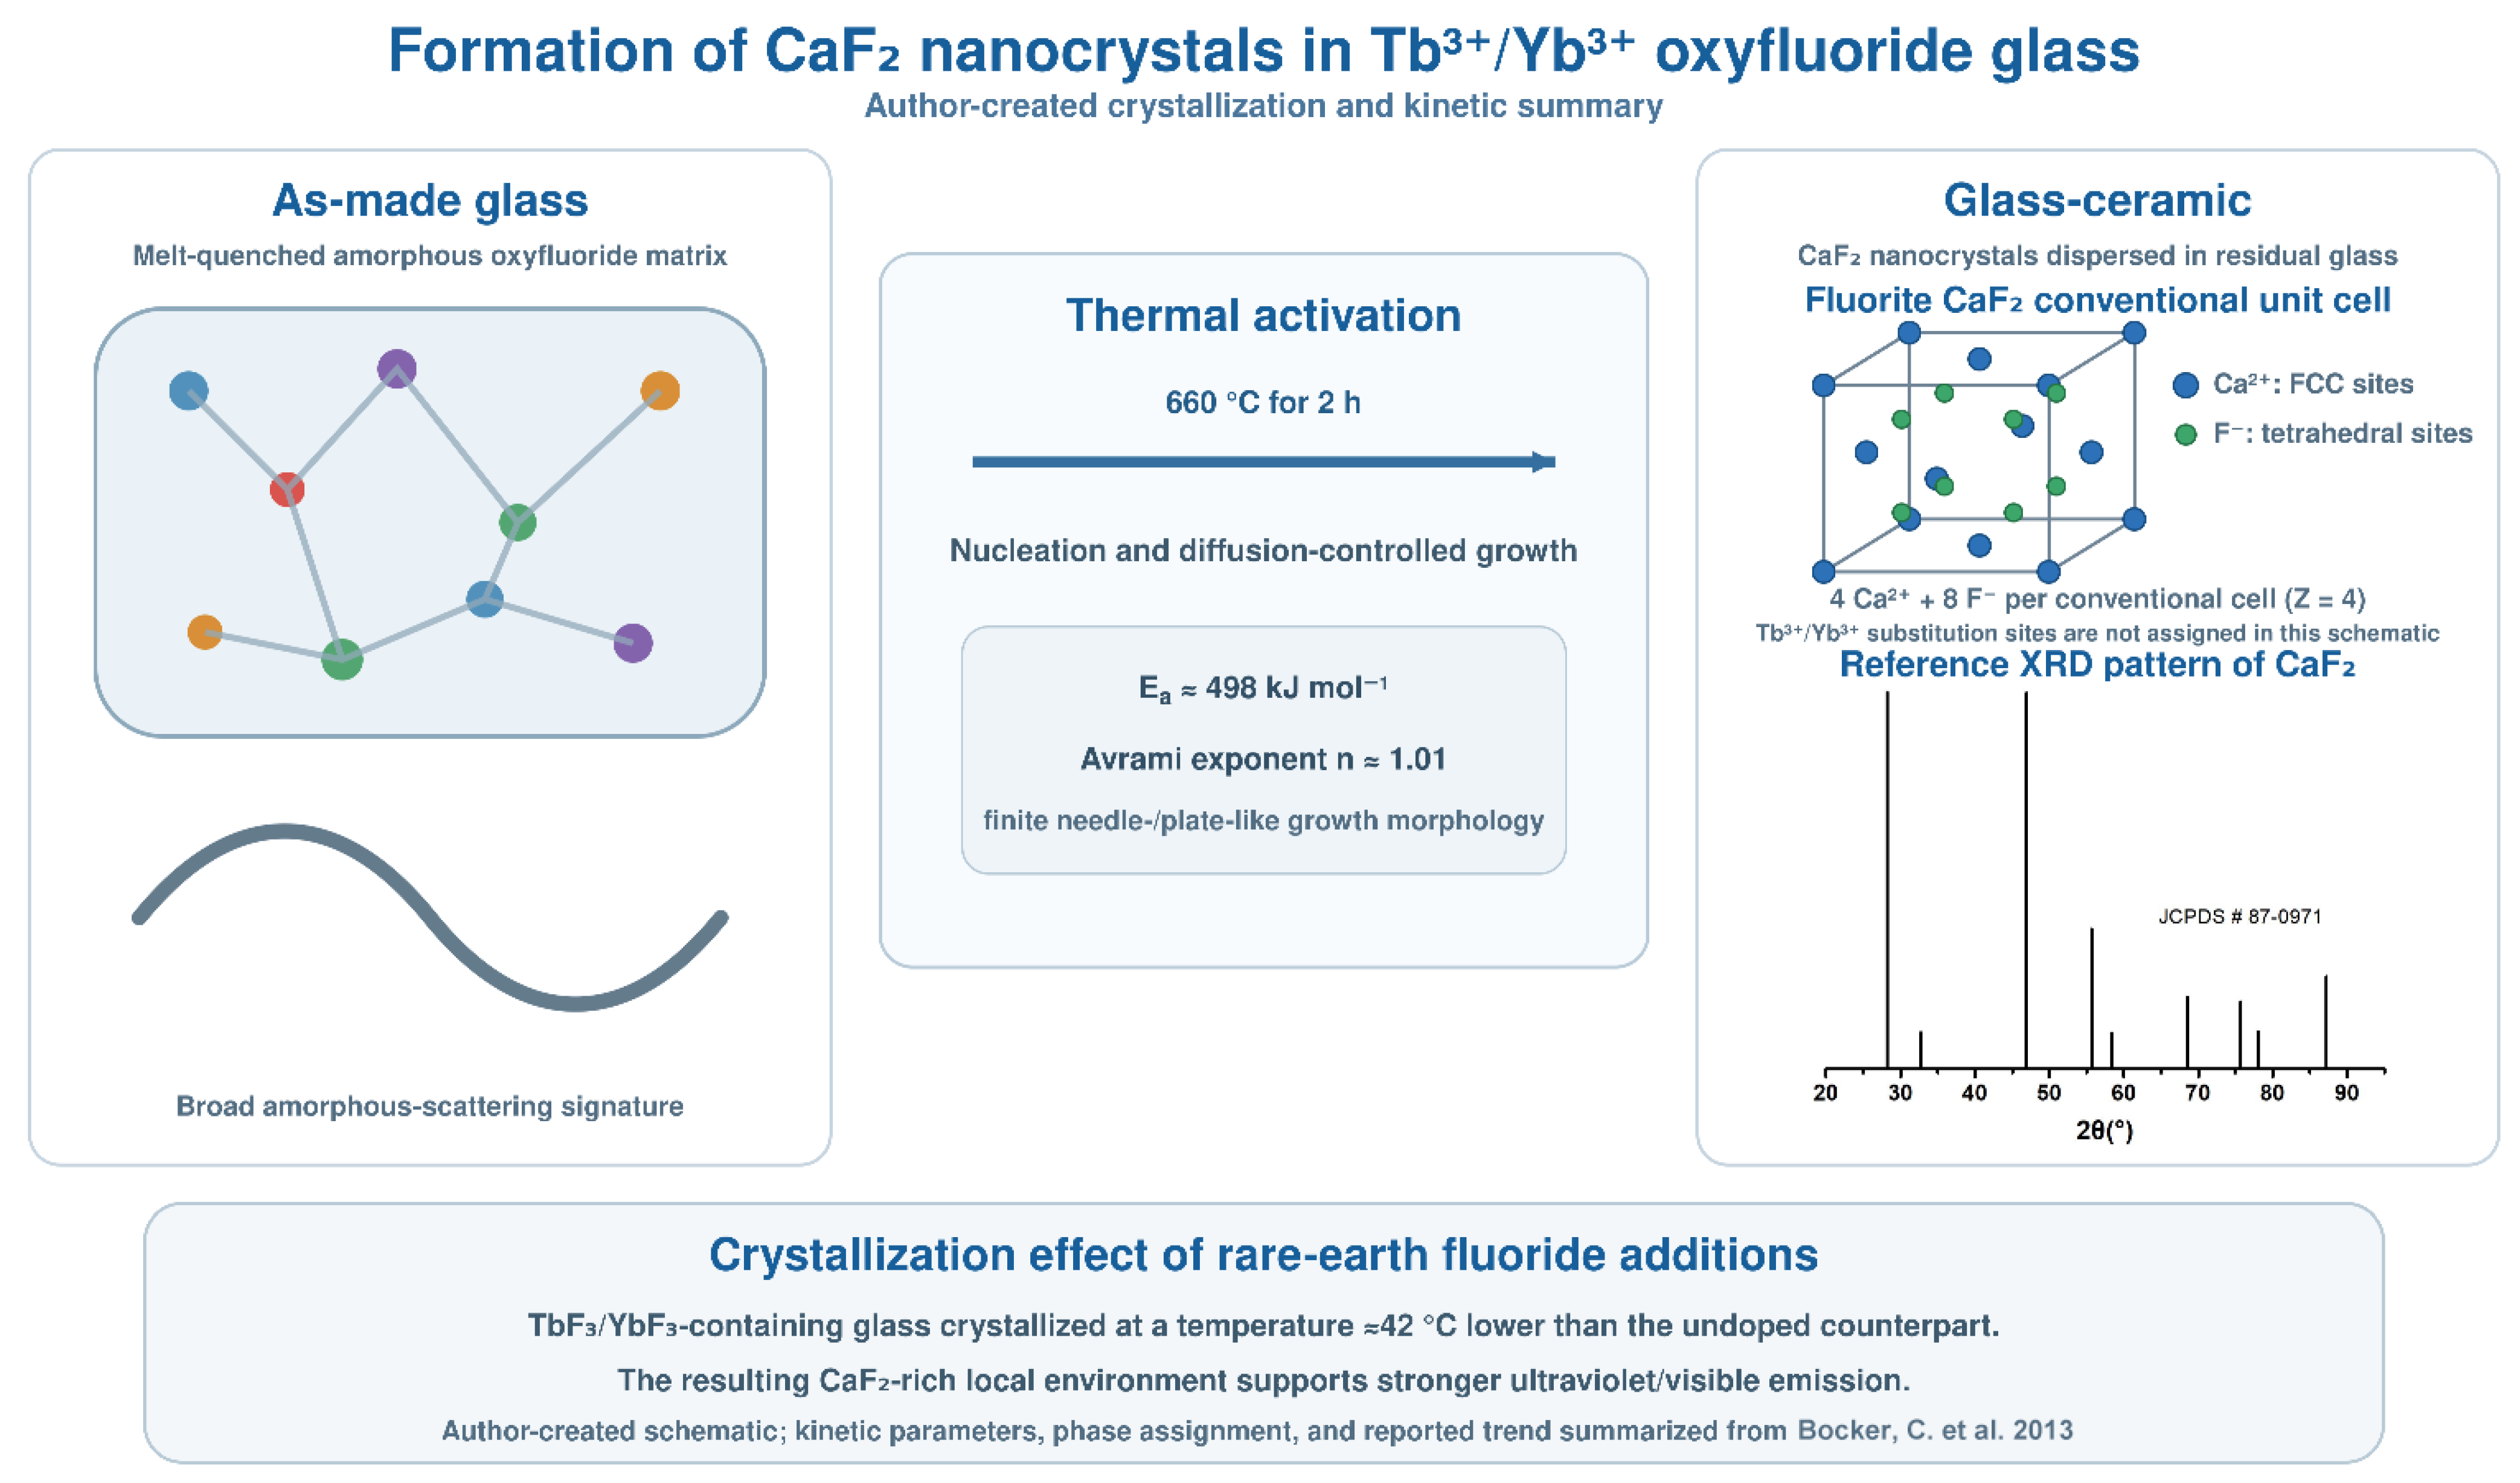
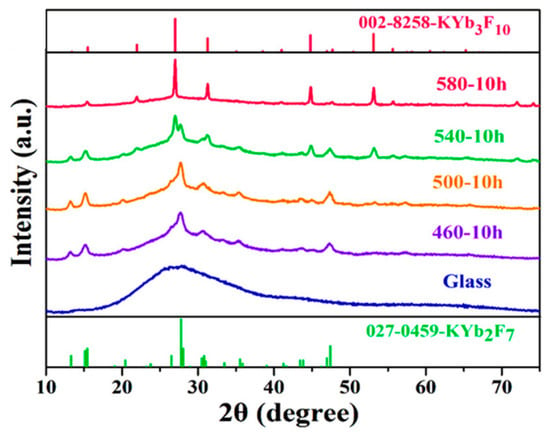
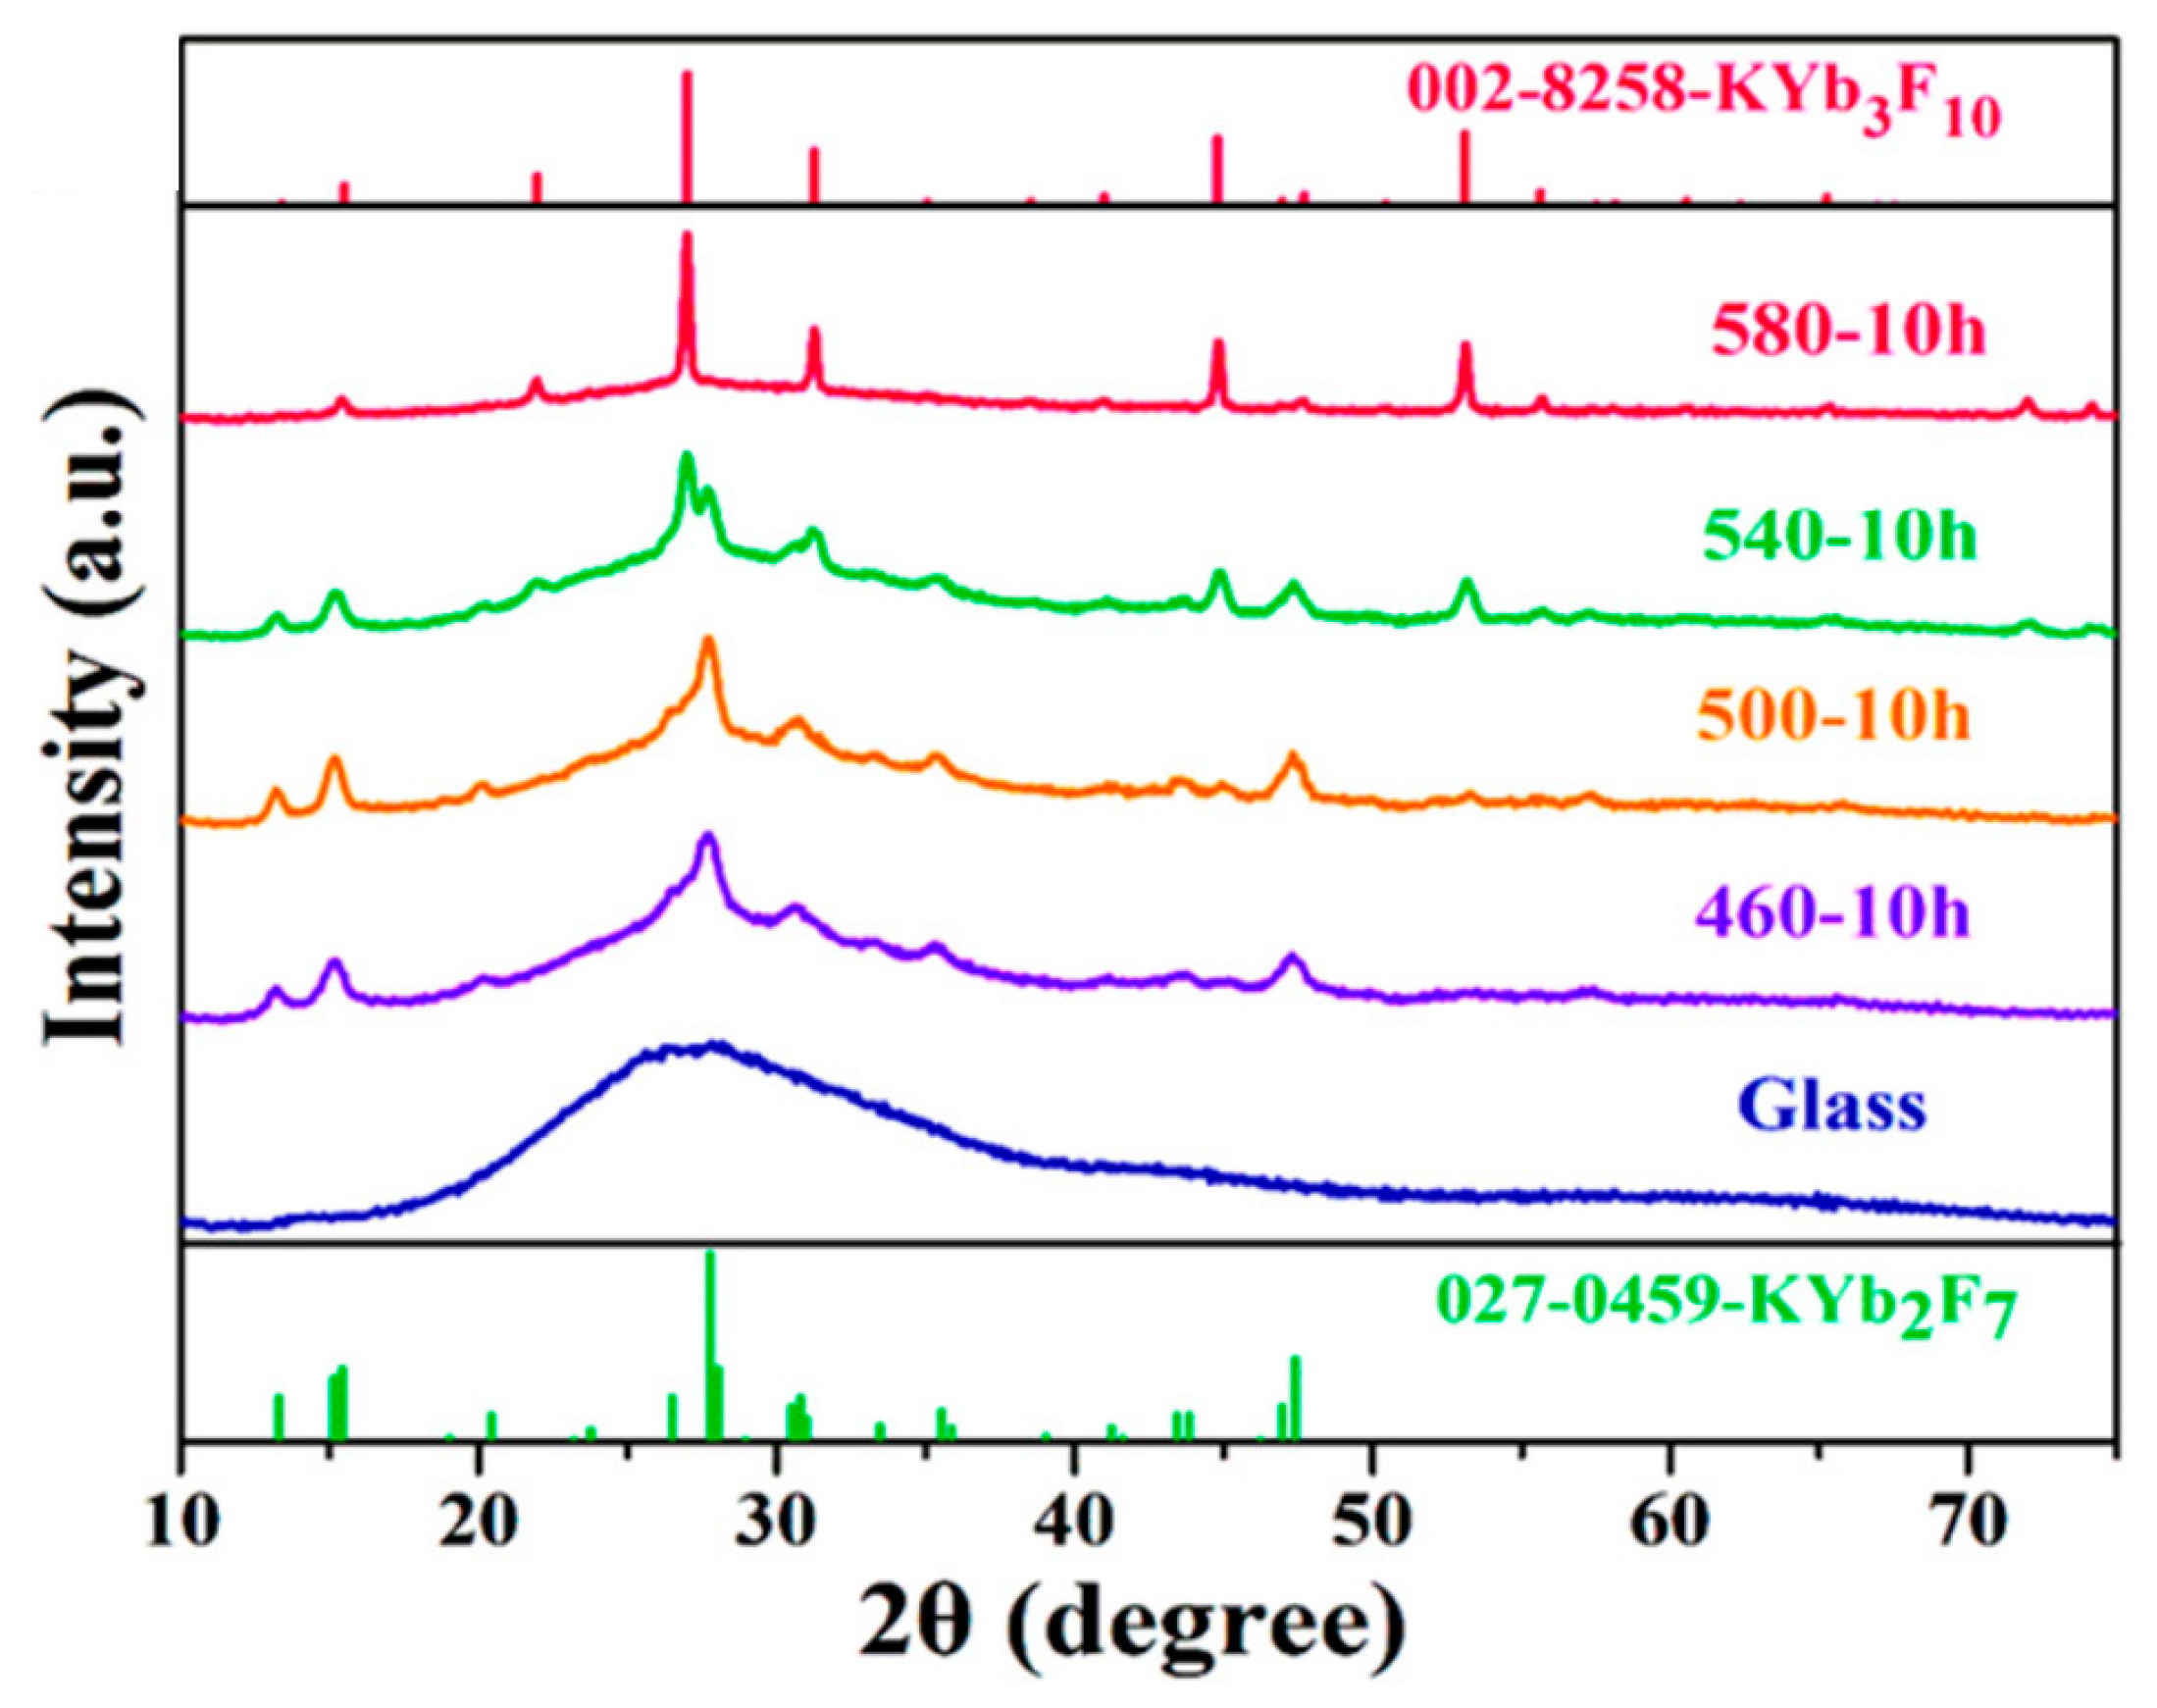
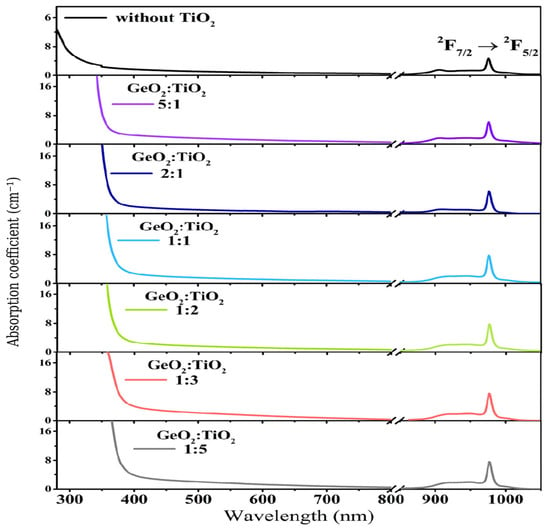
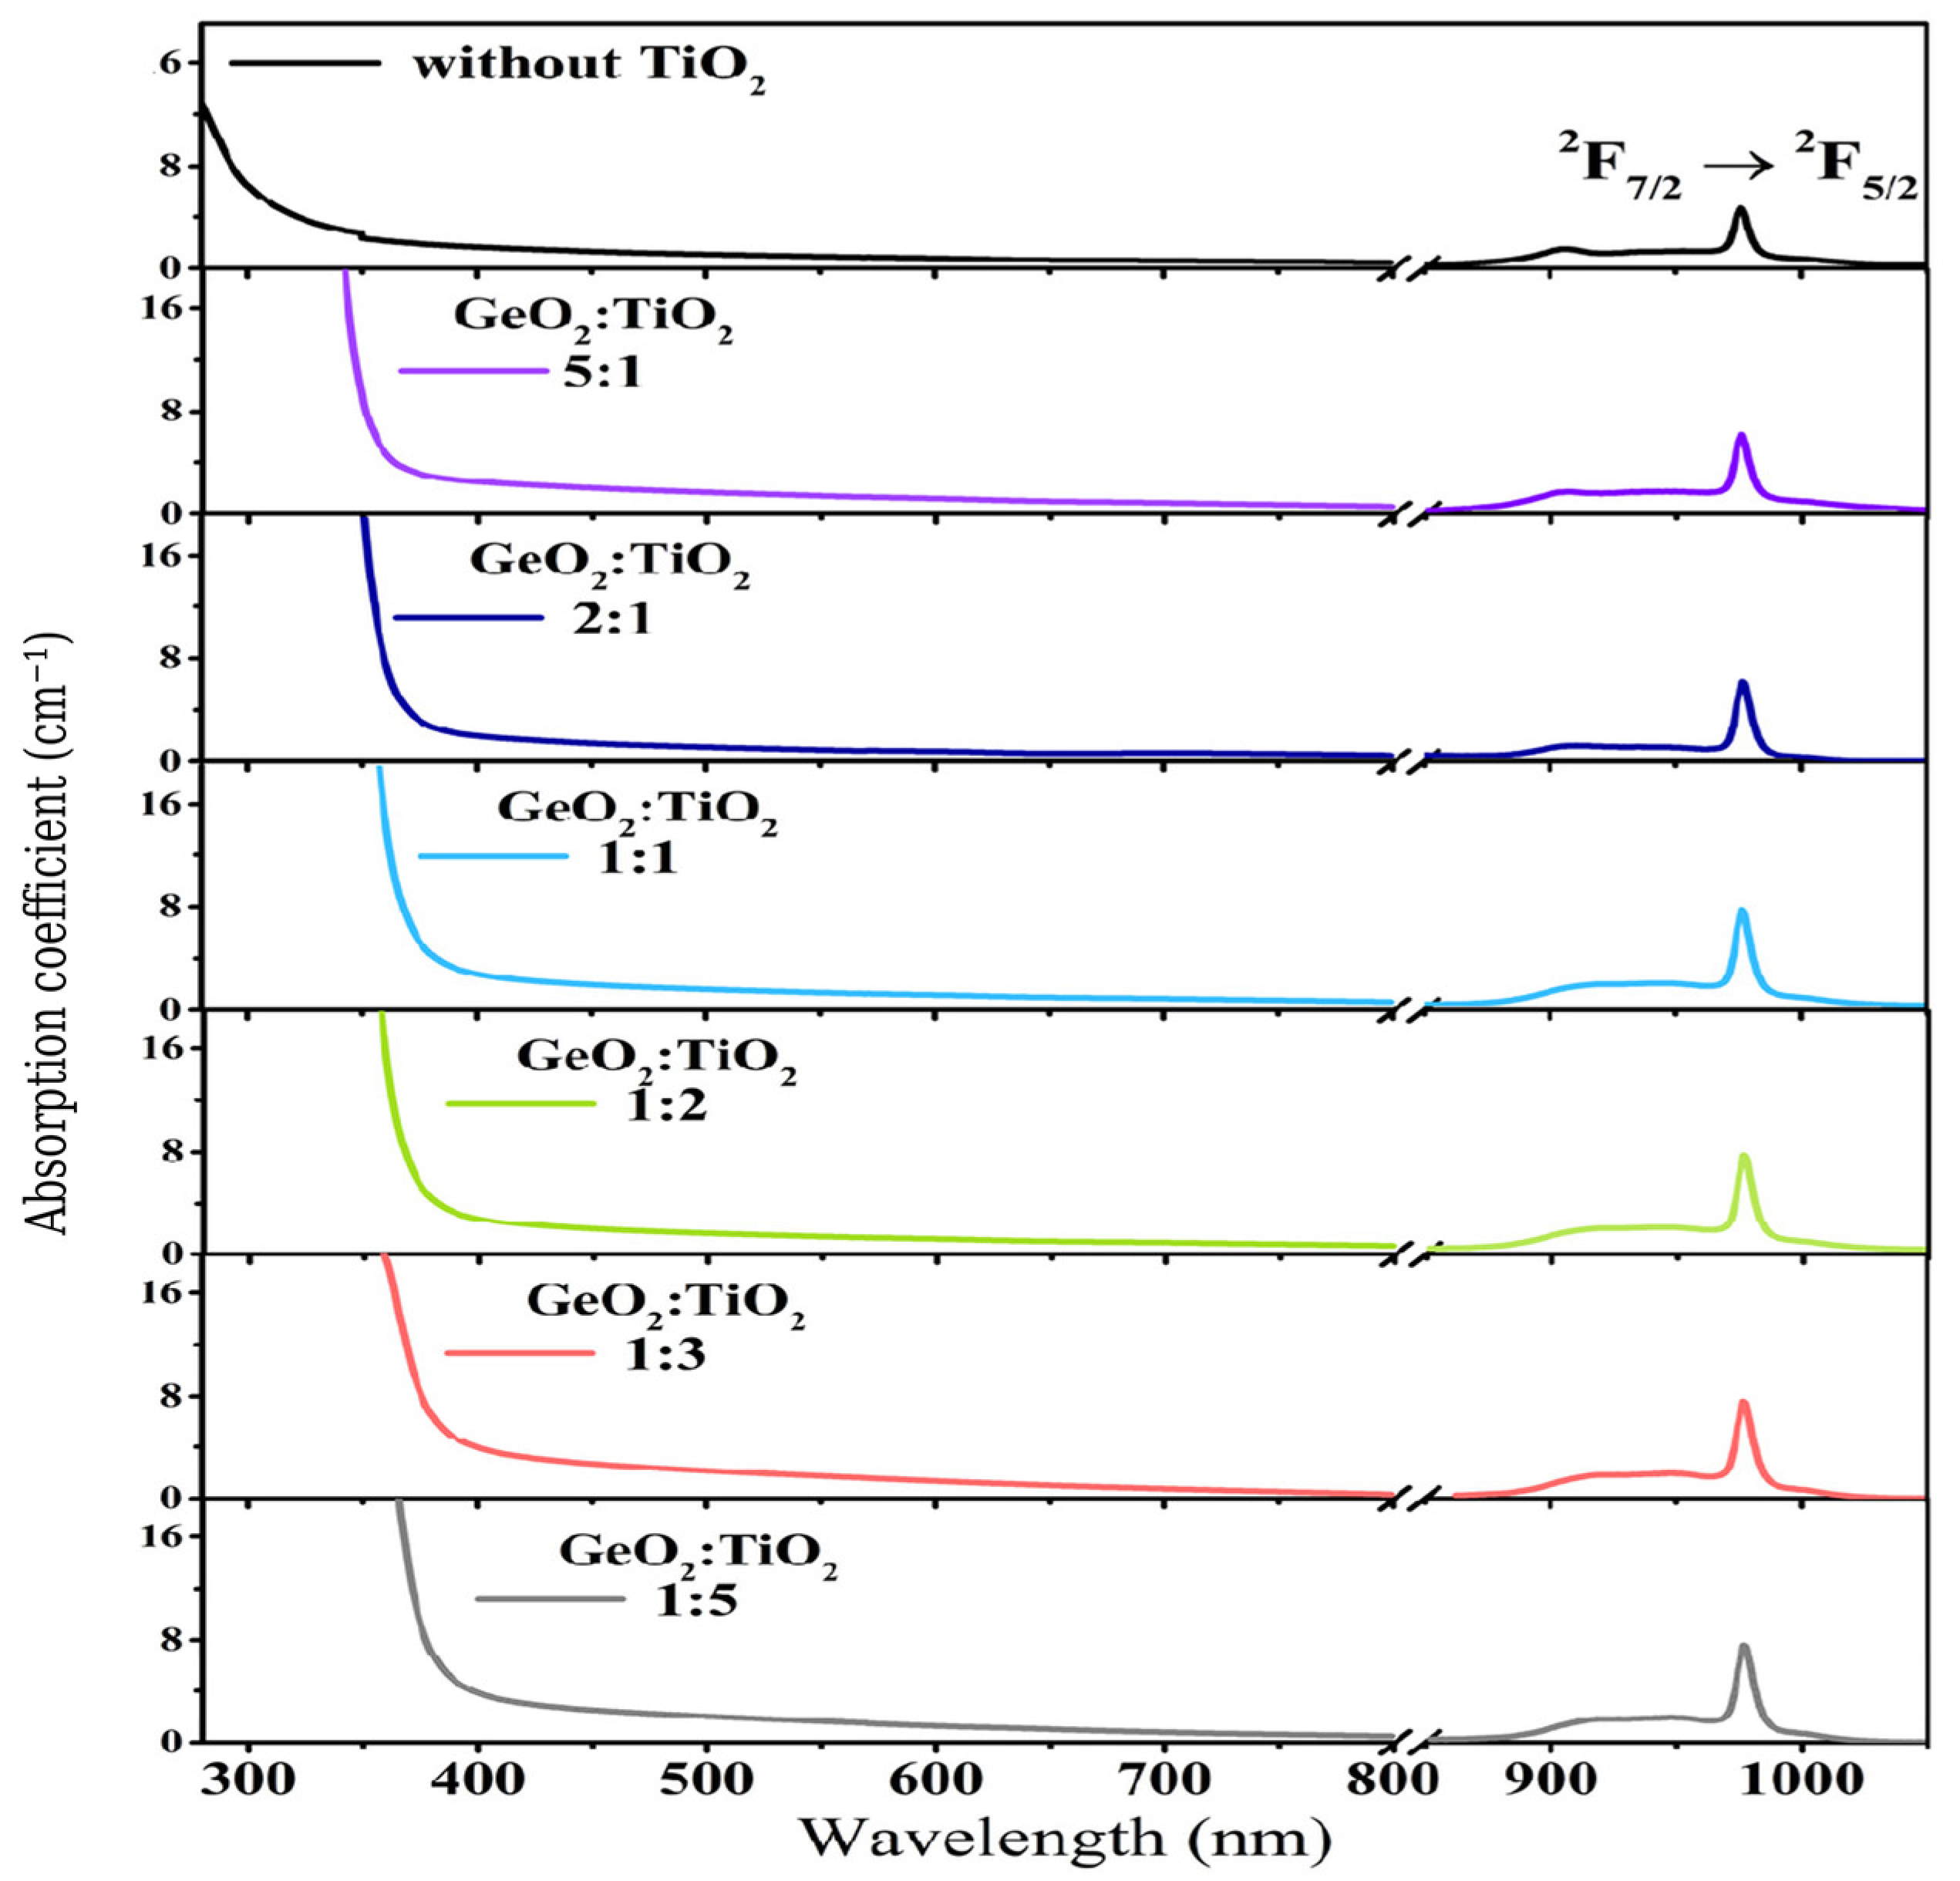
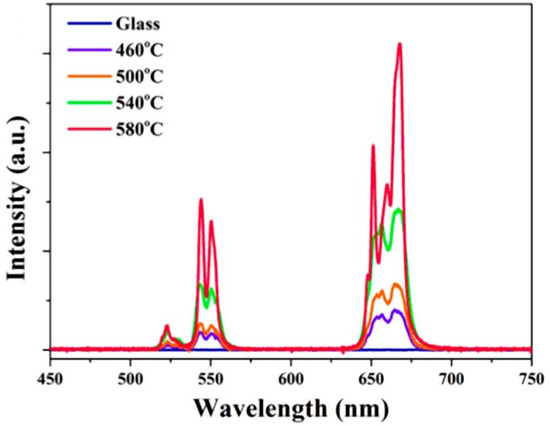
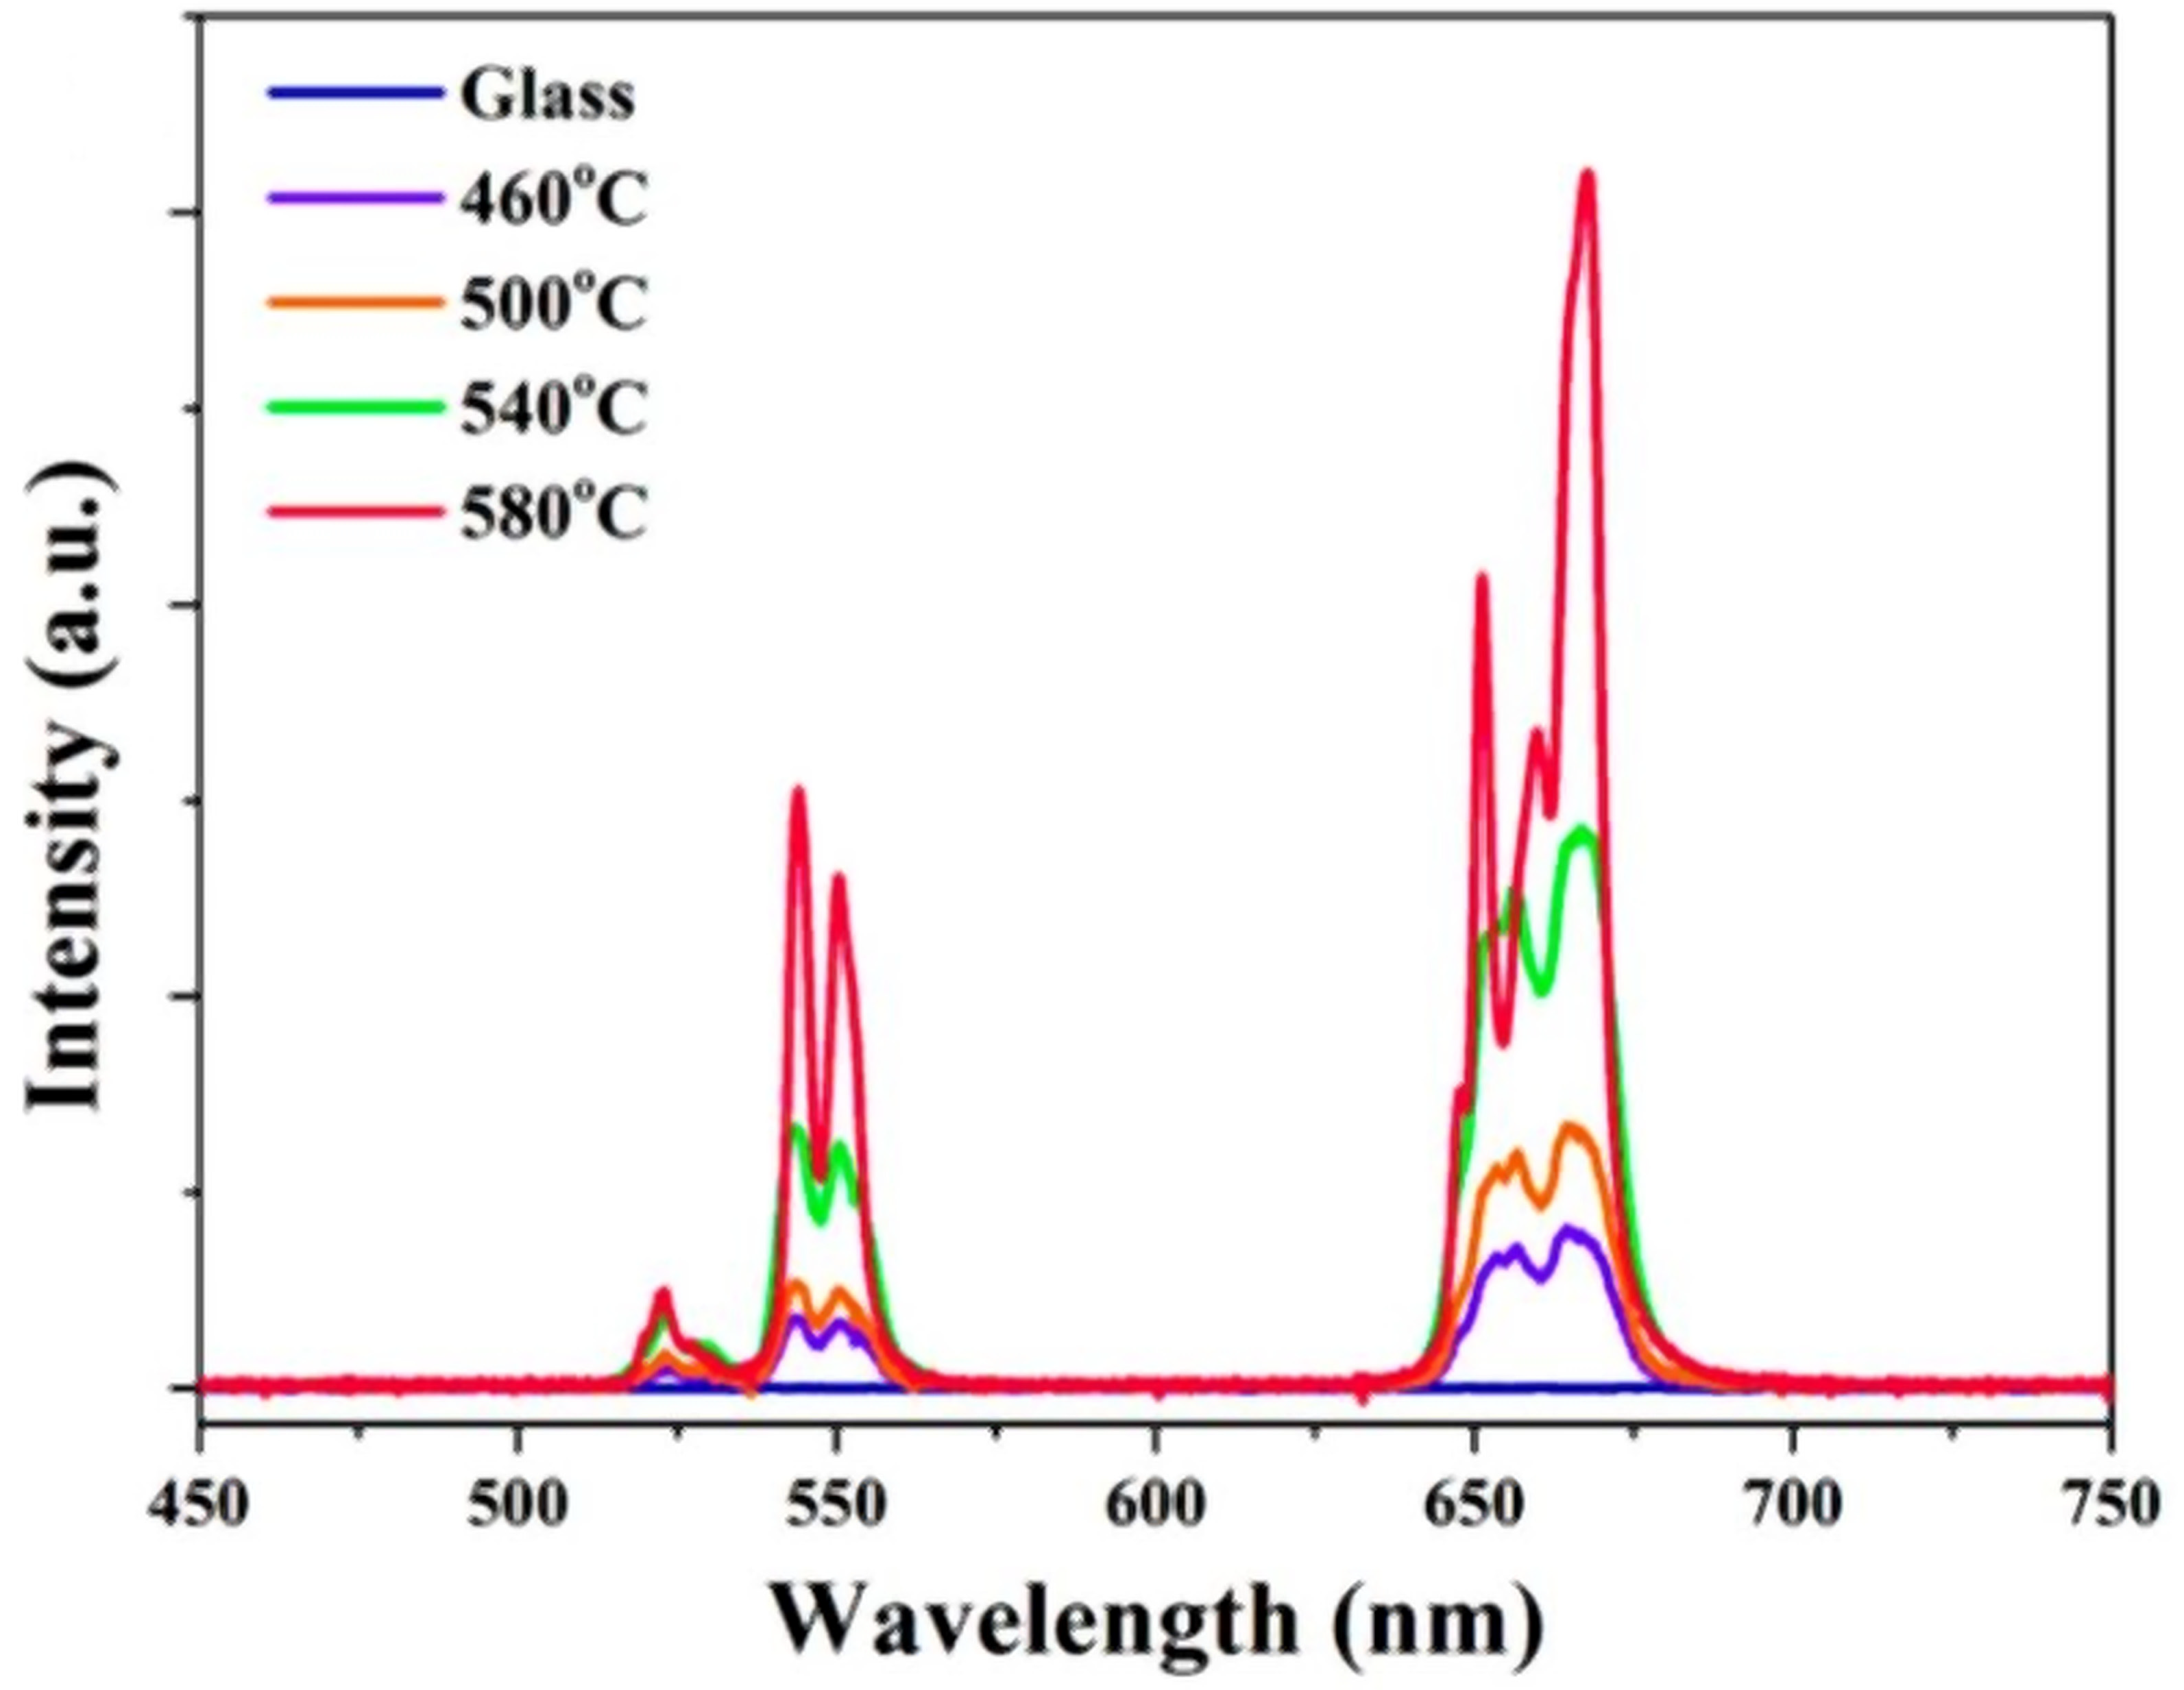
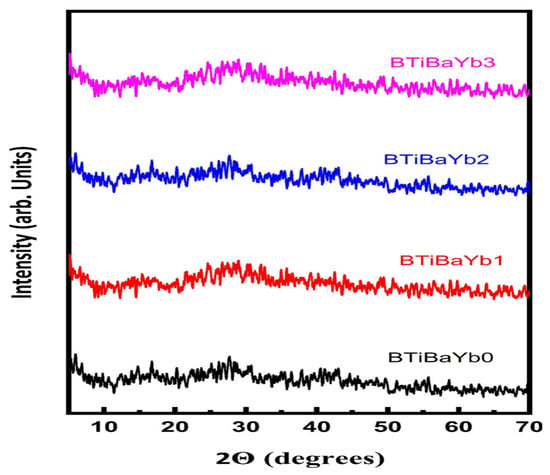
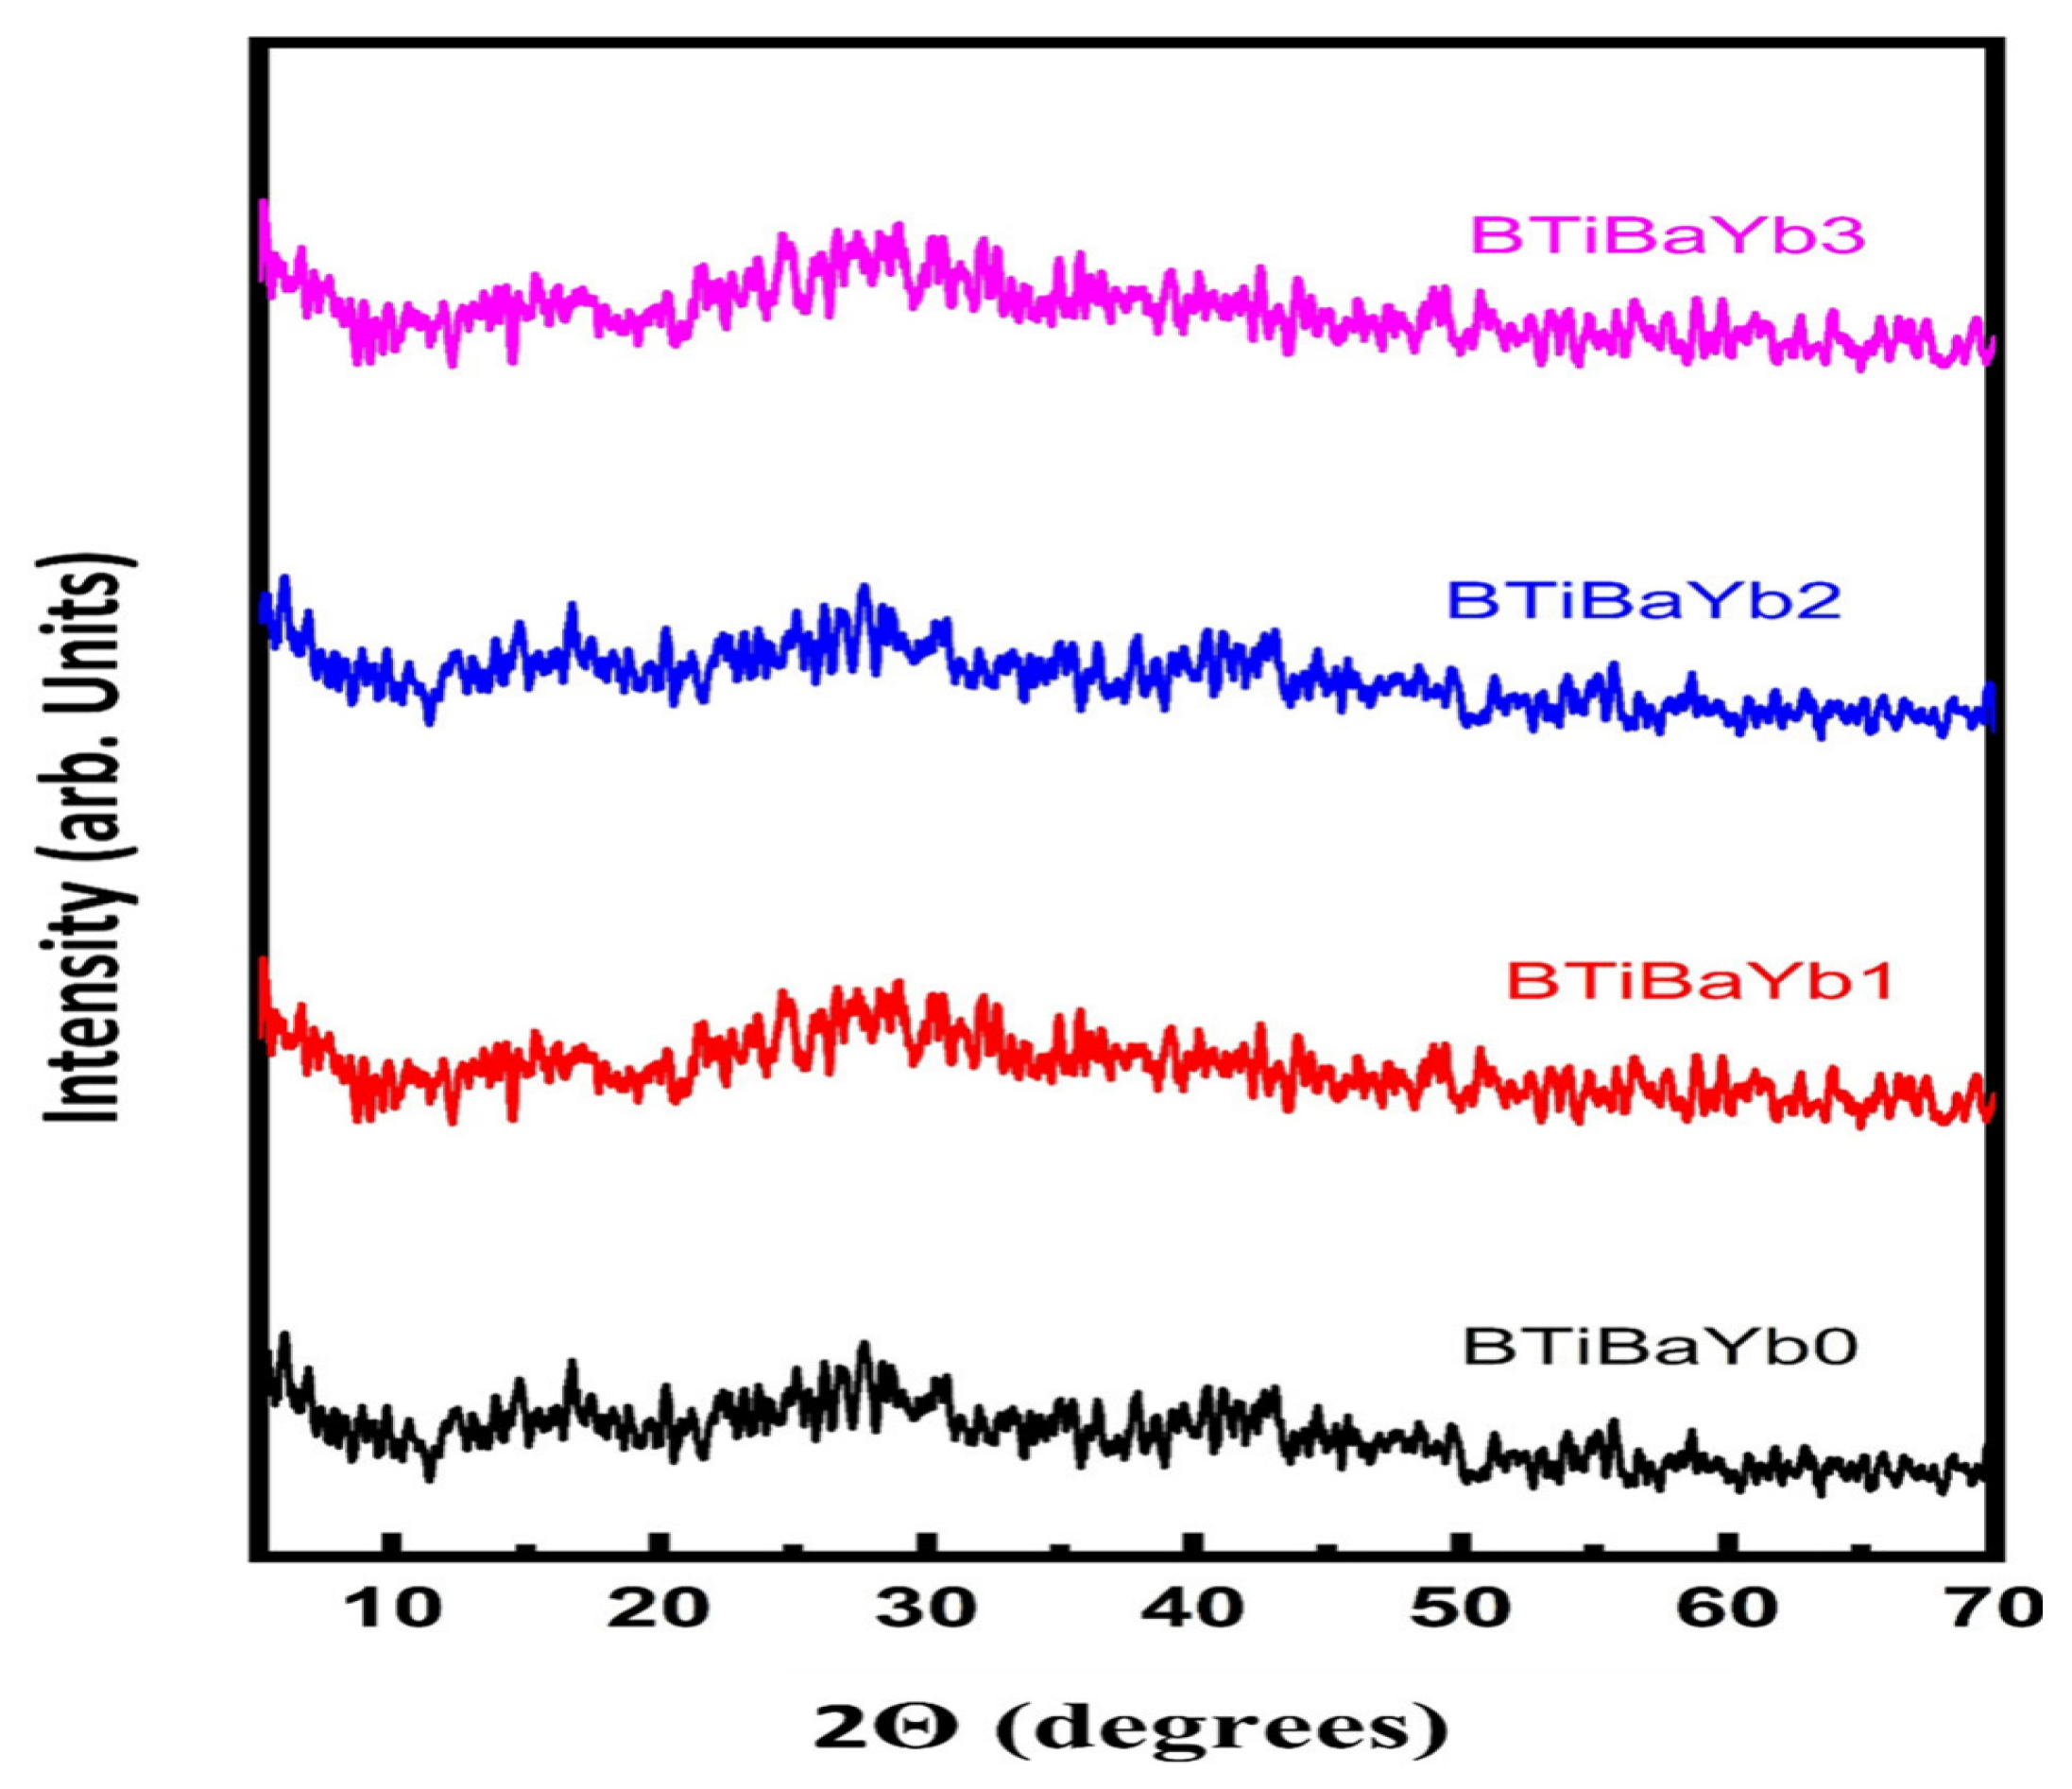
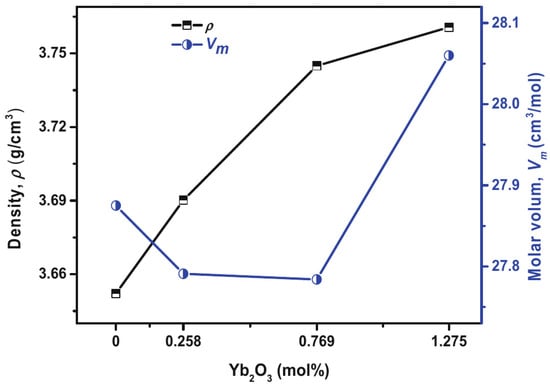
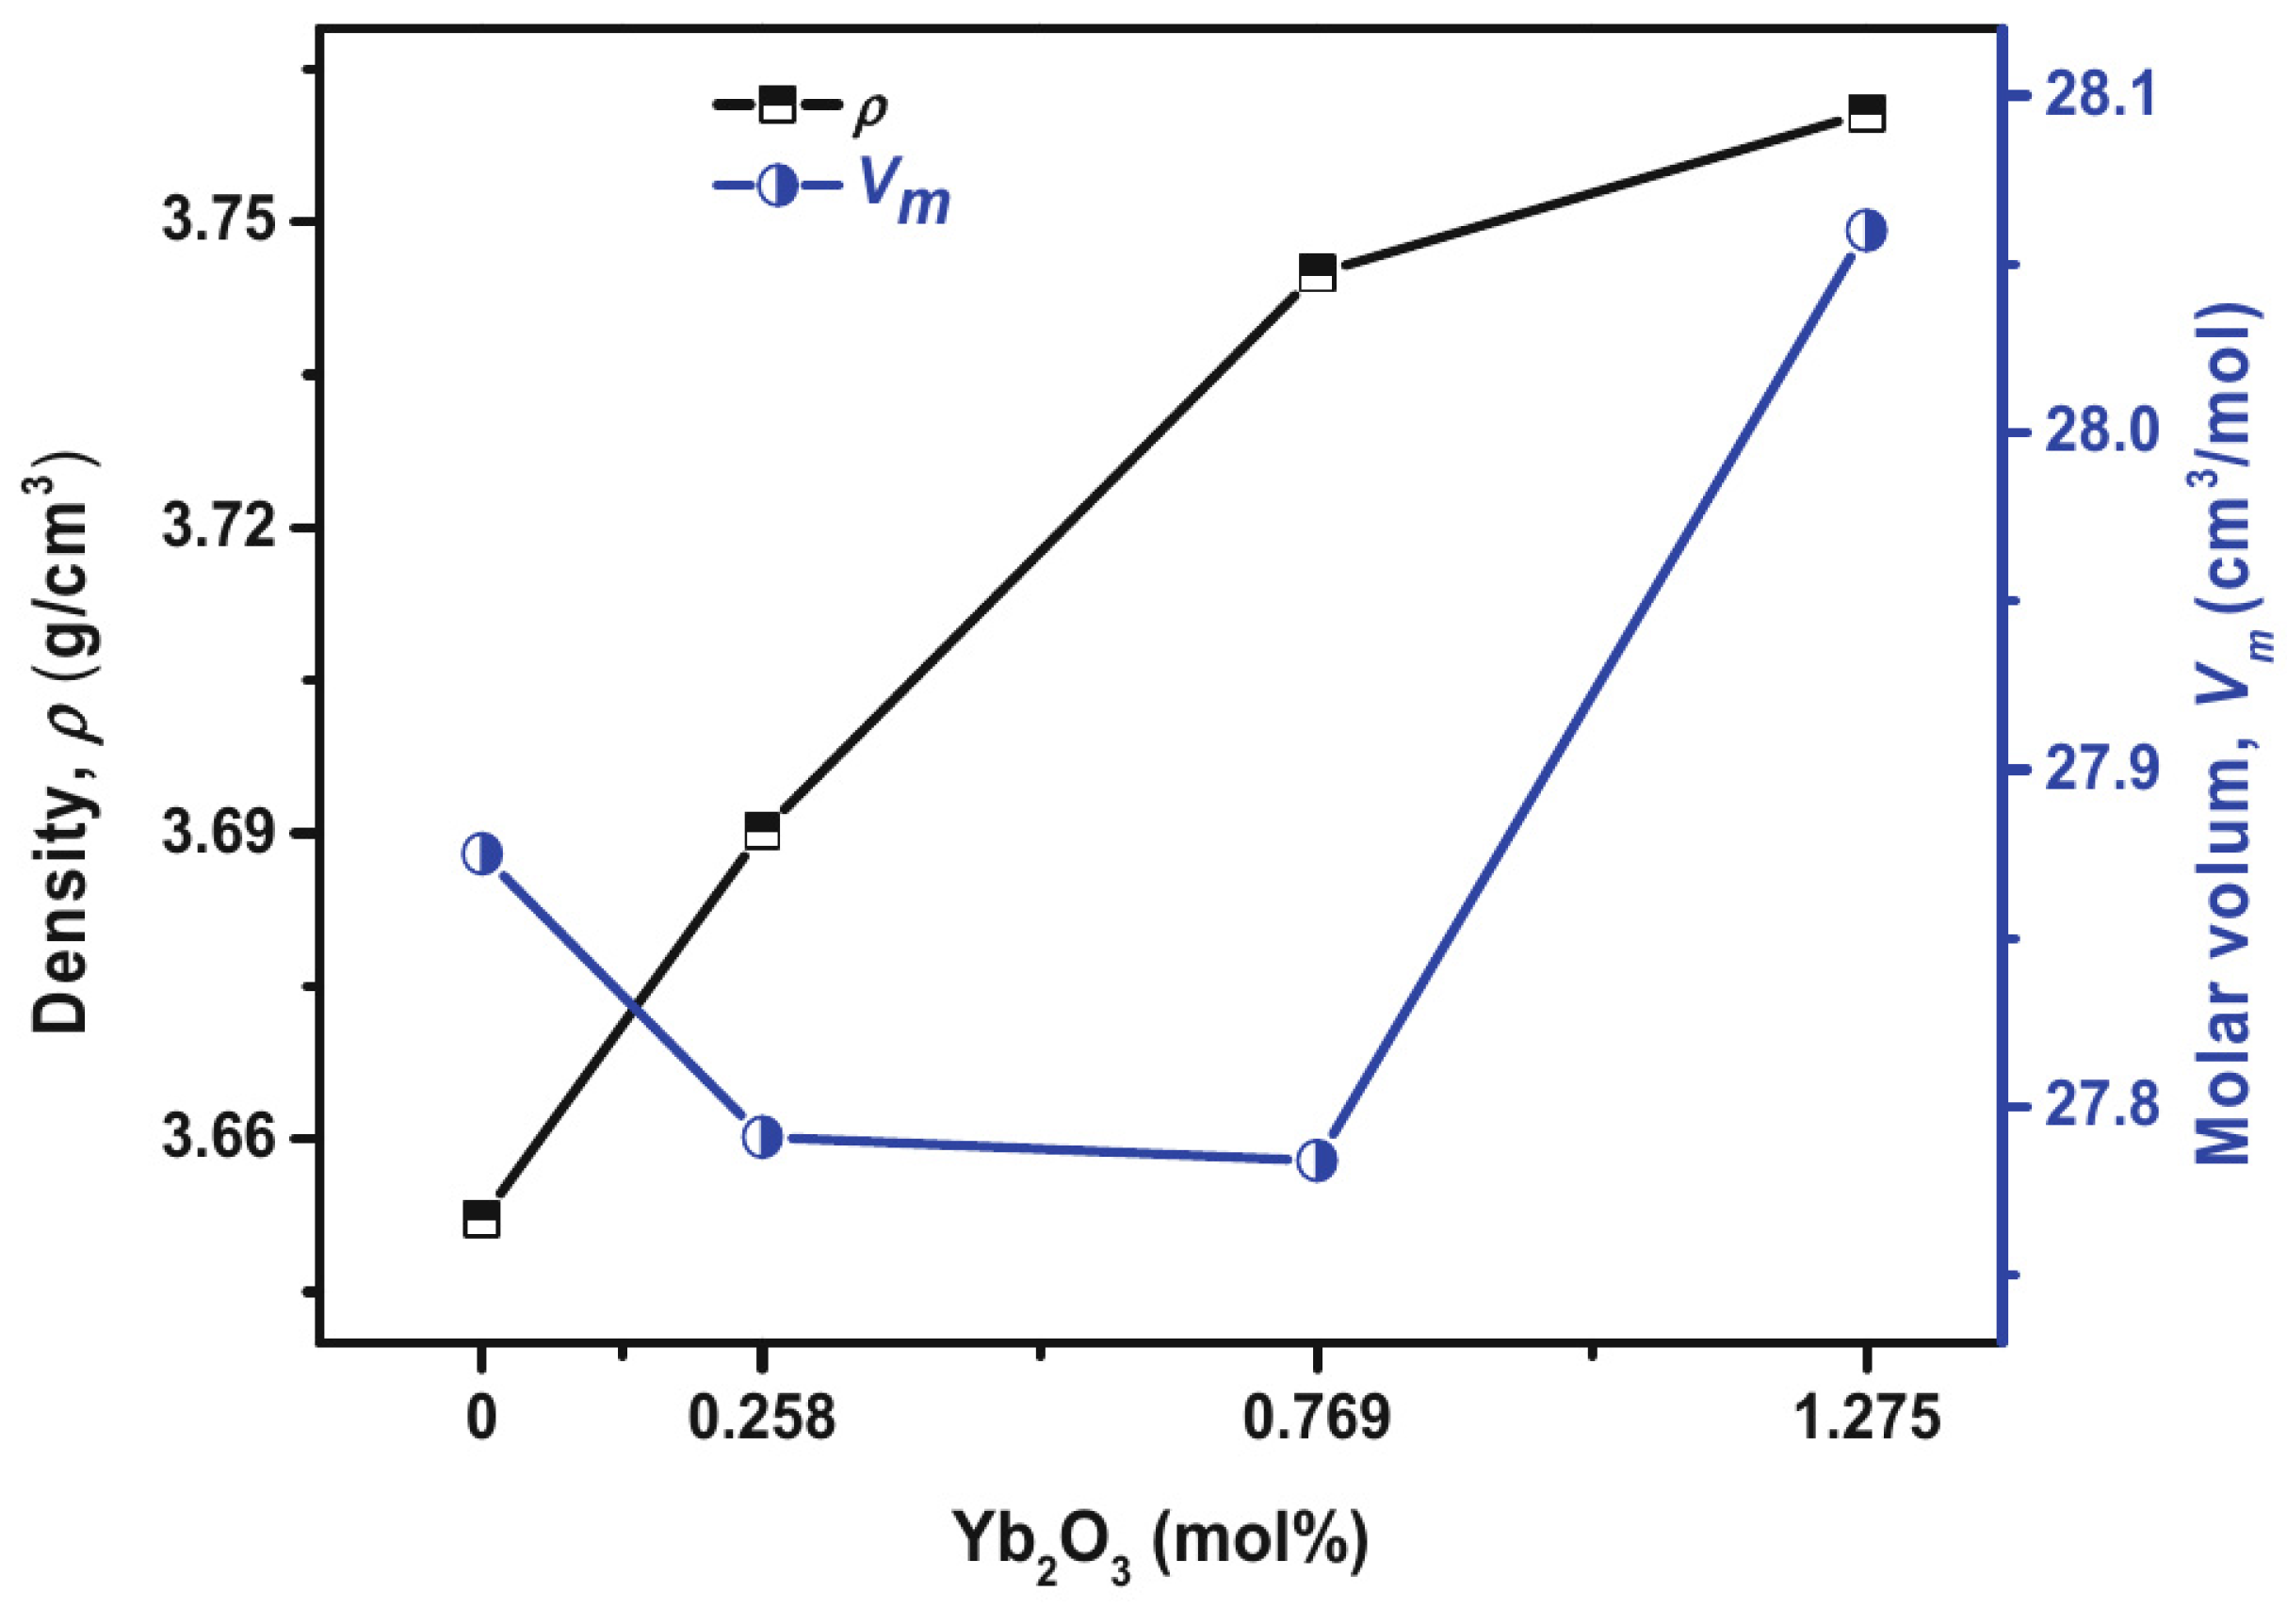
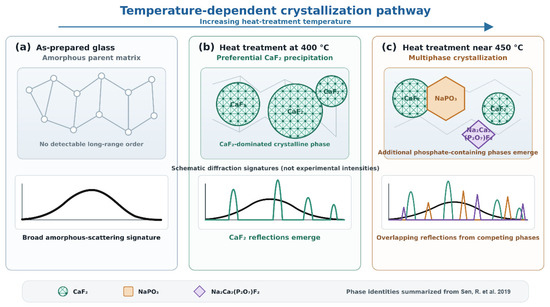
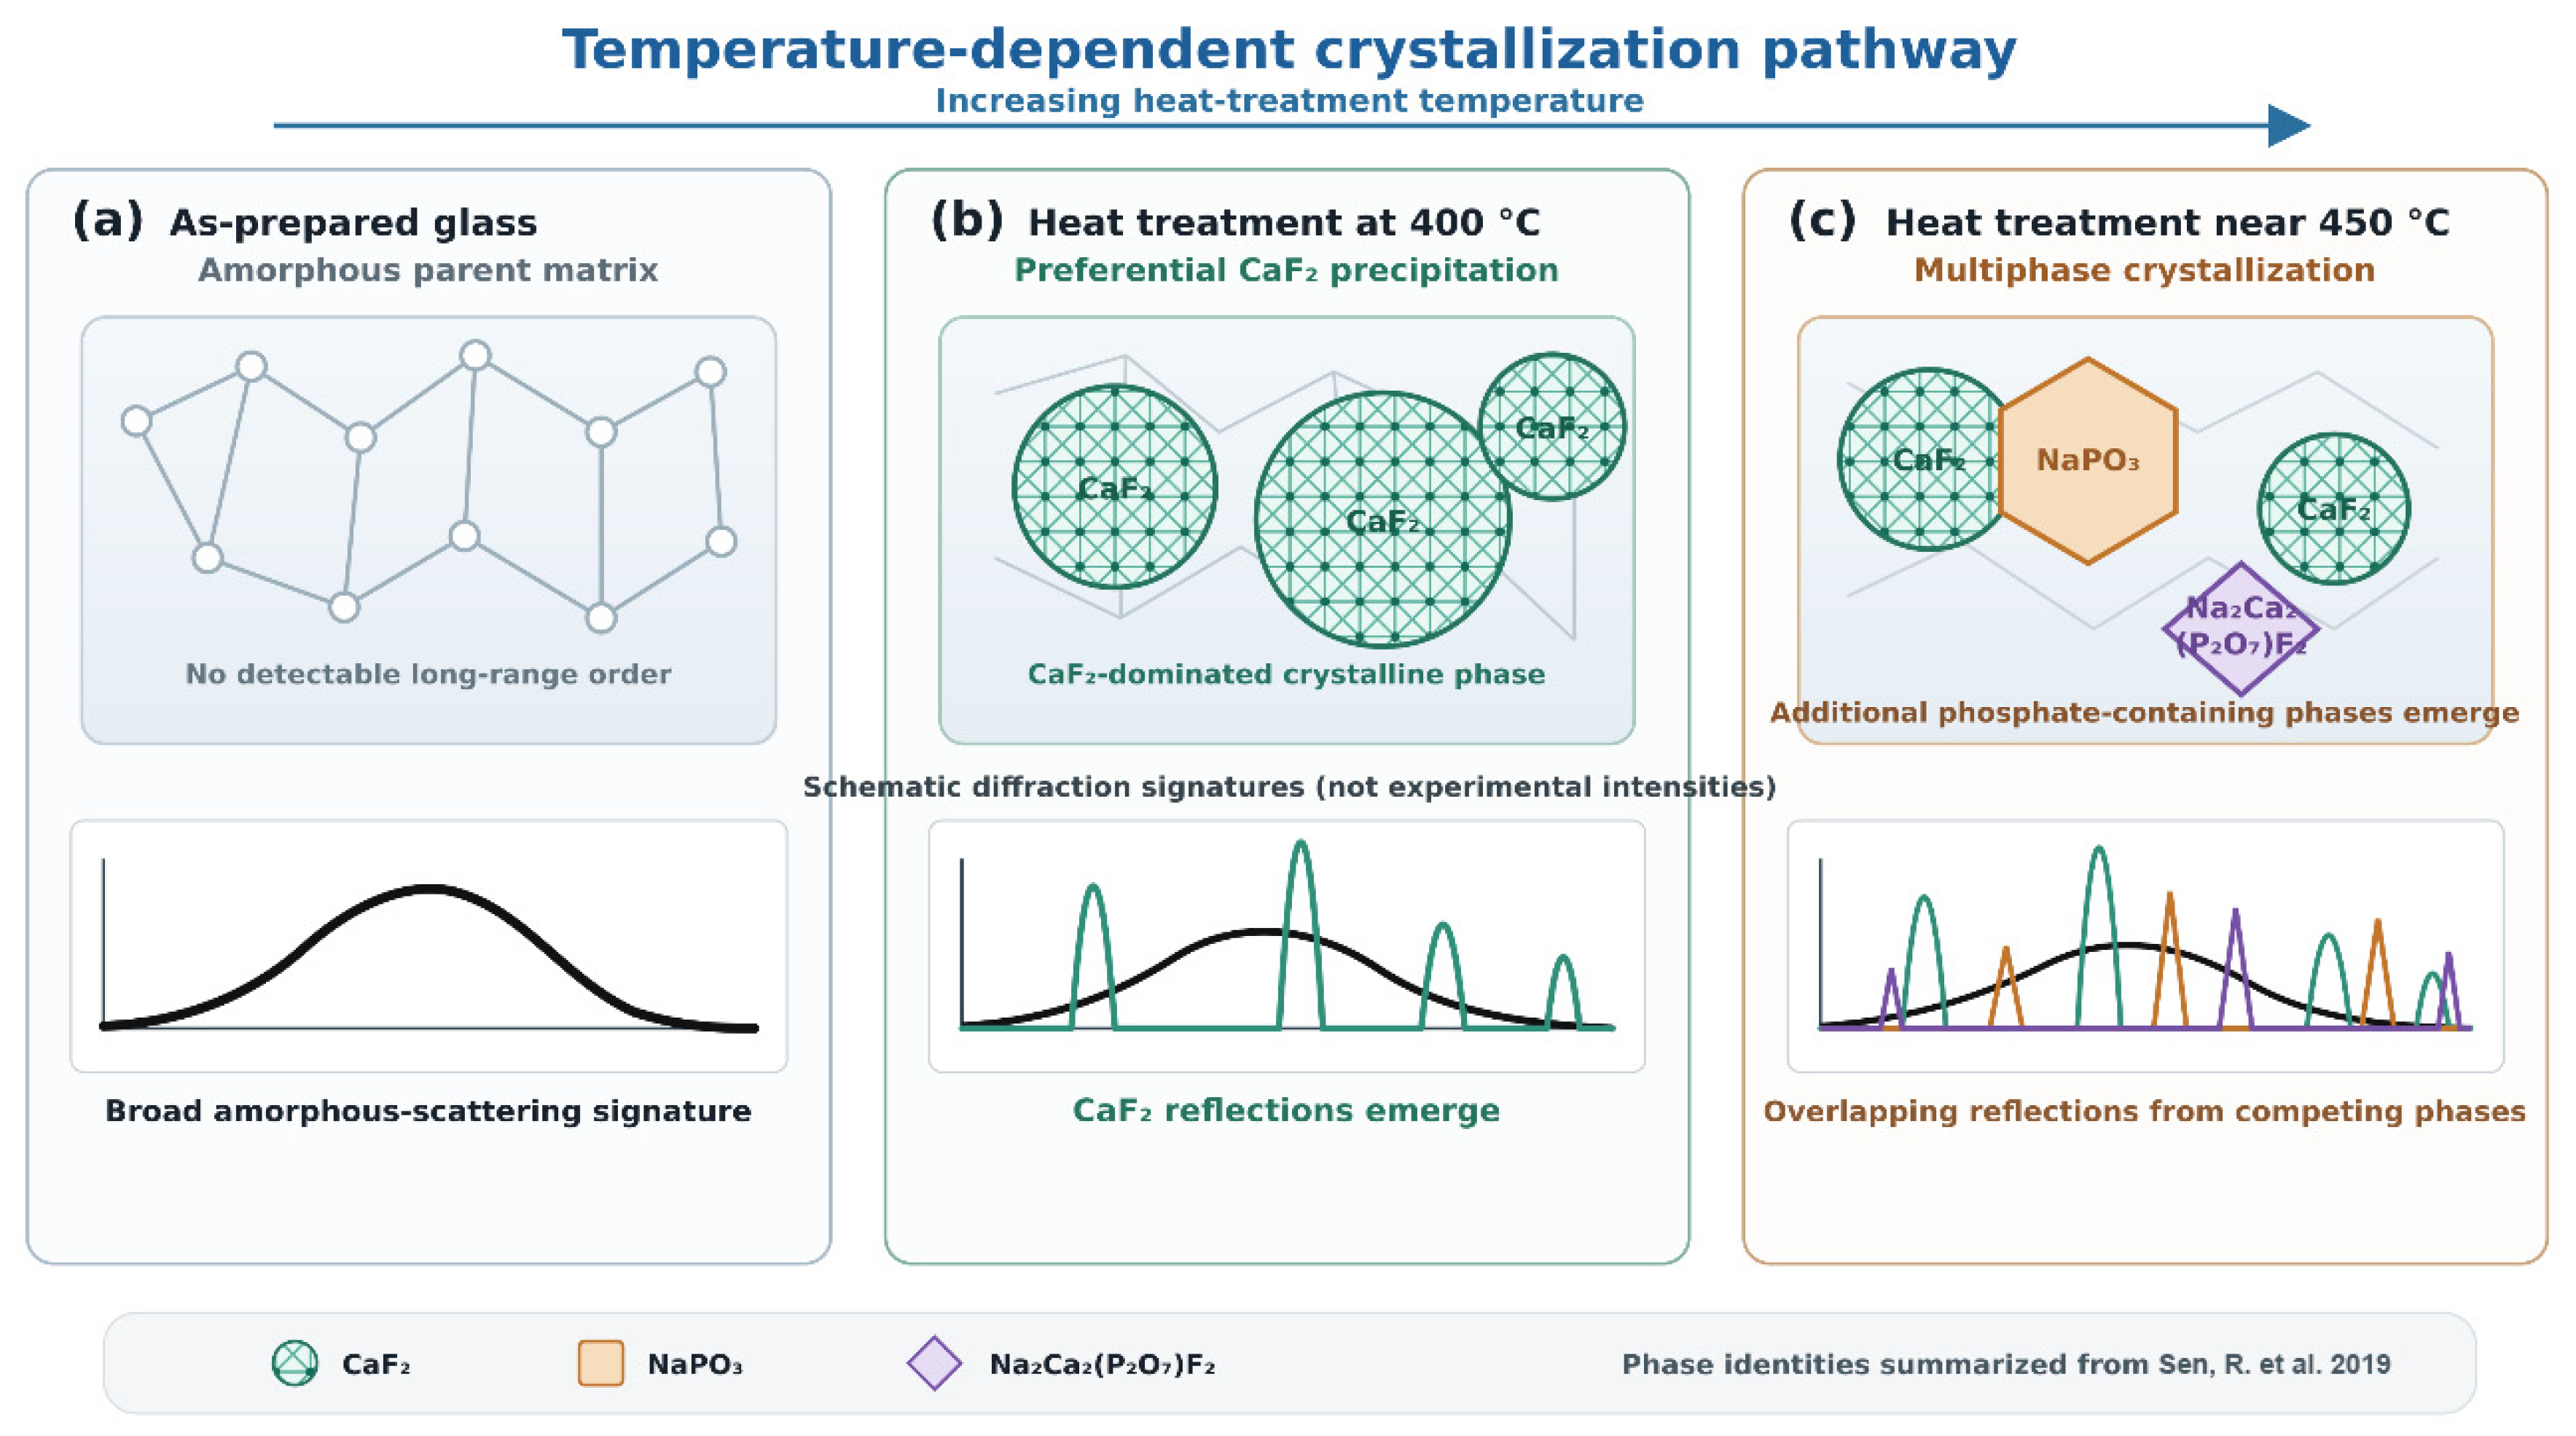
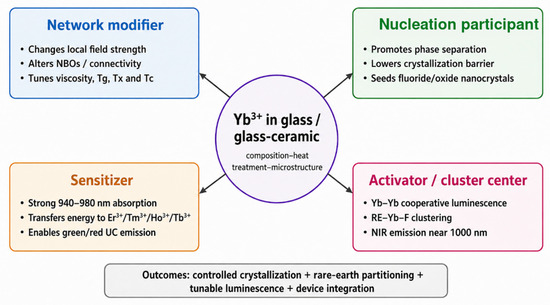
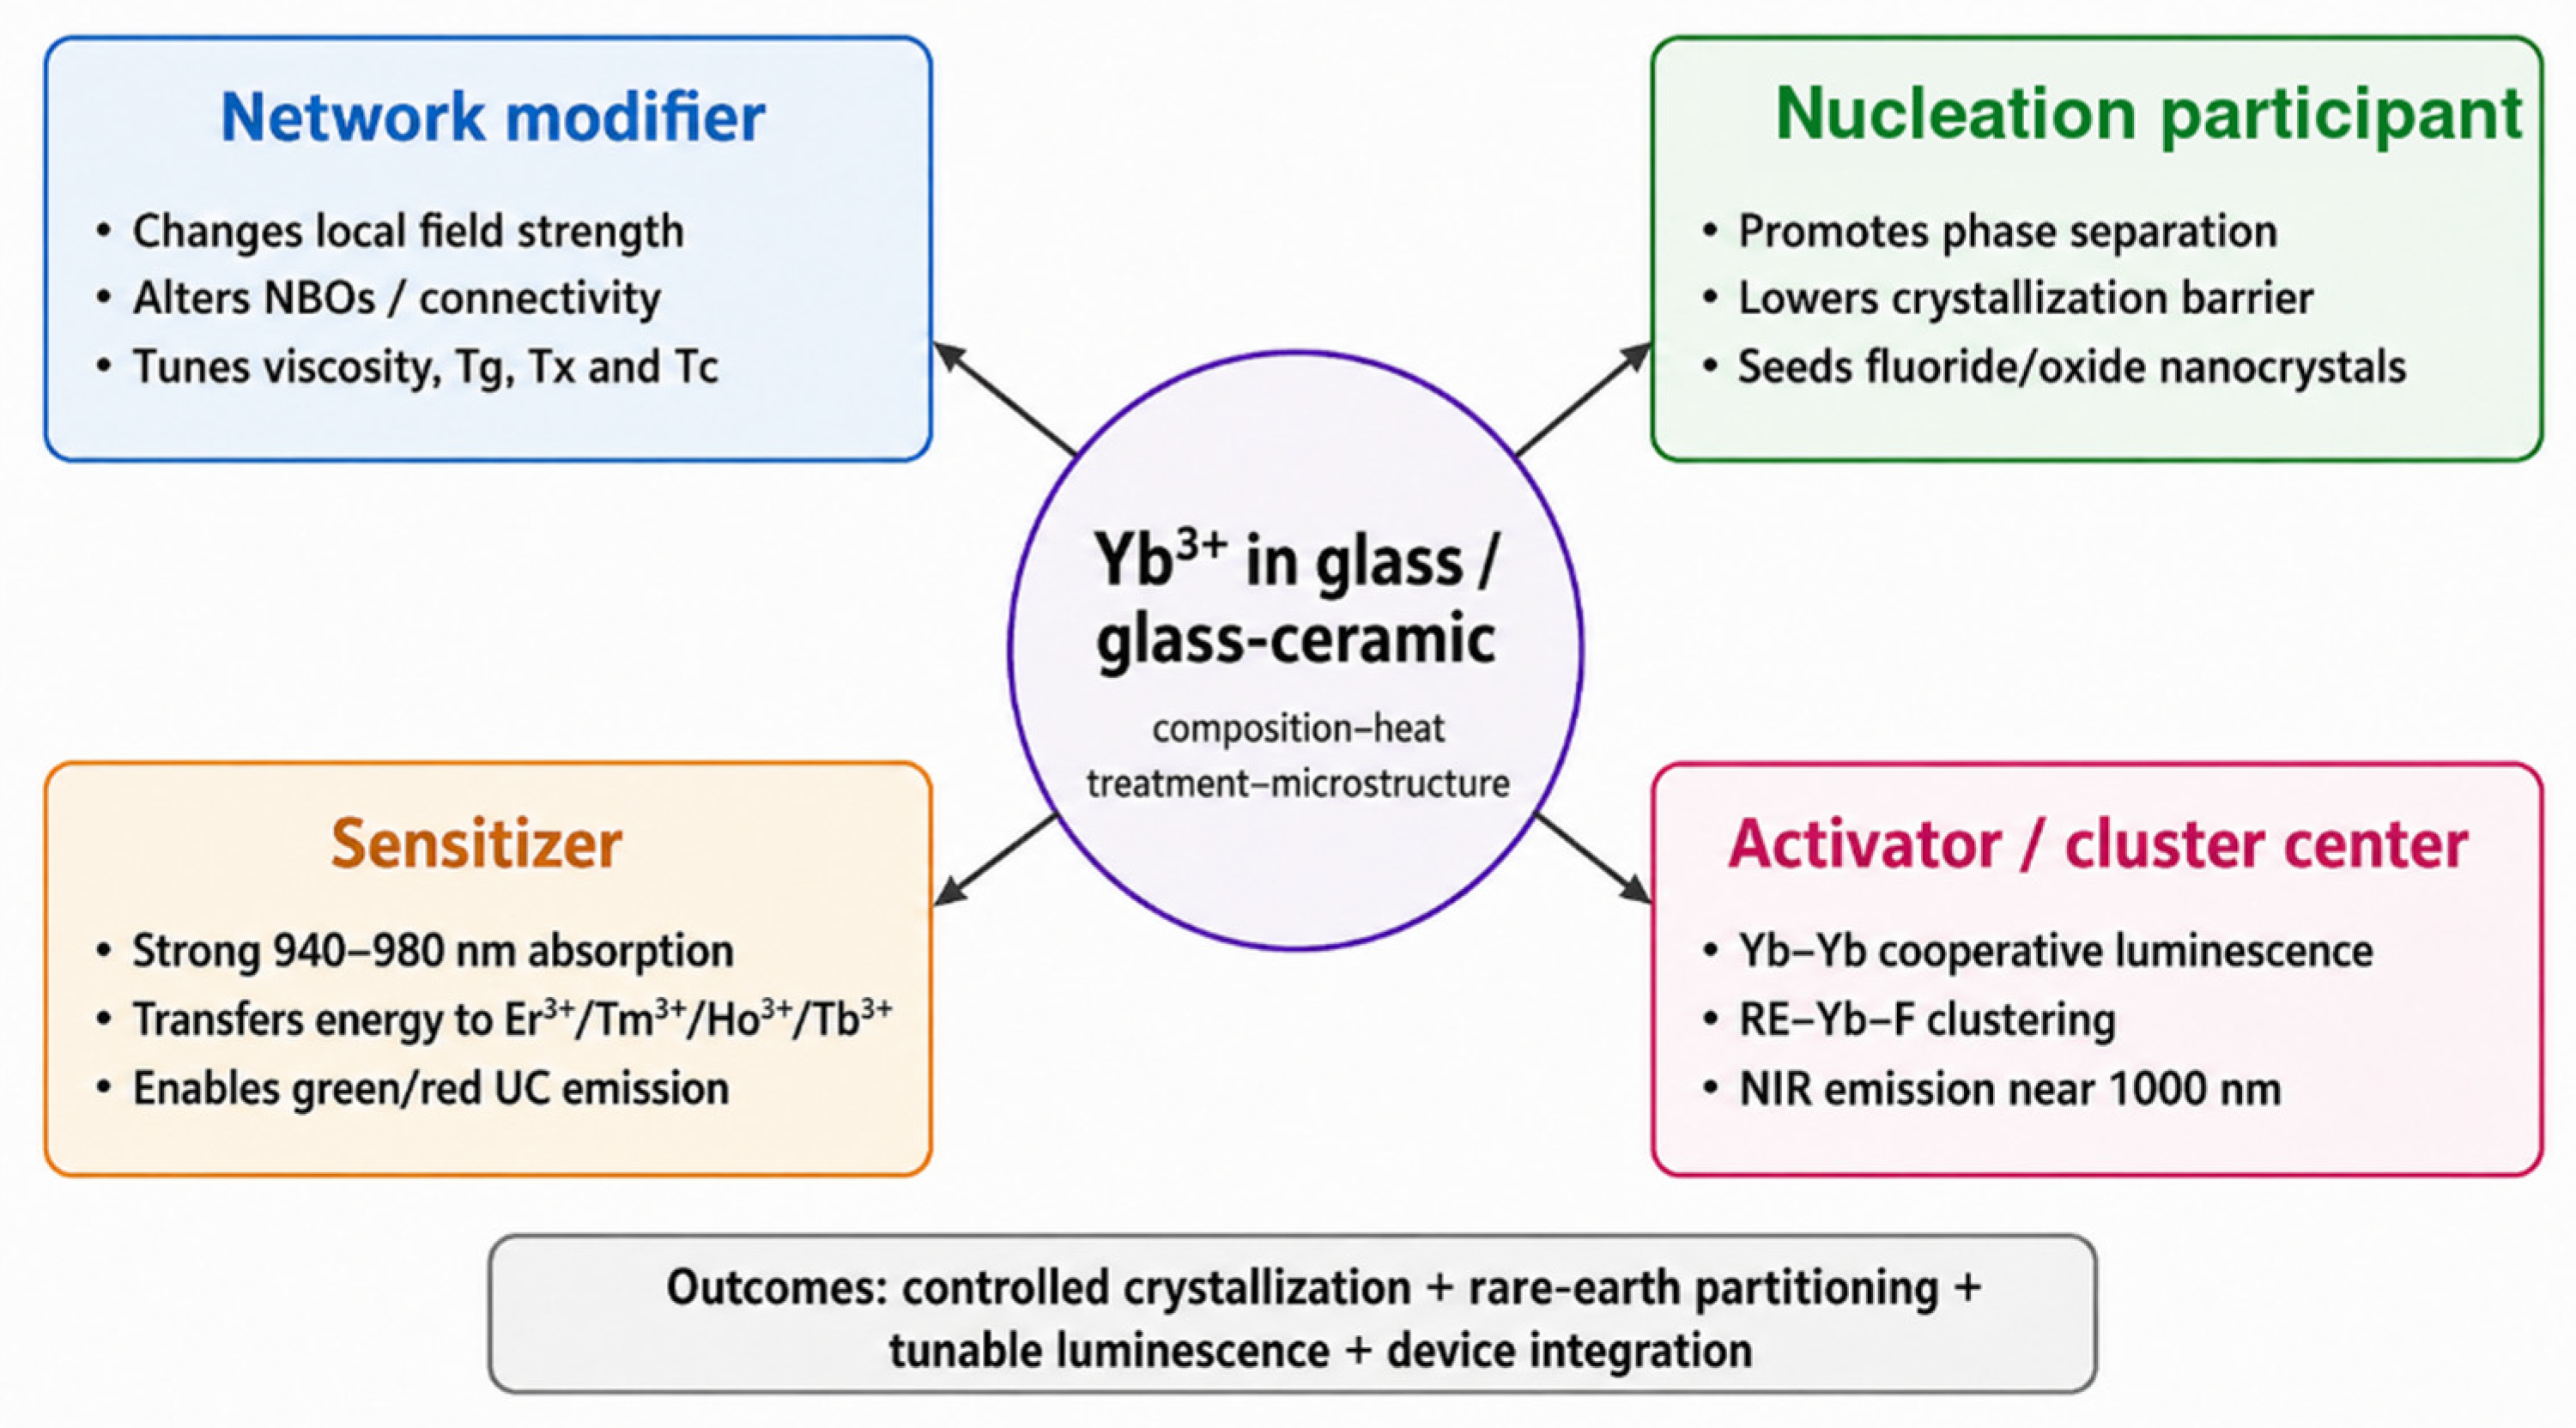

Disclaimer/Publisher’s Note: The statements, opinions and data contained in all publications are solely those of the individual author(s) and contributor(s) and not of MDPI and/or the editor(s). MDPI and/or the editor(s) disclaim responsibility for any injury to people or property resulting from any ideas, methods, instructions or products referred to in the content. |
© 2026 by the authors. Licensee MDPI, Basel, Switzerland. This article is an open access article distributed under the terms and conditions of the Creative Commons Attribution (CC BY) license.