Article

Determination of Micro-Events and Microcracks in the Compressive Strength of Concrete Using the 3D Acoustic Spectrum in the Low Frequency and Infrasound

Institute of Building Engineering, University of Wroclaw, 50-370 Wroclaw, Poland
Materials 2026, 19(15), 3331; https://doi.org/10.3390/ma19153331
Submission received: 18 June 2026 / Revised: 16 July 2026 / Accepted: 3 August 2026 / Published: 5 August 2026
(This article belongs to the Special Issue Acoustic Materials: From Fundamental Design to Advanced Applications)

Abstract

Acoustic emission (AE) measurements are commonly used in studies of cementitious composites subjected to various types of loading. Recording macrocracks that result in a decrease in stress is not relatively difficult. This paper focuses on the possibility of identifying micro-events and microcracks during the compression of concrete with dispersed reinforcement. Most AE studies on cement composites correspond to a reduction in stress exceeding the elastic range defined by Hooke’s law, typically associated with the formation of the first crack and detected in the medium- and high-frequency ranges. However, identifying micro-events which do not reduce stress beyond the elastic range is difficult. This study demonstrates that such micro-events can be detected using low-frequency sound and infrasound. In many papers, medium- and high-frequency acoustic signals are effective for recording macrocracks or reinforcement damage. In this work, a 3D acoustic spectrum was used to analyze recorded data in the infrasound range in a concrete compressive test. This approach proved to be the most effective method for determining the critical point fcr (the end of the elastic range) regarding low-intensity micro-events and microcracks. This type of micro-damage has no significant influence on the linear stress–strain correlation at fcr. The results indicate that identifying micro-events and low-intensity microcracks using medium- and high-frequency acoustic signals is not possible and that infrasound should be considered for the detection. Significant differences in stress and displacement corresponding to fcr and fmax were confirmed in concrete compressive tests. The results indicate that accurately determining fcr is required for correctly assessing the durability of cementitious composites.

Graphical Abstract

1. Introduction

Monitoring the destruction process of cementitious composites using acoustic emission has been widely applied for many years [1,2,3]. Tests are conducted under various loading conditions [4]. Most studies focus on tensile and bending testing of mortars and concretes [5,6,7,8,9].
Various measurement techniques have been employed, primarily concentrating on the recording of AE signals in the medium and high-frequency ranges [10,11,12,13,14,15,16]. The identification of macrocracks at maximum load and the monitoring of the failure process have been the subject of numerous studies [17,18,19,20,21,22]. The primary application of this research is related to structural safety assessment and the diagnosis of structural elements [23,24,25,26,27].
Most existing studies focus on the analysis of acoustic effects occurring after the formation of microcracks and macrocracks [28,29,30,31,32,33,34,35]. Different types of damage have been recorded, including the occurrence of micro-events [36,37]. Micro-events comprise various phenomena, such as fiber pull-out, microstructural degradation, and detachment of coarse aggregate from the cement matrix. It was stated that the correlation of these effects with AE signals requires further investigation [38,39,40,41].
Previous studies have indicated a correlation between the acoustic spectrum and individual damage processes and their propagation, such as micro- and macrocracking, reinforcement breakage and pull-out, and the propagation of these effects [37,38]. The 3D acoustic spectrum enables the observation of acoustic effects over a wide frequency range and the correlation of specific frequency ranges with individual damage mechanisms [39,40].
Determining the micro-event signal from the background noise using traditional methods (in the mid- and high-frequency ranges) is not possible. To investigate the deterioration of material properties and their microstructure, combined analytical techniques were proposed [41,42,43,44].
The research indicated that the increase in the EA sum is information about fcr (range of Hooke’s law) [3]. The basic problem concerned the possibility of determining fcr when the intensity of events is low. The studies show a concentration of micro-cracks before the appearance of fmax, but do not record low-intensity micro-events at the fcr, which makes it difficult to correlate with acoustic effects [45]. One of the reasons was the lack of appropriate measurement devices (including an understanding) to search for microevents in the range of infrasound. Various alternative methods of micro-destruction research using EA are proposed [46,47].
In this paper, the 3D acoustic spectrum, mainly in infrasound and low frequency, was tested, indicating the effectiveness of this method for identifying micro-events and microcracks. Accurate determination of the critical stress fcr enables correct assessment of the durability of the cement composites.

2. Materials and Methods

The tests were conducted on concrete reinforced with dispersed steel fibers with the following properties (hooked): tensile strength ft = 1350 MPa; diameter d = 0.70 mm; length l = 50 mm; and l/d = 70. The concrete mixture contained 330 kg/m3 of Górażdże cement (Poland) CEM II/B-M (S-V) 42.5 N cement with a water/cement ratio (w/c) of 0.48. The natural aggregate (0/16 mm) content was 1820 kg/m3.
The displacement rate of the traverse during the compression test was 0.5 MPa/s. The specimen cross section was 150 mm × 150 mm. Six samples were prepared for each fiber content of 10 kg/m3, 15 kg/m3, and 17 kg/m3.
To interpret the acoustic effects, the Spectra PLUS-SC software (Pioneer Hill Software LLC, Sequim, WA, USA, version 5.3.3.5) was used, which enables the visualization of the 3D acoustic spectrum. Due to the large volume of AE data and 3D spectra, it is not feasible to present all results. Therefore, one representative sample from each series was selected to illustrate the physico-mechanical properties and the most significant acoustic effects.
Table 1 presents two types of microphones with different characteristics. The first microphone is designed for the infrasound range covering frequencies from 0.5 Hz up to 20 kHz. The second microphone is less sensitive but offers a wider frequency range from 4 Hz to 70 kHz.
Table 2 presents symbols of concrete with different fiber volume and selected microphone type. Figure 1 illustrates the measurement setup.
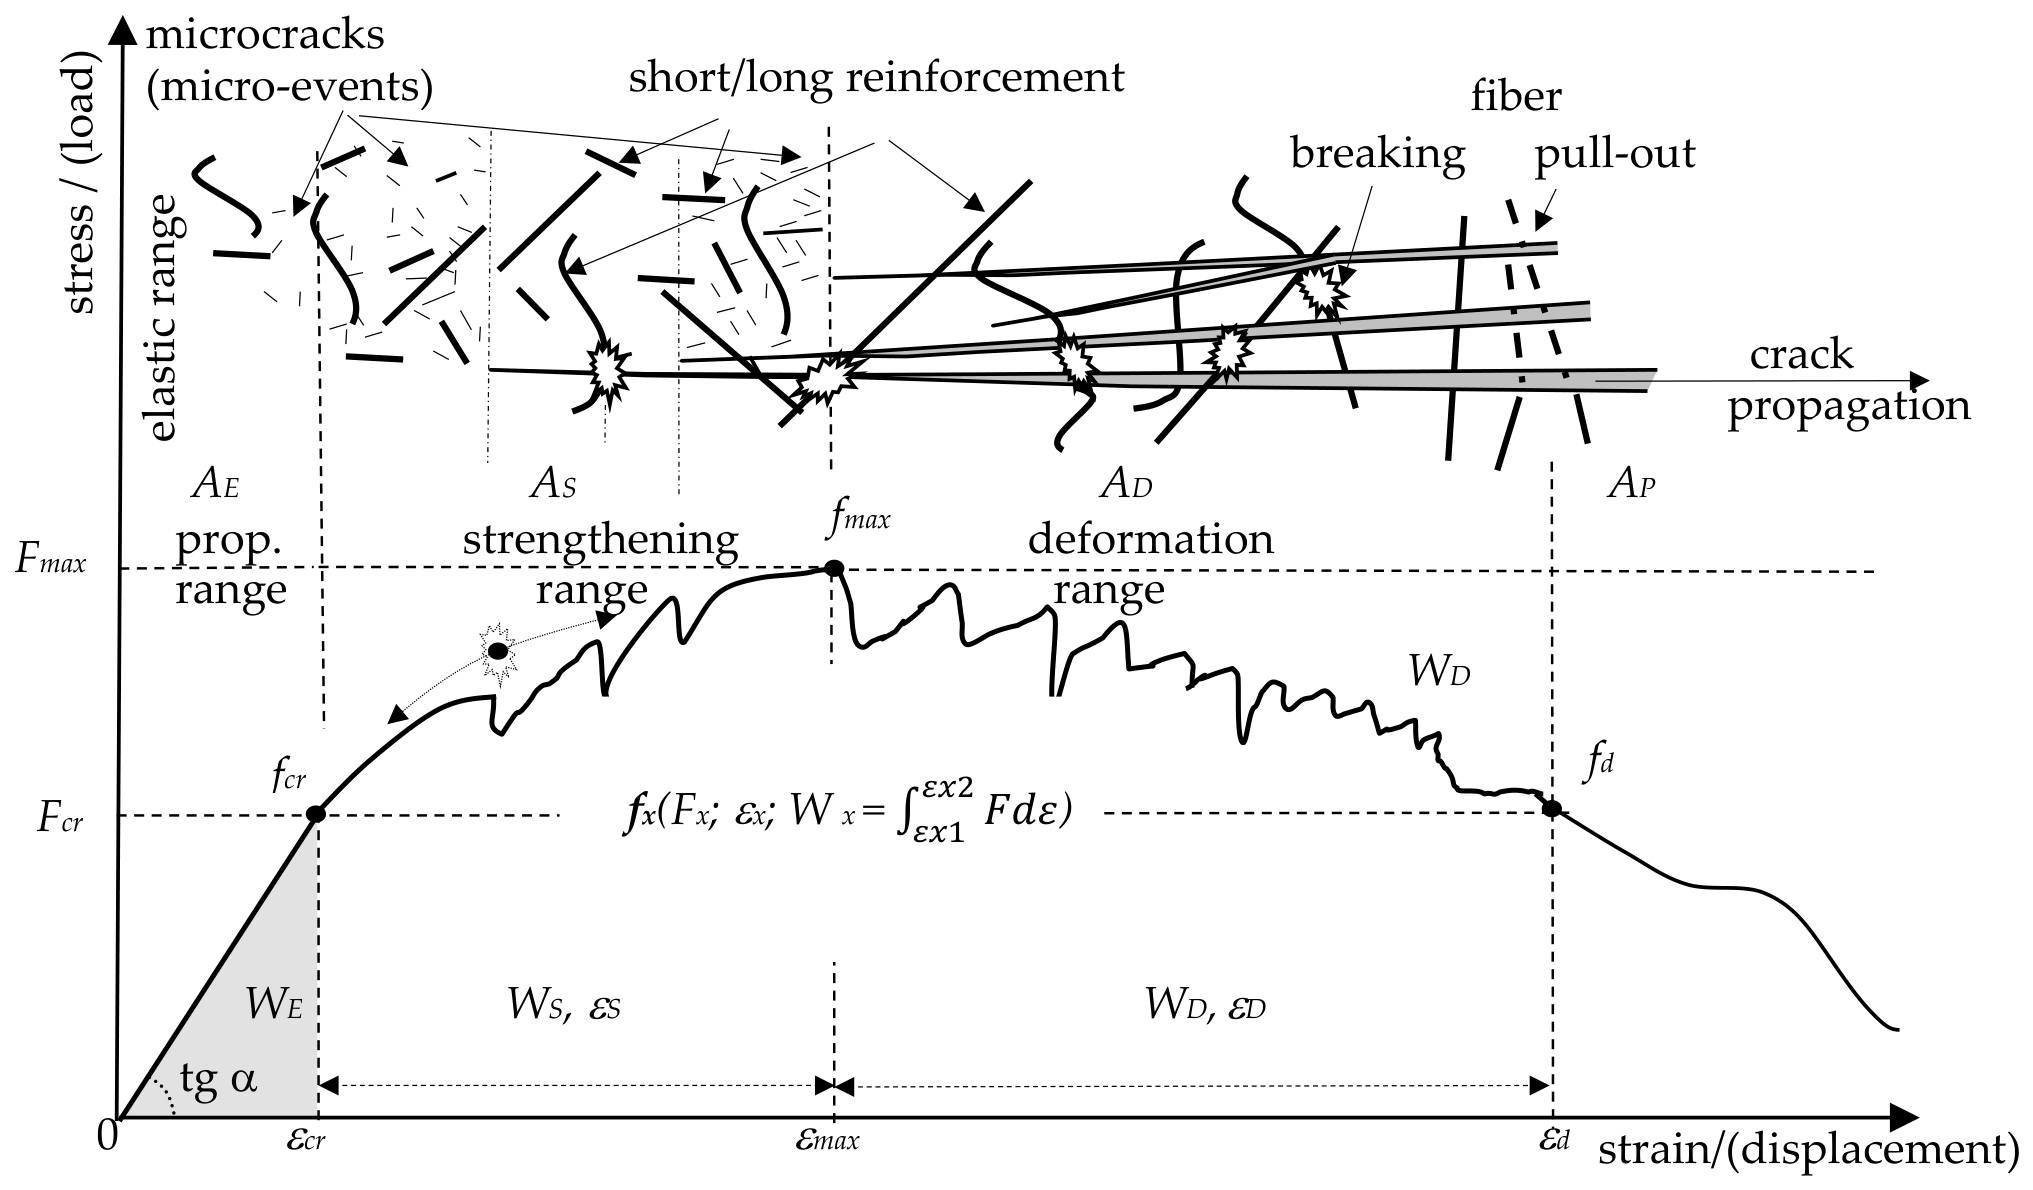
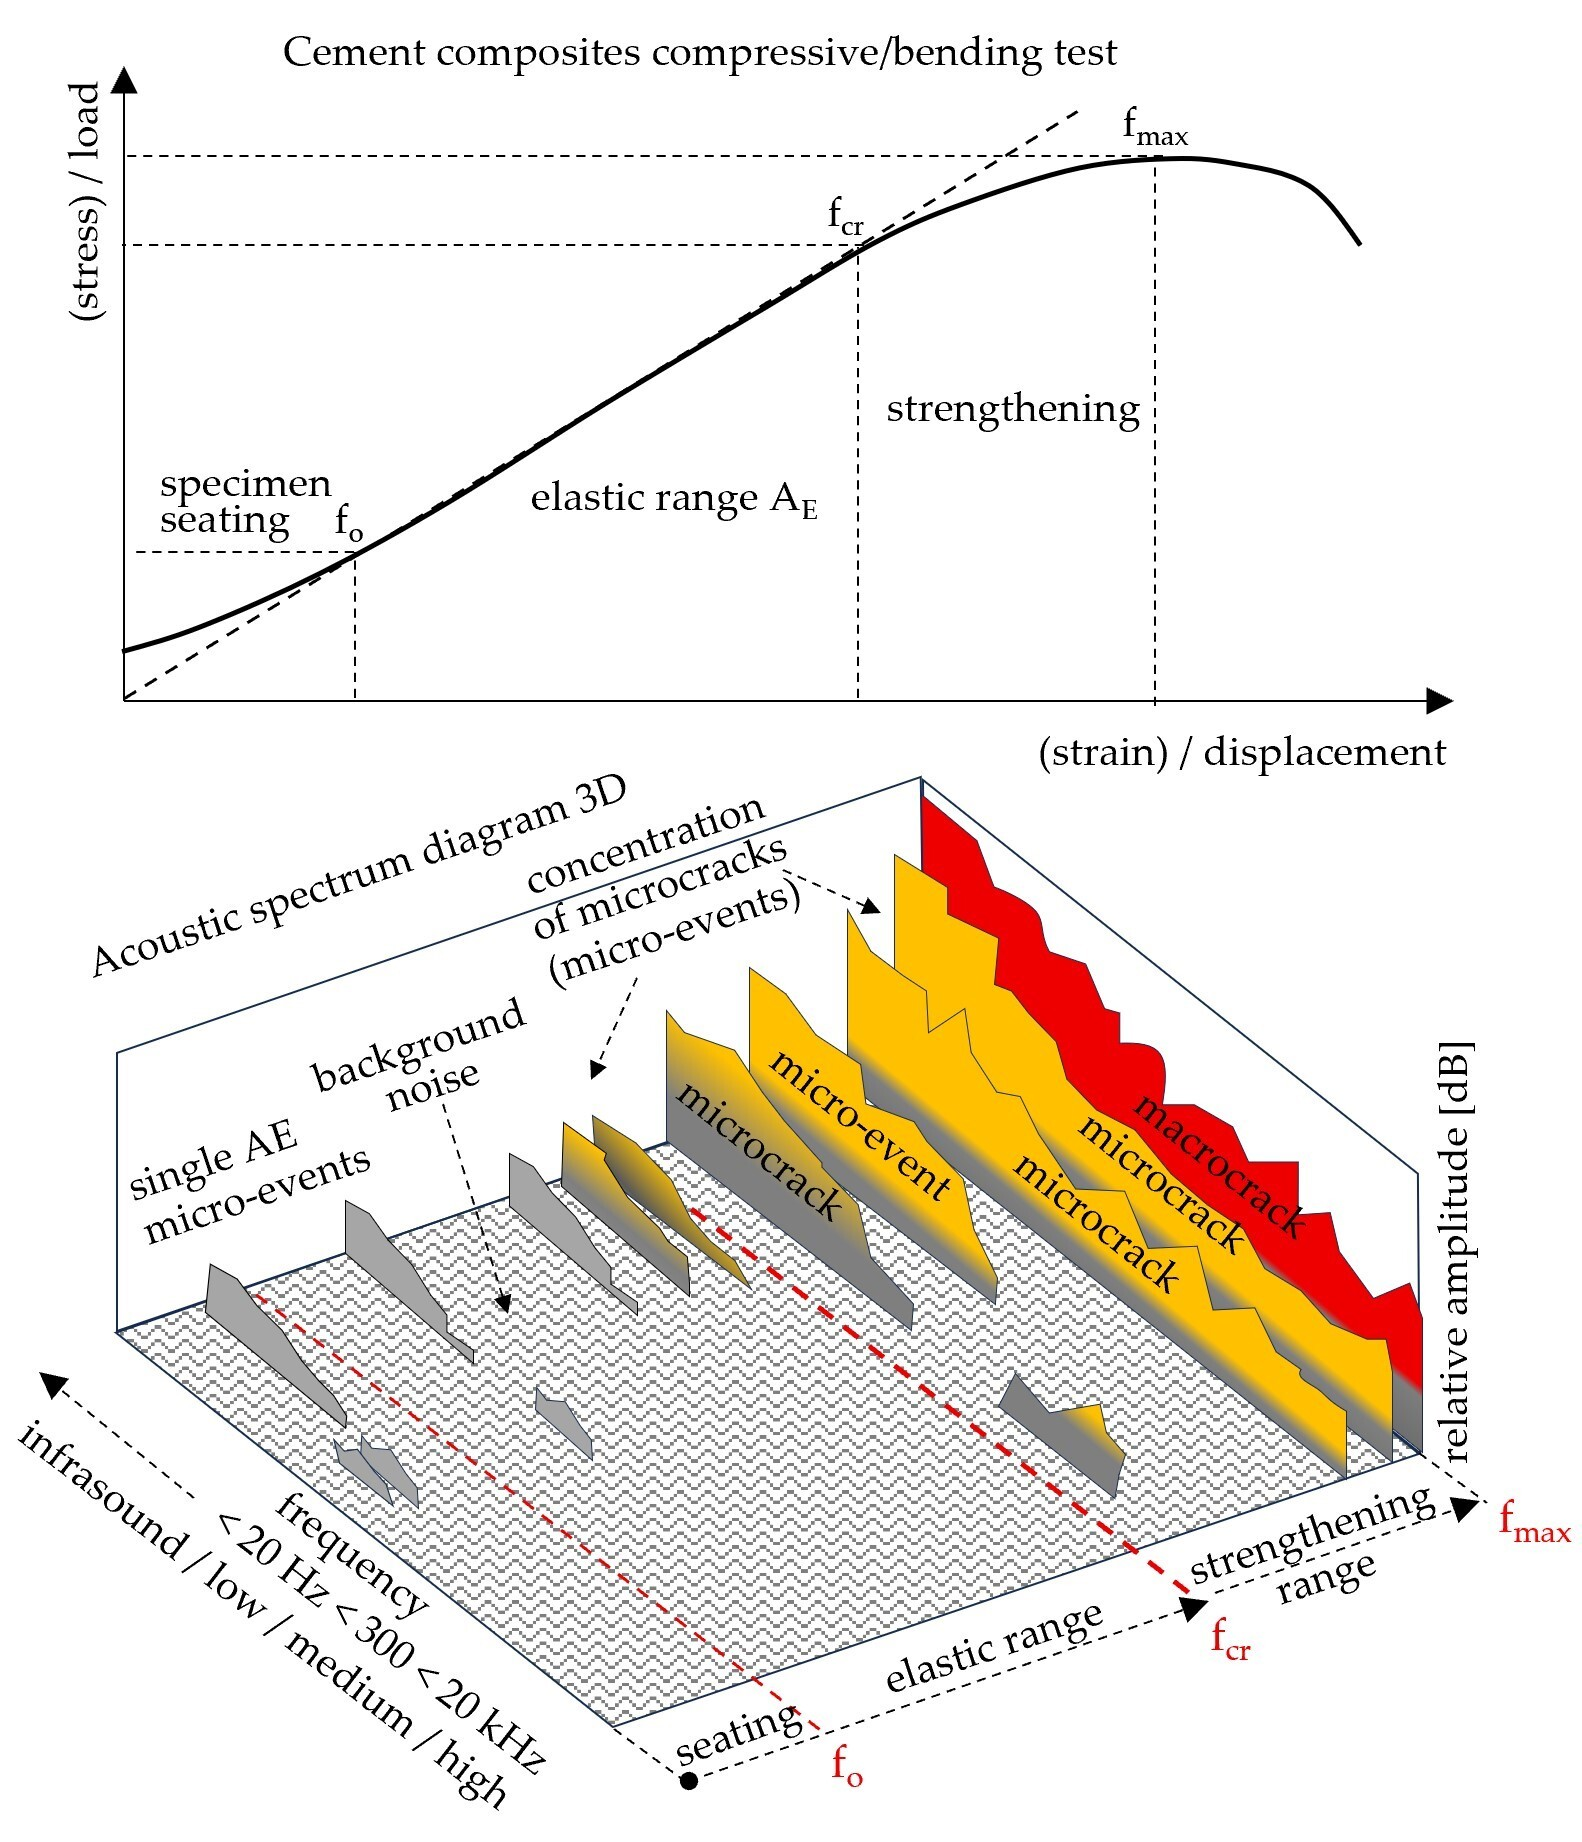
Figure 2 shows a diagram of ESD fiber-reinforced cement composites during stress–strain (load/displacement) in the compressive/bending test. The composites exhibit significantly higher stresses and deformations after exceeding the elastic range. For each point fx (compressive/bending strength) on the stress–strain curve, the corresponding force Fx, strain εx (displacement d) and absorbed energy Wx (calculated as the area under the curve) can be determined.

3. Results

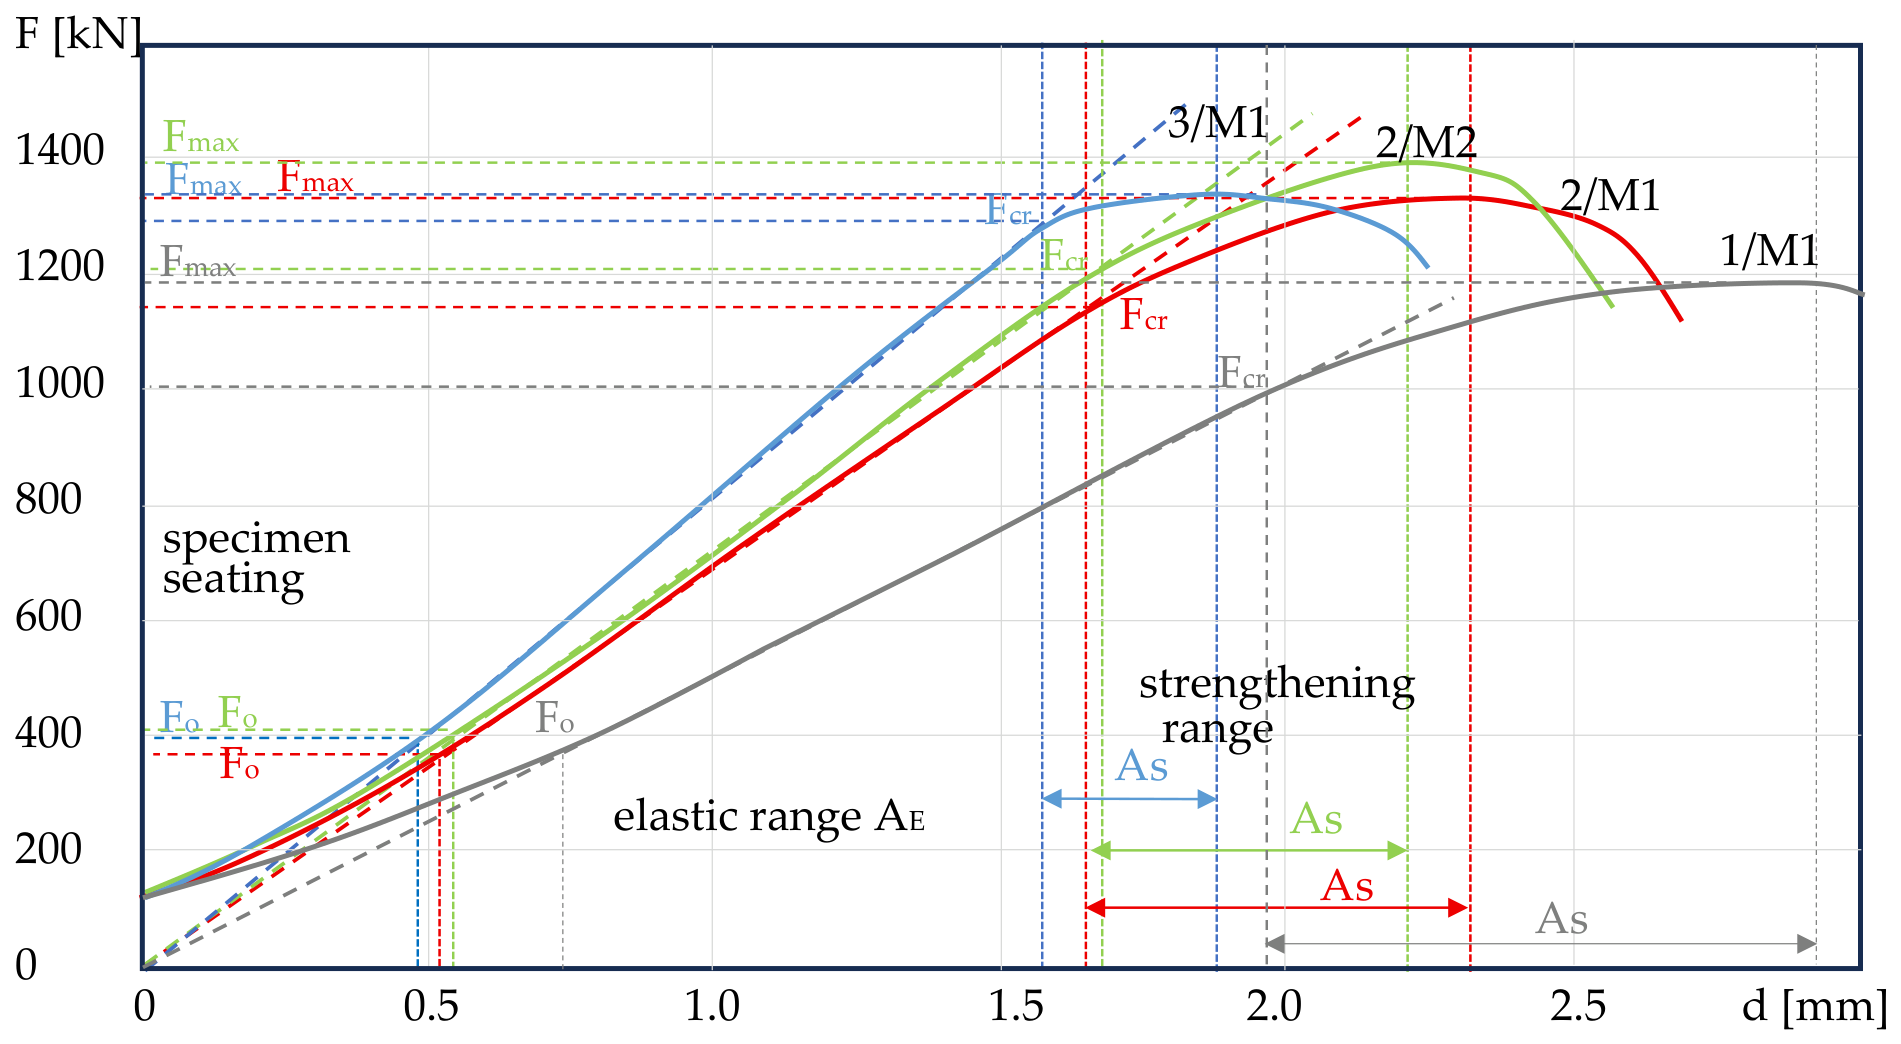
The mechanical properties of the samples under compressive load are presented in Table 3 and Figure 3. The values of force, deflection and stress were determined for the critical point fcr (elastic range) and for fmax. In addition, the slope of the load–displacement curve (tgα = Fcr/dcr) and absorbed energy WS (the area under the curve between fcr and fmax) are included. Deflection was measured as traverse displacement, which resulted in a non-linear correlation up to the point Fo due to specimen seating. To facilitate comparison of the load–displacement curves, the proportional correlation (the initial portion of the curve Fcr up to Fo) was extrapolated to the origin (due to specimen seating), representing the elastic range, AE. The time of the traverse displacement between fcr and fmax was marked as tS and the displacement in the strengthening range was marked as ds = dmax − dcr.
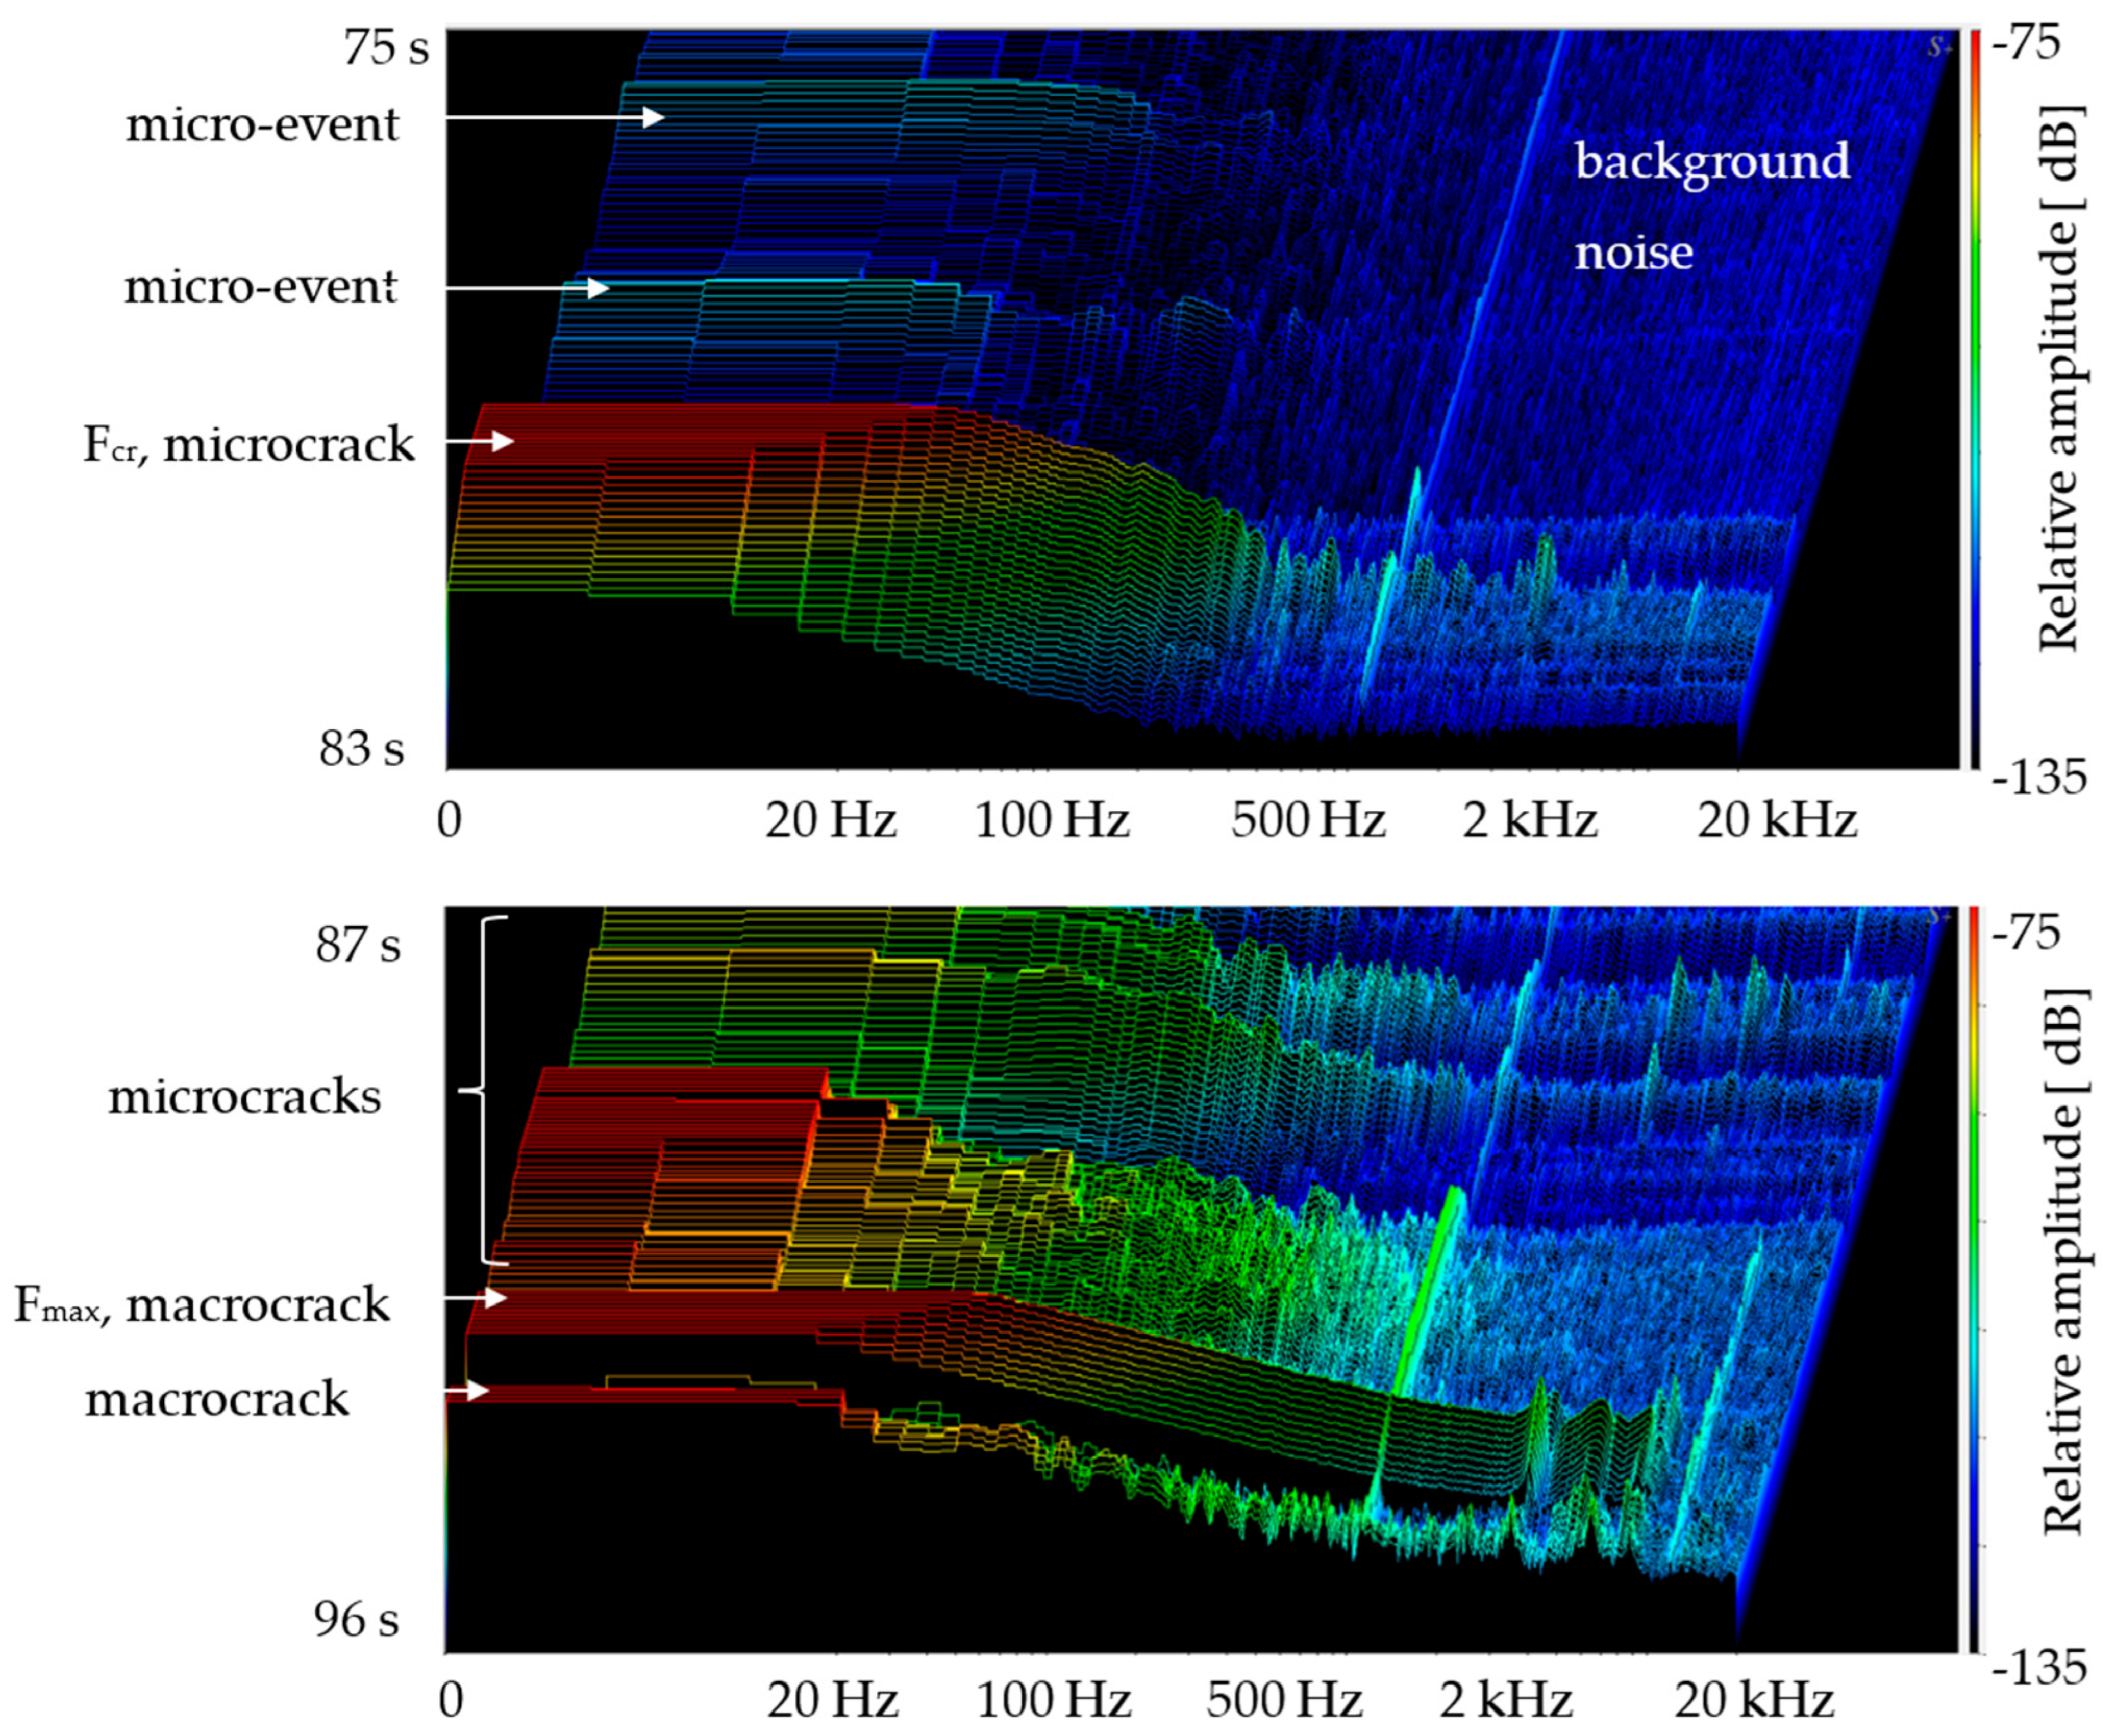
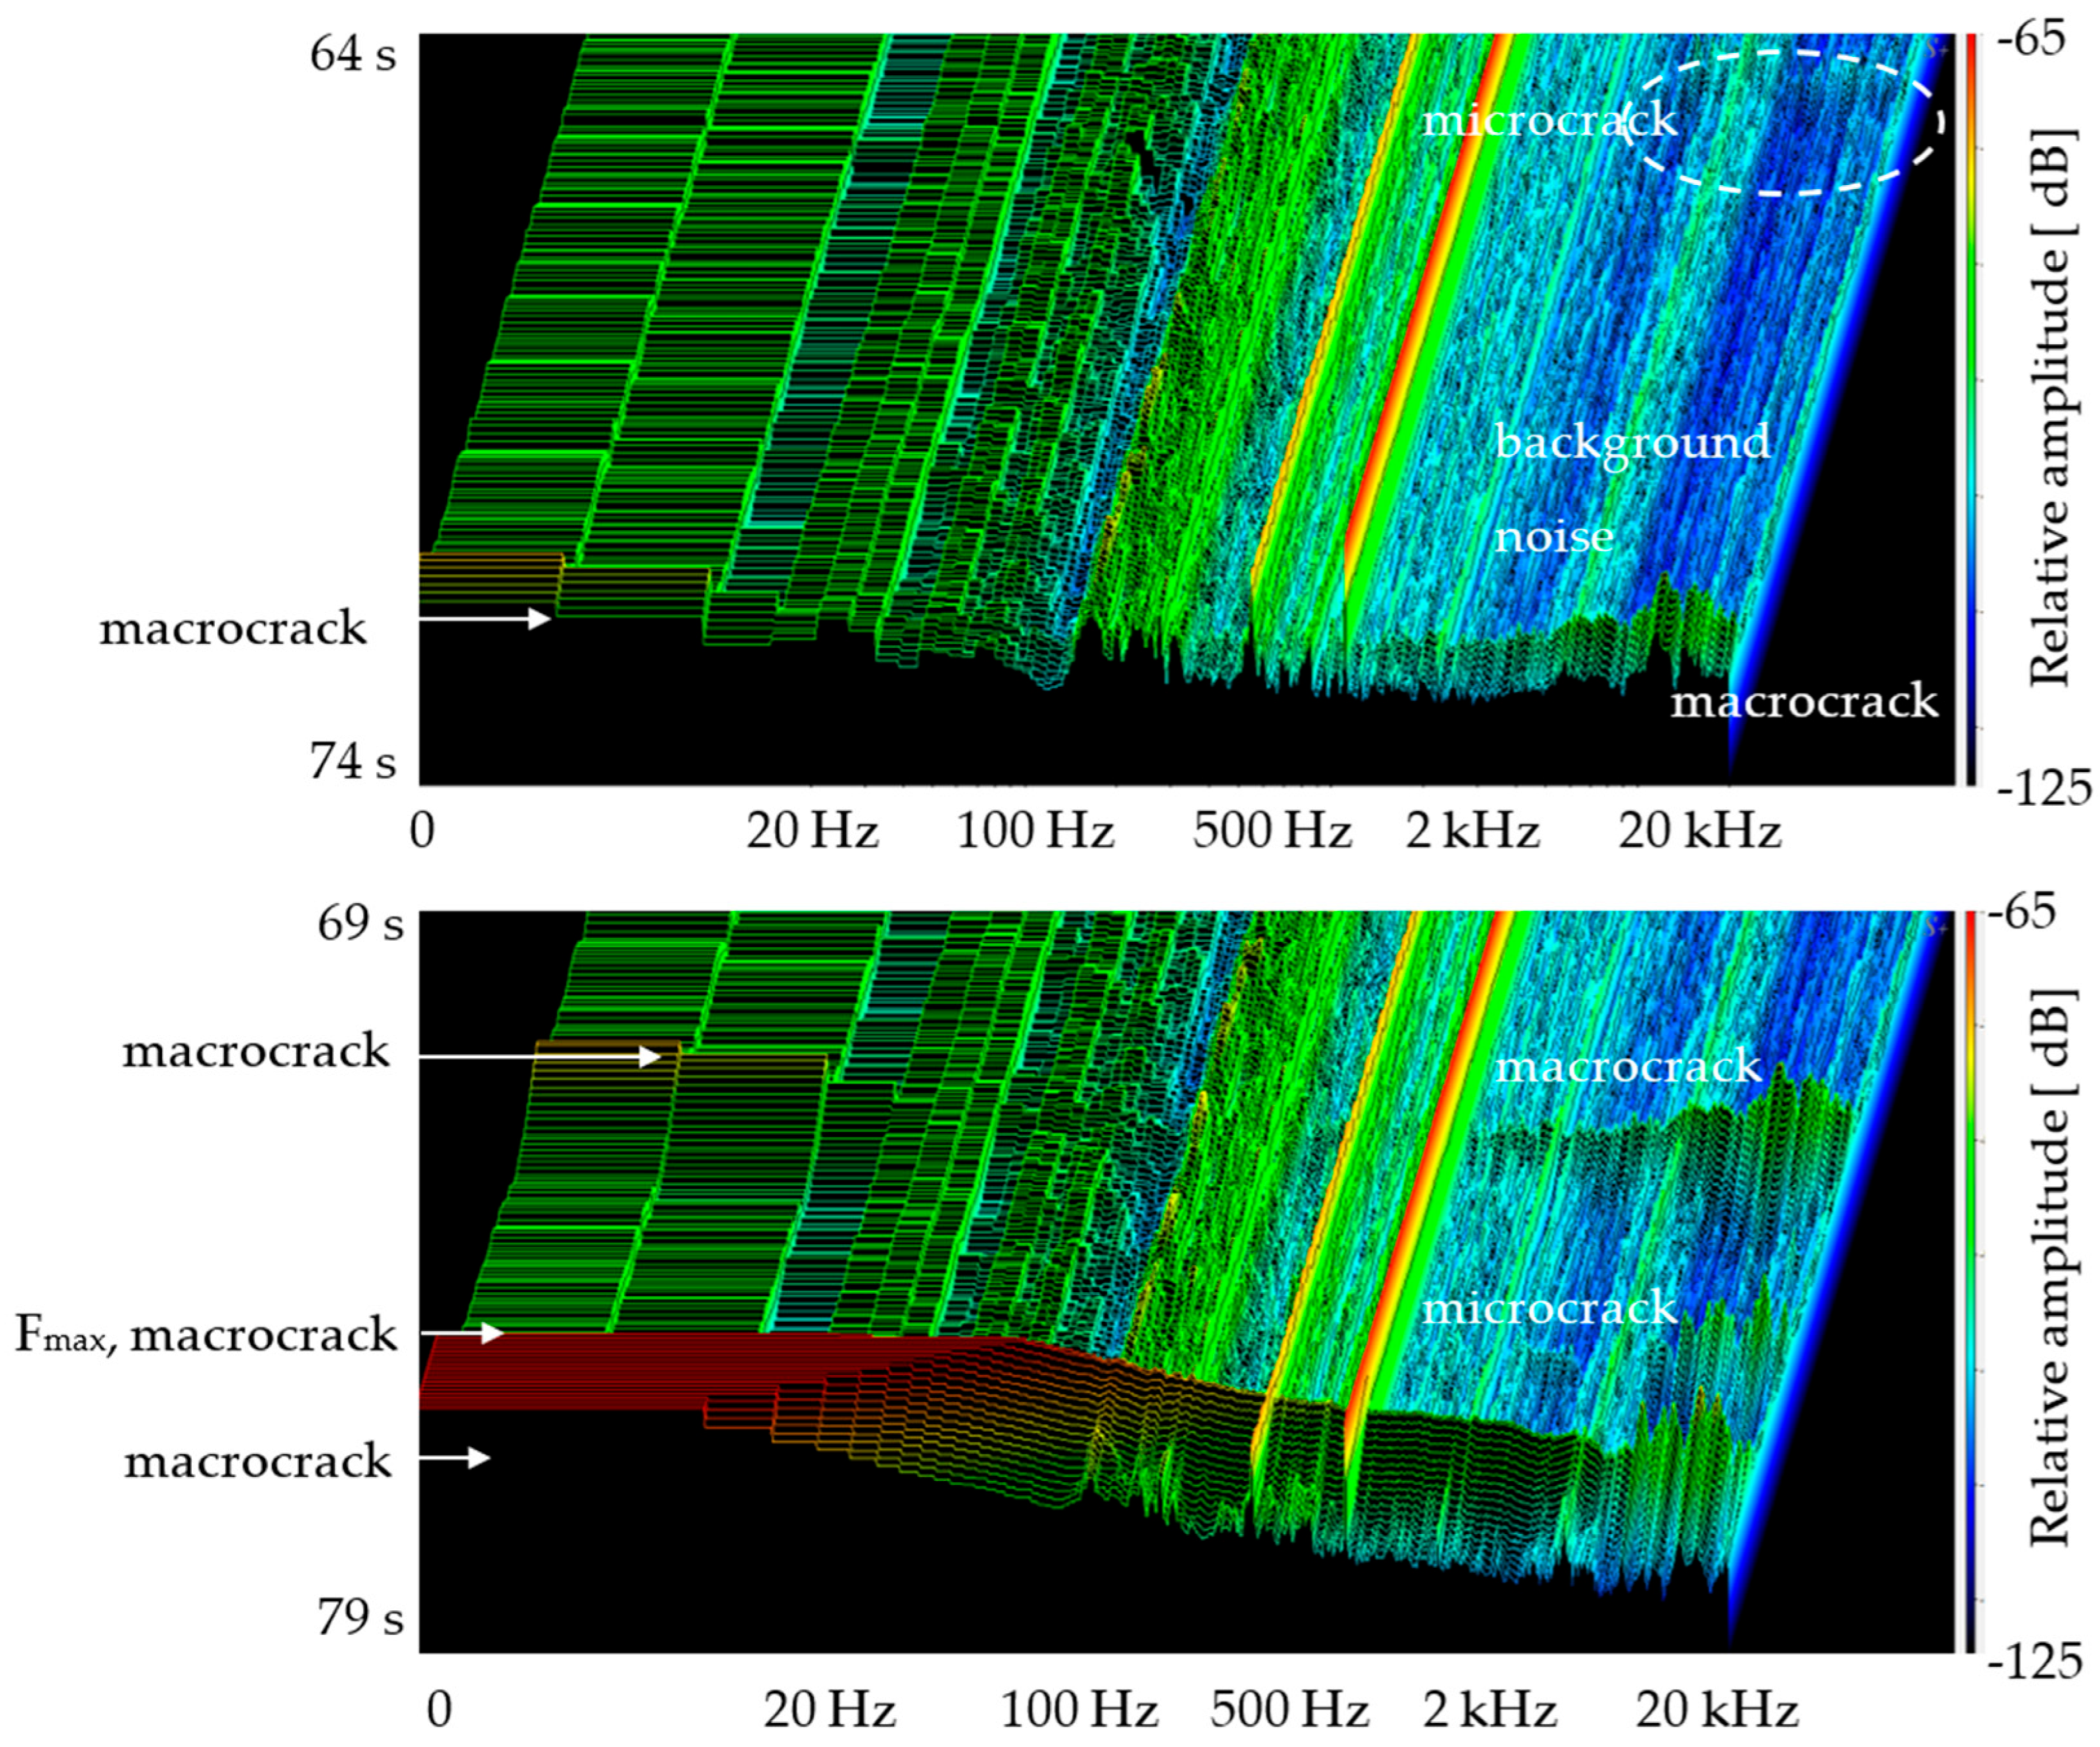
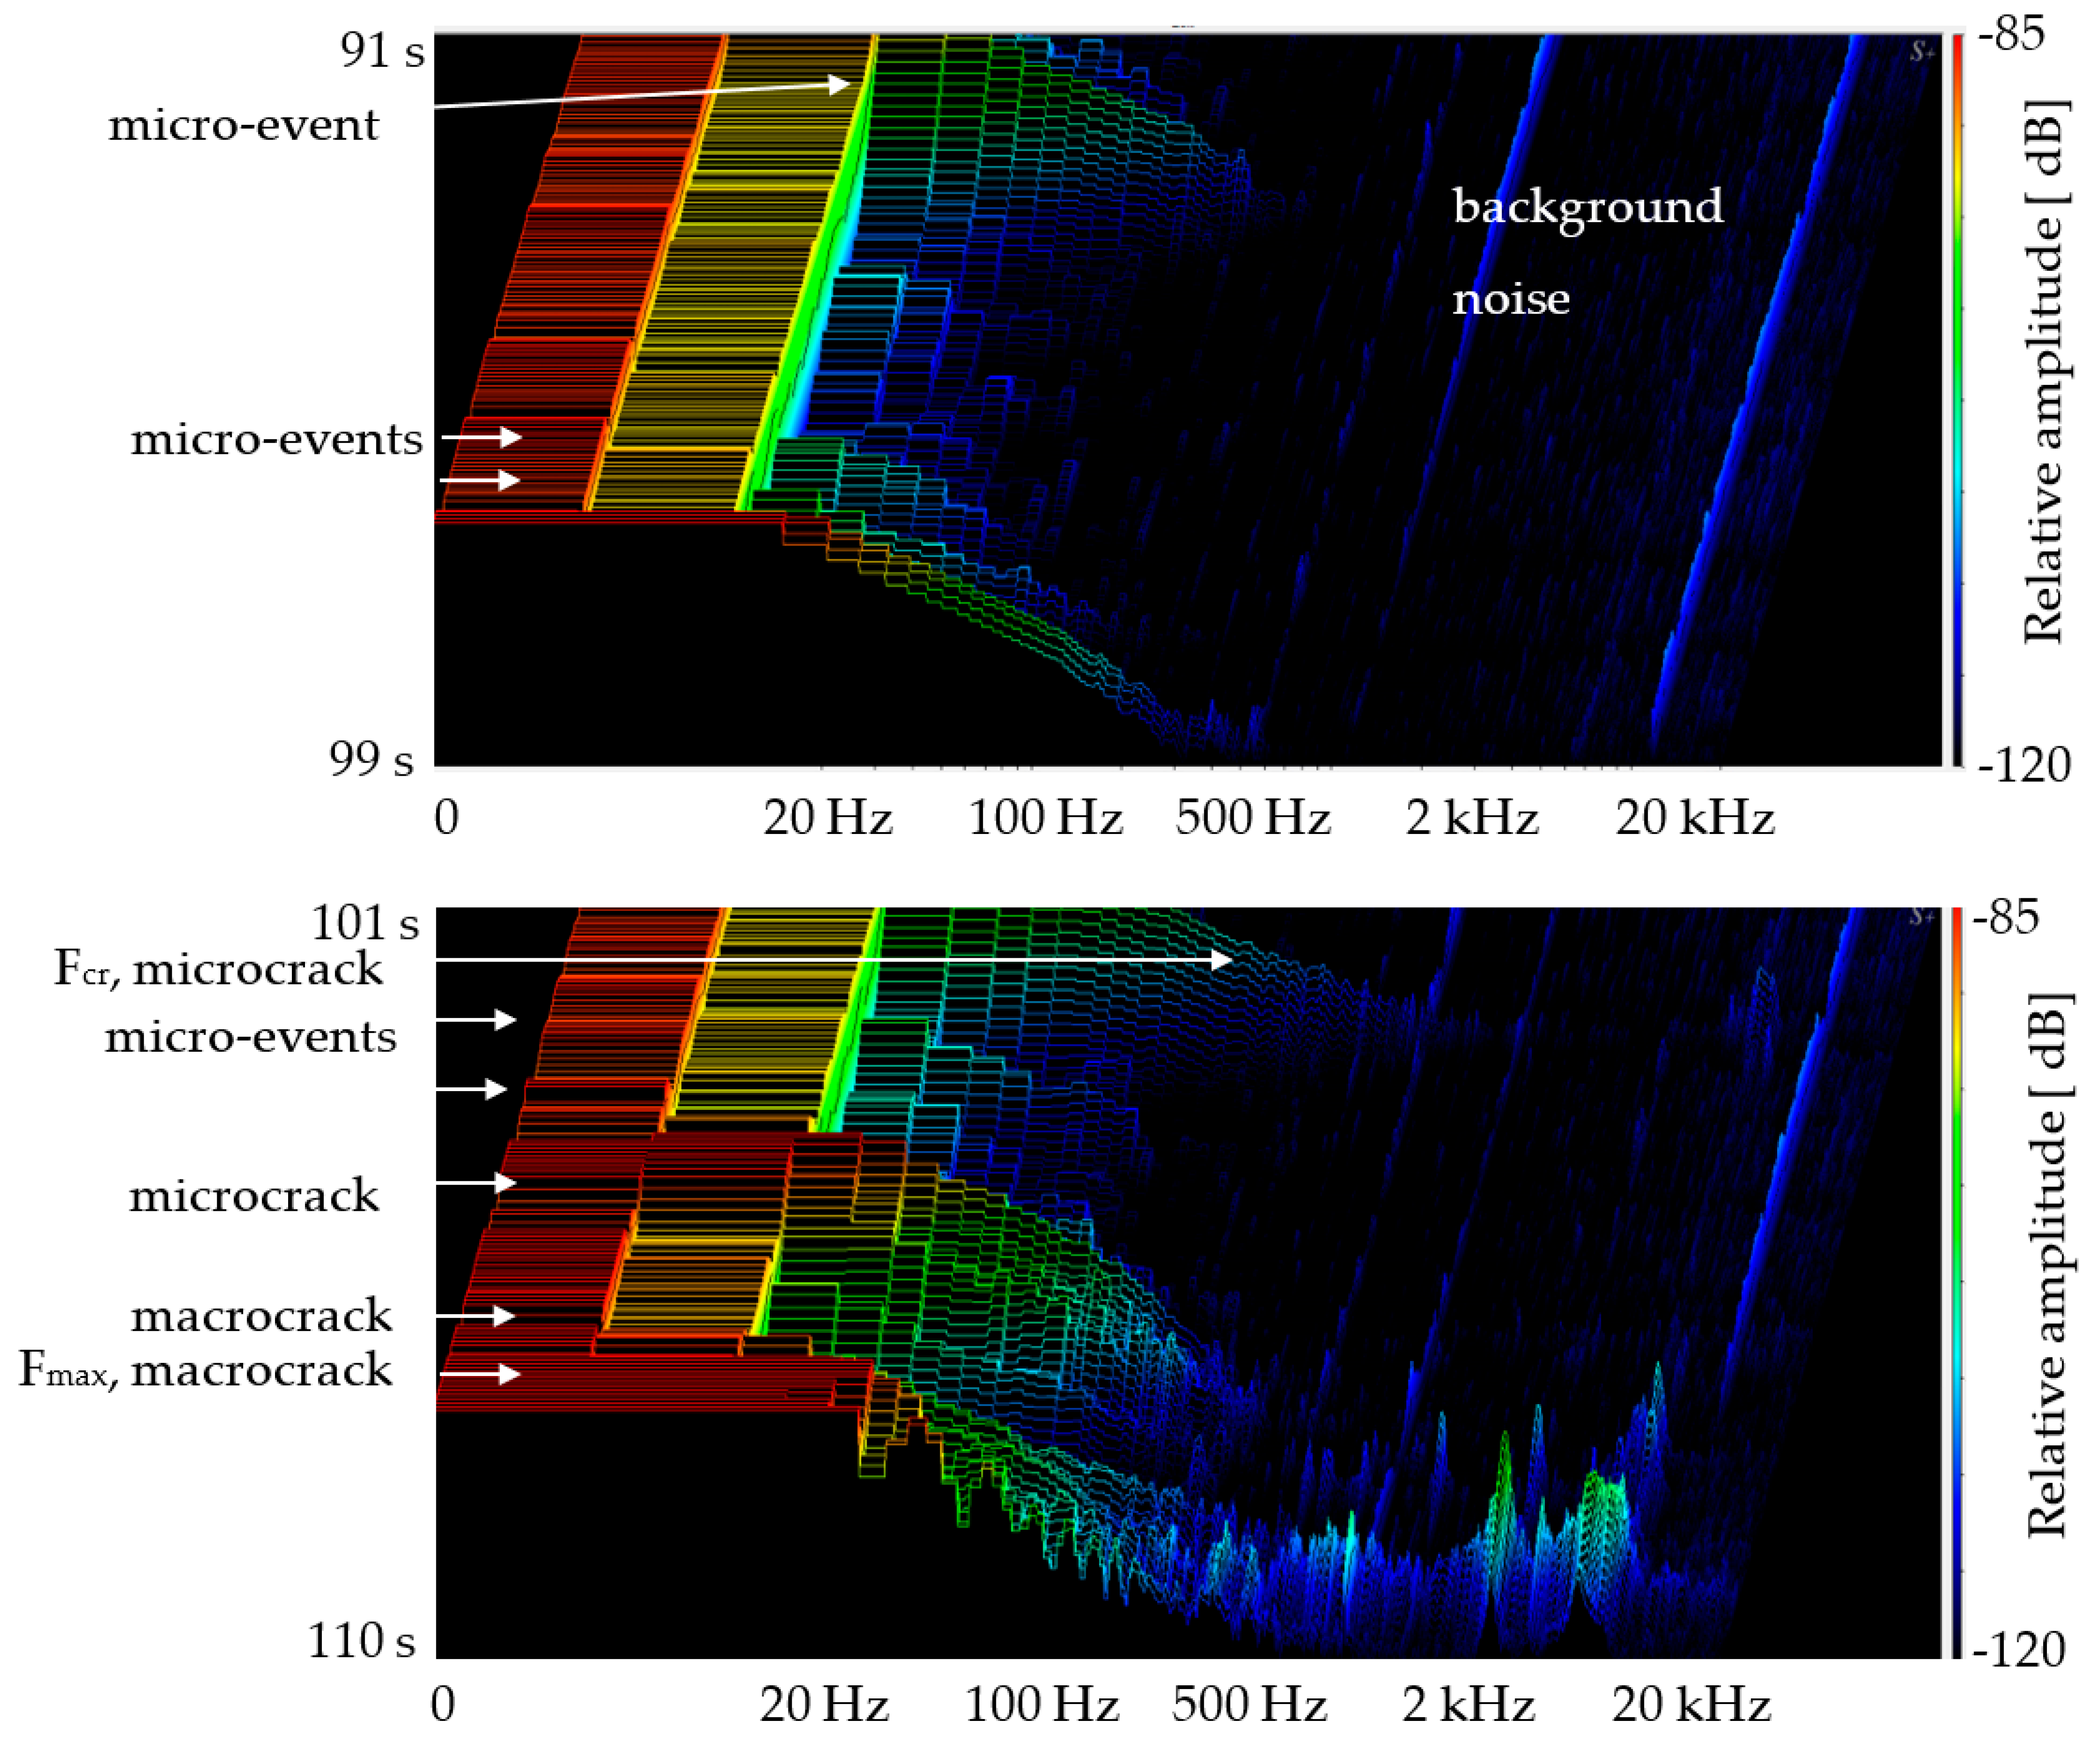
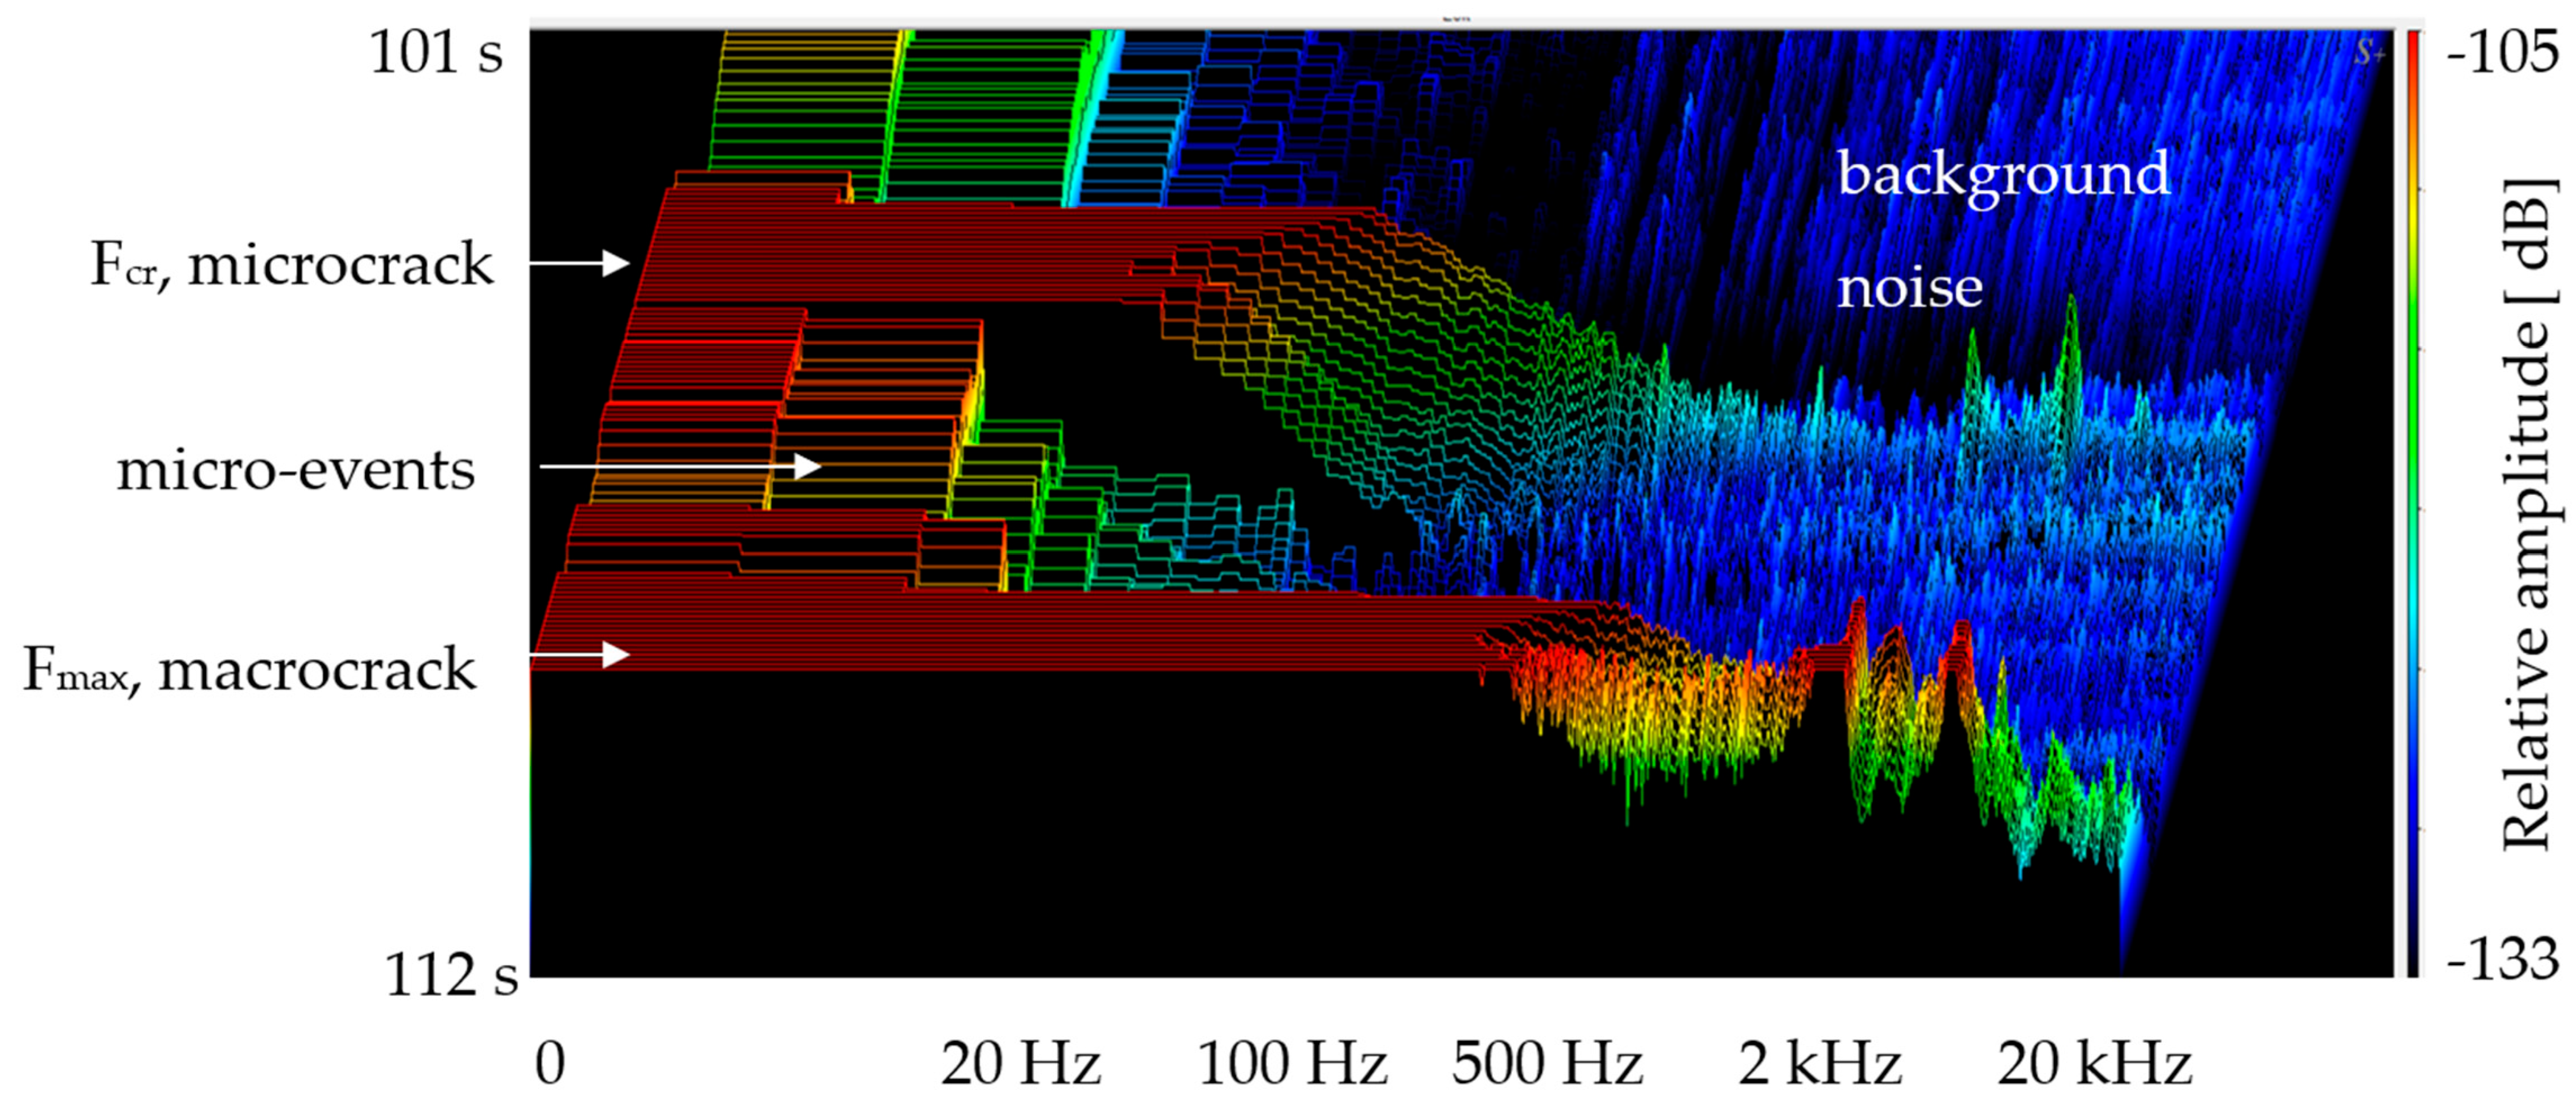
The recorded acoustic effects are presented in Figure 4 (1/M1), Figure 5 (2/M2), Figure 6 (2/M1) and Figure 7 (3/M1). The 3D acoustic spectra illustrate the occurrence of micro-events, microcracks and macrocracks. Areas of concentration of acoustic effects before formation of the macrocrack at the fmax have been marked. The occurrence of micro-events in the infrasound range was correlated with fcr in Figure 4 and Figure 6. The appearance of microcracks associated with fcr is shown in Figure 5 and Figure 7. In all cases, the concentrations of micro-events and microcracks can be observed before the macrocrack forms at the fmax.
The traverse displacement time between the fcr and fmax (based on Table 3, Figure 3) is ts = 17.0 s (1/M1), ts = 17.4 s (2/M2), ts = 17.0 s (2/M1) and ts = 7.6 s (3/M1). The time between the first micro-event (microcrack, fcr) and macrocrack fmax based on the 3D sound spectrum is presented in Figure 4, Figure 5, Figure 6 and Figure 7 (left side).

4. Discussion

The results of the research confirm the possibility of correlating the processes of macro- and microcrack formation with acoustic effects before and after fmax, Figure 4, Figure 5, Figure 6 and Figure 7. It was also confirmed that the concentration of microcracks enables the prediction of macrocrack formation at fmax in medium and high frequencies. Macro-destruction processes such as reinforcement fracture, pull-out or crack propagation are possible by analyzing the intensity and amplitude of acoustic signals using the 3D acoustic spectrum.
The 2/M2 microphone sample (higher-frequency range) allows the detection of macrocracks, including their concentrations, before, at and after the fmax point (Figure 5). However, no micro-events were detected and the identification of microcracks at fcr remains unclear. The traverse displacement time between the fcr and fmax is ts = 17.4 s (Table 3, Figure 3) and the time between the first microcrack and macrocrack fmax is 13 s, Figure 5. It indicates that this kind of microphone (M2) does not record micro-events (microcracks), which should be found at fcr approximately 17.4 s before fmax. In the case of other samples in which the M1 microphone (recording infrasound) is used, the correlation between fcr and the first microevent can be determined in Figure 4, Figure 6 and Figure 7.
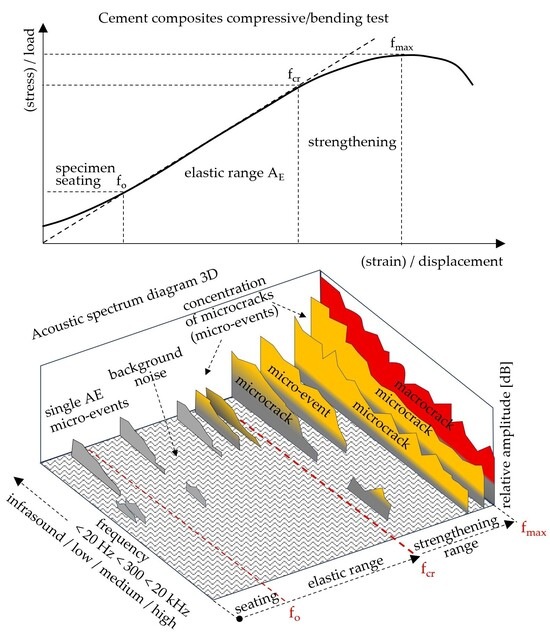
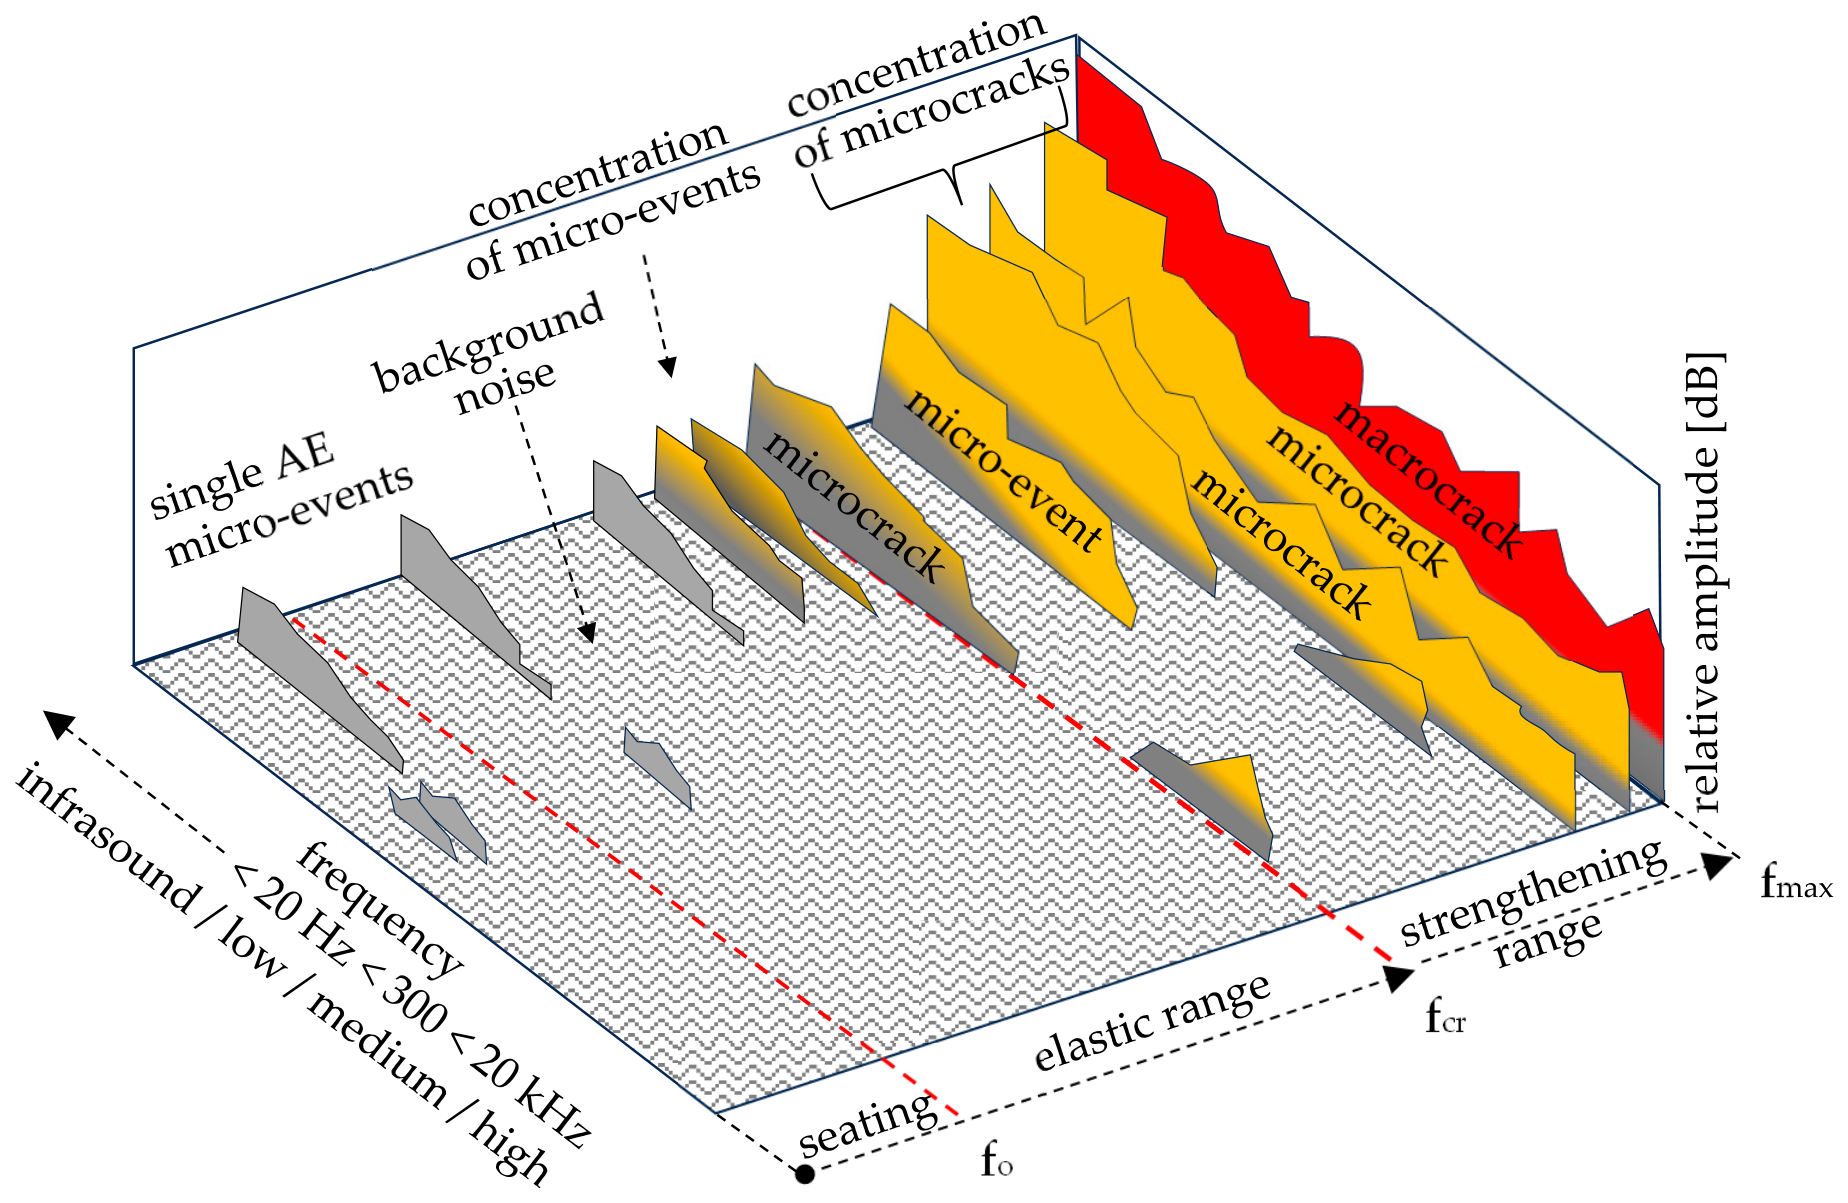
In cement composites, where the changes in the linear load–displacement correlation are not significant (resulting in low acoustic effect at fcr), this indicates the formation of micro-events or microcracks. This early-stage damage process makes it difficult to determine. This paper focused on the possibility of correlating 3D acoustic spectrum effects with the fcr point and the strengthening range of AS. The scheme of the results is presented in Figure 8. It has been demonstrated that correlating acoustic events with the damage process enables the determination of fcr and the prediction of macrocrack formation in cement composites at fmax.
Previous attempts to detect acoustic effects were limited by the frequency range of the microphones and did not cover the infrasound range. A comparison of Figure 4, Figure 5 and Figure 6 shows that using the M1 microphone, which operates in the low-frequency and infrasound range, enables the detection of micro-events. Microphone measurements in the infrasound range provide a significantly better correlation between micro-events and fcr. In the present tests, micro-events were identified in the infrasound (<20 Hz) and in the low-frequency range.
This study did not investigate the nature of macro-events occurring in the infrasound range. Such events may include the initiation of microcracks, minor surface damage or the detachment of aggregates or reinforcement from the matrix. Determining these phenomena will require separate future studies aimed at correlating them with acoustic effects.
Macrocracks (including the fmax macrocrack) characterize acoustic effects in the range from infrasound (<20 Hz) to high frequencies 20 kHz. The identification of macrocracks and microcracks is possible by analyzing the amplitude and intensity of the acoustic spectrum (Figure 4, Figure 5, Figure 6 and Figure 7). The highest amplitudes and sound levels are correlated with fmax, while the lowest correspond to micro-events and microcracks occurring with fcr and the strengthening range AS. The general conclusions can also be extended to cement composites without fiber reinforcement, as the load–displacement curve in these materials during the compression test is similar (also characterizing fcr and fmax points). In sample 1/M1, the amount of dispersed reinforcement (10 kg/m3) is relatively low, as is typical in industrial floors to reduce shrinkage. This fiber content does not significantly change the load–displacement correlation in the compression test of traditional concrete. Similar conclusions can be stated in traditional cement composites.
In evaluating the durability of both traditional and non-traditional cement composites, fmax is usually used as a reference point. The results indicate significant differences in stress and the corresponding deformations at fcr and fmax. For sample 1/M1 (the lowest fiber content of 10 kg/m3), the difference in load F at fcr and fmax is 19.7% and the difference between the displacements dcr and dmax is 6.7%. Furthermore, this sample exhibits the highest deformability in the strengthening range As and the greatest number of recorded acoustic events correlated with the destruction process, including the absorbed energy Ws. These results indicate that, for assessing the durability of cement composites with a significant strengthening range As, the stress corresponding to fcr and not to fmax should be considered.
Presented samples confirmed the possibility of identifying micro-events in infrasound 3D spectrum and the lack of such a possibility in the range of medium and high frequencies. The possibility of observing the presented correlation was found each time in cement composite tests (with or without dispersed reinforcement). This conclusion refers mainly to our own studies included in the references and does not exclude the possibility of identifying micro-events by other methods in a different frequency range [41,42,43,44,46,47]. The paper indicates the possibility of designating micro-events and further quantitative research is needed to identify this micro-destruction process. An analysis of micro-events using SEM, optical microscopy, X-ray tomography, DIC, and ultrasound imaging is essential. This recognition is important due to the possible significant impact of micro-events on materials durability.

5. Conclusions

The concentration of micro-events and microcracks in cement composites with the 3D acoustic spectrum in the infrasound range (at low acoustic intensities) enables the determination of the critical point fcr. It was indicated that it is difficult to determine microdefects in the medium- and high-frequency range.
It was stated that further research should correlate micro-events with the 3D acoustic spectrum in cement composites using the infrasound (such as reinforcement or aggregate detachment, microcrack initiation, etc.).
The assessment of the damage process in cement composites requires correlation with 3D acoustic spectra over a wide frequency range from infrasound (associated with micro-events at fcr) to medium- and high-frequency signals related to macrocracks and reinforcement destruction. The concentration of acoustic effects indicates the initiation and propagation of micro and macrocracks at fcr and fmax.
Significant differences in strength and displacement at fcr and fmax during the compressive test of cement composites and a large amount of absorbed energy (micro-destruction process in the strengthening range) were demonstrated. These results indicate that for an accurate assessment of the durability of cement composites, the stress and the displacement corresponding to fcr should be considered and determined by 3D acoustic spectra in the range of infrasound.

Funding

This research received no external funding.

Data Availability Statement

The original contributions presented in this study are included in the article. Further inquiries can be directed to the corresponding author.

Conflicts of Interest

The author declares no conflicts of interest.

References

  1. Ohtsu, M. The history and development of acoustic emission in concrete engineering. Mag. Concr. Res. 1996, 48, 321–330. [Google Scholar] [CrossRef]
  2. Ouyang, C.S.; Landis, E.; Shh, S.P. Damage assessment in concrete using quantitative acoustic emission. J. Eng. Mech. 1991, 117, 2681–2698. [Google Scholar] [CrossRef]
  3. Kucharska, L.; Brandt, A.M. Pitch-based carbon fibre reinforced cement composites. In Materials Engineering Conference ASCE. Materials for the New Millenium; Chong, K.P., Ed.; American Society of Civil Engineers: New York, NY, USA, 1996; Volume 1, pp. 1271–1280. [Google Scholar]
  4. Brandt, A.M. Fibre reinforced cement-based (FRC) composites after over 40 years of development in building and civil engineering. Compos. Struct. 2008, 86, 3–9. [Google Scholar]
  5. Prashanth, M.H.; Singh, P.; Kishen, J.M.C. Role of longitudinal reinforcement on the behavior of under reinforced concrete beams subjected to fatigue loading. Int. J. Fatigue 2019, 125, 271–290. [Google Scholar]
  6. Thirumalaiselvi, A.; Sasmal, S. Acoustic emission monitoring and classification of signals in cement composites during early-age hydration. Constr. Build. Mater. 2019, 196, 411–427. [Google Scholar]
  7. Nor, N.M.; Abdullah, S.; Saliah, S.N.M. On the need to determine the acoustic emission trend for reinforced concrete beam fatigue damage. Int. J. Fatigue 2021, 152, 106421. [Google Scholar] [CrossRef]
  8. Burud, N.B.; Kishen, J.M.C. Response based damage assessment using acoustic emission energy for plain concrete. Constr. Build. Mater. 2021, 269, 21241. [Google Scholar] [CrossRef]
  9. Elaqra, H.; Godin, N.; Peix, G.; R’Mili, M.; Fantozzi, G. Damage evolution analysis in mortar, during compressive loading using acoustic emission and X-ray tomography: Effects of the sand/cement ratio. Cem. Concr. Res. 2007, 37, 703–713. [Google Scholar] [CrossRef]
  10. Chen, B.; Liu, J. Experimental study on AE characteristics of free-point-bending concrete beams. Cem. Concr. Res. 2004, 34, 391–397. [Google Scholar]
  11. Schabowicz, K.; Gorzelańczyk, T.; Szymków, M. Identification of the degree of degradation of fibre-cement boards exposed to fire by means of the acoustic emission method and artificial neural networks. Materials 2019, 12, 656. [Google Scholar] [CrossRef] [PubMed]
  12. Ranachowski, Z.; Jóźwiak-Niedźwiedzka, D.; Brandt, A.M.; Dębowski, T. Application of acoustic emission method to determine critical stress in fibre reinforced mortar beams. Arch. Acoust. 2012, 37, 261–268. [Google Scholar] [CrossRef]
  13. Brandt, A.M.; Ranchowski, Z.; Zieliński, M.; Dąbrowski, M.; Sobczak, M. Report from Tests of Cracking Resistance of Bent Cement Composite Samples; Polish Academy of Science Institute of Fundamental Technology Problems: Warsaw, Poland, 2010. [Google Scholar]
  14. Aggelis, D.G.; Mpalaskas, A.C.; Matikas, T.E. Investigation of different modes in cement-based materials by acoustic emission. Cem. Concr. Res. 2013, 48, 1–8. [Google Scholar] [CrossRef]
  15. Kim, B.; Weiss, W.J. Using acoustic emission to quantify damage in restrained fibre-reinforced cement mortars. Cem. Concr. Res. 2003, 33, 207–214. [Google Scholar] [CrossRef]
  16. Landis, E.; Ballion, L. Experiments to relate acoustic energy to fracture energy of concrete. J. Eng. Mech. 2002, 128, 698–702. [Google Scholar] [CrossRef]
  17. Paul, S.C.; Pirskawetz, S.; Zijl, G.P.A.G.; Schmidt, W. Acoustic emission for characterising the crack propagation in strain-hardening cement-based composites (SHCC). Cem. Concr. Res. 2015, 69, 19–24. [Google Scholar] [CrossRef]
  18. Reinhardt, H.W.; Weiler, B.; Grosse, C. Nondestructive testing of steel fibre reinforced concrete. Brittle Matrix Compos. 2000, 6, 17–32. [Google Scholar]
  19. Shahidan, S.; Rhys Pulin, R.; Bunnori, N.M.; Holford, K.M. Damage classification in reinforced concrete beam by acoustic emission signal analysis. Constr. Build. Mater. 2013, 45, 78–86. [Google Scholar] [CrossRef]
  20. Soulioti, D.; Barkoula, N.M.; Paipetis, A.; Matikas, T.E.; Shiotani, T.; Aggelis, D.G. Acoustic emission behavior of steel fibre reinforced concrete under bending. Constr. Build. Mater. 2009, 23, 3532–3536. [Google Scholar] [CrossRef]
  21. Watanab, K.; Niwa, J.; Iwanami, M.; Yokota, H. Localized failure of concrete in compression identified by AE method. Constr. Build. Mater. 2004, 18, 189–196. [Google Scholar] [CrossRef]
  22. Yuyama, S.; Ohtsu, M. Acoustic Emission evaluation in concrete. In Acoustic Emission-Beyond the Millennium; Kishi, T., Ohtsu, M., Yuyama, S., Eds.; Elsevier: Amsterdam, The Netherlands, 2000; pp. 187–213. [Google Scholar]
  23. Ono, K.; Gołaski, L.; Gębski, P. Diagnostic of reinforced concrete bridges by acoustic emission. J. Acoust. Emiss. 2002, 20, 83–98. [Google Scholar]
  24. Parmar, D. Non-Destructive Bridge Testing and Monitoring with Acoustic Emission (AE) Sensor Technology; Final Report; Hampton University: Hampton, VA, USA, 2011. [Google Scholar]
  25. Swit, G. Acoustic Emission Method for Locating and Identifying Active Destructive Processes in Operating Facilities. Appl. Sci. 2018, 8, 1295. [Google Scholar] [CrossRef]
  26. Anay, R.; Soltangharaei, V.; Assi, L.; DeVol, T.; Ziehl, P. Identification of damage mechanisms in cement paste based on acoustic emission. Constr. Build. Mater. 2018, 164, 286–296. [Google Scholar] [CrossRef]
  27. Ai, Q.; Liu, C.C.; Chen, X.R.; He, P.; Wang, Y. Acoustic emission of fatigue crack in pressure pipe under cyclic pressure. Nucl. Eng. Des. 2010, 240, 3616–3620. [Google Scholar] [CrossRef]
  28. Nitka, M.; Magdalena, R. 3D DEM modelling of acoustic emission in concrete: Insights into elastic waves initiated by microcracks. Ultrasonics 2025, 150, 107599. [Google Scholar] [CrossRef] [PubMed]
  29. Knak, M.; Nitka, M.; Rucka, M. Discrete element method modelling of elastic wave propagation in a meso-scale model of concrete. Ultrasonics 2024, 141, 107336. [Google Scholar] [CrossRef] [PubMed]
  30. Ohno, K.; Ohtsu, M. Crack classification in concrete based on acoustic emission. Constr. Build. Mater. 2010, 24, 2339–2346. [Google Scholar] [CrossRef]
  31. Granger, S.; Pijaudier, G.; Loukili, A.; Marlot, D.; Lenain, J.C. Monitoring of cracking and healing in an ultra high performance cementitious material using the time reversal technique. Cem. Concr. Res. 2009, 39, 296–302. [Google Scholar] [CrossRef]
  32. Ohtsu, M. Elastic wave methods for NDE in concrete based on generalized theory of acoustic emission. Constr. Build. Mater. 2016, 122, 845–855. [Google Scholar] [CrossRef]
  33. Seitl, S.; Miarka, P.; Šimonová, H.; Frantík, P.; Keršner, Z.; Domski, J.; Katzer, J. Change of fatigue and mechanical fracture properties of a cement composite due to partial replacement of aggregate by red ceramic waste. Period. Polytech.-Civ. Eng. 2019, 1, 152–159. [Google Scholar] [CrossRef]
  34. Tsangouri, E.; Michels, L.; El Kadi, M.; Tysmans, T.; Aggelis, D.G. A fundamental investigation of textile reinforced cementitious composites tensile response by Acoustic Emission. Cem. Concr. Res. 2019, 123, 105776. [Google Scholar] [CrossRef]
  35. Van Steen, C.; Verstrynge, E.; Wevers, M.; Vandewalle, L. Assessing the bond behaviour of corroded smooth and ribbed rebars with acoustic emission monitoring. Cem. Concr. Res. 2019, 120, 176–186. [Google Scholar] [CrossRef]
  36. Ren, Q.; Nan, Z.; Guan, J.; Yang, L. Damage evolution of basalt fiber-reinforced ultra-rapid hardening concrete based on acoustic emission monitoring. Constr. Build. Mater. 2025, 501, 144331. [Google Scholar] [CrossRef]
  37. Logoń, D. Identification of the destruction process in quasi brittle concrete with dispersed fibres based on acoustic emission and acoustic spectrum. Materials 2019, 12, 2266. [Google Scholar] [CrossRef] [PubMed]
  38. Logoń, D. The application of acoustic emission to diagnose the destruction process in FSD cement composites. In Proceedings of the International Symposium on Brittle Matrix Composites BMC-11, Warsaw, Poland, 28–30 September 2015; Brandt, A.M., Ed.; Institute of Fundamental Technological Research: Warsaw, Poland, 2015; pp. 299–308. [Google Scholar]
  39. Logoń, D.; Schabowicz, K. The recognition of the micro-events in cement composites and the identification of the destruction process using acoustic emission and acoustic spectrum. Materials 2020, 13, 2988. [Google Scholar] [CrossRef] [PubMed]
  40. Logoń, D.; Schabowicz, K. The increase in the elastic range and strengthening control of quasi brittle cement composites by low-module dispersed reinforcement—The assessment of reinforcement effects. Materials 2021, 14, 341. [Google Scholar] [CrossRef] [PubMed]
  41. Ashraf, S.; Rucka, M. Microcrack monitoring and fracture evolution of polyolefin and steel fibre concrete beams using integrated acoustic emission and digital image correlation techniques. Constr. Build. Mater. 2023, 395, 132306. [Google Scholar] [CrossRef]
  42. Xue, Y.; Li, X.; Wang, L.; Liu, Y.; Cao, X.; Zhang, Y. Mesoscopic damage enhancement in granite under cyclic liquid nitrogen shocks characterized by computed tomography and texture analysis. Int. J. Rock Mech. Min. Sci. 2025, 194, 106217. [Google Scholar] [CrossRef]
  43. Rucka, M.; Knak, M.; Nitka, M. A study on microcrack monitoring in concrete: Discrete element method simulations of acoustic emission for non-destructive diagnostics. Eng. Fract. Mech. 2023, 293, 109718. [Google Scholar] [CrossRef]
  44. Lin, H.; Jiang, Y.; Li, S.; Li, W.; Zhu, D.; Chen, J.; Teng, T.; Xue, Y.; Cao, Z. In Situ Study on High-Temperature Performance and Structural Deterioration Mechanism of Concrete. Processes 2026, 14, 1753. [Google Scholar] [CrossRef]
  45. Logoń, D.; Juraszek, J.; Keršner, Z.; Frantic, P. The range of micro-events preceding the critical point in the destruction process in traditional and quasi-brittle cement composites with the use of acoustic spectrum. Materials 2021, 14, 1809. [Google Scholar] [CrossRef] [PubMed]
  46. Shi, J.; Li, H.; Zhang, N.; Liu, Y.; Li, Z. Experimental investigation on buckling behaviour of rectangular concrete-filled steel tube panel based on three-dimensional digital image correlation and acoustic emission. Eng. Struct. 2026, 361, 122932. [Google Scholar] [CrossRef]
  47. Chen, L.; Chen, X.; Xiong, Z.; Lu, K.; Liu, Z. Damage evolution analysis of macro-synthetic fiber reinforced rubber concrete under uniaxial compression using acoustic emission technique. J. Build. Eng. 2026, 118, 114968. [Google Scholar] [CrossRef]
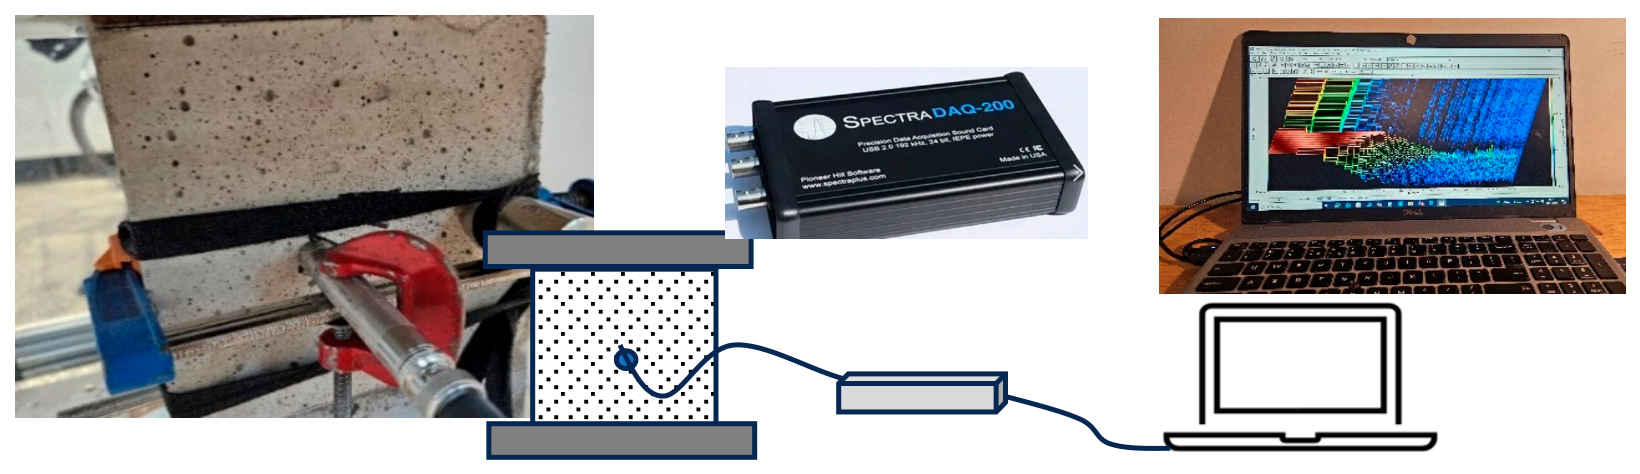
Figure 1. Acoustic effects measurement.
Materials 19 03331 g001
Figure 2. Load–displacement curve of fiber-reinforced cement composites.
Materials 19 03331 g002
Figure 3. Load–displacement curves of concrete under compressive strength test.
Materials 19 03331 g003
Figure 4. Acoustic spectrum 3D—1/M1 sample during compression test.
Materials 19 03331 g004
Figure 5. Acoustic spectrum 3D—2/M2 sample during compression test.
Materials 19 03331 g005
Figure 6. Acoustic spectrum 3D—2/M1 sample during compressive test.
Materials 19 03331 g006
Figure 7. Acoustic spectrum 3D—3/M1 sample during compressive test.
Materials 19 03331 g007
Figure 8. Acoustic spectrum diagram 3D—identification of fcr and fmax in cement composites under load.
Materials 19 03331 g008
Table 1. Microphones used for acoustic measurements.
MicrophoneSensitivityDynamic RangeFrequency Range
M1–Gras 46AZ50 mV/pa17 dB(A)–138 dB re20 mPa0.5 Hz–20 kHz
M2–Gras 46BE3.6 mV/pa35 dB(A)–160 dB re20 mPa4 Hz–70 kHz
Table 2. Tested samples.
SymbolMicrophoneFiber Volume
1/M1M110 kg/m3
2/M1M115 kg/m3
2/M2M215 kg/m3
3/M1M117 kg/m3
Table 3. The mechanical properties of concrete in the compressive strength test.
SpecimenFcr
[kN]
dcr
[mm]
fcr
[MPa]
Fmax
[kN]
dmax
[mm]
fmax
[MPa]
tgα
[kN/mm]
dS
[mm]
WS
[J]
tS
[s]
1/M110011.96344.511922.97553.05101.012125617.0
2/M111651.64951.813622.32160.57060.67296517.4
2/M212031.67553.513952.21262.07180.53779917.0
3/M112751.57256.713611.88160.58110.3094717.6
Disclaimer/Publisher’s Note: The statements, opinions and data contained in all publications are solely those of the individual author(s) and contributor(s) and not of MDPI and/or the editor(s). MDPI and/or the editor(s) disclaim responsibility for any injury to people or property resulting from any ideas, methods, instructions or products referred to in the content.