Influence of Water Source Quality on Concrete Performance: A Mechanism-Based Systematic Review and Engineering Evaluation Framework

 ,
,  , and
, and
Abstract
1. Introduction
2. Review Methodology
2.1. Review Design
2.2. Search Strategies and Study Selection
2.3. Data Extraction and Eligibility Assessment
2.4. Data Analysis
3. Literature Characteristics and Testing Approaches
3.1. Research Trends and Keyword Analysis
3.2. Water Quality Parameters

| Water Source Category | Reference | Specific Water Source | TDS (mg/L) | TSS (mg/L) | Alkalinity (mg/L) | pH | Sulfate (mg/L) | Chloride (mg/L) | Temp (°C) | Turbidity (NTU) | Conductivity (µS/cm) | COD (mg/L) | BOD (mg/L) | Hardness (mg/L) |
|---|---|---|---|---|---|---|---|---|---|---|---|---|---|---|
| [42] | Bore water | 269 | 10 | 302 | 7.5 | 0 | 70.9 | — | 0.01 | 148 | 6 | 1 | 138 | |
| Potable/Control Water Sources | [43] | Tap water | 530.4 | — | 115 | 8 | 104 | 125 | 25 | — | 764 | — | — | 196 |
| [44] | Tap water | 100–450 | 4 | — | 7.9–8.5 | — | — | — | <5 | — | 0 | 0 | — | |
| [45] | Well Water | 454 | — | — | 7.3 | 117 | 106 | — | — | 709 | — | — | — | |
| [46] | Distilled water | 98 | — | — | 7 | 45 | 0.5 | — | 0 | — | 0 | 0 | — | |
| [46] | Tap water | 145 | — | — | 7 | 52 | 0.1 | — | 1 | — | 0 | 0 | — | |
| [47] | Tap water | 806 | 0 | — | 7.6 | 115.3 | 134.7 | — | — | — | 0 | 0 | — | |
| [48] | Tap water | 806 | 0 | — | 7.6 | 115.3 | 134.7 | — | — | 1.26 dS/m | 0 | 0 | 385 | |
| [49] | Tap water | — | — | — | 7.1 | 9 | 18.3 | — | — | — | — | — | — | |
| [50] | Drinking water | — | — | Trace | 8.2 | 40.8 | 150 | — | — | — | — | — | — | |
| [51] | Domestic water | — | 28 | — | 7.03 | 45.5 | 24.91 | — | — | — | — | — | — | |
| [52] | Tap water | — | — | — | 8.16 | — | 484.8 | — | 0.1 | — | — | — | — | |
| [52] | Potable water | — | 17.2 | 58 | 6.6 | 3 | 2.5 | 24.5 | 4.73 | — | 114 | — | — | |
| [52] | Drinking water | — | 90 | — | 7.8 | — | — | — | — | 139.9 µS/cm | — | — | — | |
| [53] | Potable water | — | 121 | — | 7.2 | 50 | 94 | 25 | 2 | 193 | 412 | 0 | 3 | |
| [54] | Potable water | — | — | — | — | 42.4 | 21 | — | — | — | — | — | — | |
| Treated Wastewater and Effluents | [42] | Treated wastewater | 1110 | 21.33 | 252 | 7.27 | 170.7 | 175 | — | 5.92 | 1191 | 72 | 43.5 | 190 |
| [42] | Polished filtered wastewater | 1110 | 11 | 250 | 7.26 | 162 | 166 | — | 4.56 | 1196 | 52 | 32 | 166 | |
| [55] | STP-1 effluent | 360 | 80 | 112 | 7.9 | — | 74.98 | 26.5 | 7.6 | — | — | — | — | |
| [55] | STP-2 effluent | 190 | 90 | 168 | 7.9 | — | 64.98 | 26.4 | 7.6 | — | — | — | — | |
| [44] | Recycled wastewater | 1500 | 50 | — | 6–9 | — | — | — | 75 | — | 100 | 50 | — | |
| [56] | Treatment wastewater | — | — | — | — | 62 | 93 | — | — | — | — | — | — | |
| [52] | Secondary treated wastewater | — | — | — | 7.48 | — | 269.91 | — | 0.305 | 1.59 mS/cm | — | — | 20 | |
| [52] | Tertiary treated wastewater | — | — | — | 7 | — | 257.92 | — | 0.586 | 1.59 mS/cm | — | — | 14 | |
| [52] | Treated wastewater B | — | 574 | — | 8.2 | — | — | — | — | 927 µS/cm | — | — | — | |
| [52] | Treated wastewater A | — | 1161 | — | 7.3 | — | — | — | — | 1757 µS/cm | — | — | — | |
| [53] | Treated effluent | 373.33 | — | — | 6.65 | 8.3 | 100.64 | — | — | — | 231.11 | 72 | 27 | |
| [53] | Polished effluent | 356 | — | — | 7.78 | 10.3 | 99.99 | — | — | — | 360 | 51.2 | 17.33 | |
| [53] | Treated wastewater | — | 25 | — | 7.92 | 80 | 1230 | 17 | 10 | 3950 | 1870 | 150 | 114 | |
| Greywater | [57] | Raw greywater | 980 | 436 | — | 7.5 | 222 | 243 | — | — | — | 900 | 536 | — |
| [57] | Treated greywater | 803 | 2 | — | 7.9 | 137 | 208 | — | — | — | 6.97 | 2.98 | — | |
| [48] | Greywater | 1184 | 80 | — | 7.9 | 153.7 | 269.5 | — | — | 1.85 dS/m | 310 | 196 | 610 | |
| Raw Domestic/Municipal Wastewater | [46] | Wastewater | 1580 | — | — | 7.2 | 198 | 32 | — | 182 | — | 325 | 200 | — |
| [56] | Raw wastewater | — | — | — | — | 48 | 90 | — | — | — | — | — | — | |
| [49] | Raw wastewater | — | — | — | 12.1 | 16.2 | 237.1 | — | — | — | — | — | — | |
| [50] | Sewage water | — | 270 | 598 | 10.2 | 132.4 | 210 | — | — | — | — | — | — | |
| [53] | Raw sewage | 545.83 | — | — | 6.48 | 7.7 | 109.84 | — | — | — | 373.33 | 449.09 | 352 | |
| [53] | Primary wastewater | — | 451 | — | 7.68 | 145 | 740 | 17–19 | 800 | 4120 | 2541 | 3215 | 1240 | |
| [54] | Primary clarifier effluent | — | — | — | — | 55.3 | 96.1 | — | — | — | — | — | — | |
| [54] | Bar screen effluent | — | — | — | — | 55.3 | 116.9 | — | — | — | — | — | — | |
| Industrial Wastewater | [43] | Wash water | 2500 | — | 835 | 11.36 | 320 | 125 | 23.5 | 690 | — | 48 | 23.6 | 750 |
| [45] | Raw waste wash water | 7097 | 123,400 | — | 12.6 | <5.0 | 49.7 | — | — | 11,854 | 3216 | 714 | — | |
| [45] | Filtered WWW | 2420 | — | — | 12.7 | 14.7 | 77.7 | — | — | 10,190 | 48.7 | 13.4 | — | |
| [45] | Filtered neutralized WWW | 1493 | — | — | 7.2 | — | — | — | — | 1533 | 39.5 | 10.9 | — | |
| [47] | Treated industrial wastewater | 1638 | 30 | — | 8.5 | 288.2 | 340.4 | — | — | — | 350 | 99 | — | |
| [48] | Coal mining wastewater | — | — | — | 8.9 | 12.6 | — | — | 91 | 1656 | — | — | — | |
| [58] | Oil & gas produced water | — | — | — | 6.71 | 126.16 | 230,202.06 | — | — | — | — | — | — | |
| [59] | Treated distillery wastewater | — | — | — | 7.5 | — | — | — | — | — | — | 42,565 | 11,337 | |
| Natural Water Sources | [46] | River water | 510 | — | — | 8 | 250 | 45 | — | 4 | — | 80 | 35 | — |
| [46] | Lake water | 612 | — | — | 7.5 | 300 | 40 | — | 4.5 | — | 90 | 40 | — | |
| [50] | Groundwater | — | — | Trace | 6.6 | 75.2 | 175 | — | — | — | — | — | — | |
| [52] | Deep well water | — | 16.8 | 32 | 6.5 | 6 | 27.5 | 24.7 | 3.83 | — | 240 | — | — | |
| [52] | Rainwater | — | 17.2 | 30 | 6.4 | 15 | 8.75 | 24.4 | 10.42 | — | 150 | — | — | |
| [52] | River water | — | 36.4 | 62 | 6.75 | 7 | 3.75 | 24.8 | 4.48 | — | 116 | — | — | |
| [60] | River water | — | — | — | 8 | — | — | 25 | — | — | — | — | — | |
| [56] | Sludge wastewater | — | — | — | — | 89.33 | 129 | — | — | — | — | — | — | |
| Combined Water | [47] | Combined water | 1222 | 15 | — | 8.1 | 201.7 | 237.6 | — | — | — | 175 | 49.5 | — |
| [48] | Combined water | 995 | 40 | — | 7.8 | 134.5 | 202.1 | — | — | 1.56 dS/m | 155 | 98 | 497.5 | |
| Recycled Water | [51] | Recycled water CH1 | — | 52,360 | — | 7.73 | 54.28 | 30.88 | — | — | — | — | — | — |
| [51] | Recycled water CH2 | — | 23,160 | — | 7.48 | 57.22 | 24.11 | — | — | — | — | — | — | |
| [51] | Recycled water CH3 | — | 9446 | — | 7.68 | 47.23 | 27.84 | — | — | — | — | — | — | |
| [51] | Recycled water CH4 | — | 6235 | — | 7.65 | 44.54 | 28.2 | — | — | — | — | — | — | |
| [51] | Recycled water CH5 | — | 1854 | — | 7.88 | 50.92 | 22.92 | — | — | — | — | — | — | |
| [51] | Recycled water CH6 | — | 200 | — | 7.6 | 44.3 | 28.15 | — | — | — | — | — | — | |
| Concrete Plant Wastewater | [61] | Concrete truck wash wastewater | — | — | — | 12.86 | 149.6 | 16 | — | — | — | — | — | — |
| [62] | Ready-mixed concrete plant wastewater | 121,210 | — | — | 12 | 34 | 78 | — | — | — | 391 | — | — |
3.3. Experimental Testing Approaches Reported in the Literature
4. Effects of Water Quality on Concrete Performance
4.1. Water Quality Effects on Concrete
4.1.1. Workability
4.1.2. Setting Time
4.1.3. Compressive Strength
4.1.4. Tensile and Flexural Strength
4.2. Mechanistic Interpretation of Water Quality Effects
4.3. Classification of Water Quality Regimes and Performance Implications
5. Integrated Interpretation and Comparative Analysis
5.1. Comparative Study Findings
5.2. Quantitative Synthesis
6. Engineering Evaluation Framework for Water Quality in Concrete
7. Research Synthesis, Practical Applicability, and Research Trends
7.1. Research Synthesis and Identified Gaps
7.2. Research Trends and Bibliometric Evidence
7.3. Recommendations for Future Research
8. Conclusions
- The most critical water quality parameters influencing concrete performance are pH, total dissolved solids (TDS), total suspended solids (TSS), chlorides, and sulfates, as these directly affect cement hydration, setting behavior, and long-term durability. Across the reviewed studies, acceptable performance is generally observed when pH remains within approximately 6.5–8.5, while TDS values below 2000 mg/L are commonly associated with stable hydration behavior. Higher impurity levels, particularly chloride concentrations exceeding ~600 mg/L and sulfate concentrations above 1000 mg/L, are frequently linked to increased porosity, delayed or accelerated hydration, and potential durability risks.
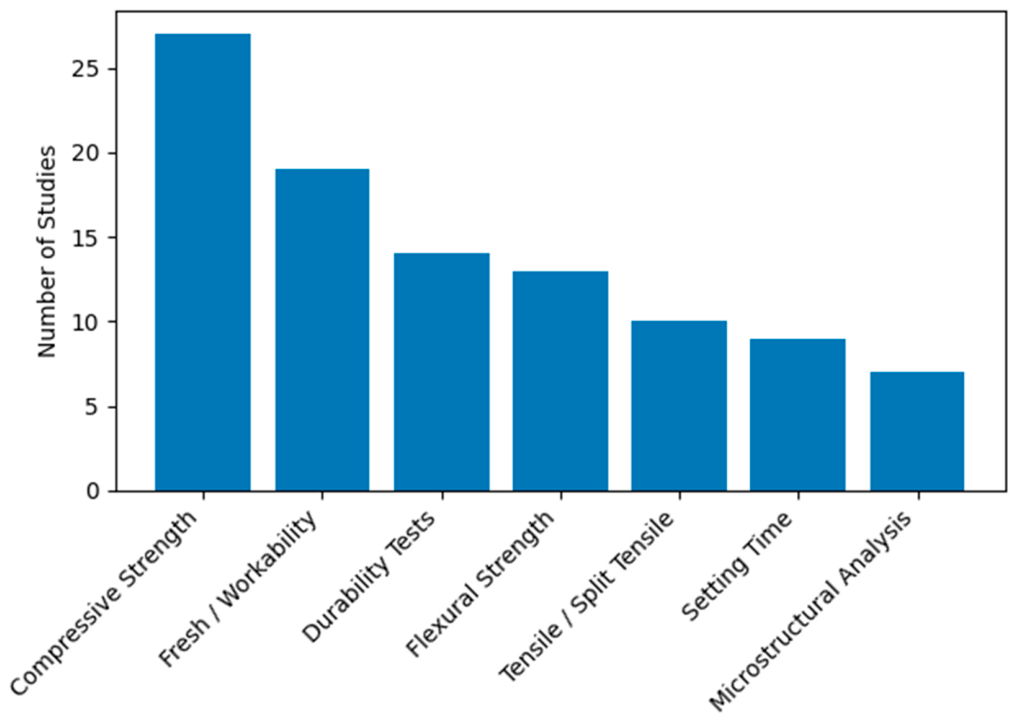
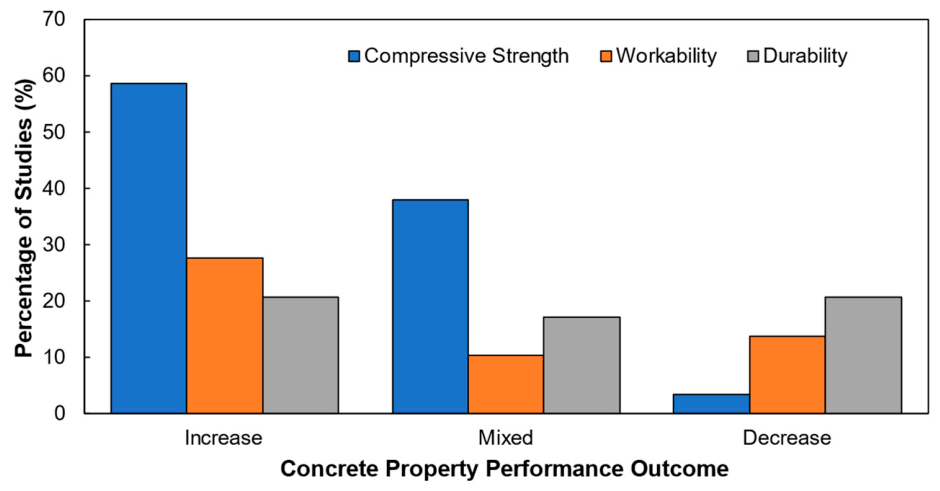
- Compressive strength remains the most widely used indicator for evaluating the suitability of alternative water sources, with 27 out of 38 reviewed studies employing compressive strength testing as the primary performance metric. Most studies report comparable or improved strength when water quality is properly controlled, with variations typically ranging from −10% to +15% relative to control mixtures. In some cases, strength increases of up to 79% were reported under optimized conditions, while untreated or highly contaminated water sources resulted in reductions of up to 5–33%.
- Fresh properties and durability-related performance are more sensitive to variations in water quality than compressive strength. Reported results indicate slump reductions ranging from 20% to 30%, particularly in mixtures containing higher concentrations of suspended solids or dissolved salts. Setting time variations range from ±20–25 min under typical conditions to extreme delays exceeding 10 h in cases involving highly contaminated or recycled water. Durability-related indicators, including permeability and resistance to chloride penetration, show greater variability, with some studies reporting acceptable strength despite reductions in long-term durability performance due to increased pore connectivity and transport properties.
- Variations in experimental methods, including differences in water characterization, mixture design, curing conditions, and testing procedures, contribute significantly to inconsistencies in reported results and limit direct comparison across studies. For example, compressive strength differences of up to ~15–20% are often attributed not only to water quality but also to variations in curing regimes and mixture proportions. This highlights the importance of standardized testing protocols and consistent reporting of water quality parameters.
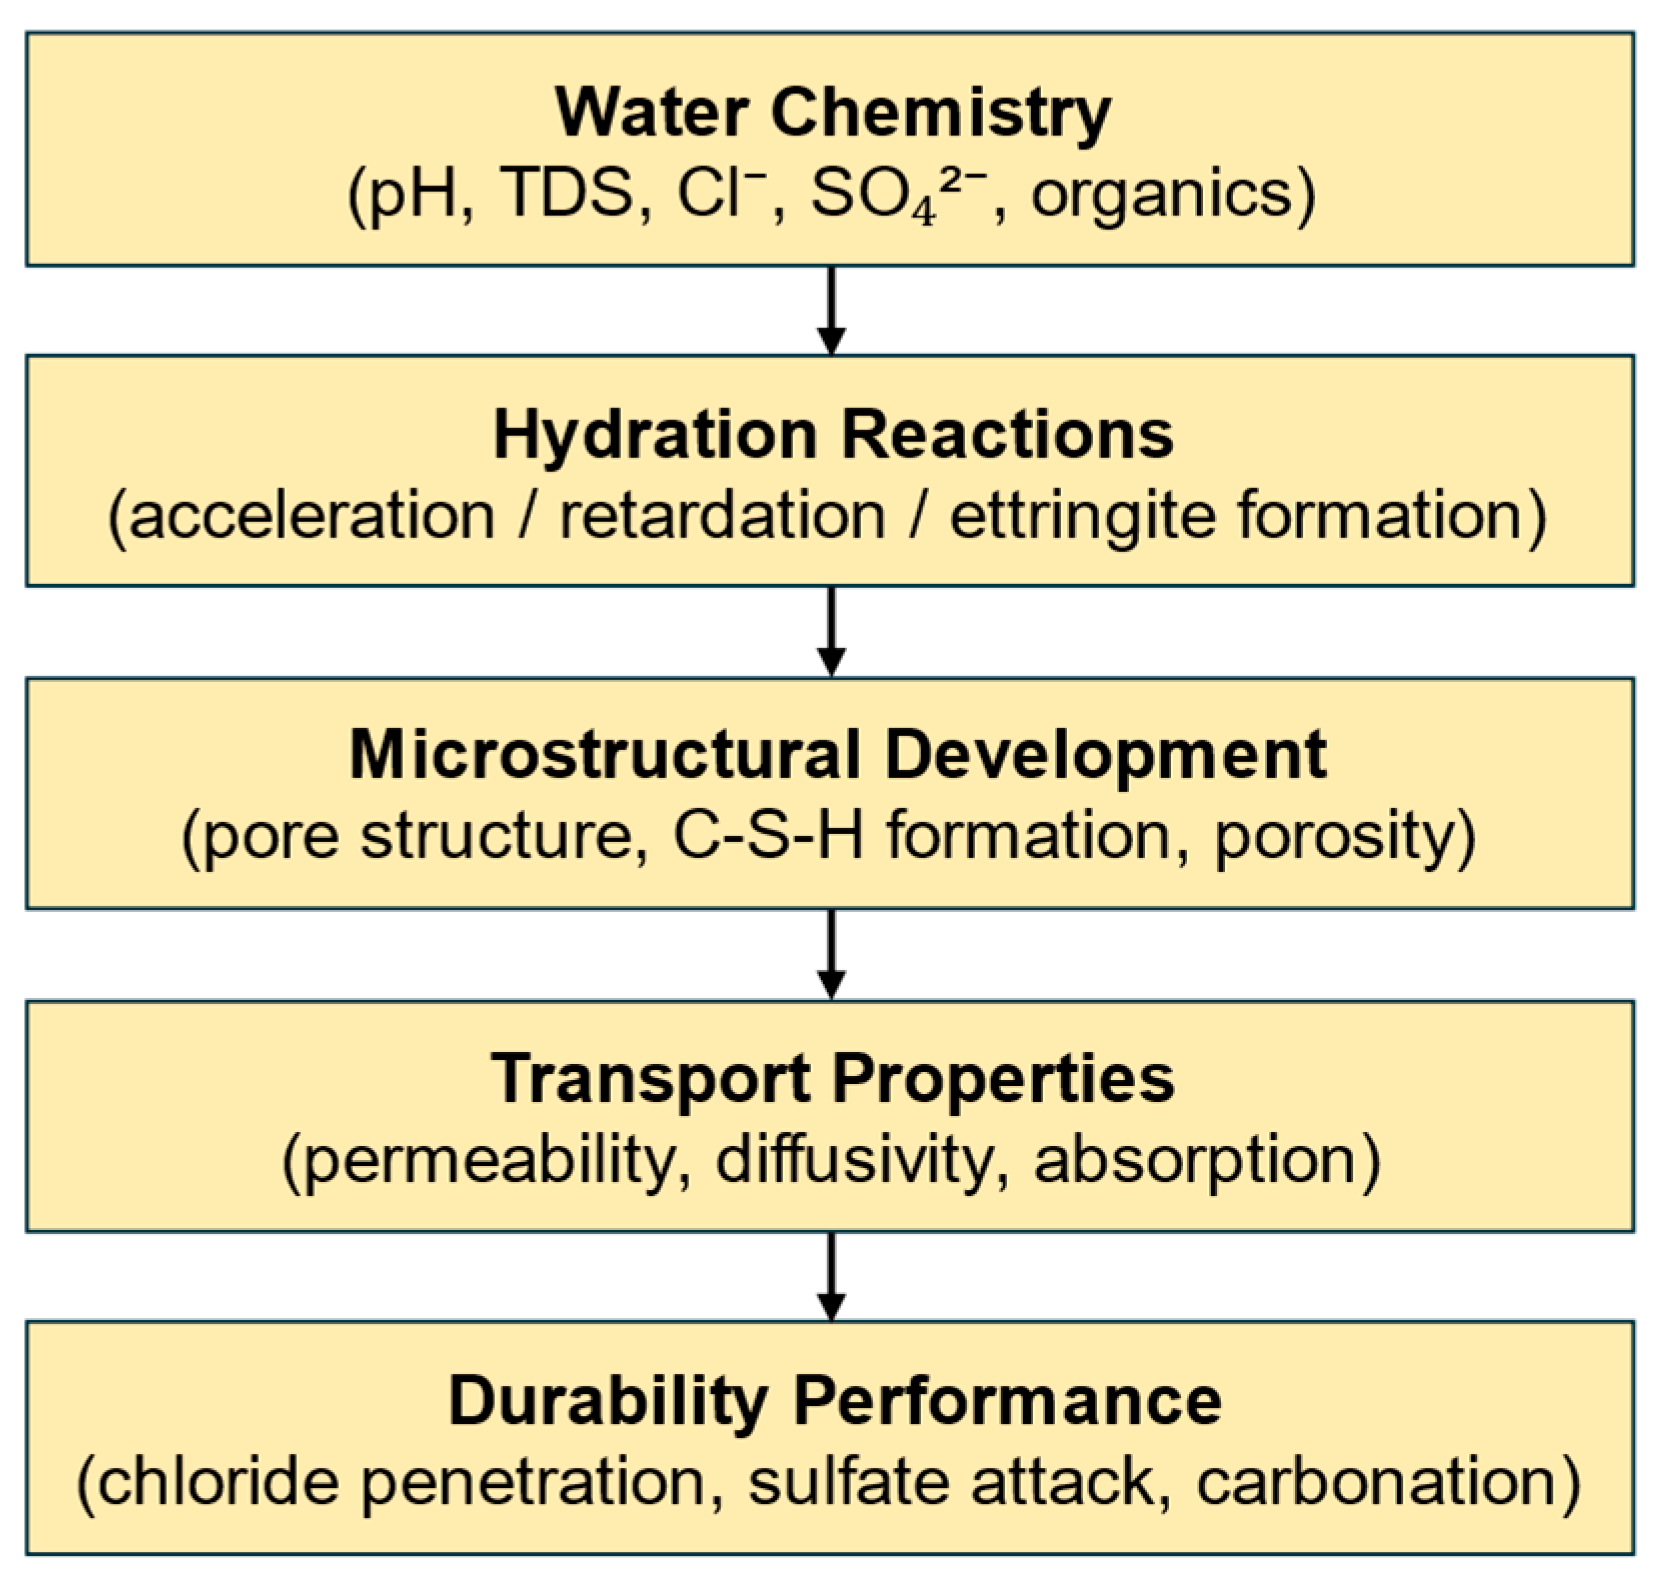
- Despite the growing body of research, the current literature remains predominantly strength-oriented, with only 14 out of 38 studies evaluating durability and fewer than 10 studies incorporating microstructural analysis. This study contributes a mechanism-based framework linking water chemistry to hydration, microstructural development, and durability performance, providing a more comprehensive basis for evaluating alternative water sources beyond compressive strength alone. However, limitations arise from the lack of standardized water quality reporting, variability in experimental conditions, and inconsistent inclusion of durability-related assessments, which restrict direct comparison across studies, while the exclusion of seawater and corrosion-dominated environments limits applicability to non-marine conditions. Future research should focus on standardizing water quality thresholds, expanding long-term durability investigations, and integrating microstructural characterization with mechanical and transport properties to support performance-based evaluation of alternative water sources.
- Future research should therefore address not only the scientific uncertainties identified in the literature but also the practical requirements of industry stakeholders, particularly with respect to standardization, durability assurance, quality control procedures, and the large-scale implementation of alternative water sources in concrete production.
Supplementary Materials
Author Contributions
Funding
Institutional Review Board Statement
Informed Consent Statement
Data Availability Statement
Acknowledgments
Conflicts of Interest
Nomenclature
| Symbol/Abbreviation | Description |
| C | CaO (Calcium oxide) |
| S | SiO2 (Silicon dioxide) |
| A | Al2O3 (Aluminum oxide) |
| F | Fe2O3 (Iron oxide) |
| H | H2O (Water) |
| Ŝ | SO3 (Sulfate) |
| C3S | Tricalcium silicate (3CaO·SiO2) |
| C2S | Dicalcium silicate (2CaO·SiO2) |
| C3A | Tricalcium aluminate (3CaO·Al2O3) |
| C4AF | Tetracalcium aluminoferrite (4CaO·Al2O3·Fe2O3) |
| C–S–H | Calcium silicate hydrate |
| CH | Calcium hydroxide |
| AFt | Ettringite phase |
| AFm | Monosulfate phase |
| TDS | Total dissolved solids |
| TSS | Total suspended solids |
| COD | Chemical oxygen demand |
| BOD | Biological oxygen demand |
| SEM | Scanning electron microscopy |
| XRD | X-ray diffraction |
| TGA | Thermogravimetric analysis |
| ASTM | American Society for Testing and Materials |
| WW | Wastewater |
| NTU | Nephelometric Turbidity Unit |
References
- Robles, K.P.V.; Yee, J.J.; Kee, S.H. Simulation-Based Assessment of the Impact of Internal and Surface-Breaking Cracks on Reinforced Concrete Electrical Resistivity. In Proceedings of the 7th International Conference on Civil Engineering and Architecture; Springer Nature: Singapore, 2025; pp. 11–22. [Google Scholar] [CrossRef]
- Li, M.L.L.; Kee, S.-H.; Monjardin, C.E.F.; Robles, K.P.V. Numerical and Experimental Correlation Between Half-Cell Potential and Steel Mass Loss in Corroded Reinforced Concrete. Materials 2025, 18, 5238. [Google Scholar] [CrossRef] [PubMed]
- Hover, K.C. The Influence of Water on the Performance of Concrete. Constr. Build. Mater. 2011, 25, 3003–3013. [Google Scholar] [CrossRef]
- Aïtcin, P.C. Water and Its Role on Concrete Performance. In Science and Technology of Concrete Admixtures; Woodhead Publishing: Cambridge, UK, 2016; pp. 75–86. [Google Scholar] [CrossRef]
- Al-Jabari, M. Introduction to Concrete Chemistry. In Integral Waterproofing of Concrete Structures: Advanced Protection Technologies of Concrete by Pore Blocking and Lining; Woodhead Publishing: Cambridge, UK, 2022; pp. 1–36. [Google Scholar] [CrossRef]
- Marchon, D.; Flatt, R.J. Mechanisms of Cement Hydration. In Science and Technology of Concrete Admixtures; Woodhead Publishing: Cambridge, UK, 2016; pp. 129–145. [Google Scholar] [CrossRef]
- Chandio, M.A.; Shaikh, S.; Chandio, W.M. The Effect of Different Water Sources on the Quality of Concrete for Infrastructure Projects. Kashf J. Multidiscip. Res. 2024, 1, 27–36. [Google Scholar] [CrossRef]
- Wu, H.C. Re-Examination of Cement Hydration: Sol-Gel Process. Adv. Cem. Res. 2014, 26, 292–301. [Google Scholar] [CrossRef]
- Bentz, D.P. Cement Hydration: Building Bridges and Dams at the Microstructure Level. Mater. Struct. Mater. Constr. 2007, 40, 397–404. [Google Scholar] [CrossRef]
- Suraneni, P.; Flatt, R.J. Micro-Reactors to Study Alite Hydration. J. Am. Ceram. Soc. 2015, 98, 1634–1641. [Google Scholar] [CrossRef]
- Bouaich, F.Z.; Maherzi, W.; El-hajjaji, F.; Abriak, N.E.; Benzerzour, M.; Taleb, M.; Rais, Z. Reuse of Treated Wastewater and Non-Potable Groundwater in the Manufacture of Concrete: Major Challenge of Environmental Preservation. Environ. Sci. Pollut. Res. 2022, 29, 146–157. [Google Scholar] [CrossRef] [PubMed]
- Robles, K.P.V.; Monjardin, C.E.F. Assessment and Monitoring of Groundwater Contaminants in Heavily Urbanized Areas: A Review of Methods and Applications for Philippines. Water 2025, 17, 1903. [Google Scholar] [CrossRef]
- Ahmed, A.; Ahmed, O.; Al-Fakih, A.; Muhit, I.B. A Comprehensive Review on the Use of Reclaimed Wastewater in Cementitious Materials: Fresh, Mechanical, Microstructure, and Durability Aspects. Arab. J. Sci. Eng. 2025, 50, 16263–16295. [Google Scholar] [CrossRef]
- Wang, J.; Xie, J.; Wang, Y.; Liu, Y.; Ding, Y. Rheological Properties, Compressive Strength, Hydration Products and Microstructure of Seawater-Mixed Cement Pastes. Cem. Concr. Compos. 2020, 114, 103770. [Google Scholar] [CrossRef]
- Farid, H.; Mansoor, M.S.; Shah, S.A.R.; Khan, N.M.; Shabbir, R.M.F.; Adnan, M.; Arshad, H.; Haq, I.U.; Waseem, M. Impact Analysis of Water Quality on the Development of Construction Materials. Processes 2019, 7, 579. [Google Scholar] [CrossRef]
- Awoyera, P.O.; Awobayikun, O.; Gobinath, R.; Ugwu, E.I. Rheological, Mineralogical and Strength Variability of Concrete Due to Construction Water Impurities. Int. J. Eng. Res. Afr. 2020, 48, 78–91. [Google Scholar] [CrossRef]
- Kaboosi, K.; Fadavi, M.; Setayesh, E. The Feasibility Study of the Use of Briny Groundwater and Zeolite in the Plain Concrete Mix Design in the Different Cement Contents. Civ. Environ. Eng. 2019, 15, 154–165. [Google Scholar] [CrossRef]
- Wang, X.; Yu, H.; Tan, Y.; Wu, C.; Wu, P.; Ma, H.; Ding, Z.; Liu, L. Mechanical Properties, Corrosion Damage Evolution Laws, and Durability Deterioration Indicators of High-Performance Concrete Exposed to Saline Soil Environment for 8 Years. Materials 2025, 18, 565. [Google Scholar] [CrossRef] [PubMed]
- Li, B.; Mao, J.; Lv, J.; Zhou, L. Effects of Micropore Structure on Hydration Degree and Mechanical Properties of Concrete in Later Curing Age. Eur. J. Environ. Civ. Eng. 2016, 20, 544–559. [Google Scholar] [CrossRef]
- Blouch, N.; Kazmi, S.N.H.; Metwaly, M.; Akram, N.; Mi, J.; Hanif, M.F. Towards Sustainable Construction: Experimental and Machine Learning-Based Analysis of Wastewater-Integrated Concrete Pavers. Sustainability 2025, 17, 6811. [Google Scholar] [CrossRef]
- Çomak, B. Effects of Use of Alkaline Mixing Waters on Engineering Properties of Cement Mortars. Eur. J. Environ. Civ. Eng. 2018, 22, 736–754. [Google Scholar] [CrossRef]
- Ghasemi, S.; Nikudel, M.R.; Zalooli, A.; Khamehchiyan, M.; Alizadeh, A.; Yousefvand, F.; Ghasemi, A.M.R. Durability Assessment of Sulfur Concrete and Portland Concrete in Laboratory Conditions and Marine Environments. J. Mater. Civ. Eng. 2022, 34, 04022167. [Google Scholar] [CrossRef]
- Zhang, H. Advances and Challenges in Concrete Repair Materials: A Review. Adv. Res. 2025, 26, 503–511. [Google Scholar] [CrossRef]
- Agwe, T.M.; Tibenderana, P.; Twesigye-Omwe, M.N.; Mbujje, J.W.; Abdulkadir, S.T. Concrete Production and Curing with Recycled Wastewater: A Review on the Current State of Knowledge and Practice. Adv. Civ. Eng. 2022, 2022, 7193994. [Google Scholar] [CrossRef]
- Azeem, A.; Ahmad, S.; Hanif, A. Wastewater Utilization for Concrete Production: Prospects, Challenges, and Opportunities. J. Build. Eng. 2023, 80, 108078. [Google Scholar] [CrossRef]
- Maddikeari, M.; Das, B.B.; Tangadagi, R.B.; Roy, S.; Nagaraj, P.B.; Ramachandra, M.L. A Comprehensive Review on the Use of Wastewater in the Manufacturing of Concrete: Fostering Sustainability through Recycling. Recycling 2024, 9, 45. [Google Scholar] [CrossRef]
- Nikookar, M.; Brake, N.A.; Adesina, M.; Rahman, A.; Selvaratnam, T. Past, Current, and Future Re-Use of Recycled Non-Potable Water Sources in Concrete Applications to Reduce Freshwater Consumption—A Review. Clean. Mater. 2023, 9, 100203. [Google Scholar] [CrossRef]
- Gokulanathan, V.; Arun, K.; Priyadharshini, P. Fresh and Hardened Properties of Five Non-Potable Water Mixed and Cured Concrete: A Comprehensive Review. Constr. Build. Mater. 2021, 309, 125089. [Google Scholar] [CrossRef]
- Harishbabu, J.; Saboo, N.; Kar, S.S. Use of Non-Potable Water Sources in Pavement Construction: A Review. Constr. Build. Mater. 2024, 411, 134781. [Google Scholar] [CrossRef]
- Reddy Babu, G.; Madhusudana Reddy, B.; Venkata Ramana, N. Quality of Mixing Water in Cement Concrete “a Review”. Mater. Today Proc. 2018, 5, 1313–1320. [Google Scholar] [CrossRef]
- Al-Jabri, K.S.; AL-Saidy, A.H.; Taha, R.; AL-Kemyani, A.J. Effect of Using Wastewater on the Properties of High Strength Concrete. Procedia Eng. 2011, 14, 370–376. [Google Scholar] [CrossRef]
- Asadollahfardi, G.; Asadi, M.; Jafari, H.; Moradi, A.; Asadollahfardi, R. Experimental and Statistical Studies of Using Wash Water from Ready-Mix Concrete Trucks and a Batching Plant in the Production of Fresh Concrete. Constr. Build. Mater. 2015, 98, 305–314. [Google Scholar] [CrossRef]
- Elsayed, K.M.N.I.; Guico, G.B.F.; Rustum, R. Concrete behavior using recycled wastewater. Int. J. GEOMATE 2023, 25, 192–199. [Google Scholar] [CrossRef]
- Ghrair, A.M.; Heath, A.; Paine, K.; Al Kronz, M. Waste Wash-Water Recycling in Ready Mix Concrete Plants. Environments 2020, 7, 108. [Google Scholar] [CrossRef]
- Humood, S.H.; Jassim, F.N.; Sulaiman, E.A.; Al-Gasham, T.S. Effect of Different Types of Water on Workability and Compressive Strength of Concrete. Math. Model. Eng. Probl. 2025, 12, 909–916. [Google Scholar] [CrossRef]
- Kaboosi, K.; Emami, K. Interaction of Treated Industrial Wastewater and Zeolite on Compressive Strength of Plain Concrete in Different Cement Contents and Curing Ages. Case Stud. Constr. Mater. 2019, 11, e00308. [Google Scholar] [CrossRef]
- Kaboosi, K.; Kaboosi, F.; Fadavi, M. Investigation of Greywater and Zeolite Usage in Different Cement Contents on Concrete Compressive Strength and Their Interactions. Ain Shams Eng. J. 2020, 11, 201–211. [Google Scholar] [CrossRef]
- Kim, J.S.; Oh, S.E.; Kim, S.Y.; Pyeon, G.; Maeng, S.; Chung, S.Y. Effects of Treated Wastewater from Recycled Aggregate Processing on the Microstructure and Mechanical Properties of Cement Mortar. Constr. Build. Mater. 2025, 494, 142945. [Google Scholar] [CrossRef]
- Kokoszka, W. Impact of Water Quality on Concrete Mix and Hardened Concrete Parameters. Civ. Environ. Eng. Rep. 2019, 29, 174–182. [Google Scholar] [CrossRef]
- Lu, Q.; Fan, Z.; Zhou, X.; Peng, Z.; Gao, Z.F.; Deng, S.; Han, W.; Jin, Z.; Chen, X. Water-Saving Optimization Design of Aggregate Processing Plant and Recycled Water Utilization for Producing Concrete. Constr. Build. Mater. 2023, 396, 132381. [Google Scholar] [CrossRef]
- Mohe, N.S.; Shewalul, Y.W.; Agon, E.C. Experimental Investigation on Mechanical Properties of Concrete Using Different Sources of Water for Mixing and Curing Concrete. Case Stud. Constr. Mater. 2022, 16, e00959. [Google Scholar] [CrossRef]
- Nasseralshariati, E.; Mohammadzadeh, D.; Karballaeezadeh, N.; Mosavi, A.; Reuter, U.; Saatcioglu, M. The Effect of Incorporating Industrials Wastewater on Durability and Long-Term Strength of Concrete. Materials 2021, 14, 4088. [Google Scholar] [CrossRef] [PubMed]
- Soltanianfard, M.A.; Hojat Jalali, H.; Shah, S.P. Concrete Produced with Wastewater from Early-Stages of Treatment: Performance and Enhancement through Supplementary Cementitious Materials. Constr. Build. Mater. 2025, 471, 140755. [Google Scholar] [CrossRef]
- Chaudhari, R.S. Unlocking Concrete Strength: Empowering Sustainable Practices through Effluent Recycling in Casting and Curing. Mater. Today Proc. 2024, in press. [Google Scholar] [CrossRef]
- Jahandideh, E.; Asadollahfardi, G.; Akbardoost, J.; Salehi, A. The Effect of Chemical Oxygen Demand of Domestic Wastewater on Workability, Mechanical, and Durability of Self- Compacting Concrete. Case Stud. Constr. Mater. 2024, 21, e03374. [Google Scholar] [CrossRef]
- Ghrair, A.M.; Al-Mashaqbeh, O.A.; Sarireh, M.K.; Al-Kouz, N.; Farfoura, M.; Megdal, S.B. Influence of Grey Water on Physical and Mechanical Properties of Mortar and Concrete Mixes. Ain Shams Eng. J. 2018, 9, 1519–1525. [Google Scholar] [CrossRef]
- Nikookar, M.; Brake, N.A.; Asli, H.H.; Adesina, M.; Rahman, A.; Selvaratnam, T.; Bradley, R.K. Durability, Workability, and Setting Time of Cementitious Systems Containing Chloride-Rich Oil and Gas Production Wastewater. Constr. Build. Mater. 2023, 403, 132862. [Google Scholar] [CrossRef]
- Pabale, A.R.; Jadhav, M.V. AI Based Investigation on Concrete Using Distillery Waste as Partial Replacement to Potable Water. In Proceedings of the International Conference on Engineering, Technology and Management, ICETM 2025; Institute of Electrical and Electronics Engineers Inc.: Piscataway, NJ, USA, 2025. [Google Scholar]
- Morfe, R. Comparative study of concrete compressive strength using potable and river water with multiple linear regression prediction. Int. J. GEOMATE 2025, 29, 58–67. [Google Scholar] [CrossRef]
- Tsardaka, E.C.; Anastasiou, E.K.; Karanafti, A.; Ferriz-Papi, J.A.; Valentin, J.; Theodosiou, T. Influence of Cement Type on the Performance and Durability of Cement Paste and Concrete with Wastewater. Materials 2026, 19, 435. [Google Scholar] [CrossRef] [PubMed]
- Ahmed, S.; Alhoubi, Y.; Elmesalami, N.; Yehia, S.; Abed, F. Effect of Recycled Aggregates and Treated Wastewater on Concrete Subjected to Different Exposure Conditions. Constr. Build. Mater. 2021, 266, 120930. [Google Scholar] [CrossRef]
- Arooj, M.F.; Haseeb, F.; Butt, A.I.; Irfan-Ul-Hassan, D.M.; Batool, H.; Kibria, S.; Javed, Z.; Nawaz, H.; Asif, S. A Sustainable Approach to Reuse of Treated Domestic Wastewater in Construction Incorporating Admixtures. J. Build. Eng. 2021, 33, 101616. [Google Scholar] [CrossRef]
- Morgado, J.; Rosales, J.; de Brito, J.; Mendes, M.P.; Machini, B.; Bravo, M. Performance of Concrete with Treated Wastewater and Recycled Aggregates. J. Build. Eng. 2024, 98, 111343. [Google Scholar] [CrossRef]
- Naik, P.A.; Udayakumar, G.; Rao, C.V.; Marathe, S. Influence of STP Treated and Reed Bed Treated Domestic Wastewater on Properties of Mortar and Concrete Mixes. Int. J. Eng. Trends Technol. 2020, 68, 24–29. [Google Scholar] [CrossRef]
- Kısa, K.O.; Ülger, T.; Cavuslu, M. Utilization of Coal Mining Wastewater in Concrete Production: Experimental and Finite Element Simulation of Flexural Performance in Reinforced Concrete Beams. Structures 2025, 80, 109941. [Google Scholar] [CrossRef]
- Meena, K.; Luhar, S. Effect of Wastewater on Properties of Concrete. J. Build. Eng. 2019, 21, 106–112. [Google Scholar] [CrossRef]
- Yao, X.; Xi, J.; Guan, J.; Liu, L.; Shangguan, L.; Xu, Z. A Review of Research on Mechanical Properties and Durability of Concrete Mixed with Wastewater from Ready-Mixed Concrete Plant. Materials 2022, 15, 1386. [Google Scholar] [CrossRef] [PubMed]
- Civil Engicon Team Concrete Workability: Key Factors, Effects & How to Improve It for Stronger Structures. Available online: https://www.civilengicon.com/2023/10/workability-of-concrete-types-factors.html (accessed on 15 March 2026).
- Sheikh Hassani, M.; Matos, J.C.; Zhang, Y.X.; Teixeira, E. Concrete Production with Domestic and Industrial Wastewaters—A Literature Review. Struct. Concr. 2023, 24, 5582–5599. [Google Scholar] [CrossRef]
- Yao, X.; Xu, Z.; Guan, J.; Liu, L.; Shangguan, L.; Xi, J. Influence of Wastewater Content on Mechanical Properties, Microstructure, and Durability of Concrete. Buildings 2022, 12, 1343. [Google Scholar] [CrossRef]
- Aldayel Aldossary, M.H.; Ahmad, S.; Bahraq, A.A. Effect of Total Dissolved Solids-Contaminated Water on the Properties of Concrete. J. Build. Eng. 2020, 32, 101496. [Google Scholar] [CrossRef]
- Dey, G.; Ganguli, A.; Bhattacharjee, B. Estimation of Degree of Moisture Saturation in Cement Concrete Using Electrical Response at Low Radio Frequencies. In Proceedings of the NDE 2019—Conference & Exhibition, Bengaluru, India, 5–7 December 2019; Available online: http://www.ndt.net/?id=25723 (accessed on 30 June 2026).
- Jan, F.; Min-Allah, N.; Düştegör, D. Iot Based Smart Water Quality Monitoring: Recent Techniques, Trends and Challenges for Domestic Applications. Water 2021, 13, 1729. [Google Scholar] [CrossRef]
- Vandegrift, J.; Hooper, J.; da Silva, A.; Bell, K.; Snyder, S.; Rock, C.M. Overview of Monitoring Techniques for Evaluating Water Quality at Potable Reuse Treatment Facilities. J. Am. Water Works Assoc. 2019, 111, 12–23. [Google Scholar] [CrossRef] [PubMed]
- Tong, P.; Wang, Y.; Wang, M.; Zhang, X.; Su, H.; Li, Z.; Zhou, S.; Zhao, C.; Zhang, X.; Zhang, J. Synergistic Effects of Sulfate, Magnesium, and Bicarbonate Ions in Mine Water on the Hydration, Microstructure, and Long-Term Durability of Portland Cement Paste. Miner. Eng. 2026, 235, 109867. [Google Scholar] [CrossRef]
- Sun, M.; Yu, R.; Jiang, C.; Fan, D.; Shui, Z. Quantitative Effect of Seawater on the Hydration Kinetics and Microstructure Development of Ultra High Performance Concrete (UHPC). Constr. Build. Mater. 2022, 340, 127733. [Google Scholar] [CrossRef]
- Galan, I.; Perron, L.; Glasser, F.P. Impact of Chloride-Rich Environments on Cement Paste Mineralogy. Cem. Concr. Res. 2015, 68, 174–183. [Google Scholar] [CrossRef]


| Database | Filters Applied | Results Retrieved | Full Search String |
|---|---|---|---|
| Web of Science | 50 | (“mixing water” OR “water quality” OR “water source quality”) AND concrete AND (durability OR “mechanical properties” OR strength OR workability) | |
| IEEE | 2016–2026 Engineering Material science Has PDF | 15 | (“water quality” OR “mixing water”) AND (concrete) AND (cement) AND (strength) AND (durability) AND (workability) AND (wastewater) |
| Scopus | 2016–2026 Engineering Material science | 29 | (“water quality” AND concrete AND cement AND “mixing water” AND strength AND durability AND workability AND wastewater) |
| Science Direct | 2016–2026 Engineering Material science | 43 | “water quality” AND concrete AND cement AND “mixing water” AND strength AND durability AND workability AND wastewater |
| PubMed | 2016–2026 | 38 | (“water source quality” OR “water quality” OR “wastewater”) AND (concrete OR cement) AND (durability OR workability) |
| Score | Level of Relevance | Criteria Description |
|---|---|---|
| 5 | Very High | Provides detailed analysis of measurable water quality parameters and their effects on concrete performance. |
| 4 | High | Examines water quality effects on concrete performance with limited analysis. |
| 3 | Moderate | Discusses water use in concrete, but water quality is not the main focus. |
| 2 | Low | Mentions water quality without clear relationship to concrete performance. |
| 1 | Very Low | Provides background information without analyzing the impact of water quality on concrete performance. |
| Water Source Category | Reference | Mixing Water | Slump/ Workability | Setting Time | Compressive Strength | Tensile Strength | Flexural Strength | % WW in Mixing Water |
|---|---|---|---|---|---|---|---|---|
| Potable/Control Water Source | [50] | Drinking water, Groundwater, Sewage water | 117–139 mm slump | – | Sewage water −25–33% vs. potable water | – | – | – |
| [51] | Domestic water, Recycled water | 45–52 mm slump | Initial set 11 h 54 min–20 h 45 min | 21.8–24.1 MPa at 28 days | – | – | – | |
| [52] | Potable, River, Rainwater | 10–25 mm slump | Initial 168–193 min | River water 97.6%, deep well water 91.1%, rainwater 83.7% of control | Slight reduction | Slight reduction | – | |
| Treated Wastewater and Effluents | [55] | Potable water and STP-treated effluent (E1, E2) | – | Initial setting 30–35 min, final setting 180–200 min (within IS limits) | Maximum 34.79 MPa (28 days) when potable water used for casting | – | – | Effluent used for casting and/or curing combinations (0–100%) |
| [44] | Tap water and tertiary treated wastewater (Jebel Ali STP) | Slump decreased from 65 mm (tap water) to 46 mm (tertiary treated wastewater) (~29% decrease) | – | 18.5 MPa (tap water) vs. 24.62 MPa (tap mix + WW curing); 14 days: up to 37.3 MPa; 21 days: up to 40.5 MPa (≈33–70% increase depending on water use) | 2.83 MPa (tap) → 2.93 MPa (WW mix) (~4.2% increase at 28 days) | 4.2 MPa (tap) → 3.8 MPa (WW mix) (~8% decrease at 28 days) | 0–100% wastewater (mixing and/or curing) | |
| [56] | Raw wastewater, Treated wastewater | Slump flow similar to control | – | Early strength −32–35%, ≈control at 90 days | ≤10% reduction | ≤18–20% reduction | – | |
| [49] | Tap water, Treated wastewater | – | – | −15% to +8% vs. control depending on treatment | – | – | – | |
| [62] | Tap water, Treated wastewater | Lower slump with treated wastewater | Initial set ~3.5 min later | 62–71 MPa (28 d), 66–77 MPa (150 d) | ≥3 MPa (reduced under long exposure) | – | 100% | |
| [63] | Bore water, Treated domestic wastewater, Polished filtered wastewater | Slump ≈ 4–5 in (100–125 mm) for all mixes | Not significantly reported | ~15% lower compressive strength at 28 days | 20–25% higher tensile strength for treated and polished wastewater compared with bore water | Flexural strength ≈ similar to bore water (difference < 2 MPa) | 100% replacement tested | |
| [63] | Tap water, Treated wastewater | 80 mm (tap), 60 mm (tertiary WW), 40 mm (secondary WW) | – | 85–94% of control strength | – | −7.7–13.1% | 100% | |
| [64] | Drinking water, Treated wastewater | 150–190 mm slump | Slight delay | Early strength ~83% control; later ≈ control | −5–37% | – | 50–100% | |
| [65] | Raw sewage, Treated effluent | Slight slump reduction | Initial set 128 → 110 min | 7-day strength +40%; later ≈ control | – | – | – | |
| [54] | Wastewater effluent | – | Accelerated hydration | −21–37% strength | – | – | – | |
| [53] | Potable water, Treated wastewater | Slump reduced 13–20% | – | ~10% reduction | ~19% reduction | – | – | |
| Greywater | [57] | Raw grey water (RGW) and Treated grey water (TGW) | Slump decreased by 3–3.5 cm | Initial setting time increased by +20 min (RGW) and +25 min (TGW) compared with distilled water | 28–120 days: TGW ≈ no change; RGW reduced strength by 7.7–13.9% | – | – | 50–100% grey water replacement |
| [48] | Tap water, Greywater | Slight slump reduction | Initial set delayed ~20–25 min | Greywater +11.8%; combined water +3.3% | – | – | – | |
| Industrial Wastewater | [47] | Tap water, Industrial wastewater | – | Slight delay | ~2% reduction vs. tap water | – | – | – |
| [58] | Produced water | Flow reduced ~20% | Initial set −25% | 20.4 MPa (0% WW), 34.5 MPa (80% WW), 23.7 MPa (100% WW) | – | – | 20–100% | |
| [59] | Distillery wastewater | Acceptable workability | Minor variation | Comparable or slightly improved strength | Cylinder load 230–330 kN | Beam load 3320–3940 kgf | 20% | |
| [66] | Coal mining wastewater | Good workability | – | +15.6% (50% WW) and +79% (100% WW) | 1.58–2.12 MPa | +8.7–17.4% flexural capacity | 50–100% | |
| [43] | Tap water + Concrete wash water from ready-mix trucks and batching plant | Slump 12–15 cm for all mixes | Setting time 140–150 min; longer when 50–70% wash water used | ~40.6 MPa (100% wash water) vs. ~45 MPa (100% tap water) at 90 days | Differences ≤ 1 MPa, not significant | Differences ≤ 0.58 MPa, not significant | 0–100% wash water replacement | |
| Natural Water Sources | [46] | Distilled, Tap, River, Wastewater, Lake water | 15.5–17 cm slump | – | River water +15–29%; wastewater +14–50% early then −2.3%; lake water −6–22% later ages | – | – | 100% |
| [60] | River water | Slight slump reduction | – | 16.04 MPa vs. 18.22 MPa control | – | – | – | |
| [52] | Potable, River, Rainwater | 10–25 mm slump | Initial 168–193 min | River water 97.6%, deep well water 91.1%, rainwater 83.7% of control | Slight reduction | Slight reduction | – | |
| Concrete Plant/Wash Water | [45] | Waste wash-water (WWW) from ready-mix concrete plant (raw, settling pond, filtered, filtered-neutralized) | Raw WWW: very low slump; Filtered WWW: slight slump reduction | - | 28–90 days: no significant difference from control for filtered or settling-pond water; Raw WWW: reduction up to −12.7% | - | - | Up to 75–100% recycled wash-water |
| [61] | Concrete wash wastewater | Slump increased (48 mm vs. 30 mm) | Accelerated | Similar strength (≤3% difference) | – | 6.7–10.2 MPa | 100% | |
| [67] | Concrete plant wastewater | Slump decreased with higher WW | – | Peak strength at 75% WW (~5.4% higher than control) | – | Reduced flexural loss | 0–75% |
| Impurity Level | Hydration Behavior | Microstructure | Transport Properties | Durability Performance |
|---|---|---|---|---|
| Low Impurity | Controlled hydration | Dense, well-formed C–S–H structure | Low permeability and diffusivity | High durability; strong resistance to degradation |
| Moderate Impurity | Variable hydration (acceleration or retardation depending on composition) | Mixed pore structure; partial refinement or disruption | Moderate transport properties | Variable durability; dependent on mixture design and impurity type |
| High Impurity | Disrupted or delayed hydration; formation of undesirable products | Porous structure; weak bonding and high porosity | High permeability and ion transport | Poor durability; increased susceptibility to chloride ingress, sulfate attack, and degradation |
| Water Source Condition | Typical Water Characteristics | Workability | Compressive Strength | Durability Performance | Dominant Mechanism |
|---|---|---|---|---|---|
| Treated wastewater | Controlled TDS, reduced organics, regulated pH | Slight reduction or stable | Comparable or improved | Generally acceptable | Improved hydration and refined pore structure |
| Treated greywater | Reduced suspended solids, moderate impurities | Slight reduction | Comparable | Limited data available | Reduced interference with hydration reactions |
| Treated concrete wash water | Fine particles, residual cement content | Stable or slight reduction | Comparable | Acceptable under controlled conditions | Filler effect and particle packing |
| Recycled water (controlled) | Moderate dissolved solids, filtered contaminants | Slight reduction | Comparable to control | Moderate performance | Balanced hydration and microstructural stability |
| Untreated wastewater | High TDS, organics, suspended solids | Significant reduction | Reduced | Poor durability | Increased porosity and delayed hydration |
| Industrial wastewater | Variable contaminants (chemicals, oils) | Highly variable | Variable or reduced | Potential risks | Chemical interference |
| Sewage water (untreated) | High organic content | Variable | Significant reduction | Poor durability | Weak microstructure |
| Natural non-potable water | Moderate impurities | Slight variation | Comparable or slightly reduced | Generally acceptable | Minor influence on hydration |
| Evaluation Domain | Key Parameters | Purpose | Engineering Significance |
|---|---|---|---|
| Fresh Properties | Slump, setting time | Assess workability and early-stage behavior | Ensures constructability and proper placement |
| Mechanical Performance | Compressive, tensile, flexural strength | Evaluate structural capacity | Confirms load-bearing performance |
| Durability Indicators | Permeability, water absorption, chloride penetration | Assess long-term performance | Determines service life and resistance to degradation |
| Microstructural Characteristics | Pore structure, C–S–H formation, porosity | Explain internal behavior | Provides mechanistic validation of observed performance |
| Impurity Level | TDS (mg/L) | Chloride (mg/L) | Sulfate (mg/L) | pH Range | TSS (mg/L) | Expected Performance |
|---|---|---|---|---|---|---|
| Low Impurity | <500 | <200 | <200 | 6.5–8.5 | <50 | Comparable to potable water; stable hydration; high durability |
| Moderate Impurity | 500–2000 | 200–600 | 200–1000 | 6.0–9.0 | 50–500 | Variable performance; possible strength retention but durability risk |
| High Impurity | >2000 | >600 | >1000 | <6 or >9 | >500 | Reduced strength and durability; disrupted hydration; high permeability |
| Category | Relative % |
|---|---|
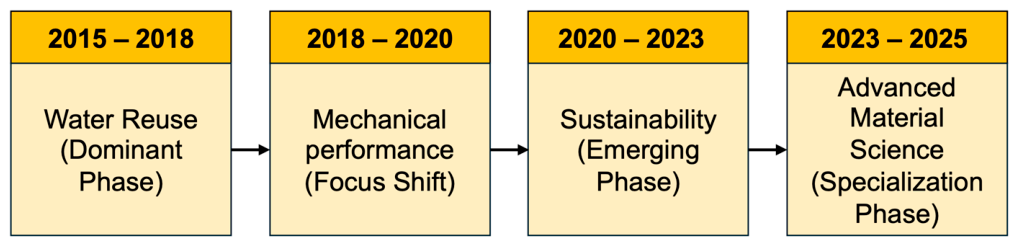
| Water reuse | 44.32 |
| Mechanical performance | 35.23 |
| Sustainability | 13.64 |
| Advanced material science | 6.81 |
| Identified Research Gap | Recommended Direction |
|---|---|
| Overreliance on compressive strength as the primary performance indicator | Expand evaluation to include durability-related properties such as permeability, chloride penetration, carbonation, sulfate resistance, shrinkage, and creep |
| Limited investigation of durability and long-term performance | Conduct long-term studies focusing on service life behavior and environmental exposure conditions |
| Insufficient integration of microstructural analysis | Incorporate SEM, XRD, and pore structure analysis and link findings to performance outcomes |
| Inconsistent reporting of water quality parameters | Standardize measurement and reporting of key parameters (pH, TDS, TSS, chlorides, sulfates) |
| Fragmented evaluation of concrete properties | Develop holistic frameworks that assess fresh, mechanical, durability, and environmental performance simultaneously |
| Limited focus on sustainability and environmental impact | Integrate life-cycle assessment (LCA) and sustainability metrics into experimental studies |
| Underutilization of advanced bibliometric methods | Apply keyword mapping and citation network analysis to better understand research evolution and gaps |
Disclaimer/Publisher’s Note: The statements, opinions and data contained in all publications are solely those of the individual author(s) and contributor(s) and not of MDPI and/or the editor(s). MDPI and/or the editor(s) disclaim responsibility for any injury to people or property resulting from any ideas, methods, instructions or products referred to in the content. |
© 2026 by the authors. Licensee MDPI, Basel, Switzerland. This article is an open access article distributed under the terms and conditions of the Creative Commons Attribution (CC BY) license.
Share and Cite
Robles, K.P.V.; Cordova, J.N.; Kinazo, M.C.; Kee, S.-H. Influence of Water Source Quality on Concrete Performance: A Mechanism-Based Systematic Review and Engineering Evaluation Framework. Materials 2026, 19, 3077. https://doi.org/10.3390/ma19143077
Robles KPV, Cordova JN, Kinazo MC, Kee S-H. Influence of Water Source Quality on Concrete Performance: A Mechanism-Based Systematic Review and Engineering Evaluation Framework. Materials. 2026; 19(14):3077. https://doi.org/10.3390/ma19143077
Chicago/Turabian StyleRobles, Kevin Paolo V., Jean Naethan Cordova, Maria Christyn Kinazo, and Seong-Hoon Kee. 2026. "Influence of Water Source Quality on Concrete Performance: A Mechanism-Based Systematic Review and Engineering Evaluation Framework" Materials 19, no. 14: 3077. https://doi.org/10.3390/ma19143077
APA StyleRobles, K. P. V., Cordova, J. N., Kinazo, M. C., & Kee, S.-H. (2026). Influence of Water Source Quality on Concrete Performance: A Mechanism-Based Systematic Review and Engineering Evaluation Framework. Materials, 19(14), 3077. https://doi.org/10.3390/ma19143077