3.1. Time-Domain Signal Characteristics of Rock Specimens with Different Thicknesses Under Single-Point Transmission
To investigate the influence of specimen thickness and lithology on THz wave propagation, this section systematically analyzes the time-domain THz transmission characteristics of limestone, sandstone, purple sandstone, and granite specimens under the natural state.
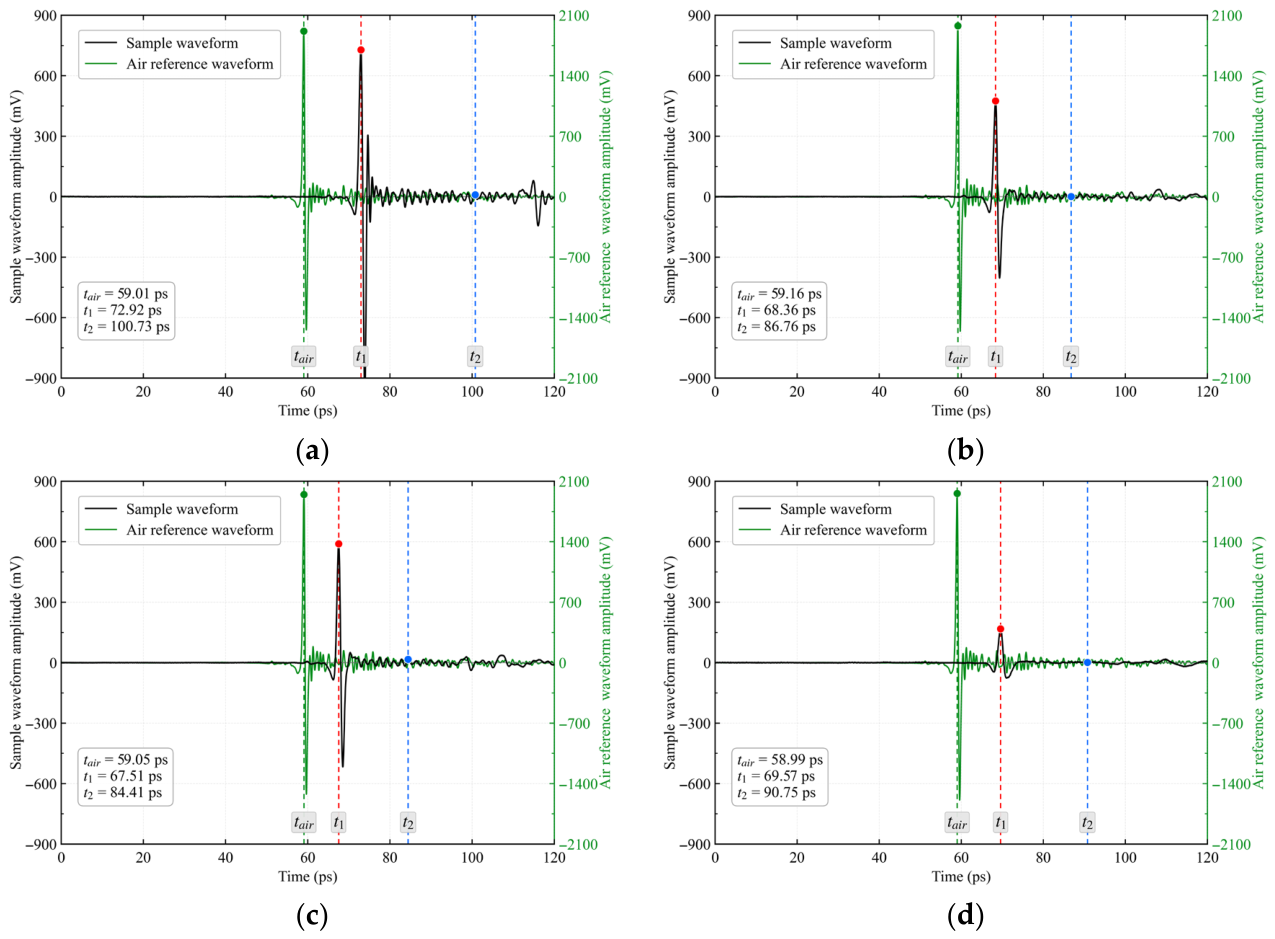
To clarify the physical meaning of the characteristic peaks in the time-domain waveform, the air reference waveform was introduced as the temporal reference. The main peak position of the air reference waveform was defined as
tair, while the main peak position of the sample transmission waveform was defined as
t1. For an approximately homogeneous slab sample, the delay of the reflection generated at the back surface of the sample relative to the main sample peak can be approximated as twice the delay of the sample main peak relative to the air reference main peak. Therefore, the theoretical position of the second characteristic peak,
t2, can be expressed as:
As shown in
Figure 4, the echo identification results of the 2-mm-thick natural rock samples exhibit lithology-dependent differences. The sample peaks of all rock specimens were delayed relative to the air reference main peak. Limestone exhibited the largest peak delay, reaching 13.91 ps, whereas the delays for granite, sandstone, and purple sandstone were 10.59, 9.20, and 8.45 ps, respectively. These results indicate that, under the same thickness condition, lithological differences alter the effective propagation time of the terahertz pulse, reflecting variations in effective optical path length, group velocity, and internal structure among the rock specimens. The
t2 position derived from the two-fold delay relation further characterizes the cumulative propagation delay of different specimens. The normalized amplitudes at this position were generally low, suggesting weak waveform responses at the corresponding time and limited contributions from subsequent echoes or residual oscillations.
The echo-identification results indicate that the THz time-domain signals of different lithological samples contain a main transmitted peak followed by varying degrees of subsequent responses. To further quantify the effect of sample thickness on THz wave propagation, the peak amplitude, peak delay, and waveform width of rock samples with different thicknesses were analyzed.
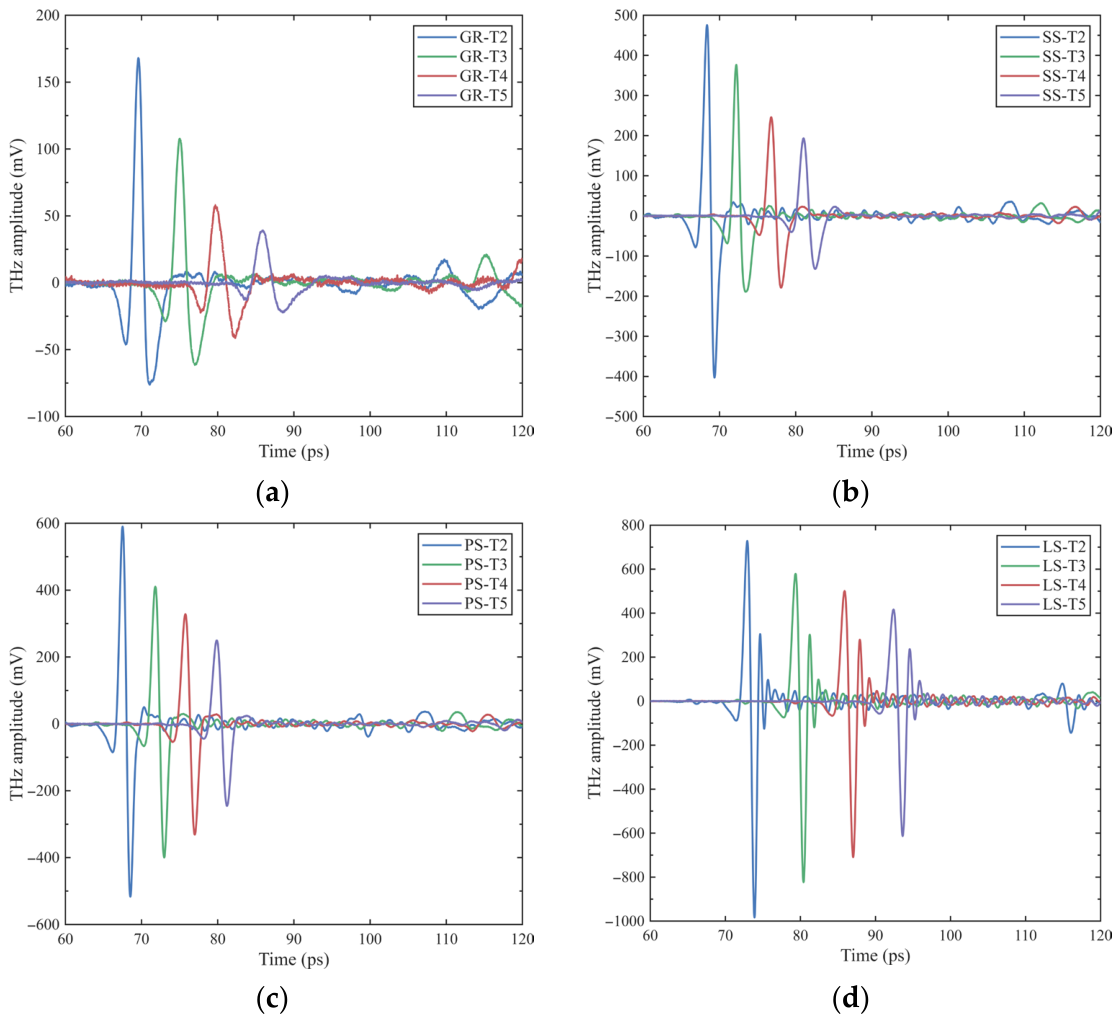
As shown in
Figure 5, when the specimen thickness increases from 2 mm to 5 mm, all four lithologies exhibit consistent variation trends in their time-domain waveforms. The main peak progressively lags, and the amplitude decreases significantly. The waveform continuously broadens, accompanied by a more prominent secondary response following the main transmitted peak. This indicates that the increased thickness extends the effective propagation path of THz waves within the medium, subjecting them to greater influence from mineral grains, pore structures, and internal heterogeneities. Consequently, scattering, absorption, and phase delay effects are intensified, manifesting as more apparent energy attenuation and temporal broadening.
Clear lithological differences are observed under this thickness effect: limestone exhibits the highest baseline transmission amplitude at a smaller thickness and the largest increase in main peak delay with thickness, indicating a higher effective refractive index. Granite shows the lowest overall transmission amplitude, with more pronounced waveform distortion and broadening as thickness increases, implying the strongest internal absorption, scattering, and dispersion. Sandstone and purple sandstone fall between these two extremes, showing smaller time delays and moderate amplitudes, reflecting their relatively loose structures and lower effective refractive indices. To further quantify these characteristics, the attenuation of the main peak amplitude, time delay, and waveform broadening is analyzed separately.
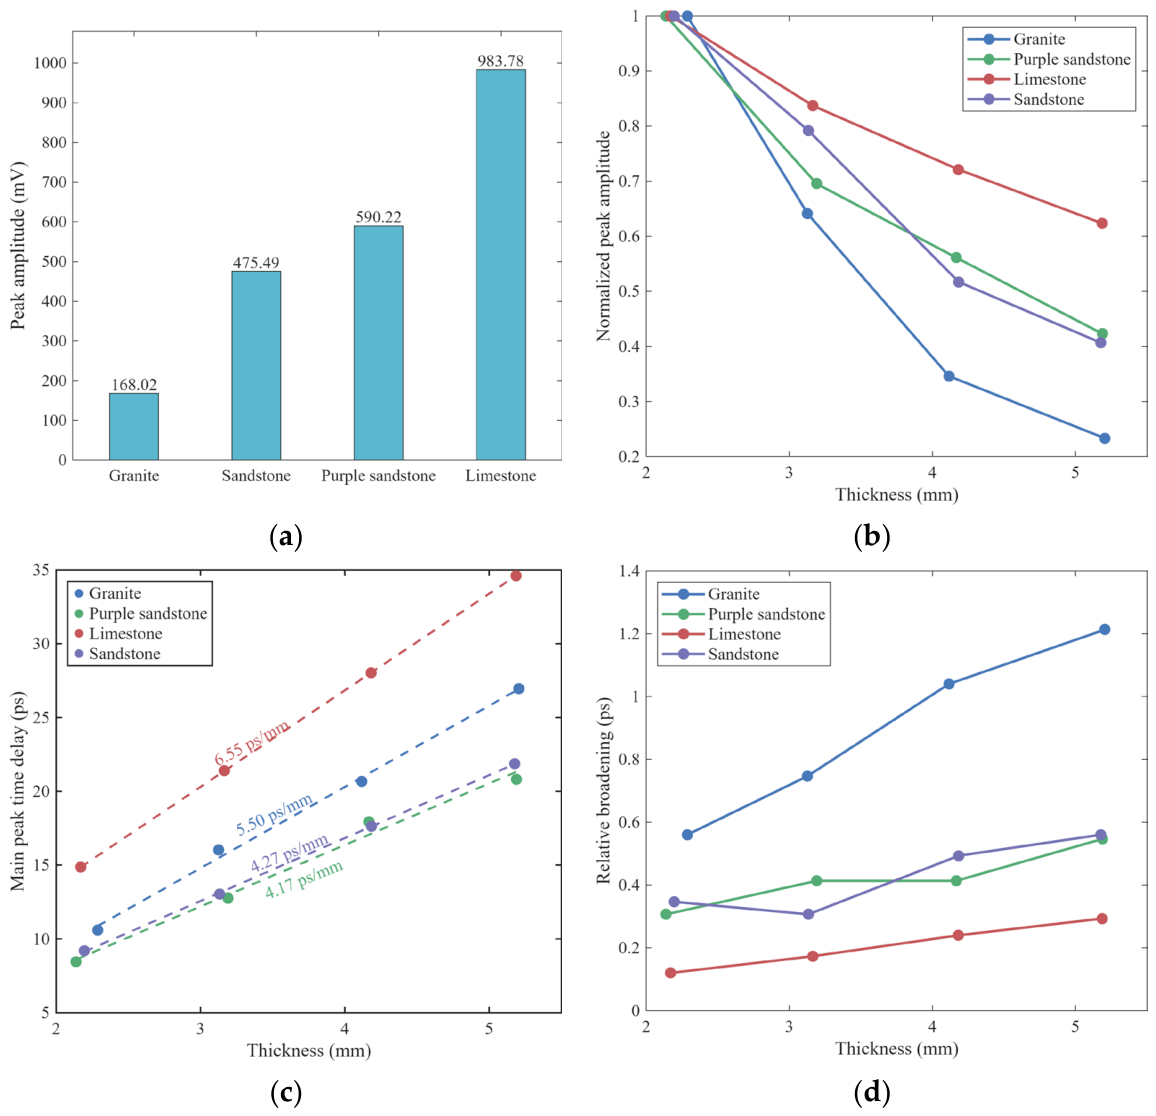
As shown in
Figure 6a, the peak amplitude of limestone is the highest (983.78 mV), which is 5.85 times that of granite (168.08 mV) and significantly higher than that of purple sandstone (590.22 mV) and sandstone (475.49 mV). This initial difference reflects the combined influence of mineral composition, pore structure, and moisture state on THz wave absorption and scattering. With increasing specimen thickness, the main peak amplitude exhibits continuous attenuation, as illustrated in
Figure 6b. The amplitude of all specimens decreases monotonically, though the decay rates vary significantly. Granite shows the most rapid energy loss, retaining only 18.21% of its initial amplitude at the 5-mm-thick group, while limestone displays the slowest attenuation, with a retention ratio as high as 58.65%. Sandstone and purple sandstone fall between these two, both maintaining amplitudes above 42%.
The main peak time delay increases approximately linearly with thickness (see
Figure 6c), consistent with the linear propagation-delay relationship in a homogeneous medium. Linear fitting results show that limestone has the largest delay coefficient per unit thickness (6.59 ps/mm), indicating the strongest deceleration effect on THz waves and the highest effective refractive index. Granite ranks second (5.37 ps/mm), while purple sandstone (4.26 ps/mm) and sandstone (4.23 ps/mm) exhibit the smallest and nearly identical values, suggesting relatively loose internal structures with a weaker influence on propagation velocity. These results indicate that the refractive behavior of specimens is primarily governed by their compactness and pore characteristics.
The relative waveform broadening characteristics of different lithologies also exhibit significant differences (
Figure 6d). It should be noted that, since the reference signals and all sample signals in this study were collected under identical optical system and focusing conditions, the inherent optical aberrations of the optical system exist as a constant systematic bias in each set of tests; therefore, the focus here is on analyzing the relationship between sample variations and the relative changes in the amount of broadening. With increasing thickness, waveform broadening continuously increases for all rocks, but the growth rate varies. Granite exhibits the largest broadening, from 0.56 ps at 2 mm to 1.21 ps at 5 mm, implying that its multiphase interfaces and microfractures cause the strongest dispersion and multiple-scattering effects. In contrast, limestone shows the smallest broadening (only 0.29 ps at the 5-mm-thick group), indicating a uniform and compact structure with minimal waveform distortion. Sandstone and purple sandstone exhibit intermediate and similar broadening magnitudes, suggesting comparable pore distribution and modulation effects.
These results indicate that lithology-dependent THz amplitude, delay, and waveform characteristics are jointly governed by rock compactness, pore structure, and mineral composition. Limestone exhibits the highest amplitude and the greatest delay, indicating the densest structure and lowest porosity, with minimal energy loss but the slowest propagation velocity—representing a typical high-transmission, high-refraction characteristic. Although granite has a high density, its multiphase crystal interfaces and microfractures result in strong absorption and multiple scattering, leading to significant energy attenuation and waveform distortion. Sandstone and purple sandstone exhibit intermediate amplitudes and delays; their well-developed and connected pores cause greater energy loss but faster propagation. Notably, purple sandstone, enriched in clay minerals, exhibits slightly lower amplitude than sandstone due to its stronger water-adsorption capacity.
3.2. Relationship Between Main-Peak Amplitude and Thickness of Specimens Under Different Moisture States and Model Fitting
To reveal the frequency-domain response characteristics of rock THz-TDS signals under dry and wet conditions, this section analyzes variations in spectral energy distribution for samples with different lithologies, thicknesses, and moisture states. Particular attention is given to shifts in the dominant PSD peak frequency and differences in the normalized power spectra, with the aim of clarifying the effects of thickness, moisture, and lithological heterogeneity on high-frequency attenuation and the low-frequency shift in THz signals.
To analyze the frequency-domain response characteristics of rock samples under different thicknesses and wetting–drying conditions, a Fast Fourier Transform (FFT) was performed on the acquired THz time-domain signal
. This process transforms the signal from the time domain to the frequency domain, yielding the corresponding complex spectrum
. Theoretically, the continuous complex spectrum
is expressed as:
Here, is the frequency and is the time.
To quantitatively evaluate the frequency-domain response of rock samples under various thicknesses and moisture states, the dominant peak frequency of the Power Spectral Density (PSD peak frequency) was introduced as a characteristic parameter to represent changes in the spectral energy distribution of the THz-TDS signals. A Hann window function was applied to the acquired THz time-domain signals, followed by the FFT to obtain the frequency-domain signal
. Subsequently, the Power Spectral Density (PSD) was calculated as follows:
Here, is the sampling frequency, represents the discrete sequence of the Hann window function, and is the total number of sampling points.
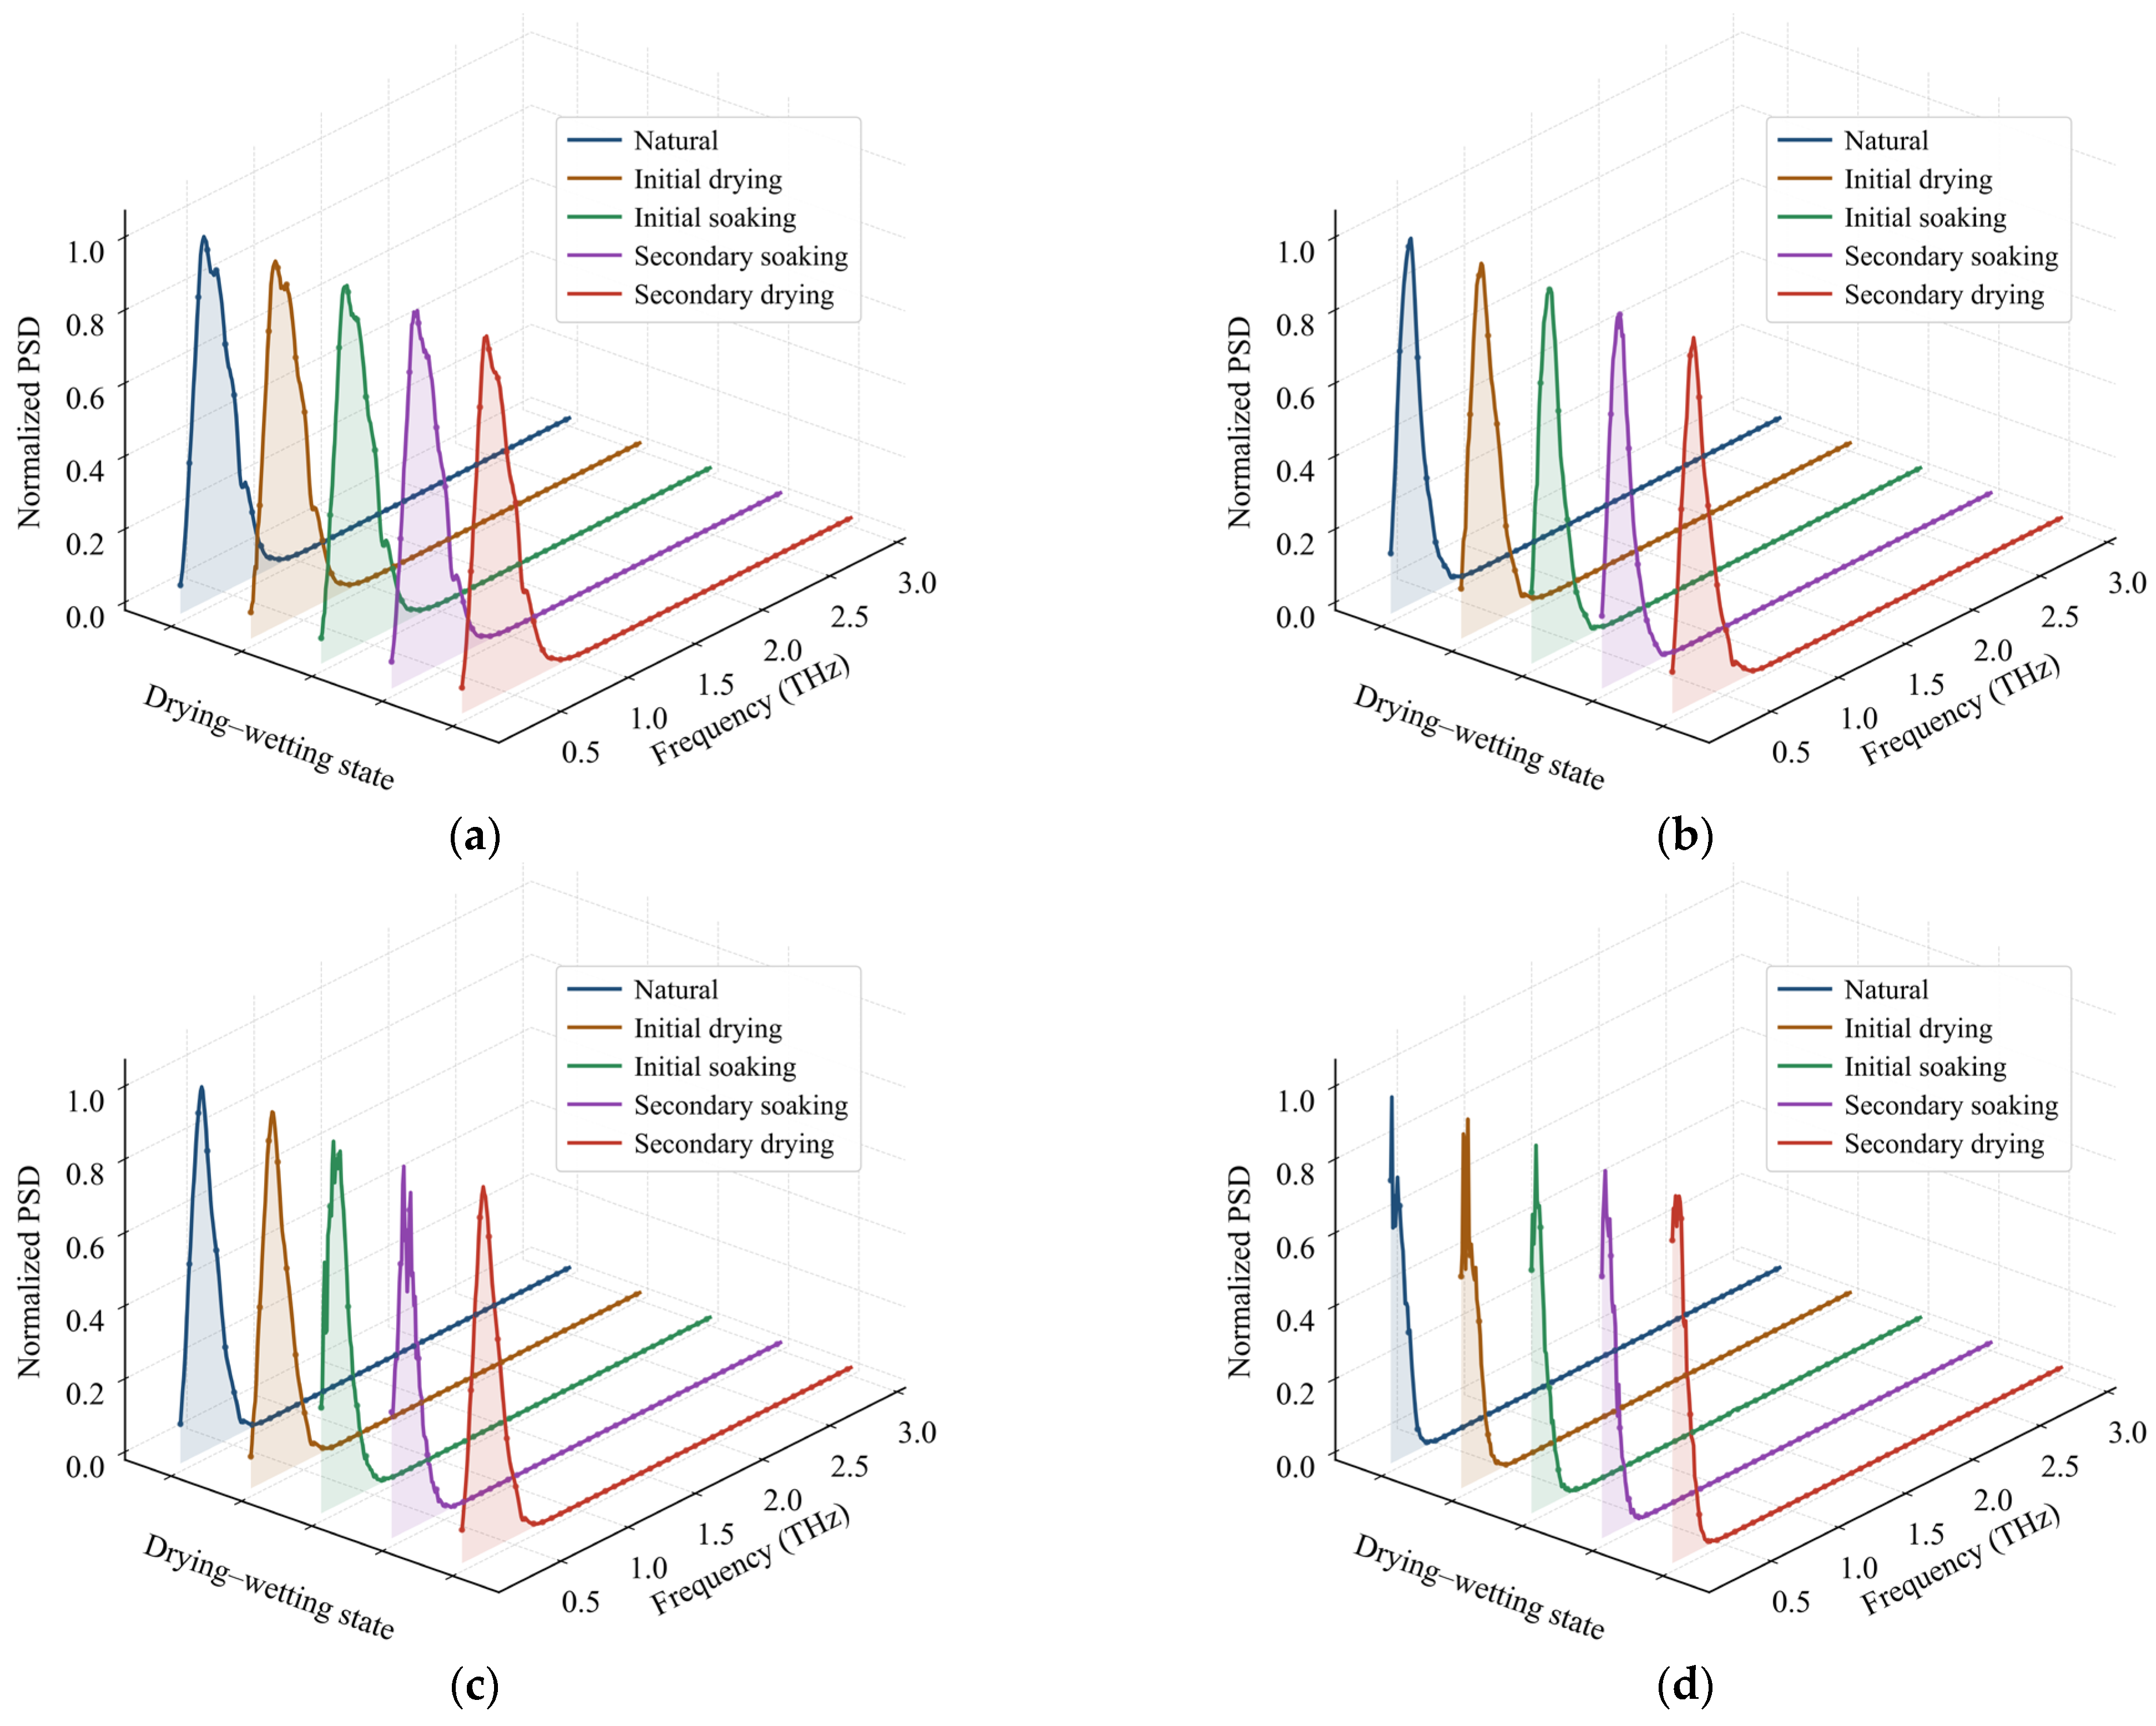
As shown in
Figure 7, the THz time-domain signals of rock specimens in the 5-mm-thick group under different lithologies and moisture conditions were transformed by FFT to obtain the normalized frequency-domain power spectra. The differences in PSD distributions among lithologies may be associated with variations in mineral composition, grain structure, and internal pore characteristics. Sandstone exhibits relatively broad spectral peaks, indicating a more dispersed distribution of frequency-domain energy. Purple sandstone shows more pronounced fluctuations in peak morphology, suggesting a higher degree of spectral complexity. Limestone presents a more concentrated main peak and relatively smooth spectral profiles, whereas granite is characterized by sharper and more prominent peaks, with frequency-domain energy more strongly concentrated around the dominant peak. In contrast, for specimens of the same lithology, the PSD curves under different drying–wetting states are generally similar and do not exhibit distinct, isolated, and stable narrow-band absorption features. This indicates that the influence of moisture-state variation on the spectra is not manifested as independent absorption peaks at specific frequencies, but rather as an overall redistribution of spectral energy, shifts in the dominant peak frequency, and attenuation of high-frequency components.
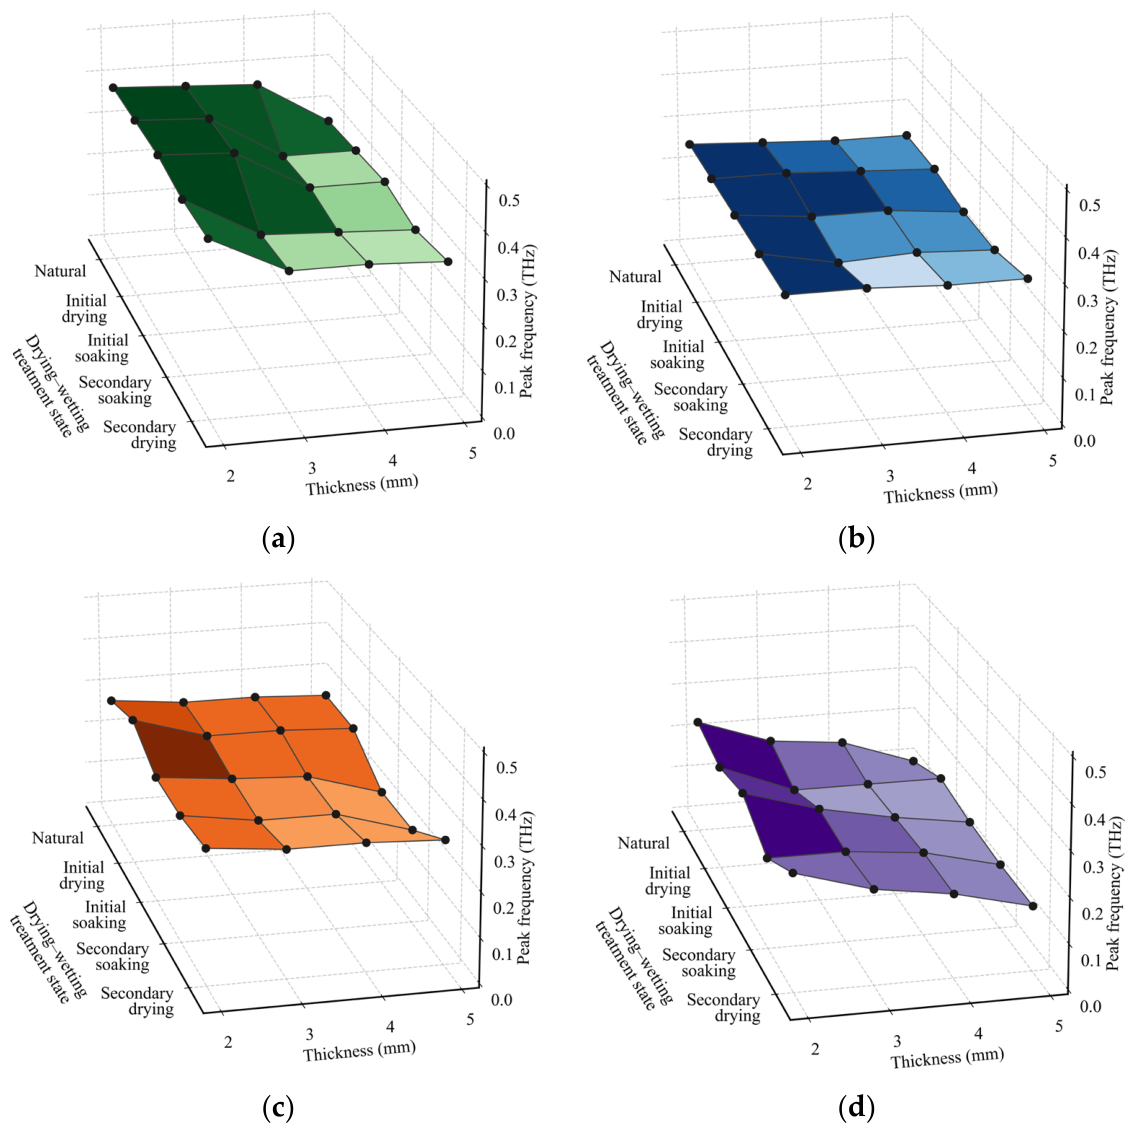
As shown in
Figure 8, the dominant PSD peak frequencies were analyzed for rock specimens with different lithologies, thicknesses, and moisture conditions. With increasing specimen thickness, the dominant PSD peak frequency generally shifts toward lower frequencies, indicating that a greater propagation path enhances the attenuation of high-frequency THz components within the rock. Variations in moisture conditions further affect the spectral energy distribution. After saturation treatment, the dominant PSD peak frequency generally decreases, with the most pronounced low-frequency shift observed under the 12 h saturated condition. After secondary drying, the dominant peak frequency partially recovers; however, residual differences remain, suggesting that drying–wetting cycling has an incompletely reversible effect on the frequency-domain response of the rocks. Distinct differences are also observed among lithologies in the evolution of the dominant PSD peak frequency. Limestone exhibits relatively higher dominant peak frequencies overall and is more sensitive to thickness variation. Granite shows the lowest dominant peak frequencies and the most evident low-frequency shift. Sandstone presents a comparatively gradual variation, whereas purple sandstone exhibits a pronounced moisture-sensitive response under saturated conditions.
To further quantitatively describe the attenuation law of the time-domain peak amplitude for samples under different moisture states, the classic Beer–Lambert model [
31,
32] was employed to fit the experimental data. The model can be expressed as follows:
Here,
α is the effective attenuation coefficient (mm
−1),
Pa is the peak amplitude measured at a sample thickness of
T (mV),
T is the specimen thickness (mm), and
P0 is the reference peak amplitude measured in air (mV). This model is used to predict the actual testing thickness of the specimen:
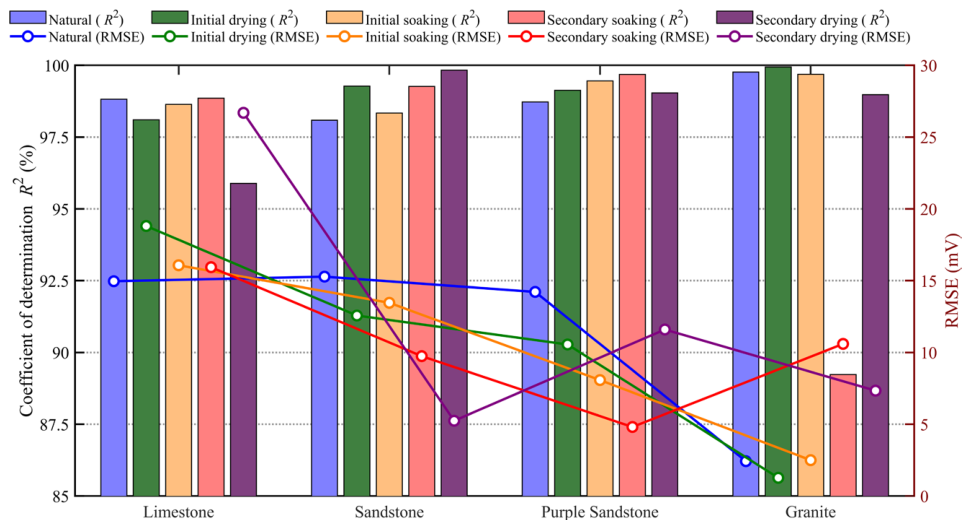
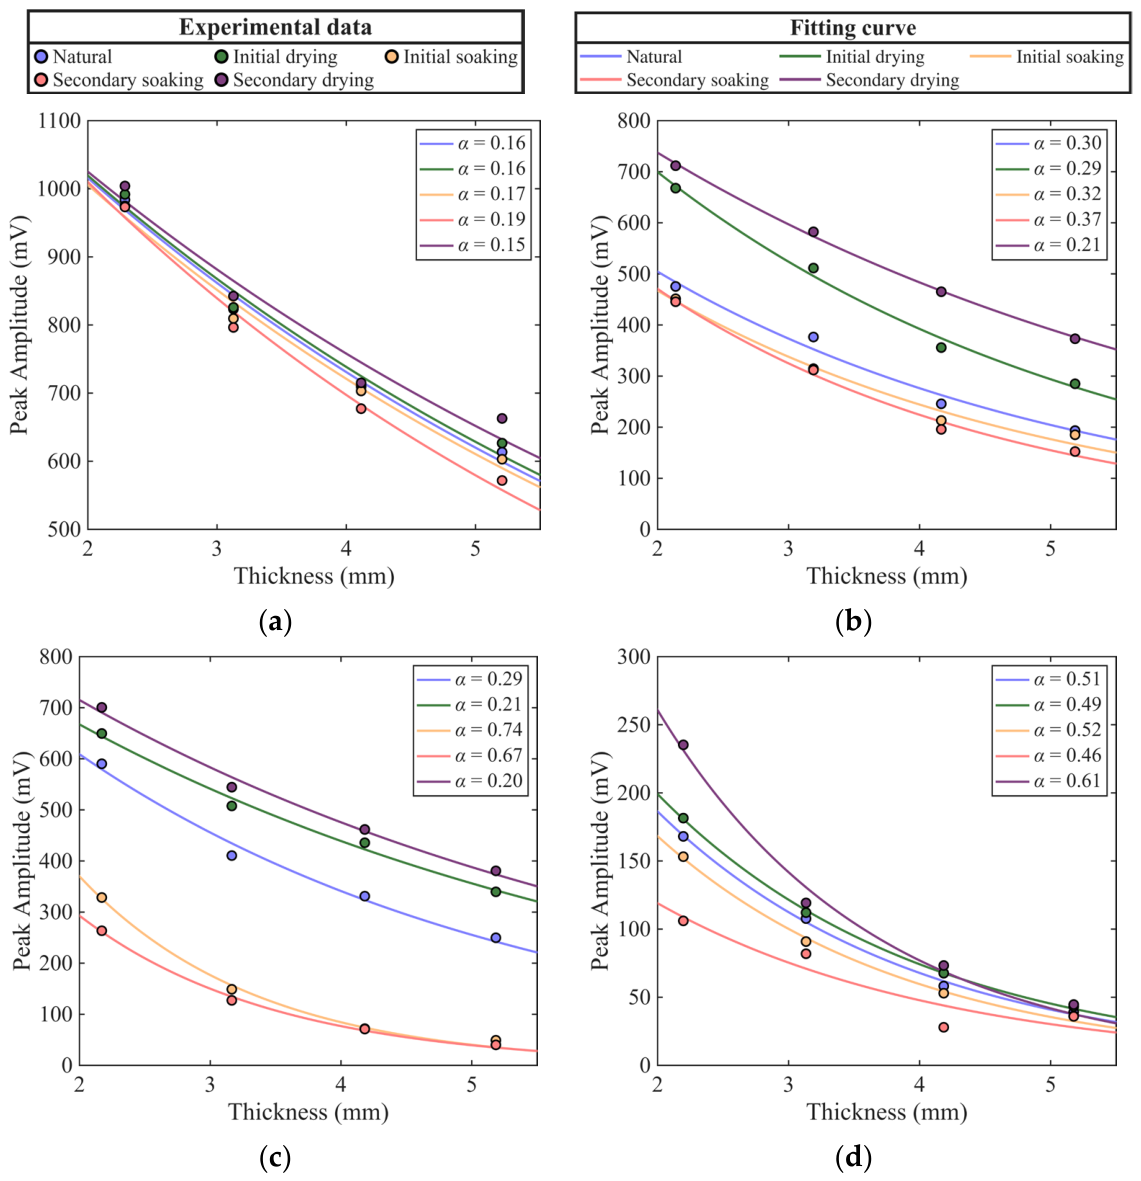
The experimental results and corresponding fitting curves are shown in
Figure 9, and the coefficients of determination
R2 are presented in
Figure 10. It can be observed that
R2 for all lithologies and moisture states exceed 96%, indicating that the exponential model accurately characterizes the attenuation behavior of THz peak amplitude under different moisture states, demonstrating excellent applicability and stability.
As shown in
Figure 9, the amplitude variations under different moisture states exhibit distinct patterns reflecting both moisture suppression and thickness effects. At any given thickness, the amplitude in the dried state is significantly higher than that in the soaked state, indicating the strong absorption of THz waves by water molecules. For porous lithologies such as sandstone and purple sandstone, the moisture-suppression effect is far more pronounced than the thickness effect. For example, in purple sandstone, the peak amplitude after the secondary drying at the 5-mm-thick group reaches 380.65 mV, which exceeds the values at the 2-mm-thick group under the initial (328.67 mV) and secondary (263.49 mV) saturation stages. A similar trend is observed in sandstone: the 5-mm-thick group specimen after the secondary drying shows a peak amplitude of 372.89 mV, which is considerably higher than that of the 3-mm-thick group specimen in the saturated state. In contrast, granite and limestone are less affected by moisture; in particular, limestone exhibits the smallest inter-curve spacing and the smoothest variation, reflecting its dense structure and lowest sensitivity to moisture changes.
Furthermore, for all lithologies, the peak amplitude decays rapidly with thickness in the thinner range but gradually stabilizes as thickness increases. This indicates that for thin specimens, the absorption effect of water on the transmitted signal is more pronounced, whereas for thicker specimens, intrinsic absorption and scattering within the rock become the dominant factors. Based on the fitted curves, the thickness most sensitive to moisture variation for each lithology can be identified at the point showing the largest amplitude difference between the secondary drying and secondary saturation states: granite, 0.75 mm (a difference of 291.67 mV); sandstone, 1.33 mm (a difference of 421.35 mV); purple sandstone, 1.19 mm (a difference of 703.61 mV); and limestone, 1.76 mm (a difference of 59.80 mV).
The attenuation coefficient α quantifies the rate of THz energy loss per unit thickness of the medium, and its evolution clearly reveals the dominant role of moisture in THz attenuation. From the natural state to the initial drying stage, α decreases significantly, indicating that the removal of free and partially adsorbed water from pores and microcracks substantially weakens THz absorption. From the initial drying to the initial soaking, α increases rapidly, reflecting the reintroduction of a strongly absorbing medium as the specimen reabsorbs water. From the initial to the secondary soaking, α shows only a slight increase, suggesting that the moisture content has approached or reached saturation. From the secondary soaking to the secondary drying, α drops sharply to its minimum, representing the lowest level throughout the entire process. The absolute range of α among different lithologies directly reflects their varying sensitivities to moisture changes.
The absolute range of α across lithologies distinctly illustrates their differential responses to moisture variation. Granite exhibits higher α values (0.49–0.61/mm) under most wetting conditions, but its variation becomes more pronounced as conditions change. Conversely, limestone has the lowest α values (0.25–0.31/mm) and the narrowest variation range. This reflects its dense and uniform structure, ensuring stable THz attenuation and minimal sensitivity to water-bearing conditions. Sandstone and purple sandstone exhibit intermediate α ranges, showing typical porous-medium behavior: although their attenuation magnitudes are smaller, they are highly sensitive to moisture changes, with overall THz attenuation predominantly governed by adsorbed water and interconnected pores.
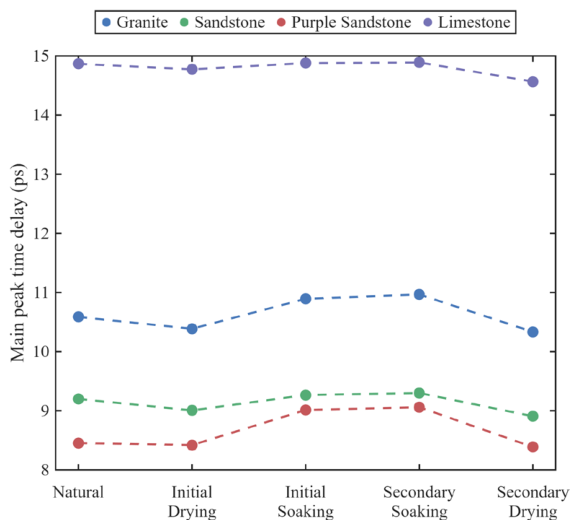
To evaluate the damage induced during the wetting–drying cyclic treatment, the evolution patterns of the main peak time delay (TOF) for the four rock types within the 2-mm-thick group under various water treatment cycles were further analyzed, as illustrated in
Figure 11. The results indicate that the TOF values consistently maintain a descending order of “limestone, granite, sandstone, and purple sandstone” throughout the entire process, highlighting the decisive influence of the intrinsic properties of the rock matrix on terahertz propagation.
In the dynamic alternation of wetting–drying cycles, the TOF exhibits high sensitivity to moisture migration and microstructural variations. First, in the initial drying stage, as the high-refractive-index free water in the pores is replaced by low-refractive-index air, coupled with the initial opening of native microcracks inside the rock caused by thermal treatment, the TOFs of all four rocks show a measurable decrease; for example, granite decreases by up to 0.2 ps. Subsequently, in the initial soaking stage, water refills the pores, and the water-induced swelling of some rock matrices leads to the closure of partial microcracks, substantially increasing the effective refractive index and prompting a significant rebound in the TOF of each specimen. Notably, the secondary soaking stage generally exhibits a longer time delay, such as the TOF of purple sandstone increasing from 8.45 ps to 9.06 ps, indicating that after the initial cycle, more damage crack seepage channels have formed inside the rock, enhancing its water retention capacity. Finally, in the secondary drying stage, the TOFs of all specimens drop to the lowest point of the entire cycle, significantly lower than the initial drying state. This phenomenon confirms that the wetting–drying cycle induces irreversible physical damage within the rock. The severe alternation of drying shrinkage and wetting expansion not only expels pore water but also catalyzes the initiation and propagation of numerous secondary microcracks in the rock matrix. These newly generated microcracks significantly increase the air volume fraction inside the rock, causing the macroscopic effective refractive index of the medium to be further reduced, which directly manifests as the shortening of the TOF.
3.3. Planar Scanning Imaging Based on Peak Amplitude and Its Statistical Evolution
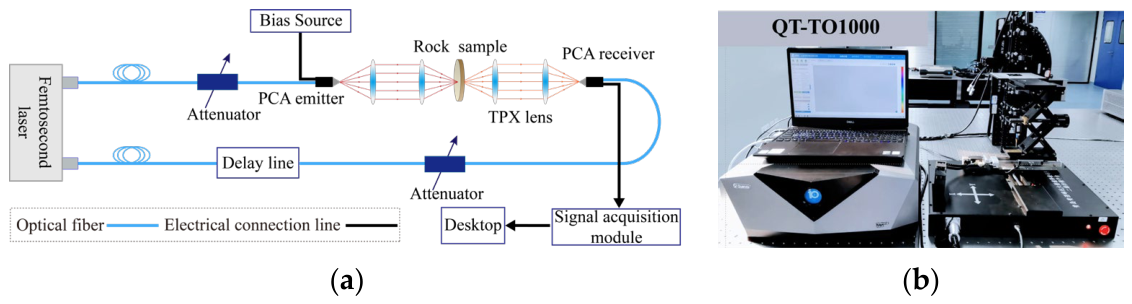
Before performing THz transmission imaging analysis, the validity of the plane-wave approximation in the THz transmission analysis was examined. Specifically, the propagation characteristics of the THz beam at the sample position were estimated based on the experimental optical-path parameters, in order to determine whether the plane-wave approximation was applicable under the present experimental conditions. In this study, the TPX lens used in the experiment had a focal length of 50 mm and an aperture of 38.1 mm. The THz beam radius at the sample measurement position was estimated to be ω0 = 0.8 mm.
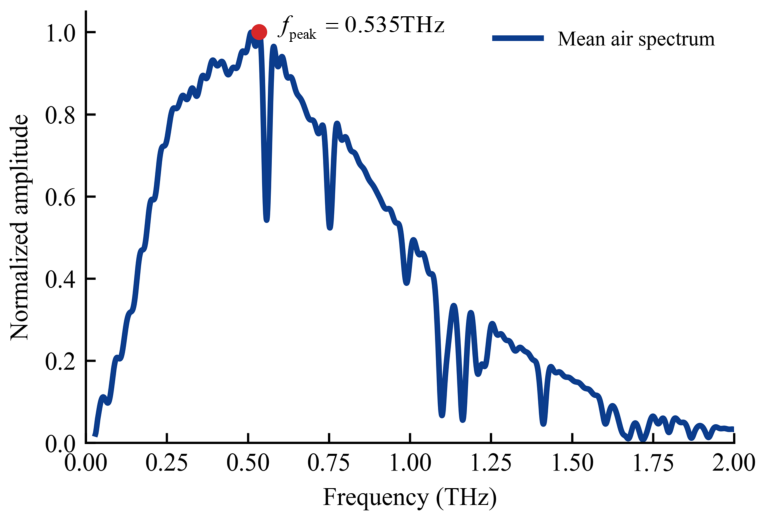
To determine a representative frequency for the focal-length estimation, the time-domain reference signal measured in air without a sample was Fourier transformed to obtain its frequency-domain spectrum
Eref(
f). The frequency corresponding to the maximum spectral amplitude,
fpeak, was then selected as the representative frequency for focal-length estimation. The frequency-domain spectrum of the air reference signal is shown in
Figure 12.
The confocal parameter was calculated according to the Gaussian beam relation:
Here, is the corresponding wavelength in mm (derived from ). Substituting mm gives a confocal parameter of mm, which is larger than the maximum sample thickness considered in this study, 5 mm. Therefore, the sample thickness is smaller than the confocal parameter, indicating that the plane-wave approximation is generally acceptable under the present experimental conditions.
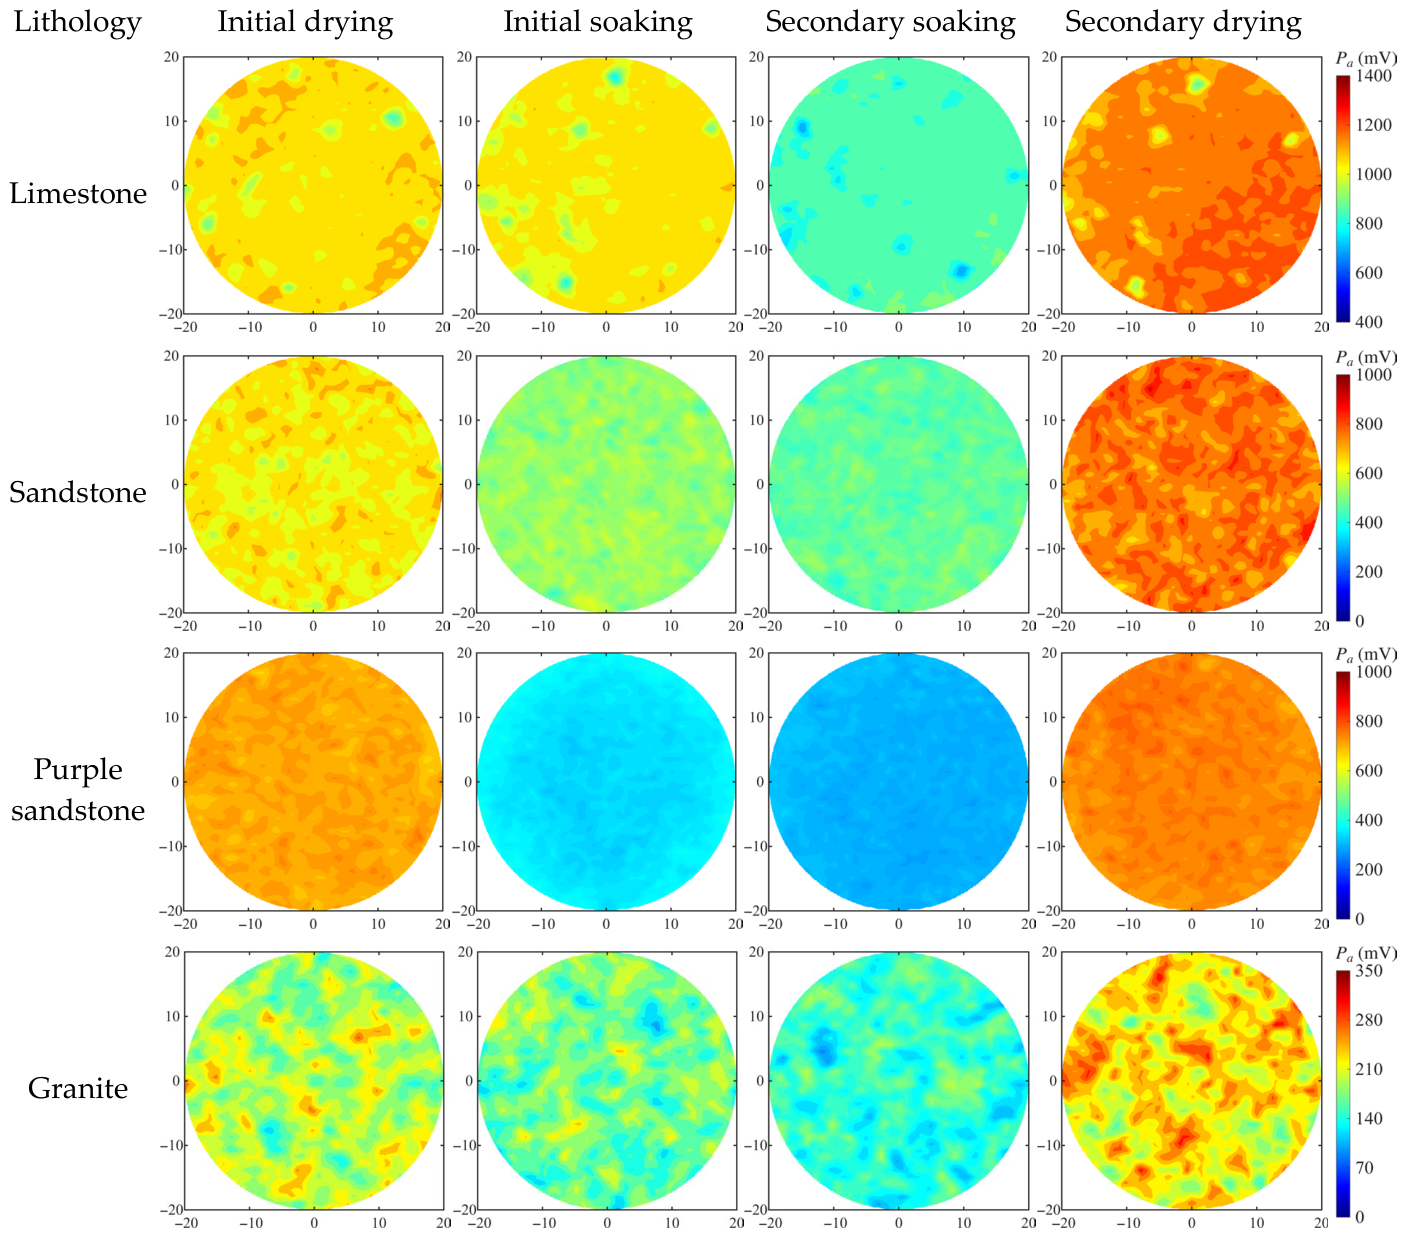
According to the planar scanning results of the specimens, the time-domain peak amplitude at each point on the scanning plane was used for imaging analysis. To minimize the influence of edge effects and air coupling, only the region within a radius of 20 mm from the specimen center was considered for statistical analysis.
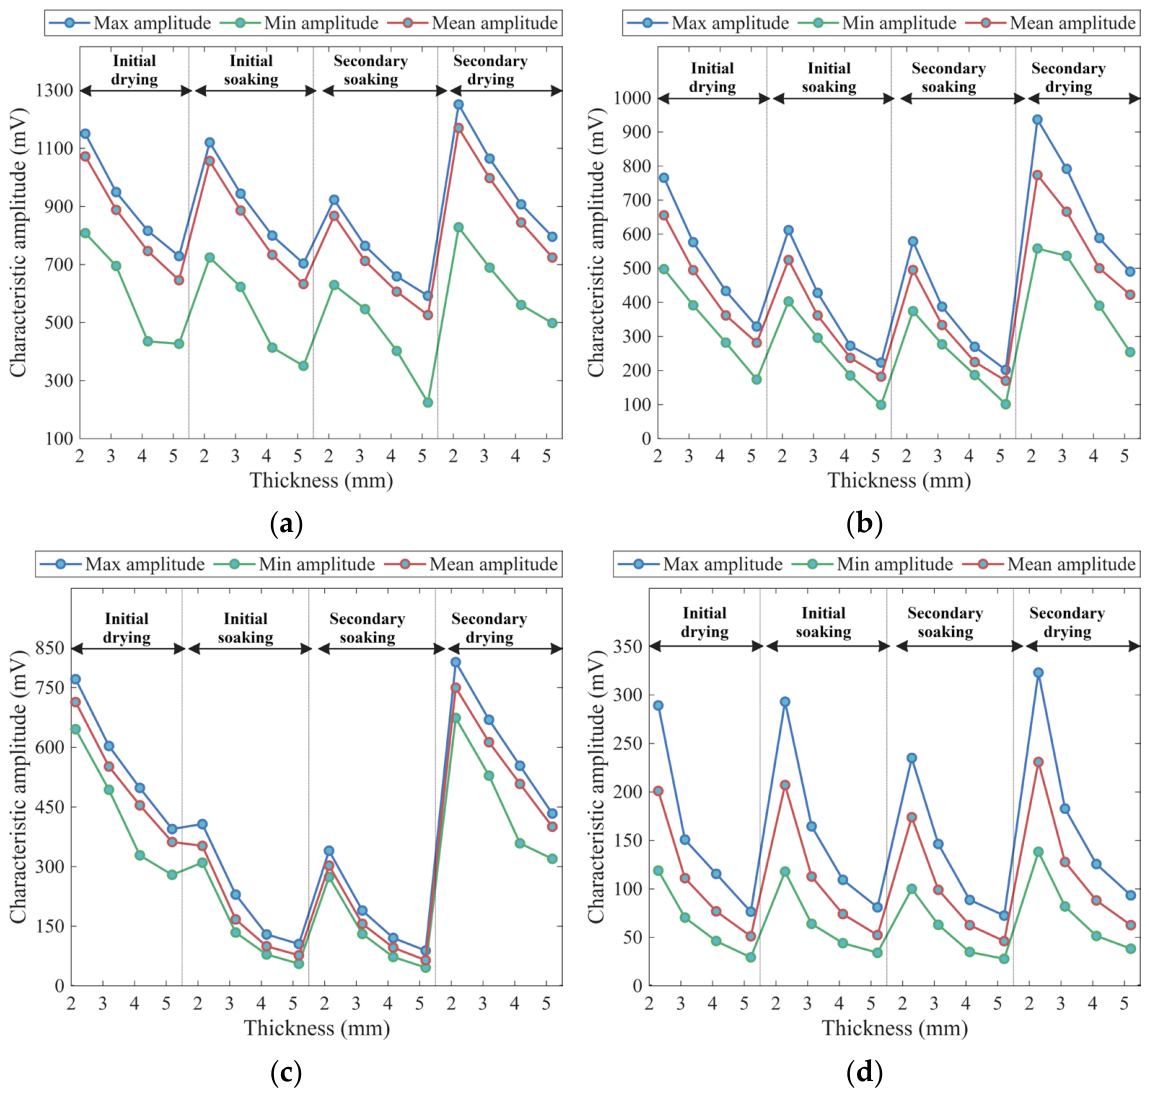
Figure 13 presents the amplitude imaging results for specimens in the 2-mm-thick group, while
Figure 14 illustrates the evolution of the maximum, minimum, and average peak amplitudes within the imaging plane under different thicknesses and drying–wetting conditions.
As shown in the imaging results in
Figure 13, the amplitude distribution of limestone specimens is the most uniform across all stages, with only a few localized low-amplitude regions. These regions are highly sensitive to moisture variation and correspond to limited pores or microfractures, whereas the rest of the specimen exhibits high and stable amplitudes, reflecting a dense matrix structure and stable THz propagation. The impact of moisture is primarily sequestered within localized porous regions.
Sandstone specimens show pronounced spatial nonuniformity, with alternating high- and low-amplitude regions that maintain a similar pattern during both drying and soaking processes. This indicates a well-developed and highly connected pore system, allowing efficient water migration and evaporation. The amplitude distribution of purple sandstone is similar to that of sandstone but with weaker contrast between high- and low-amplitude regions. Its overall amplitude is slightly higher than that of sandstone in the natural state; however, it decays more rapidly during soaking and does not fully recover after secondary drying. This implies that the matrix is enriched with highly adsorptive clay minerals, imparting a greater water-retention capacity and retarding the evaporation process.
Granite specimens exhibit the lowest overall amplitude and a highly nonuniform spatial distribution, with multiple prominent low-amplitude zones. As saturation progresses, these zones expand and decay rapidly, indicating that internal pores and fractures act as strong absorption–scattering centers after water infiltration. Consequently, granite specimens show the most pronounced THz response variation among the tested lithologies under different moisture states.
As shown in
Figure 14, the planar transmission results demonstrate that the thickness effect still follows an exponential attenuation trend, consistent with the single-point transmission results. The influence intensity of drying–wetting treatment is clearly controlled by lithology. Specifically, limestone exhibits the smallest spacing between its maximum and average amplitude curves, always below 90 mV and nearly parallel, indicating a uniform and dense structure with most regions maintaining high amplitude levels. The variation pattern of the minimum values is less distinct, mainly affected by limited pores, microfractures, and fine-scale heterogeneity. In the 2-mm-thick group, the maximum amplitude decreases by 30.29 mV and 197.33 mV after the initial and secondary soaking stages, respectively, suggesting that the water infiltration process in the limestone matrix is slow and the connectivity of pores and fractures is limited.
For sandstone and purple sandstone, the spacing between average and extreme amplitude curves remains generally consistent, indicating relatively uniform pore distributions. The amplitude variations induced by drying–wetting cycles are more pronounced—particularly in purple sandstone, where the curve fluctuations during the natural–saturated–dried alternations are the most distinct, with a maximum amplitude difference of 474.4 mV, reflecting its strong moisture sensitivity.
Granite also shows a relatively uniform pore distribution, but with larger pore sizes, resulting in greater spacing between the average and extreme amplitude curves compared to other lithologies. The difference between its maximum and minimum values becomes more pronounced with increasing thickness, indicating that granite exhibits ‘thickness-dominant’ attenuation characteristics, in contrast to the ‘moisture-sensitive’ behavior observed in more porous lithologies.
3.4. Influence of Composition, Morphology, and Structure on THz Transmission Characteristics
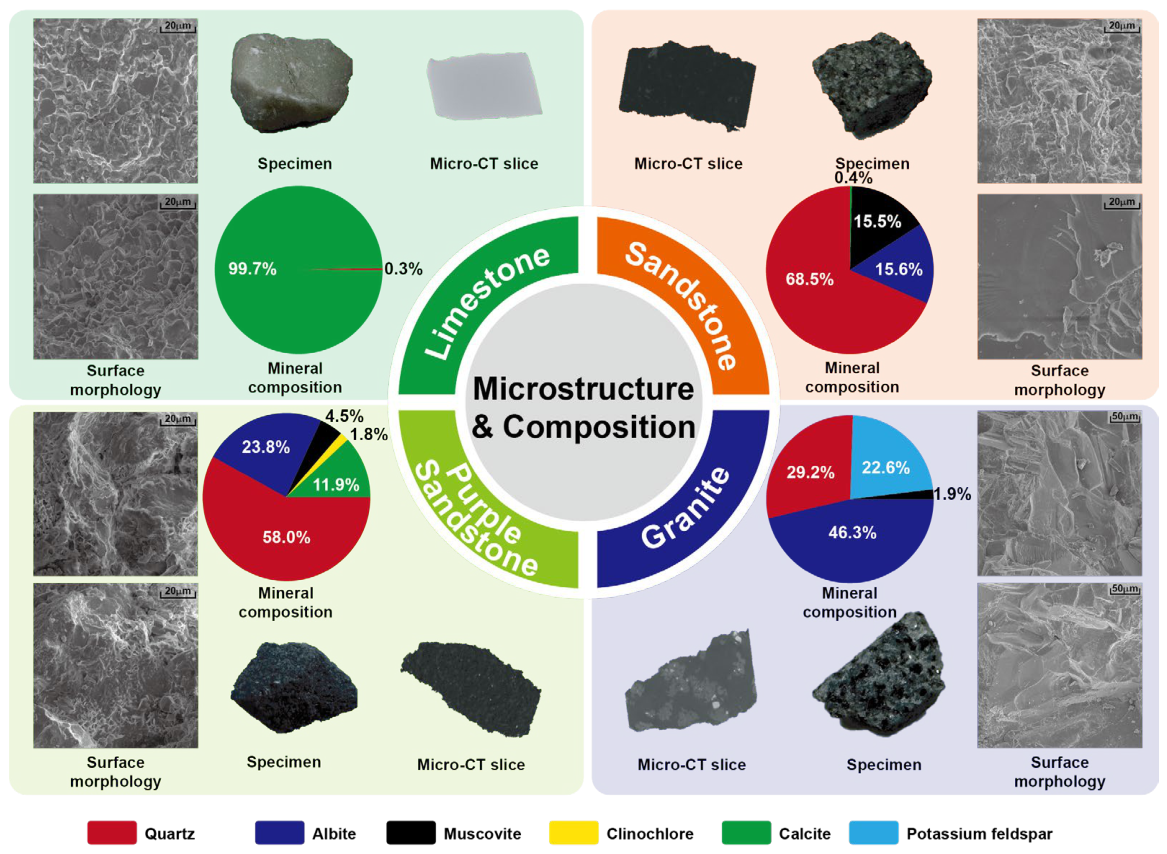
To further clarify the mechanisms by which lithology and structure affect THz response, additional mineralogical and microstructural analyses were conducted based on the THz time-domain test results. X-ray diffraction (XRD) was used to determine mineral composition, while small fragments from the same specimen batch were examined using scanning electron microscopy (SEM) for surface morphology and computed tomography (CT) for internal structural imaging.
As shown in
Figure 15, the integrated characterization results for the four lithologies reveal distinct mineralogical and structural features. Limestone is primarily composed of calcite as a monomineralic mineral. SEM micrographs reveal a dense, interlocking mosaic-like microstructure, and CT slices display uniform grayscale, indicating a low density of scattering sources. Consequently, the limestone specimens exhibit superior transmission performance, weaker sensitivity to drying–wetting treatment, and more pronounced time-delay growth with increasing thickness, showing an overall stable response.
Sandstone consists mainly of a quartz framework with feldspar and a certain proportion of muscovite. SEM and CT images reveal connected pore throats and fine interlaminar fissures, resulting in moderate scattering and multipath effects. Therefore, its attenuation and broadening levels are intermediate among the tested lithologies. The connected pores lead to a significant decrease in amplitude and a slight increase in time delay under moist conditions.
Purple sandstone is composed of a quartz/plagioclase framework interbedded with mica, chlorite, and other clay minerals. CT imaging shows a relatively dense macrostructure, but SEM observations reveal abundant secondary clay growth that substantially modifies the original intergranular pores, forming numerous micron-scale voids and narrow, tortuous pore throats. The inherent hygroscopicity and resultant interfacial polarization of clay minerals exacerbate energy dissipation and scattering, manifesting as increased attenuation and waveform broadening.
Granite contains a high proportion of feldspar, along with quartz and minor mica. SEM images show interlocking polycrystalline grains with uneven and stepped grain boundaries, while CT slices display strong heterogeneity. The high density of phase interfaces results in intense interfacial scattering and internal reflection, leading to the lowest initial amplitude, fastest attenuation, and greatest waveform broadening. The specimens are highly sensitive to thickness, and the time delay increases markedly with greater thickness.
Overall, mineral composition and internal structure jointly determine the THz transmission capacity and moisture sensitivity of rocks. From a mineralogical standpoint, carbonate-rich, densely crystalline, and compositionally uniform rocks generally exhibit higher refractive indices, leading to greater time delay per unit thickness. In contrast, silicate rocks with diverse mineral phases show moderate time-delay behavior. Hydrophilic minerals such as clay and mica enhance energy loss through water adsorption and interfacial polarization, amplifying attenuation and broadening under moist conditions even when macropores are limited.
Regarding the structural effect, the interface density, grain size relative to the THz wavelength, pore-throat geometry and roughness, and the development of microfractures collectively control scattering and dispersion intensity. Higher interface density and roughness accelerate amplitude attenuation and waveform broadening, whereas connected pore networks facilitate water migration, typically resulting in reduced amplitude and increased time delay.




 ,
,