1. Introduction
Multiferroic materials, characterized by coexisting ferromagnetic, ferroelectric, or ferroelastic orders with cross-coupled interactions, have emerged as promising candidates for next-generation magnetoelectric devices and advanced information technologies due to their unique multifunctional responses [
1,
2,
3]. Since Curie’s pioneering proposal of intrinsic magnetoelectric coupling in 1894, extensive research has focused on two principal categories: single-phase and composite multiferroics [
4]. The ABO
2-type delafossite materials belong to the Type-II single-phase multiferroic materials, such as CuCrO
2. CuCrO
2 emerges as a particularly promising p-type transparent conductive oxide candidate owing to its inherent hole-dominated conductivity and exceptional visible-light transmittance, positioning it as a frontrunner for thermoelectric sensors, solar energy harvesting devices, and advanced display technologies [
5,
6,
7,
8]. A comparative analysis within Type-II single-phase multiferroic materials revealed that Cr-O bonding exhibits the strongest covalent character among B-site cations, establishing chromium as the optimal B-site constituent [
9,
10].
The delafossite compound CuCrO
2 crystallizes as a triangular antiferromagnetic spin-lattice structure, adopting the R-3m space group and C3v point group symmetry at ambient conditions [
11]. Its layered architecture comprises alternating Cu-O-Cu dumbbell configurations along the c-axis and edge-sharing CrO
6 octahedra, collectively forming the characteristic delafossite framework. This geometrically frustrated triangular lattice configuration inherently hosts spin frustration, driving unconventional magnetic phase transitions whose microscopic mechanisms remain subjects of active investigation. The different states, synthesis methods, and microstructures of the materials can significantly affect their physical properties [
12,
13,
14,
15,
16]. Ionic substitution has emerged as an effective strategy for modulating these magnetic functionalities [
17,
18,
19]. Elkhouni et al. demonstrated that Zn
2+ substitution induces spin dilution through localized magnetic moment suppression, thereby constraining antiferromagnetic domains. Conversely, Ti
2+ doping triggers a dimensional crossover from anisotropic 3D antiferromagnetic (3D-AF) magnons to 2D-AF magnetic excitations [
20,
21]. A study by Gao revealed that growth-oriented lattice stresses during synthesis promote preferential c-axis orientation [
22]. The coexistence of Fe
3+ and Cr
3+ introduces hole-mediated Fe
3+-Cr
3+ superexchange interactions, generating ferromagnetic ordering with progressively diminished saturation magnetization as the Fe content increases. Zhang et al. also successfully synthesized Sn
4+-substituted CuCr
1−xSn
xO
2 (x = 0–0.05) ceramics via solid-state reaction, observing enhanced unit cell volumes without altering Cu
+/Cr
3+ oxidation states, while significantly modifying magnetic hysteresis characteristics [
23].
These studies showed that CuCrO2 delafossite material has rich and complex physical properties, and the study of its microstructure is helpful to understanding the magnetoelectric coupling effect with great application potential derived from its unique magnetic structure. However, the magnetic transition mechanism behind CuCrO2 ceramics is still unclear, and further research is needed. Rare earth ion doping is less commonly used in the existing research to study its effect on the magnetic properties of CuCrO2 ceramic materials. Therefore, Y3+ was selected as the doping element in this paper. On the one hand, Y3+ and Cr3+ have the same valence state, and Y3+ has no magnetism, which can avoid the too-complex influence on the magnetism of Y3+. On the other hand, the radius of Y3+ is larger than that of Cr3+, which allows us to study its influence on the microstructure and magnetic transformation of CuCrO2 ceramics while minimizing the interference of other factors and explore the possible correlation. Therefore, in this paper, a series of Y3+-doped ceramic samples were prepared by the high-temperature solid-state reaction method using non-magnetic rare earth ions Y3+ to replace part of Cr3+. X-ray diffraction (XRD), Raman spectroscopy (Raman), scanning electron microscopy (SEM), X-ray photoelectron spectroscopy (XPS), and the physical property measurement system (PPMS) were used to systematically study the effect of Y3+ doping on the lattice structure, element valence state, microstructure, and magnetic properties of CuCrO2 with as little magnetic influence as possible. The correlation between the microstructure and magnetic transition was obtained, which provided theoretical and experimental evidence for its magnetic transition mechanism.
2. Materials and Methods
A series of CuCr1−xYxO2 (x = 0–0.02) ceramic samples was fabricated via the high-temperature solid-state reaction method using high-purity CuO (99.5%), Cr2O3 (99.9%), and Y2O3 (99.9%) nanopowders. The three powders were stoichiometrically weighed, and raw material powders with different doping concentrations were obtained by adjusting the ratio of Cr2O3 and Y2O3 powders. The three raw material powders were mixed and poured into an appropriate amount of alcohol so that the powder could be completely dispersed into the alcohol, then stirred with an electric stirrer for 24 h to mix the powder evenly. The mixed powder was placed in a drying oven at 85 °C for 24 h. After the alcohol was completely evaporated, the powder was ground for 30 min to make the powder fine enough. The powder was then calcined in a tube furnace in an argon atmosphere (20 mL/min) at a temperature of 900 °C for 12 h. After cooling, the powder was ground again to make the powder fine enough, and it was pressed under a pressure of 12 MPa to make a disc with a diameter of 15 mm. The final ceramic sample was obtained by calcining it in a tubular furnace in an argon atmosphere (20 mL/min) and at a temperature of 1300 °C for 12 h. The synthesized CuCr1−xYxO2 (x = 0–0.02) ceramics were systematically characterized for their microstructure and magnetic properties.
The phase composition of the CuCr1−xYxO2 (x = 0–0.02) ceramics was characterized using a DX-2700A X-ray diffractometer (Dandong HaoYuan Instrument, Dandong City, Liaoning Province, China in English) equipped with Cu-Kα radiation (λ = 1.5418 Å). The XRD data were fitted by GSASII software (version: 3fc6dc from 14 May 2024 14:57), and the changes in the unit cell parameters and crystal density were analyzed. The tube voltage and tube current of the diffractometer were 40 kV and 30 mA, respectively. The step angle was 0.02°, the sampling time was 0.6 s, and the test angle range was 20–80°. Vibrational characteristics were probed using an iHR550 Raman spectrometer (Horiba, South District, Kyoto, Japan) with 532 nm laser excitation, mapping phonon mode modifications across the doping concentrations. The fracture surface microstructure and grain boundary evolution were analyzed through a JSM-6510A analytical scanning electron microscope (JEOL, Toshima City, Tokyo, Japan) operated at 30 kV with the fracture surface magnified 1500 times. Surface chemical states were quantified by ESCALAB Xi+ XPS (Thermo Fisher Scientific, Waltham, Massachusetts, USA), which used a monochromatic X-ray source, with energy calibration referencing the adventitious C 1 s peak at 284.8 eV. Magnetic properties were investigated using the VSM module of a comprehensive physical properties measurement system (Quantum Design, San Diego, California, USA). The temperature dependence of the magnetic susceptibility of the samples in the temperature range of 4 K–290 K was measured under an external magnetic field of 500 Oe. The hysteresis loops at different temperatures (4 K, 26 K, 50 K, 135 K, 145 K, 290 K) were also tested.
3. Results and Discussion
3.1. XRD Spectra
The XRD patterns of the CuCr
1−xY
xO
2 (x = 0–0.02) ceramics are presented in
Figure 1a. All diffraction peaks exhibit sharp and well-defined profiles, indicative of highly crystalline sintered samples. No impurity phases associated with Y-containing compounds were detected, confirming the phase purity of the delafossite CuCrO
2 structure (PDF # 04-010-3330), which verifies the successful incorporation of Y
3+ into the host lattice without altering its crystallographic phase. A magnified view of the (012) diffraction peak is shown in
Figure 1b. Minimal peak shifts are observed for low doping levels (x = 0.0100), suggesting negligible lattice distortion at these concentrations. However, for x > 0.0100, systematic peak shifts toward lower angles occur, signifying progressive lattice expansion with increasing Y
3+ content. Notably, the (012) peak position shifts monotonically to lower angles at x = 0.0125 and 0.0150, consistent with the larger ionic radius of Y
3+ compared to Cr
3+. At higher concentrations (x = 0.0175 and 0.0200), however, a non-monotonic shift pattern emerges: initial displacement to higher angles followed by a return to lower angles. This anomaly implies an optimal doping threshold at x = 0.0150, beyond which lattice distortion becomes dominant. Such behavior likely originates from point defect formation (cation vacancies or oxygen vacancies) that disrupts long-range crystallographic ordering.
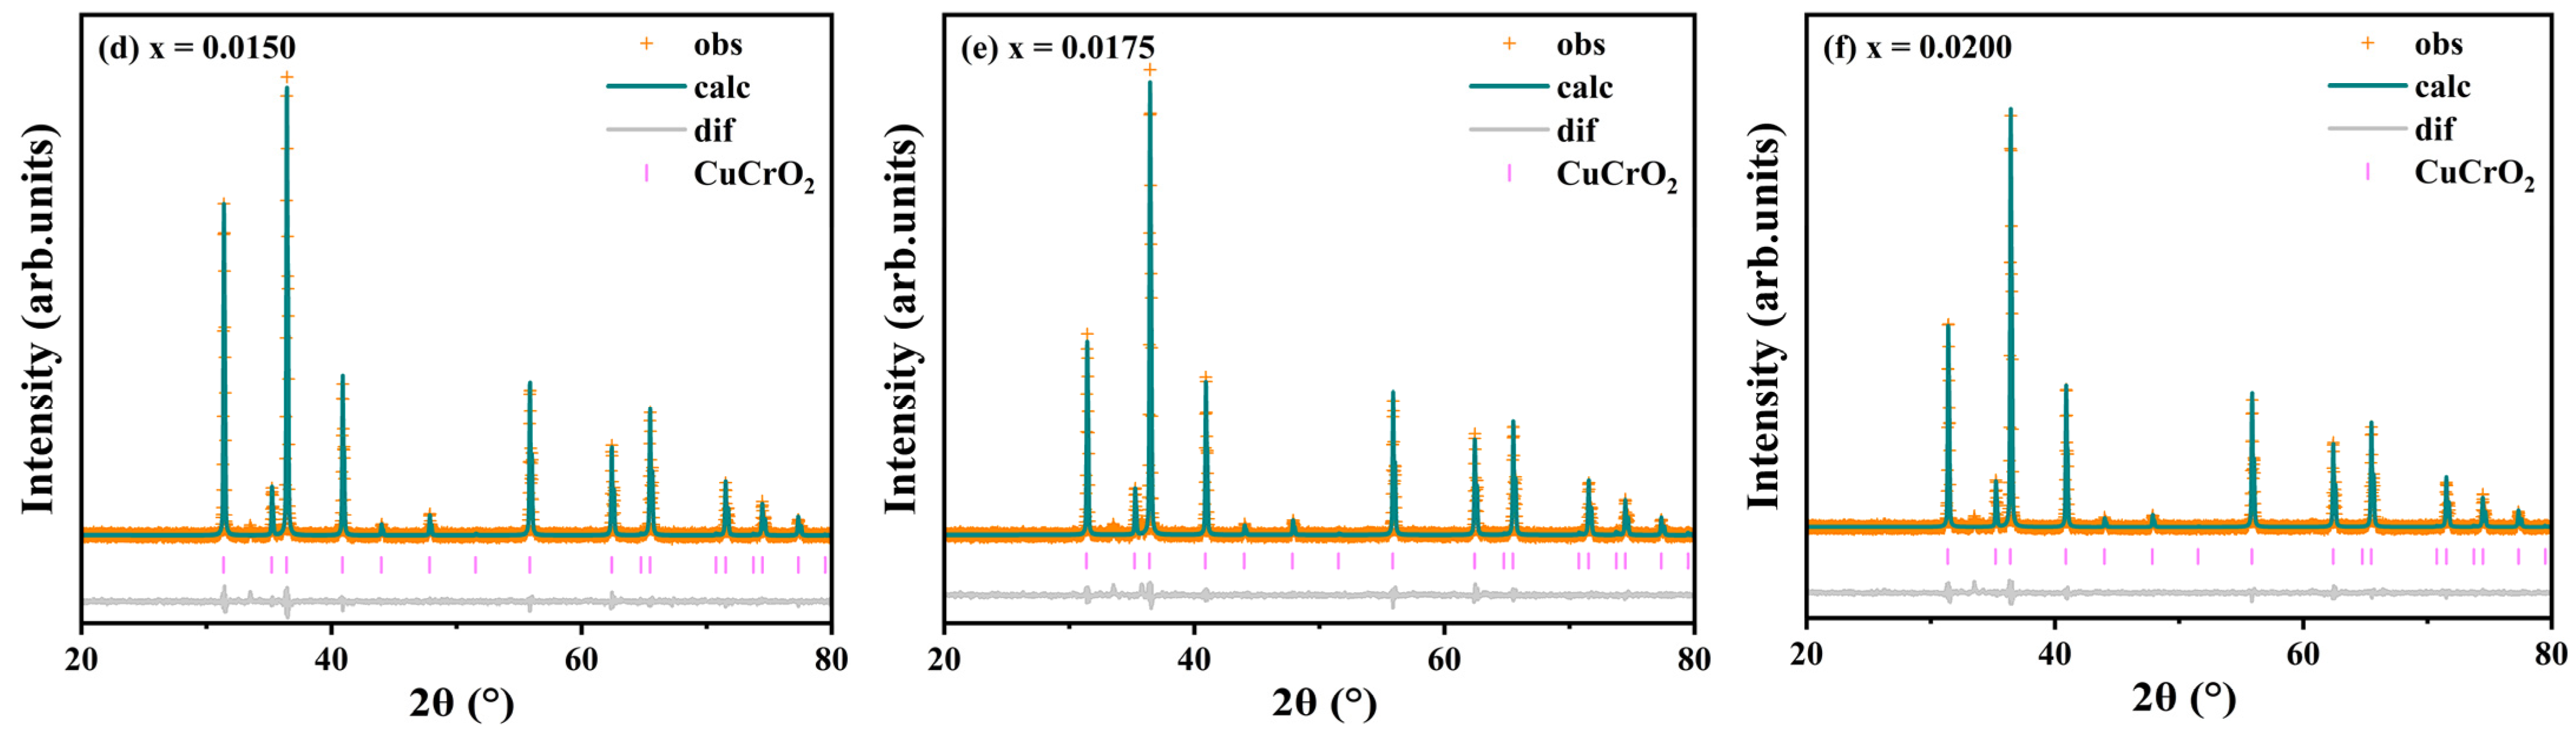
Rietveld refinement of the diffraction data was performed using GSASII software. The results are shown in
Figure 2 and
Table 1. The R
P parameters of all samples are less than 10%, and the GOF parameters are less than 2, which proves that the refinement results are reliable. The refinement results shown in
Table 1 show that Y
3+ doping leads to lattice expansion (from 130.928 Å
3 for x = 0 to 131.147 Å
3 for x = 0.0200) and a decrease in density (from 5.6758 g·cm
−3 for x = 0 to 5.6087 g·cm
−3 for x = 0.0200). This is consistent with the expected lattice structure change caused by large-radius Y
3+ doping, indicating that Y
3+ successfully entered the lattice and replaced Cr
3+. In addition, the c/a values of the doped samples are smaller than those of undoped samples, indicating that there is a clear preferential growth orientation in the doped samples.
The structural analysis confirms the successful substitution of Cr3+ by Y3+ in the CuCrO2 lattice without secondary phase formation, preserving the delafossite structure (PDF # 04-010-3330). Low Y3+ doping (x = 0.0100) minimally perturbs the lattice structure. However, for x > 0.0100, lattice expansion becomes evident. The optimal doping threshold is identified at x = 0.0150, beyond which lattice distortion emerges. Despite these distortions, the overall structural integrity remains preserved, as evidenced by the absence of secondary phases and maintained crystallographic stability.
3.2. Raman Spectroscopy
To further investigate the impact of Y
3+ doping on the lattice structure of CuCrO
2, Raman spectroscopy was conducted on the samples, as illustrated in
Figure 3. Four distinct vibrational bands are observed across all compositions: A
g (208 cm
−1), E
g (455 cm
−1), P
1 (533 cm
−1), and A
1g (704 cm
−1), consistent with prior studies [
24,
25]. The A
1g phonon mode corresponds to atomic vibrations along the Cu-O bond direction, while the E
g mode arises from vibrations perpendicular to the Cu-O bonds. The P
1 mode originates from the native intrinsic acceptor point defects in CuCrO
2 [
26]. These spectral features confirm that Y
3+ doping does not change the delafossite structure of CuCrO
2. However, increasing the Y
3+ concentration induces progressive attenuation of the E
g and A
1g mode intensities, accompanied by frequency downshifts. In contrast, the P
1 mode exhibits enhanced intensity until x = 0.0200, where its relative intensity normalizes, albeit with a significantly broadened full width at half-maximum. These observations indicate that Y
3+ doping substantially modulates phonon interactions and molecular polarization in CuCrO
2 ceramics [
27,
28], weakening (Cr, Y)-O bonding. However, Y
3+ doping does not change the delafossite structure of CuCrO
2, which is consistent with the results of XRD.
3.3. Scanning Electron Microscopy
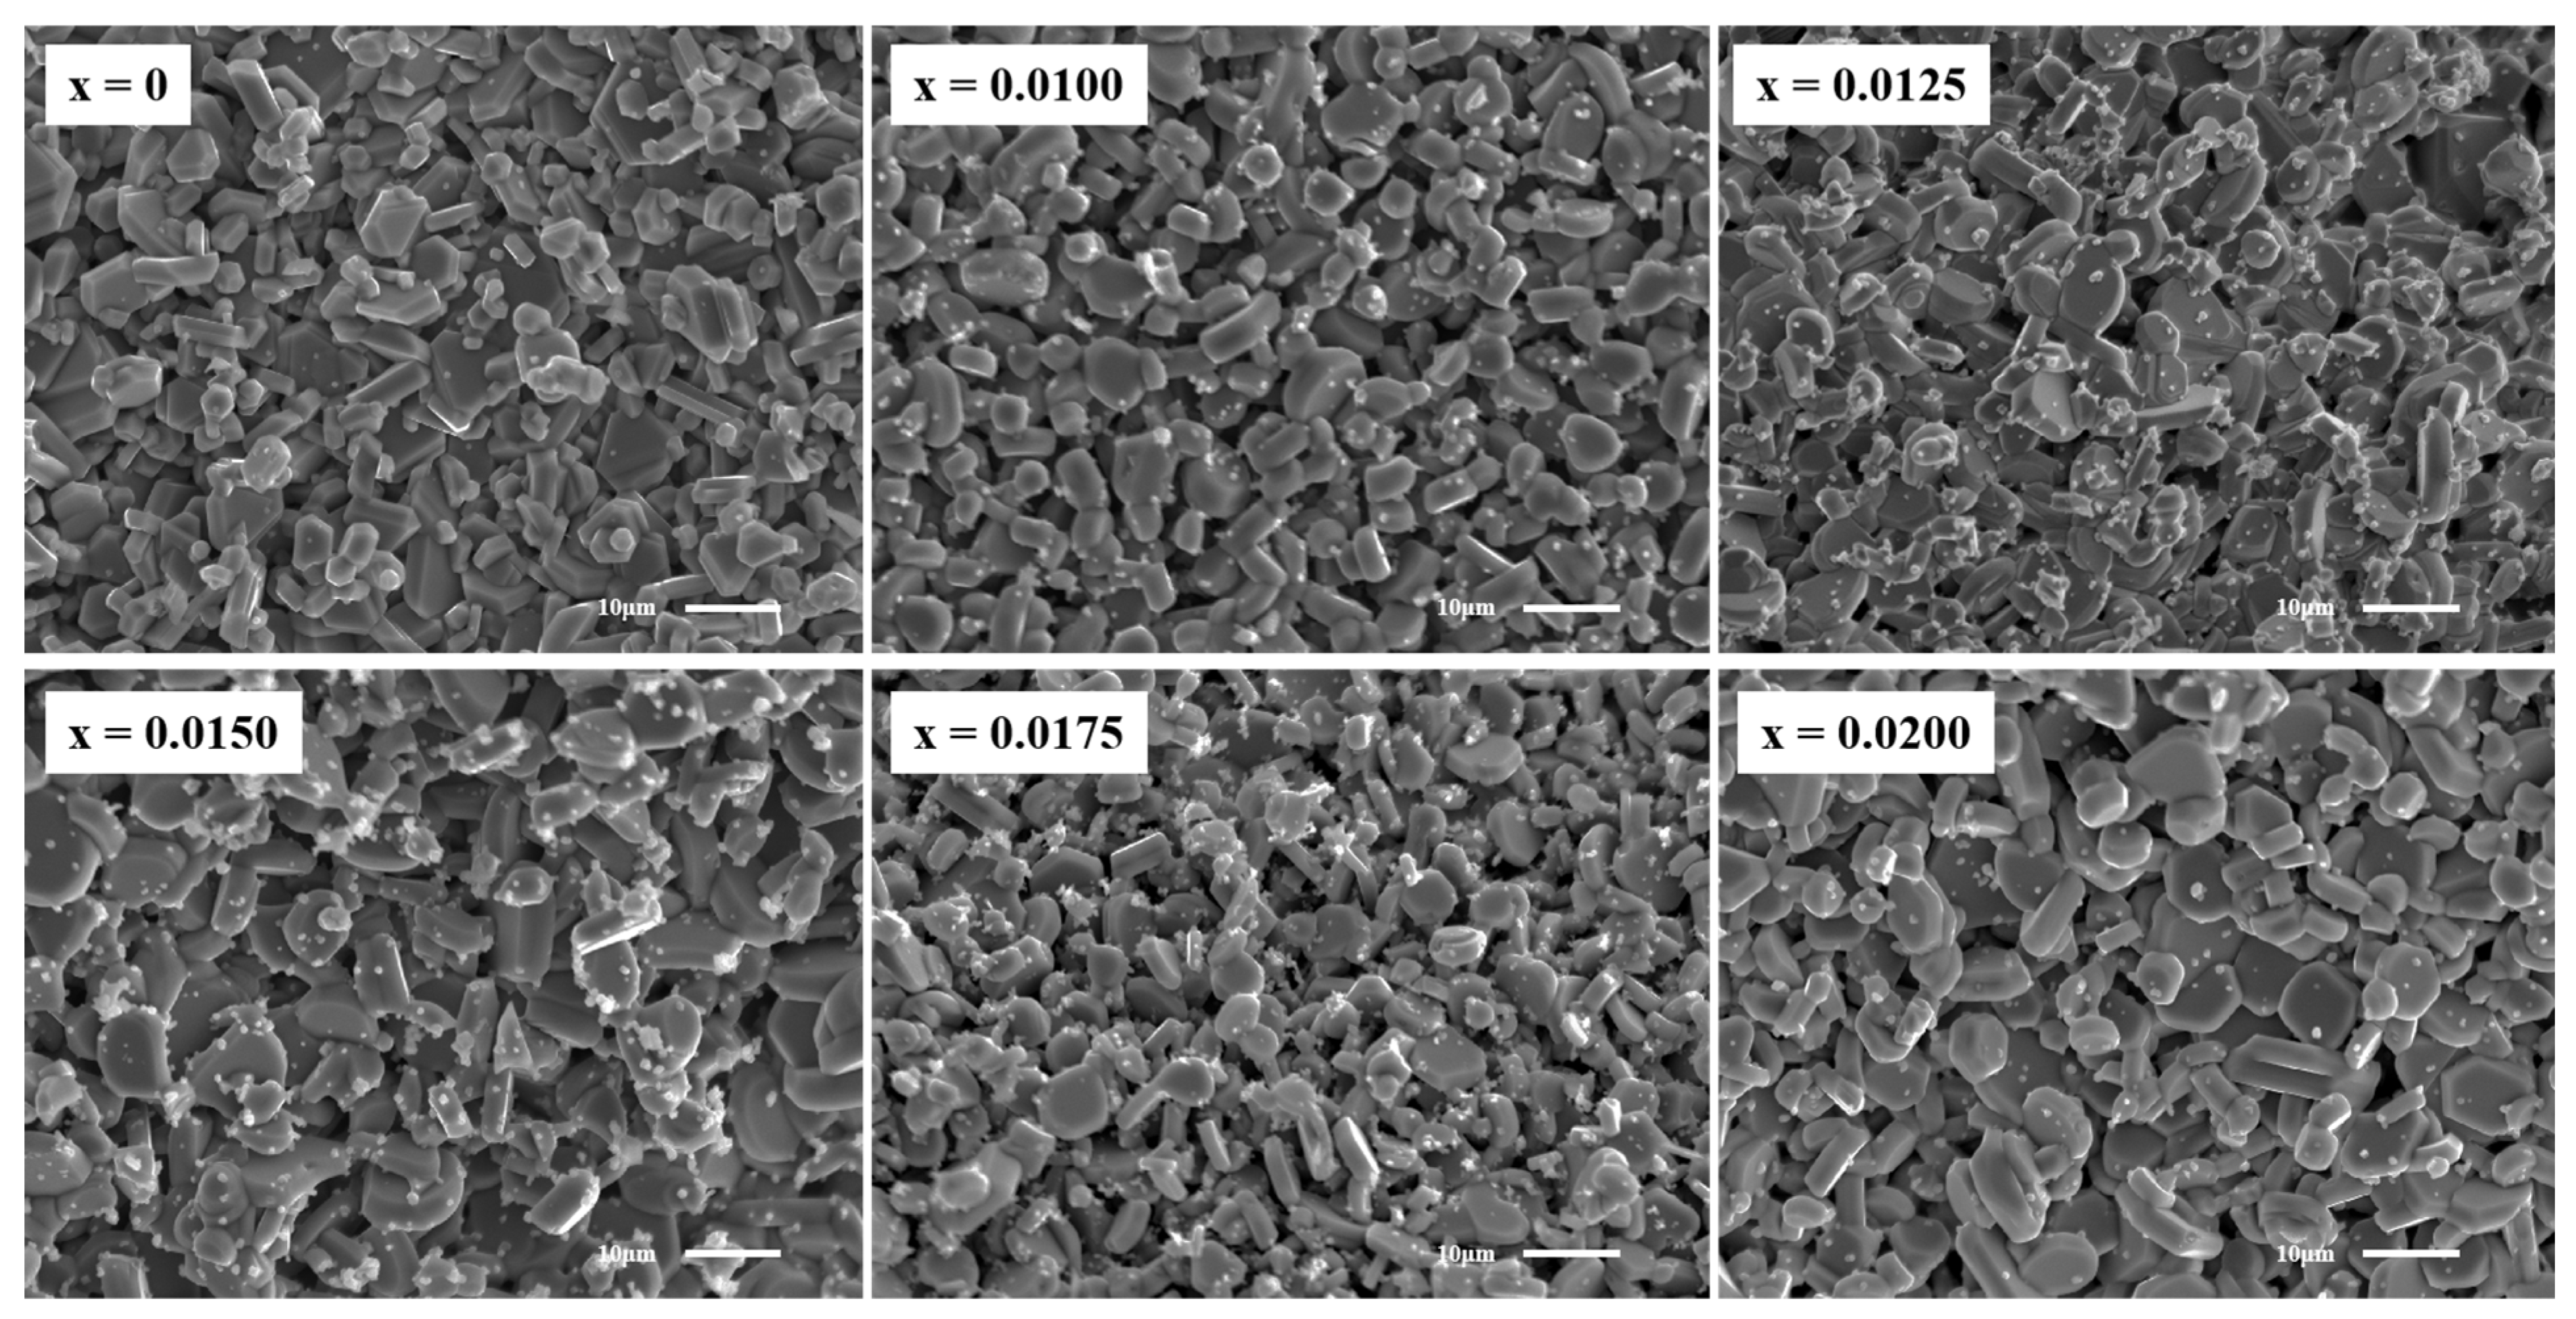
SEM images of the fracture surfaces of CuCr
1−xY
xO
2 (x = 0–0.02) ceramics are presented in
Figure 4. The undoped sample exhibits a smooth surface with well-defined interfaces, characteristic of a layered hexagonal structure. Pores formed during synthesis due to oxygen release are observed [
29,
30]. In contrast, Y
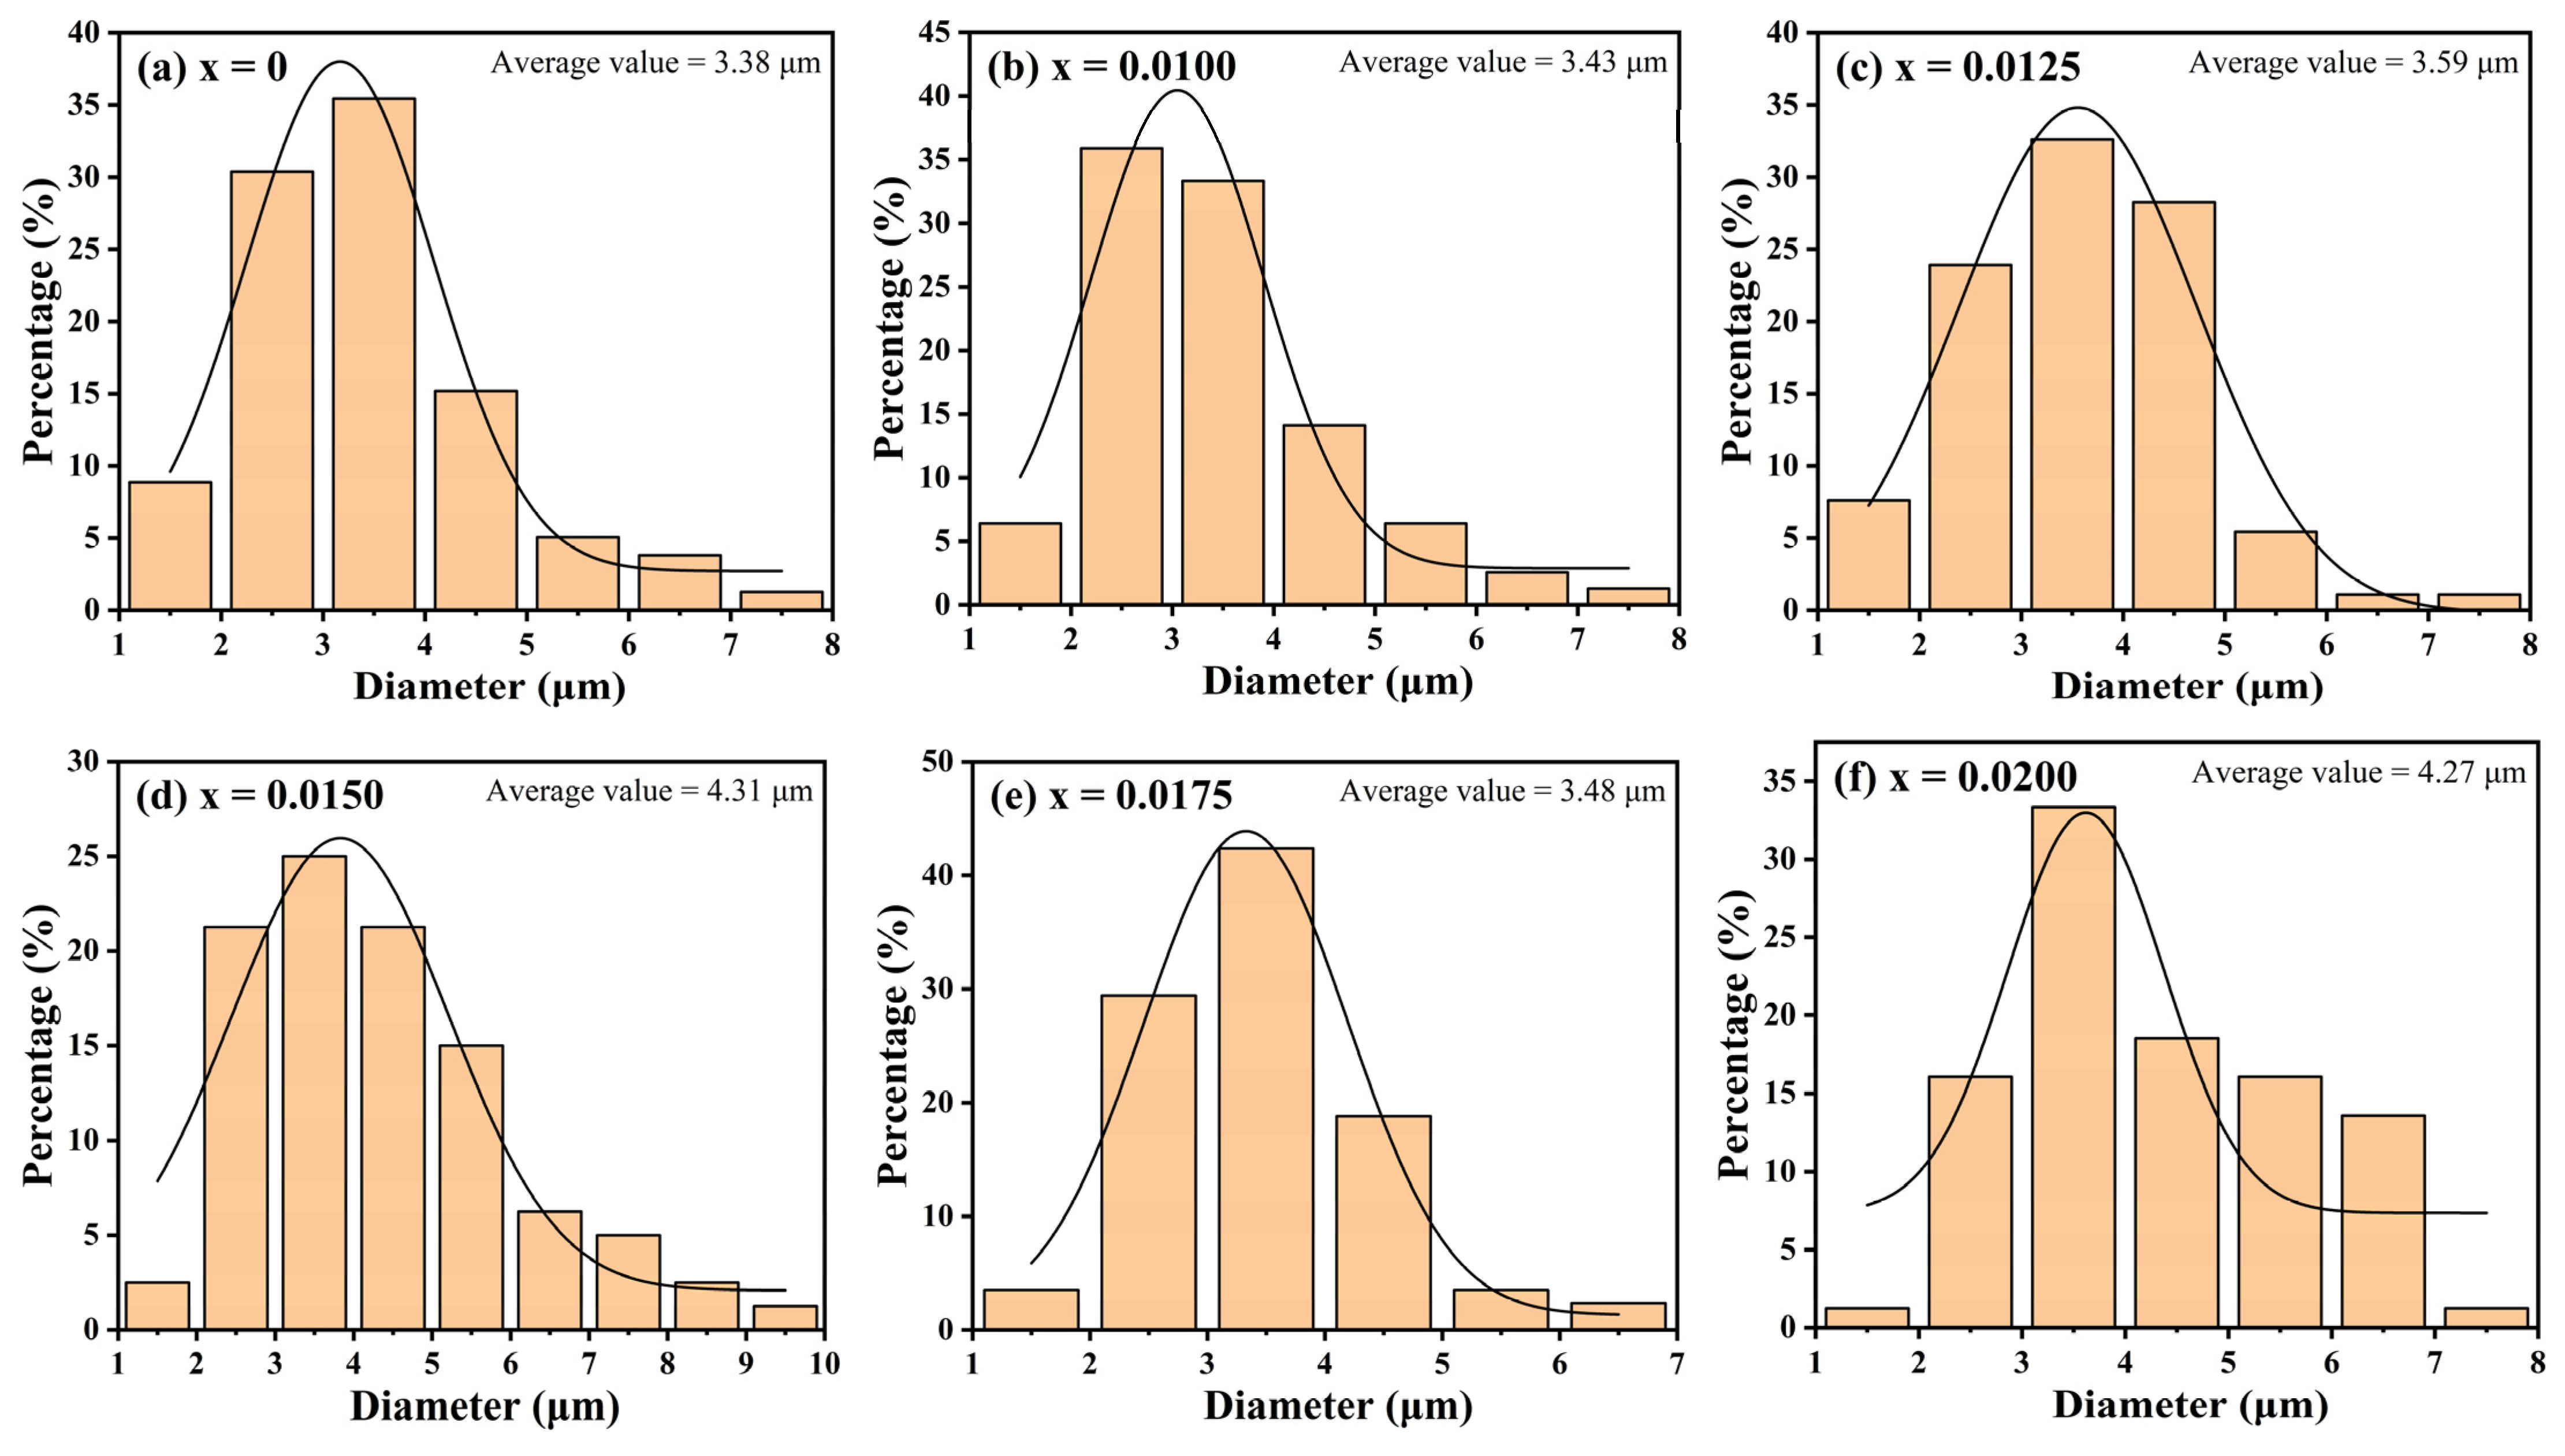
3+-doped samples display a gradual transition from hexagonal-phase to amorphous-phase growth, accompanied by blurred grain boundaries. To further analyze the effect of Y
3+ doping on the grain size, the SEM images were analyzed by ImageJ software (version: ij154-win-java8) and the average particle size was obtained. The results are shown in
Figure 5. The results show that doping significantly changes the grain size of the samples. The average grain size of all doped samples is larger than that of undoped samples, and with an increase in the doping concentration, it shows a linear growth trend (except for the sample with x = 0.0175). The results of the particle size analysis are consistent with the XRD diffraction pattern, which further confirms that Y
3+ doping leads to lattice expansion and a density reduction, hindering the synthesis of dense CuCrO
2 ceramics. Furthermore, Y
3+ incorporation impedes intergranular fusion, promoting the formation of small precipitates through liquid-phase recrystallization. The content of precipitates reaches the maximum when x = 0.0150. In summary, the SEM results confirm the significant effect of Y
3+ on the surface microstructure of CuCrO
2 ceramics.
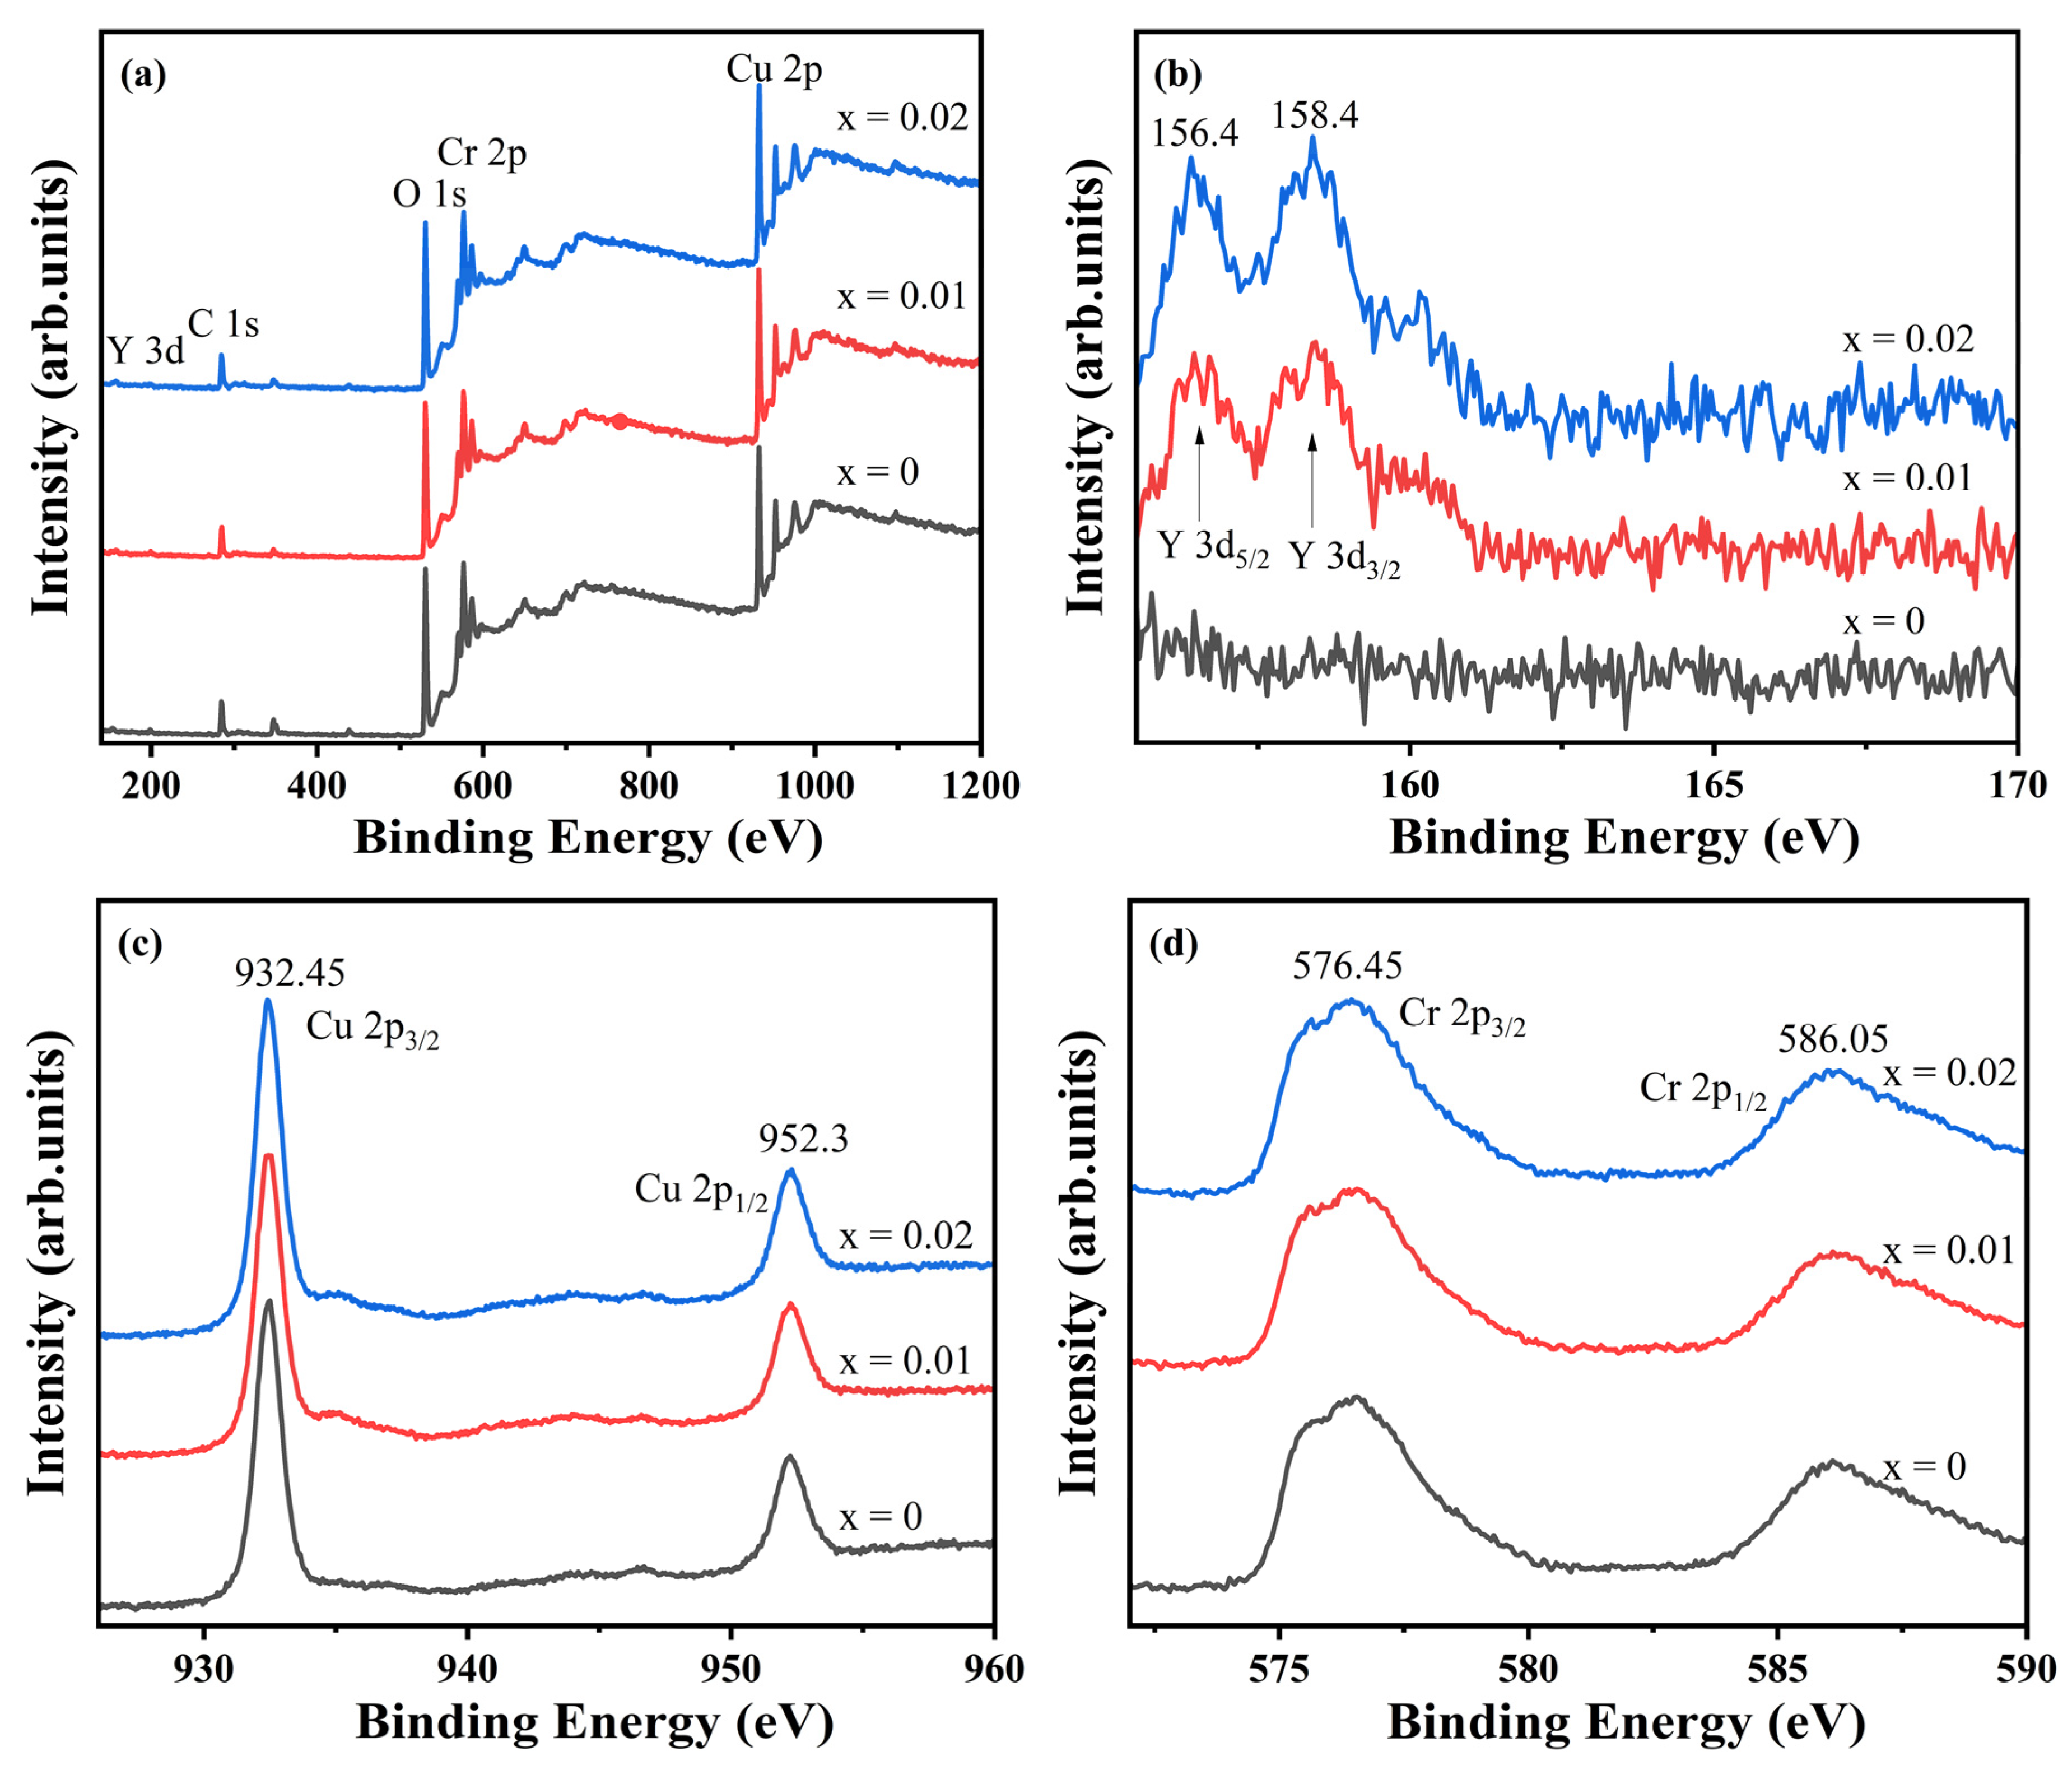
3.4. X-Ray Photoelectron Spectroscopy
To investigate the influence of doping on elemental valence states, X-ray photoelectron spectroscopy (XPS) was conducted on CuCr
1−xY
xO
2 (x = 0, x = 0.01, and x = 0.02) ceramic samples. The survey spectra and high-resolution Y 3d, Cu 2p, and Cr 2p spectra are shown in
Figure 6a–d. The undoped sample exhibits XPS signals exclusively from C, O, Cr, and Cu, with no detectable impurities. In contrast, Y signals emerge in the doped compositions (x = 0.01 and 0.02), confirming successful Y incorporation as designed. Carbon detection across all samples originates from ambient surface contamination. The Y 3d spectra (
Figure 6b) display two sharp, symmetric peaks at 156.4 eV (Y 3d
5/2) and 158.4 eV (Y 3d
3/2), where Y 3d
5/2 indicates that the Y element is +3 valence [
31]. The Cu 2p spectra (
Figure 6c) reveal characteristic peaks at 932.45 eV and 952.30 eV, corresponding to Cu
+ [
32,
33], with no satellite features near 940 eV that would indicate Cu
2+. Similarly, the Cr 2p spectra (
Figure 6d) exhibit peaks at 576.45 eV (2p
3/2) and 586.05 eV (2p
1/2), confirming Cr
3+ valence states [
34,
35]. These findings collectively demonstrate preserved +3 oxidation states for Y and Cr alongside +1 valence for Cu. Combined with prior structural analyses, this confirms single-phase CuCrO
2 formation where Y
3+ substitutes for Cr
3+ in the lattice without inducing valence state alterations in the constituent elements, despite the observed lattice expansion effects [
36].
3.5. Magnetic Properties
Figure 7a illustrates the temperature-dependent magnetic susceptibility χ of CuCr
1−xY
xO
2 (x = 0–0.02) ceramic samples across 4–290 K. For the undoped specimen, χ demonstrates a linear enhancement with decreasing temperature above 50 K, reaching a maximum value that signifies paramagnetic behavior. Upon further cooling, a progressive reduction in χ emerges, accompanied by a transition from paramagnetic to antiferromagnetic characteristics. The Néel temperature T
N of the undoped sample was determined as ~46 K, which exhibits elevation compared with previous reports [
17,
37]. This observation suggests that the 1300 °C sintering temperature critically modifies the low-temperature magnetic properties of CuCrO
2, effectively enhancing T
N and stabilizing the antiferromagnetic order. In contrast, Y
3+-doped specimens manifest distinctly different χ evolution trends, indicating that Y
3+ substitution substantially alters the magnetic ground state of CuCrO
2.
A distinct linear enhancement of χ with decreasing temperature above 140 K is observed across the doped samples, indicative of a characteristic paramagnetic response. Below this critical temperature, χ increases sharply and no longer increases linearly. After reaching the peak value, the magnetic susceptibility decreases gradually again, showing obvious antiferromagnetism. The χ-T curve of the doped sample shows that near 140 K, due to the introduction of non-magnetic Y3+, lattice expansion or even distortion occurs, which destroys the long-range antiferromagnetic order; this results in some magnetic moments that cannot be completely offset, forming short-range order or spin tilt, so the doped sample exhibits higher magnetic susceptibility. The x = 0.0175 sample exhibits TN ~21 K, while other doped counterparts demonstrate TN~30 K, with an additional distinctive peak emergence at 11 K for the x = 0.0100 specimen. Notably, the doped systems display marked suppression of TN when compared to undoped CuCrO2. These findings indicate that Y3+ doping weakens the antiferromagnetic stability of CCO ceramics at low temperatures, which changes the original magnetic configuration and interaction of spin-triangular-lattice CuCrO2 ceramics, thus forming new magnetic transition points.
The Curie–Weiss temperatures (T
θ) derived from a linear regression analysis of χ
−1-T curves (
Figure 7b) within the paramagnetic regime are summarized in
Table 2. All specimens exhibit negative T
θ values, and Y
3+ doping leads to a decrease in T
θ. Except for the x = 0.0150 and x = 0.0175 compositions, the T
θ value gradually decreases with an increase in the doping concentration. This means that the antiferromagnetic interaction mainly exists in CuCr
1−xY
xO
2 (x = 0–0.02) ceramics, and the antiferromagnetic interaction mainly comes from the superexchange interaction of Cr-O-Cr, so an increase in the doping concentration enhances this effect.
To elucidate the influence of Y
3+ doping on the magnetic characteristics of CuCrO
2 ceramics,
Figure 8 presents magnetic hysteresis loops measured under a ±5000 Oe applied field at different temperatures (4 K, 26 K, 50 K, 135 K, 145 K, and 290 K). All specimens exhibit linear M-H relationships without magnetic saturation, differing solely in their slope magnitudes. Compared with that for the undoped sample, the change in the hysteresis loop slope increases obviously when the doped sample decreases from 145 K to 50 K. The curve slopes of 26 K and 50 K are the largest in all samples, corresponding to T
N, which is consistent with the trend of the χ-T curve. It can be seen that all samples are paramagnetic at 290 K and exhibit obvious antiferromagnetism at other temperatures. As the temperature drops to 26–50 K, the magnetic susceptibility reaches its maximum, and no ferromagnetic phase appears across the entire temperature range.
The collective evidence demonstrates that Y3+ doping profoundly modifies the magnetic transitions in CuCr1−xYxO2 (x = 0–0.02) ceramics. While the lattice expansion and structural distortion induced by dopant incorporation preserve the delafossite framework and oxidation states of Cu/Cr, they induce geometric reorganization of Cr-O-Cr bonding configurations through bond angle modification. Concurrently, the non-magnetic Y3+ ions spatially decouple adjacent Cr3+ moments, creating magnetic isolation effects. The intrinsic antiferromagnetic order of spin-frustrated CuCrO2 multiferroic materials comes from the superexchange interaction of Cr-O-Cr. Therefore, Y3+ doping leads to a change in superexchange interactions, and some magnetic moments cannot be completely offset, forming a short-range order or spin tilt; thus, the doped samples show stronger antiferromagnetism but also weakened antiferromagnetic stability at low temperature.
4. Conclusions
A series of CuCr1−xYxO2 (x = 0–0.02) ceramic samples was synthesized via the solid-state reaction method. All specimens exhibited phase-pure delafossite structures, with no secondary phases detected. Y3+ doping led to lattice expansion. The cell volume increased from 130.928 Å3 for x = 0 to 131.147 Å3 for x = 0.0200, the density decreased from 5.6758 g·cm−3 for x = 0 to 5.6087 g·cm−3 for x = 0.0200, and the average grain size decreased from 3.38 μm for x = 0 to 4.27 μm for x = 0.0200. Y3+ doping did not change the lattice structure of CuCrO2, but with an increase in the doping concentration, the mutual fusion between grains was also affected. Liquid-phase recrystallization made some small precipitates appear in the sample and gradually increased with an increase in the doping concentration. The content of precipitates reached the maximum in the sample with x = 0.0150. An XPS analysis confirmed monovalent Cu⁺ and trivalent Y3+/Cr3+ states, excluding divalent copper species. All samples showed obvious paramagnetism when the temperature was higher than 140 K. However, when the temperature was lower than 140 K, the lattice expansion and lattice distortion caused by Y3+ doping changed the bond angle of the Cr-O-Cr bond and enhanced the superexchange interaction of Cr-O-Cr, resulting in some magnetic moments not being completely offset. As a result, a short-range order or spin tilt formed, enhancing the antiferromagnetism of the sample but also weakening its antiferromagnetic stability at low temperature. The TN of the undoped sample was about 46 K. The TN of the sample with x = 0.0175 was about 21 K, while the TN of the other doped samples was about 30 K. The sample with x = 0.0100 also had an obvious peak at 11 K. In addition, it was found that sintering at 1300 °C significantly enhanced the antiferromagnetic stability of CuCrO2 and increased the Néel temperature TN. This study confirmed that low-concentration Y3+ doping can fine-tune the lattice structure of CuCrO2 ceramics without destroying the main phase and regulate its magnetic transition, which provides a new idea for regulating and improving the magnetic properties of CuCrO2 by rare earth element doping.
Author Contributions
Conceptualization, H.L. and D.X.; Data curation, H.L.; Formal analysis, S.Y. and G.X.; Funding acquisition, S.X. and D.X.; Investigation, H.L.; Methodology, H.L. and K.L.; Project administration, S.X. and D.X.; Resources, W.D., S.X. and D.X.; Software, K.Z.; Supervision, D.X. and W.D.; Validation, G.X. and Y.S.; Visualization, H.L.; Writing—original draft, H.L.; Writing—review and editing, H.L., D.X. and W.D. All authors have read and agreed to the published version of the manuscript.
Funding
This research was funded by the National Natural Science Foundation of China under Grant No. U23A20549, the National Natural Science Foundation of China under Grant No. 12265005, and the Guangxi Natural Science Foundation under Grant No. 2022GXNSFBA035447.
Institutional Review Board Statement
Not applicable.
Informed Consent Statement
Not applicable.
Data Availability Statement
The original contributions presented in this study are included in the article. Further inquiries can be directed to the corresponding author.
Conflicts of Interest
The authors declare that they have no known competing financial interests or personal relationships that could have appeared to influence the work reported in this paper.
References
- Eerenstein, W.; Mathur, N.D.; Scott, J.F. Multiferroic and magnetoelectric materials. Nature 2006, 442, 759–765. [Google Scholar] [CrossRef] [PubMed]
- Vaz, C.A.F.; Hoffman, J.; Ahn, C.H.; Ramesh, R. Magnetoelectric coupling effects in multiferroic complex oxide composite structures. Adv. Mater. 2010, 22, 2900–2918. [Google Scholar] [CrossRef] [PubMed]
- Vopson, M.M. Fundamentals of multiferroic materials and their possible applications. Crit. Rev. Solid. State Mater. Sci. 2015, 40, 223–250. [Google Scholar] [CrossRef]
- Curie, P. Sur la symétrie dans les phénomènes physiques, symétrie d’un champ électrique et d’un champ magnétique. J. Phys. Théo. Appl. 1894, 3, 393–415. [Google Scholar] [CrossRef]
- Zhang, M.; Zhu, G.; Dai, J.; Zhu, X.; Liu, Q.; Li, Q. Fabrication and electrochemical performance of delafossite CuFeO2 particles as a stable anode material for lithium-ion batteries. J. Mater. Sci. Mater. Electron. 2018, 29, 19454–19460. [Google Scholar] [CrossRef]
- Xin, S.; Huo, S.; Xin, Y.; Gao, M.; Wang, Y.; Liu, W.; Zhang, C.; Ma, X. Heterogeneous photo-electro-Fenton degradation of tetracycline through nitrogen/oxygen self-doped porous biochar supported CuFeO2 multifunctional cathode catalyst under visible light. Appl. Catal. B Environ. 2022, 312, 121442. [Google Scholar] [CrossRef]
- Antonoglou, O.; Lafazanis, K.; Mourdikoudis, S.; Vourlias, G.; Lialiaris, T.; Pantazaki, A.; Dendrinou-Samara, C. Biological relevance of CuFeO2 nanoparticles: Antibacterial and anti-inflammatory activity, genotoxicity, DNA and protein interactions. Mater. Sci. Eng. C 2019, 99, 264–274. [Google Scholar] [CrossRef]
- Karmakar, K.; Sarkar, A.; Mandal, K.; Khan, G.G. Nano-engineering of p–n CuFeO2-ZnO heterojunction photoanode with improved light absorption and charge collection for photoelectrochemical water oxidation. Nanotechnology 2017, 28, 325401. [Google Scholar] [CrossRef]
- Kandpal, H.C.; Seshadri, R. First-principles electronic structure of the delafossites ABO2 (A = Cu, Ag, Au; B = Al, Ga, Sc, In, Y): Evolution of d10–d10 interactions. Solid. State Sci. 2002, 4, 1045–1052. [Google Scholar] [CrossRef]
- Okuda, T.; Jufuku, N.; Hidaka, S.; Terada, N. Magnetic, transport, and thermoelectric properties of the delafossite oxides. Phys. Rev. B 2005, 72, 144403. [Google Scholar] [CrossRef]
- Joshi, T.; Senty, T.R.; Trappen, R.; Zhou, J.; Chen, S.; Ferrari, P.; Borisov, P.; Song, X.; Holcomb, M.B.; Bristow, A.D.; et al. Structural and magnetic properties of epitaxial delafossite CuFeO2 thin films grown by pulsed laser deposition. J. Appl. Phys. 2015, 117, 013908. [Google Scholar] [CrossRef]
- Zhu, B.; Wang, Z.; Zhang, Y.; Yu, Z.; Shi, J.; Xiong, R. Low temperature fabrication of the giant dielectric material CaCu3Ti4O12 by oxalate coprecipitation m ethod. Mater. Chem. Phys. 2009, 113, 746–748. [Google Scholar] [CrossRef]
- Zhu, B.; Xu, J.; Li, Y.; Wang, T.; Xiong, K.; Lee, C.; Yang, X.; Shiiba, M.; Takeuchi, S.; Zhou, Q.; et al. Micro-particle manipulation by single beam acoustic tweezers based on hydrothermal PZT thick film. AIP Adv. 2016, 6, 035102. [Google Scholar] [CrossRef] [PubMed]
- Zhu, B.; Li, D.; Zhou, Q.F.; Shi, J.; Shung, K.K. Piezoelectric PZT thick films on LaNiO3 buffered stainless steel foils for flexible device applications. J. Phys. Appl. Phys. 2009, 42, 025504. [Google Scholar] [CrossRef]
- Zhu, B.; Zhou, Q.; Shung, K.K.; Wei, Q.; Huang, Y.H. Sol-gel derived PMN-PT thick film for high frequency ultrasound transducer applications. In Proceedings of the 2009 IEEE International Ultrasonics Symposium, Rome, Italy, 20–23 September 2009; IEEE: Piscataway, NJ, USA, 2009; pp. 2197–2200. [Google Scholar]
- Zhu, B.; Tang, Z.; Zhao, L.; Wang, L.-L.; Li, C.-Z.; Yin, D.; Yu, Z.-X.; Tang, W.-F.; Xiong, R.; Shi, J.; et al. Synthesis of Mg[Ti2]O4 by spark plasma sintering. Mater. Lett. 2007, 61, 578–581. [Google Scholar] [CrossRef]
- Seki, S.; Onose, Y.; Tokura, Y. Spin-driven ferroelectricity in triangular lattice antiferromagnets ACrO2 (A = Cu, Ag, Li, or Na). Phys. Rev. Lett. 2008, 76, 073702. [Google Scholar]
- Quirion, G.; Plumer, M.L.; Petrenko, O.A.; Balakrishnan, G.; Proust, C. Magnetic phase diagram of magnetoelectric CuFeO2 in high magnetic fields. Phys. Rev. B 2009, 80, 064420. [Google Scholar] [CrossRef]
- Kimura, K.; Nakamura, H.; Ohgushi, K.; Kimura, T. Magnetoelectric control of spin-chiral ferroelectric domains in a triangular lattice antiferromagnet. Phys. Rev. B 2008, 78, 140401. [Google Scholar] [CrossRef]
- Elkhouni, T.; Amami, M.; Strobel, P.; Ben Salah, A. Effect of Zn substitution on the structural and physical properties of delafossite-type oxide CuCrO2. J. Supercond. Nov. Magn. 2014, 27, 1111–1118. [Google Scholar] [CrossRef]
- Elkhouni, T.; Amami, M.; Strobel, P.; Ben Salah, A. Structural, raman spectroscopy, and magnetic ordering in new delafossite-type oxide CuCr1−xTi2O2 (0 ≤ x ≤ 0.1). J. Supercond. Nov. Magn. 2013, 26, 2795–2802. [Google Scholar] [CrossRef]
- Gao, C.; Lin, F.; Zhou, X.; Shi, W.; Liu, A. Fe concentration dependences of microstructure and magnetic properties for Cu(Cr1−xFex)O2 ceramics. J. Alloys Compd. 2013, 565, 154–158. [Google Scholar] [CrossRef]
- Zhang, L.; Hong, X.; Saeed Ahmad, A.; Chen, L.; Xiong, D. Microstructure and magnetic properties of multiferroic CuCr1−xSnxO2 (x = 0–0.05) ceramics. J. Magn. Magn. Mater. 2022, 560, 169653. [Google Scholar] [CrossRef]
- Monteiro JF, H.L.; Siqueira, E.C.; Vallis, D.S.; de Andrade, E.; Barcote, M.V.W.; Jurelo, A.R. Raman spectroscopy of (Fe,Li)-doped delafossite oxide CuCrO2. Vib. Spectrosc. 2018, 98, 77–81. [Google Scholar] [CrossRef]
- Shah, A.A.; Parveen, A.; Alvi, P.A.; Azam, A. Low temperature synthesis and effect of Co doping on structural, optical and dielectric properties of CuCrO2 hexagonal nanoplates. Ceram. Int. 2020, 46, 19827–19834. [Google Scholar] [CrossRef]
- Van Hoang, D.; Tuan Thanh Pham, A.; Huu Nguyen, T.; Bach Phan, T.; Cao Tran, V. Impact of Zn doping on the structural properties and thermoelectric performance of CuCr0.85 Mg(0.15−x) Znx O2 (x ≤ 0.05) delafossite materials. Adv. Compos. Mater. 2024, 33, 778–793. [Google Scholar] [CrossRef]
- Sui, X.; He, W.; Zuo, C.; Chen, Q.; Gu, G. 10.6μm infrared light photoinduced insulator-to-metal transition in vanadium dioxide. Infrared Phys. Technol. 2014, 64, 103–107. [Google Scholar] [CrossRef]
- Li, N.; Hu, X.; Lu, Y.; Ren, M.; Luo, X.; Ji, Y.; Chen, Q.; Sui, X. Wavelength-selective near-infrared organic upconversion detectors for miniaturized light detection and visualization. Adv. Funct. Mater. 2024, 34, 2411626. [Google Scholar] [CrossRef]
- Nisiro, D.; Fabbri, G.; Celotti, G.C.; Bellosi, A. Influence of the additives and processing conditions on the characteristics of dense SnO2 based ceramics. J. Mater. Sci. 2003, 38, 2727–2742. [Google Scholar] [CrossRef]
- Zhang, L.; Tan, X.; Xiong, D.; Chen, Z.; Xu, S.; Deng, W. Study of the effect of synthetic procedure on microstructure, defects and magnetism of multiferroic CuFeO2 ceramics. Appl. Phys. A 2018, 124, 353. [Google Scholar] [CrossRef]
- Huang, B.; Wu, L.; Ren, H.; Zhang, Q.; Lin, H.; Xu, S.; Xiong, D.; Deng, W. Effect of Y3+ doping of rare earth element on microstructure and antiferromagnetism of CuFeO2 ceramics. Ceram. Int. 2024, 50, 9372–9379. [Google Scholar] [CrossRef]
- Platzman, I.; Brener, R.; Haick, H.; Tannenbaum, R. Oxidation of polycrystalline copper thin films at ambient conditions. J. Phys. Chem. C 2008, 112, 1101–1108. [Google Scholar] [CrossRef]
- Jang, Y.J.; Park, Y.B.; Kim, H.E.; Choi, Y.H.; Choi, S.H.; Lee, J.S. Oxygen-intercalated CuFeO2 photocathode fabricated by hybrid microwave annealing for efficient solar hydrogen production. Chem. Mater. 2016, 28, 6054–6061. [Google Scholar] [CrossRef]
- Ruttanapun, C.; Charoenphakdee, A.; Nisoa, M.; Muthitamongkol, P.; Thanachayanont, C.; Maensiri, S. Effect of strong correlation of Mg2+ doped into Cr3+ sites of CuCrO2 on thermoelectric properties. Integr. Ferroelectr. 2015, 165, 45–52. [Google Scholar] [CrossRef]
- Allen, G.C.; Curtis, M.T.; Hooper, A.J.; Tucker, P.M. X-Ray photoelectron spectroscopy of chromium–oxygen systems. J. Chem. Soc. Dalton Trans. 1990, 16, 675–1683. [Google Scholar] [CrossRef]
- Jolley, J.G.; Geesey, G.G.; Hankins, M.R.; Wright, R.B.; Wichlacz, P.L. Auger electron and X-ray photoelectron spectroscopic study of the biocorrosion of copper by alginic acid polysaccharide. Appl. Surf. Sci. 1989, 37, 469–480. [Google Scholar] [CrossRef]
- Albaalbaky, A.; Kvashnin, Y.; Ledue, D.; Patte, R.; Frésard, R. Magnetoelectric properties of multiferroic CuCrO2 studied by means of ab initio calculations and Monte Carlo simulations. Phys. Rev. B 2017, 96, 064431. [Google Scholar] [CrossRef]
| Disclaimer/Publisher’s Note: The statements, opinions and data contained in all publications are solely those of the individual author(s) and contributor(s) and not of MDPI and/or the editor(s). MDPI and/or the editor(s) disclaim responsibility for any injury to people or property resulting from any ideas, methods, instructions or products referred to in the content. |
© 2025 by the authors. Licensee MDPI, Basel, Switzerland. This article is an open access article distributed under the terms and conditions of the Creative Commons Attribution (CC BY) license (https://creativecommons.org/licenses/by/4.0/).


 and
and 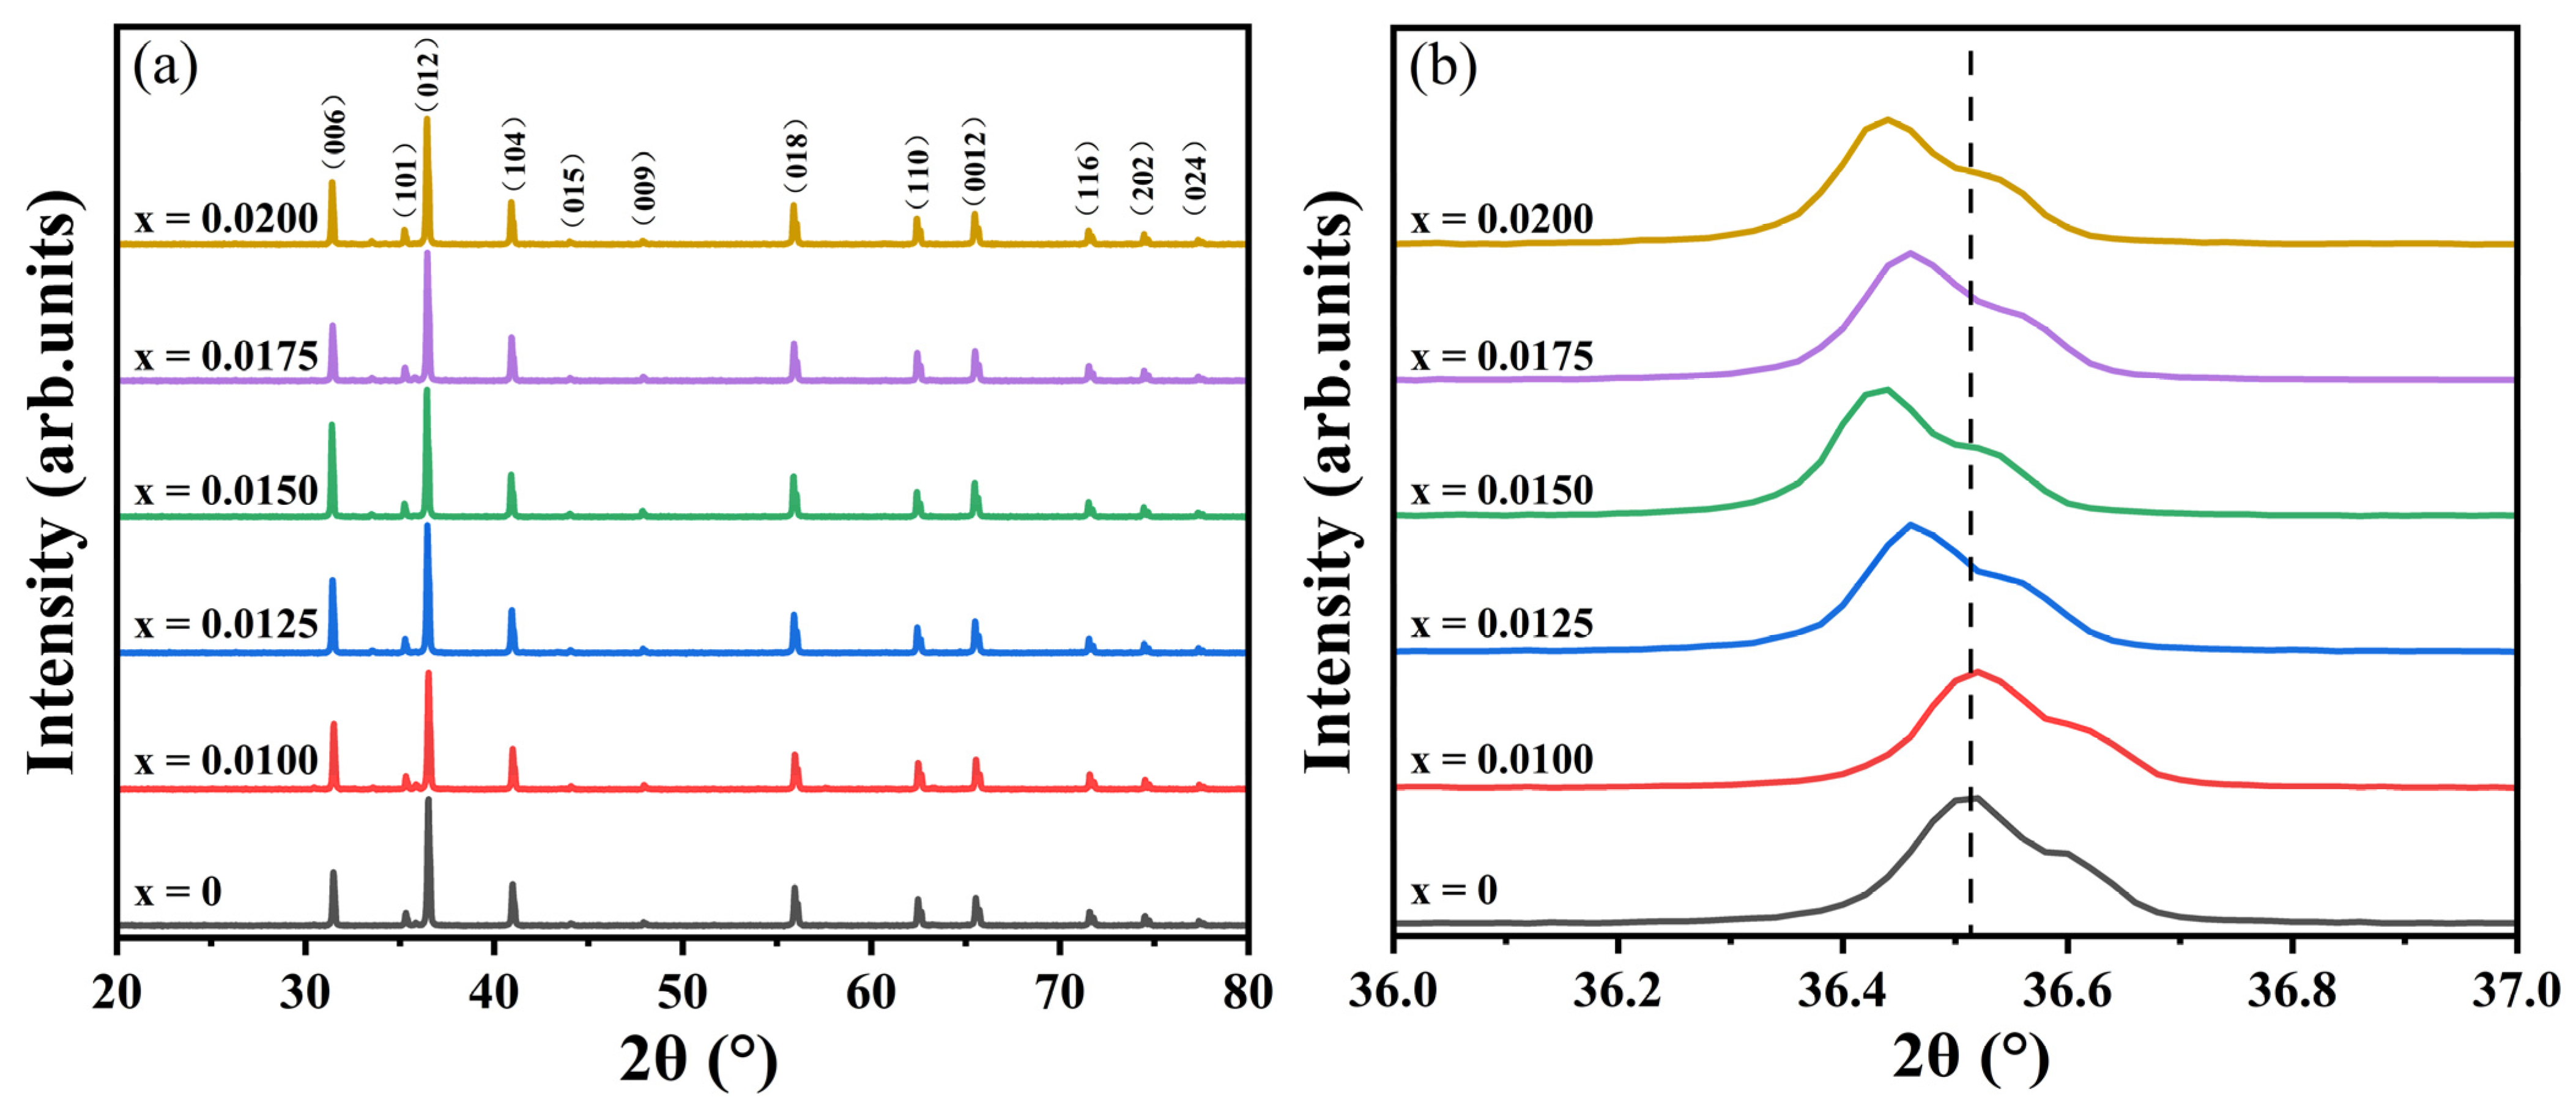


