Communication

Double Domes of Mesoscopic Localized Anisotropic Lattice Strain in HCP–Ag75Al25 Under Uniaxial Compression

1
Graduate School of China Academy of Engineering Physics, Beijing 100193, China
2
Center for High Pressure Science and Technology Advanced Research, Shanghai 201203, China
*
Author to whom correspondence should be addressed.
Materials 2025, 18(7), 1650; https://doi.org/10.3390/ma18071650
Submission received: 17 February 2025 / Revised: 28 March 2025 / Accepted: 1 April 2025 / Published: 3 April 2025

Abstract

:
The anisotropic strain development and releasing process in materials is largely related to their intrinsic mechanical properties and mesoscale grain interactions. Uniaxial compression can induce a large amount activation energy in a system, which builds up anisotropic elastic strain. This is especially common in a hexagonal close-packed (HCP) system. Utilizing the X-ray diffraction technique, we investigated the double-dome shaped evolution of its anomalous anisotropic strain when compressing a polycrystalline HCP–silver–aluminum (Ag75Al25) alloy up to 40 GPa. Analysis of the pressure-dependent grain size showed that the anisotropic strain relaxation was accompanied with grain-size refinement. This was a strong indication of microscopic structural anisotropy impacting both the mesoscopic mechanical properties and the macroscopic fracture behavior under uniaxial compression. Our findings provide valuable novel insights for further studies on materials with anisotropic mechanical properties.

1. Introduction

Aggregated granular materials usually display inhomogeneous stress–strain behavior [1] from micro- to macroscopic structure scale [2]. Due to the large difference in elastic modulus along different crystallographic directions, the hexagonal close-packed (HCP) lattice has a large anisotropic lattice strain behavior [3]. In HCP materials, the anisotropic nature of the lattice strain amplifies the effect of uneven stress concentrations under pressure, which shows strong lattice-preferred orientation (LPO) [4,5] with texture evolution [6], and may further create preferential pathways for crack growth [7], leading to rapid crack propagation, which ultimately makes the material more susceptible to deformation [8,9]. When materials with anisotropic lattice stress–strain are subjected to external compression, locally dominant crystal grains can be responsible for the amplified effects of anisotropic behaviors and guide the deformation [10] until grain size homogeneously reaches the critical level [11].
HCP-structured alloys have been considered as candidates in many applications due to their excellent structure stabilities. In previous decades, binary systems such as intermetallic Ag–Al alloys have attracted much attention [12,13] due to their excellent mechanical and electrical transport properties. Compared with the disadvantages of poorer mechanical properties [14] and the high expense of pure silver counterparts, these advantages make this alloy suitable in the watchmaking industry for mechanical parts and in the semiconductor industry for bonding and the backs of solar cells. However, the anisotropic response to external stress may restrict its applicability in broader fields. High pressure has been adopted as a useful tool to study anisotropic stress–strain and fracture behavior in practical material systems. To study the anomalous anisotropic stress–strain in a material containing a mixture of coarse and fine grains, as an example of an anisotropic material, we explored the mesoscopic anisotropic mechanical properties and behaviors in an HCP–Ag75Al25 alloy under uniaxial compression. In the Ag–Al binary system, the HCP phase [12] can be formed in the composition range from 23 to 40 at.% Al. The HCP–Ag75Al25 alloy is particularly suitable for high-pressure studies due to its unique combination of moderate strength and high structural stability. Compared with other compositions, it maintains its HCP structure under high pressure, making it a promising candidate for applications requiring durability and phase stability under extreme-pressure conditions.
Previous studies into anisotropy in granular metal materials at different scales have provided a base for understanding of the link between micro- and macroscopic anisotropy. Several models and simulation methods have been proposed [15] to describe the micro–macro behavior [16,17] and properties [18] of such materials, especially HCP-structured materials [19,20]. Properties such as anisotropic elastic modulus and acoustic velocity [21,22] were studied as references and indicators for geology behaviors [23,24]. Pillar compression methods have been widely adopted for studying the anisotropy [25], as well as the conventional properties of rocks. Meanwhile, micro-pillar compression methods have also been used to explore micromechanical and macroscopic mechanical behaviors such as stress relaxation, micro-creep [26], and deformation-rate sensitivity in different anisotropic materials [27]. Previously, the majority of studies into anisotropy under compression have been focused on cubic materials [28], such as Ni, Cu, Mo, Au, Fe [29], and their cubic alloys. More recent studies have extended the range to HCP metals like Mg [30], Zr [31], HCP-Fe [32], and their alloys [33,34], and Co [35,36].
In this work, we utilized the micro-focused synchrotron X-ray diffraction technique and in situ high pressure with a diamond anvil cell (DAC) to study the evolution of localized mesoscopic anisotropic stress–strain in an HCP–Ag75Al25 alloy containing a mixture of coarse and fine grains. When the alloy was compressed under uniaxial stress with no PTM in the sample chamber, an anomalous anisotropic stress–strain diffraction pattern and its evolution with applied pressure were clearly observable.

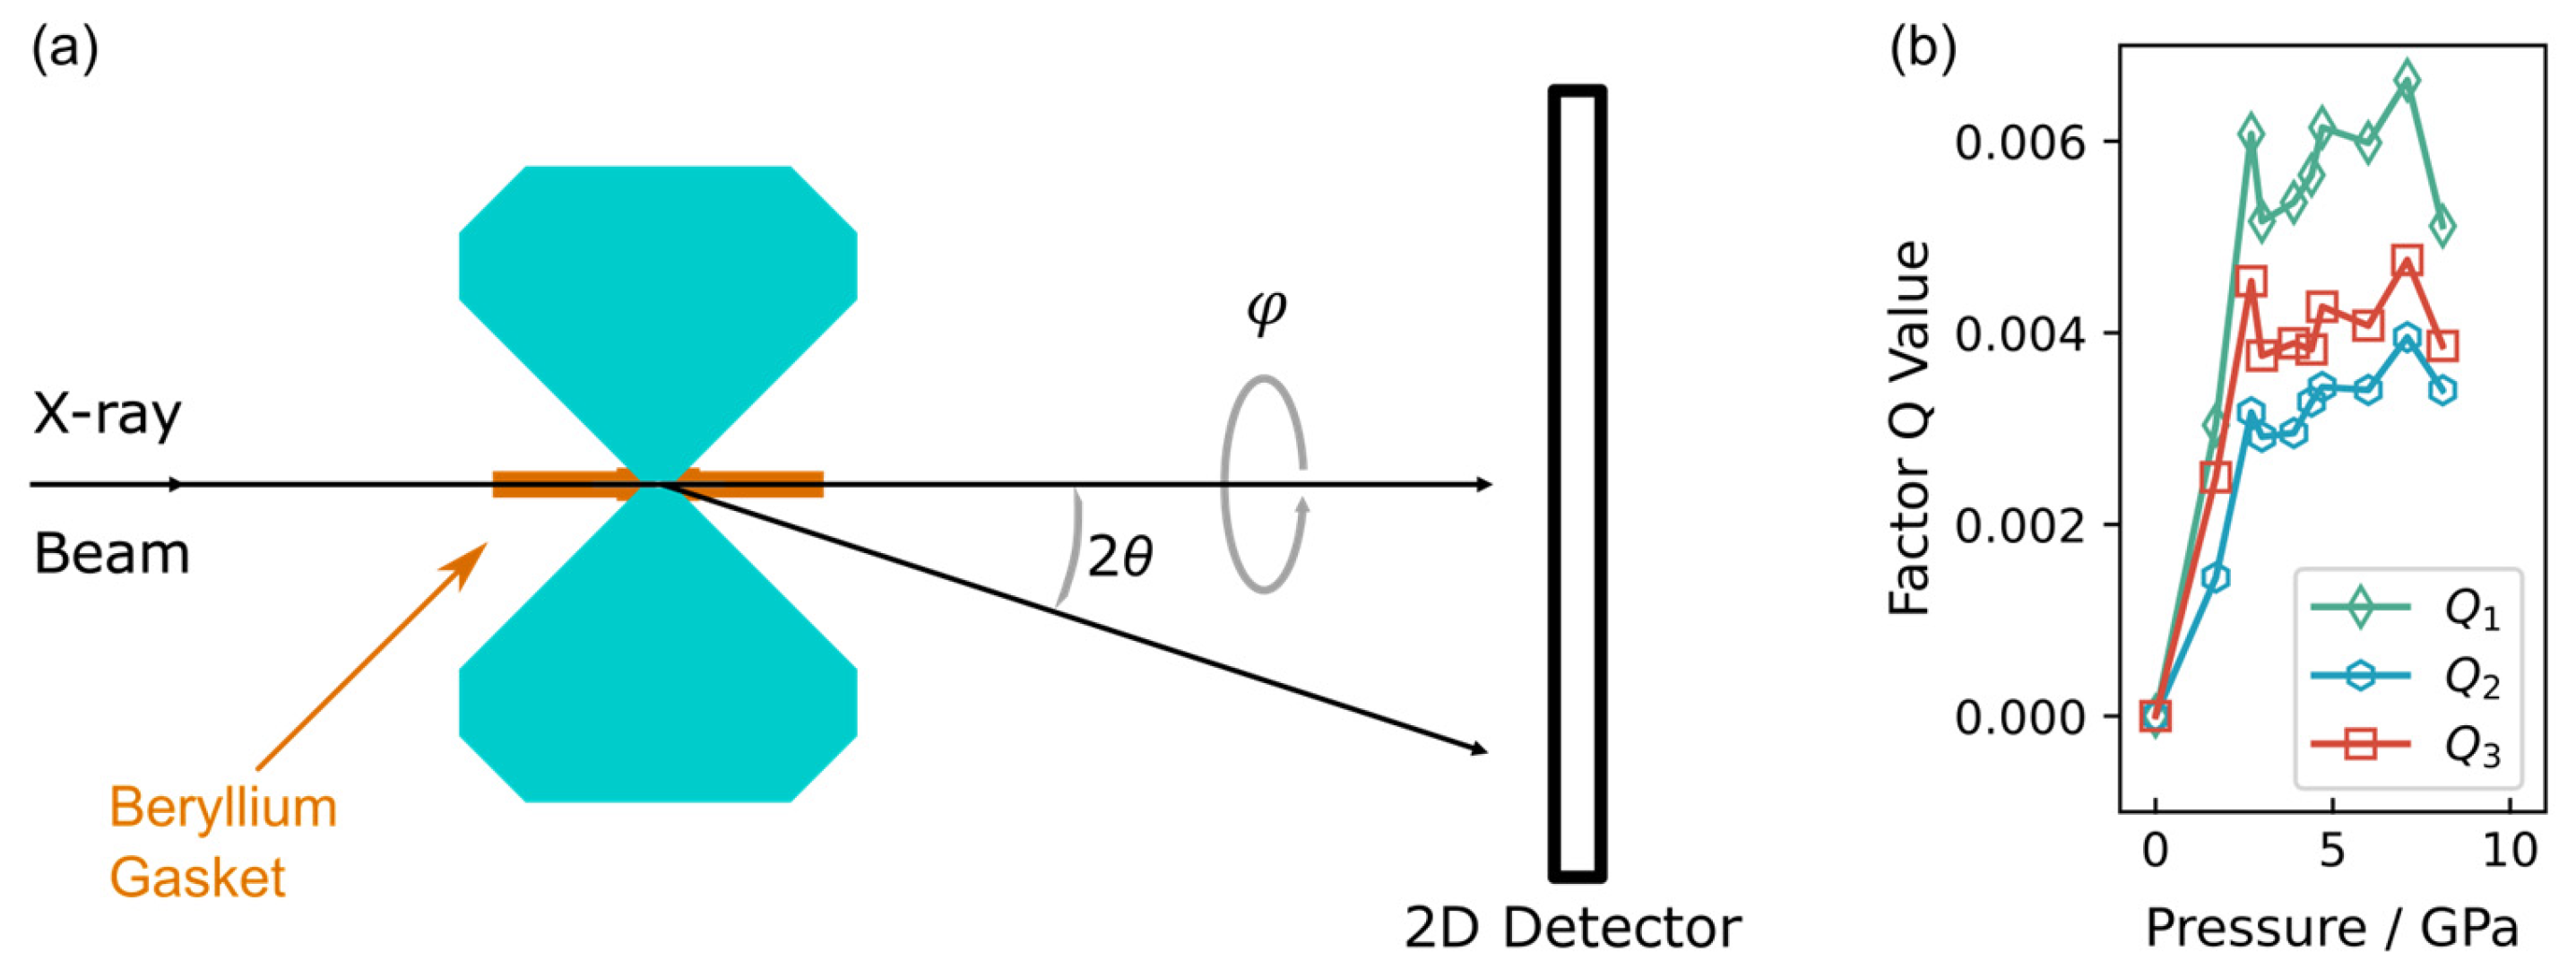
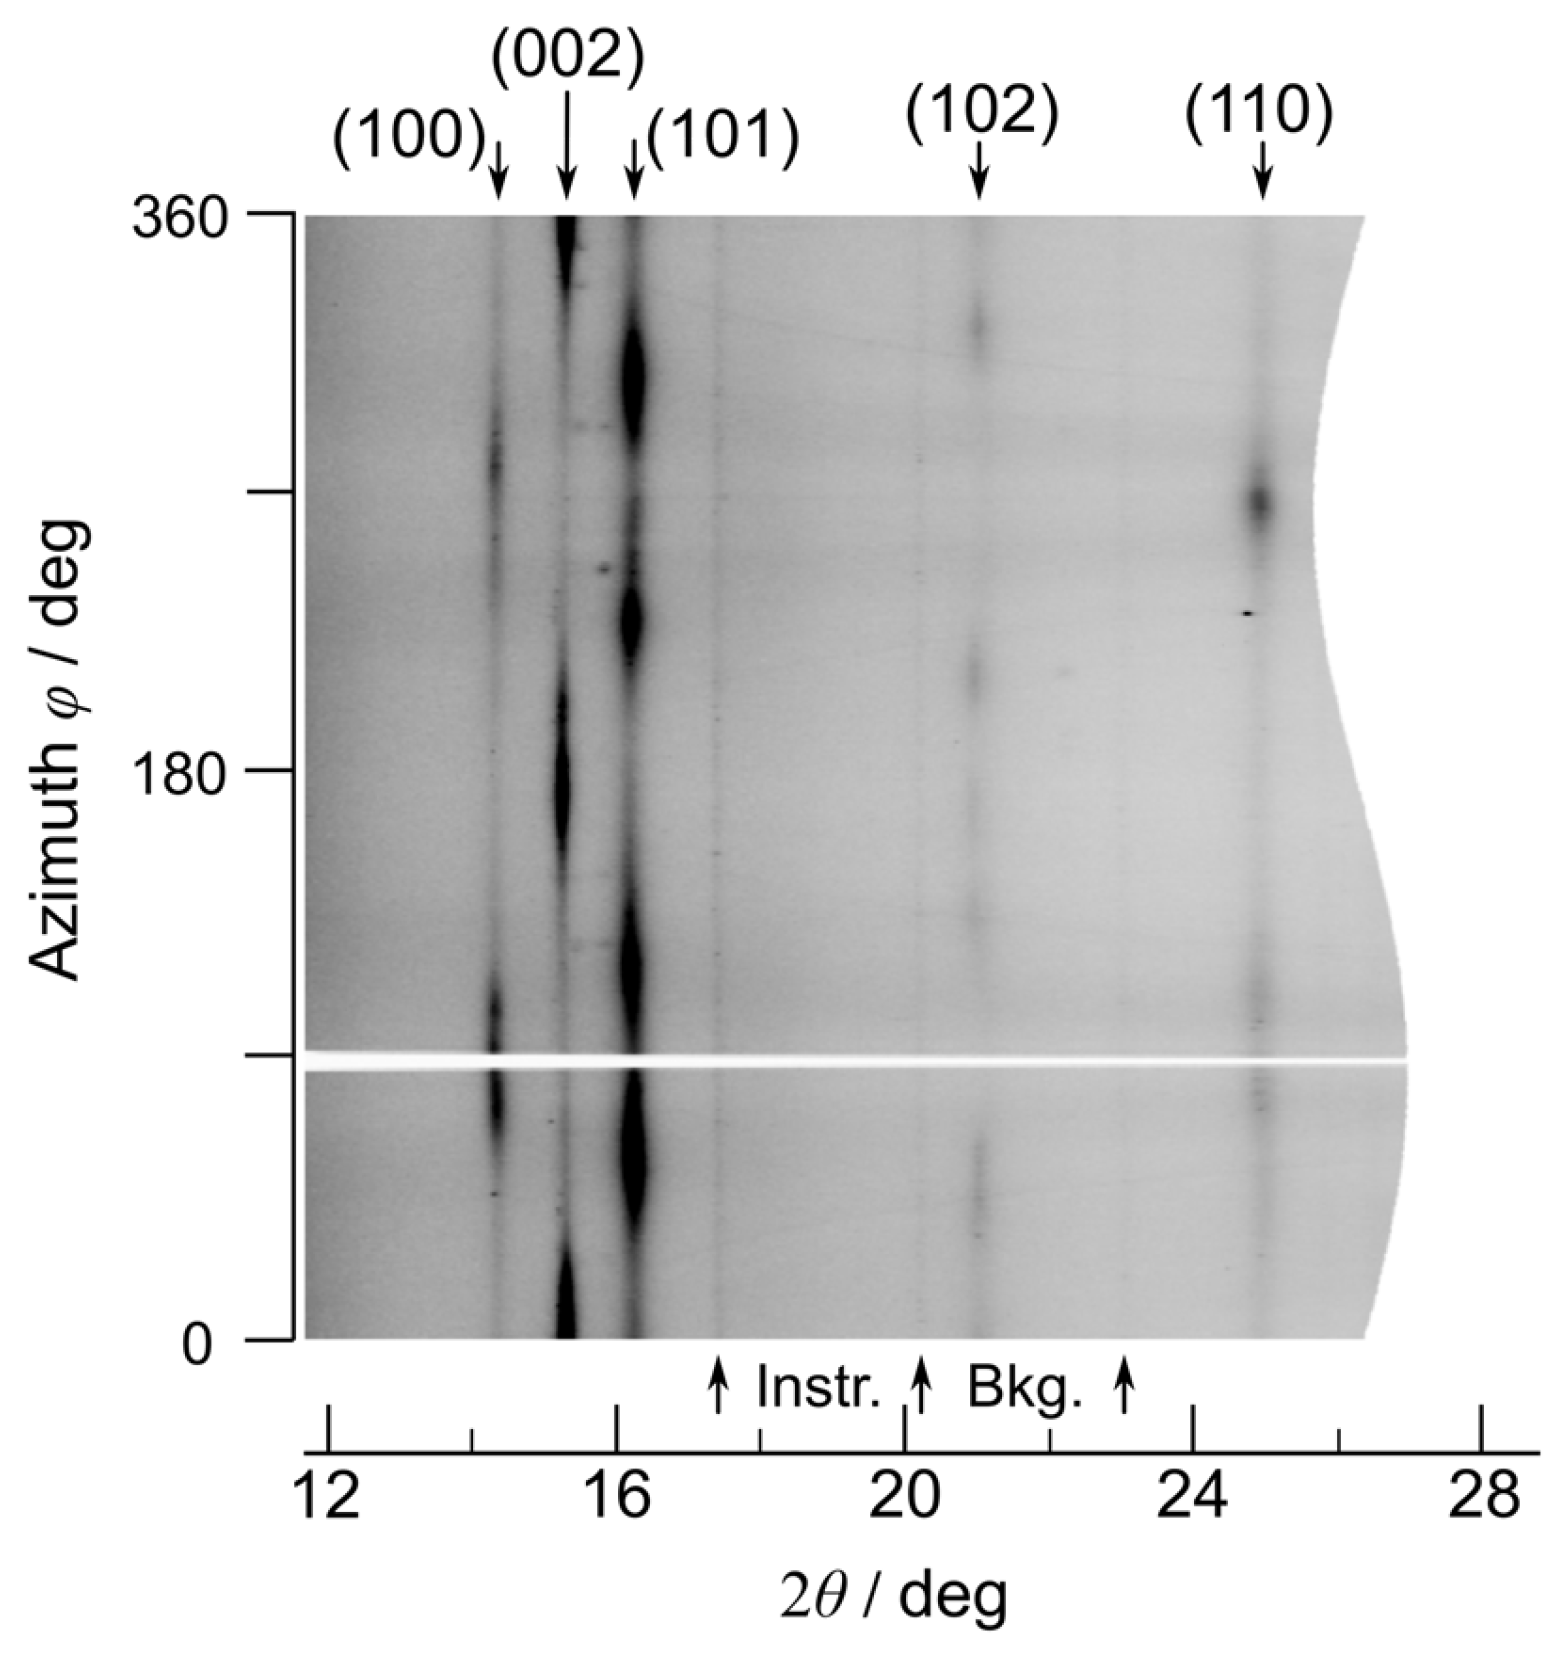
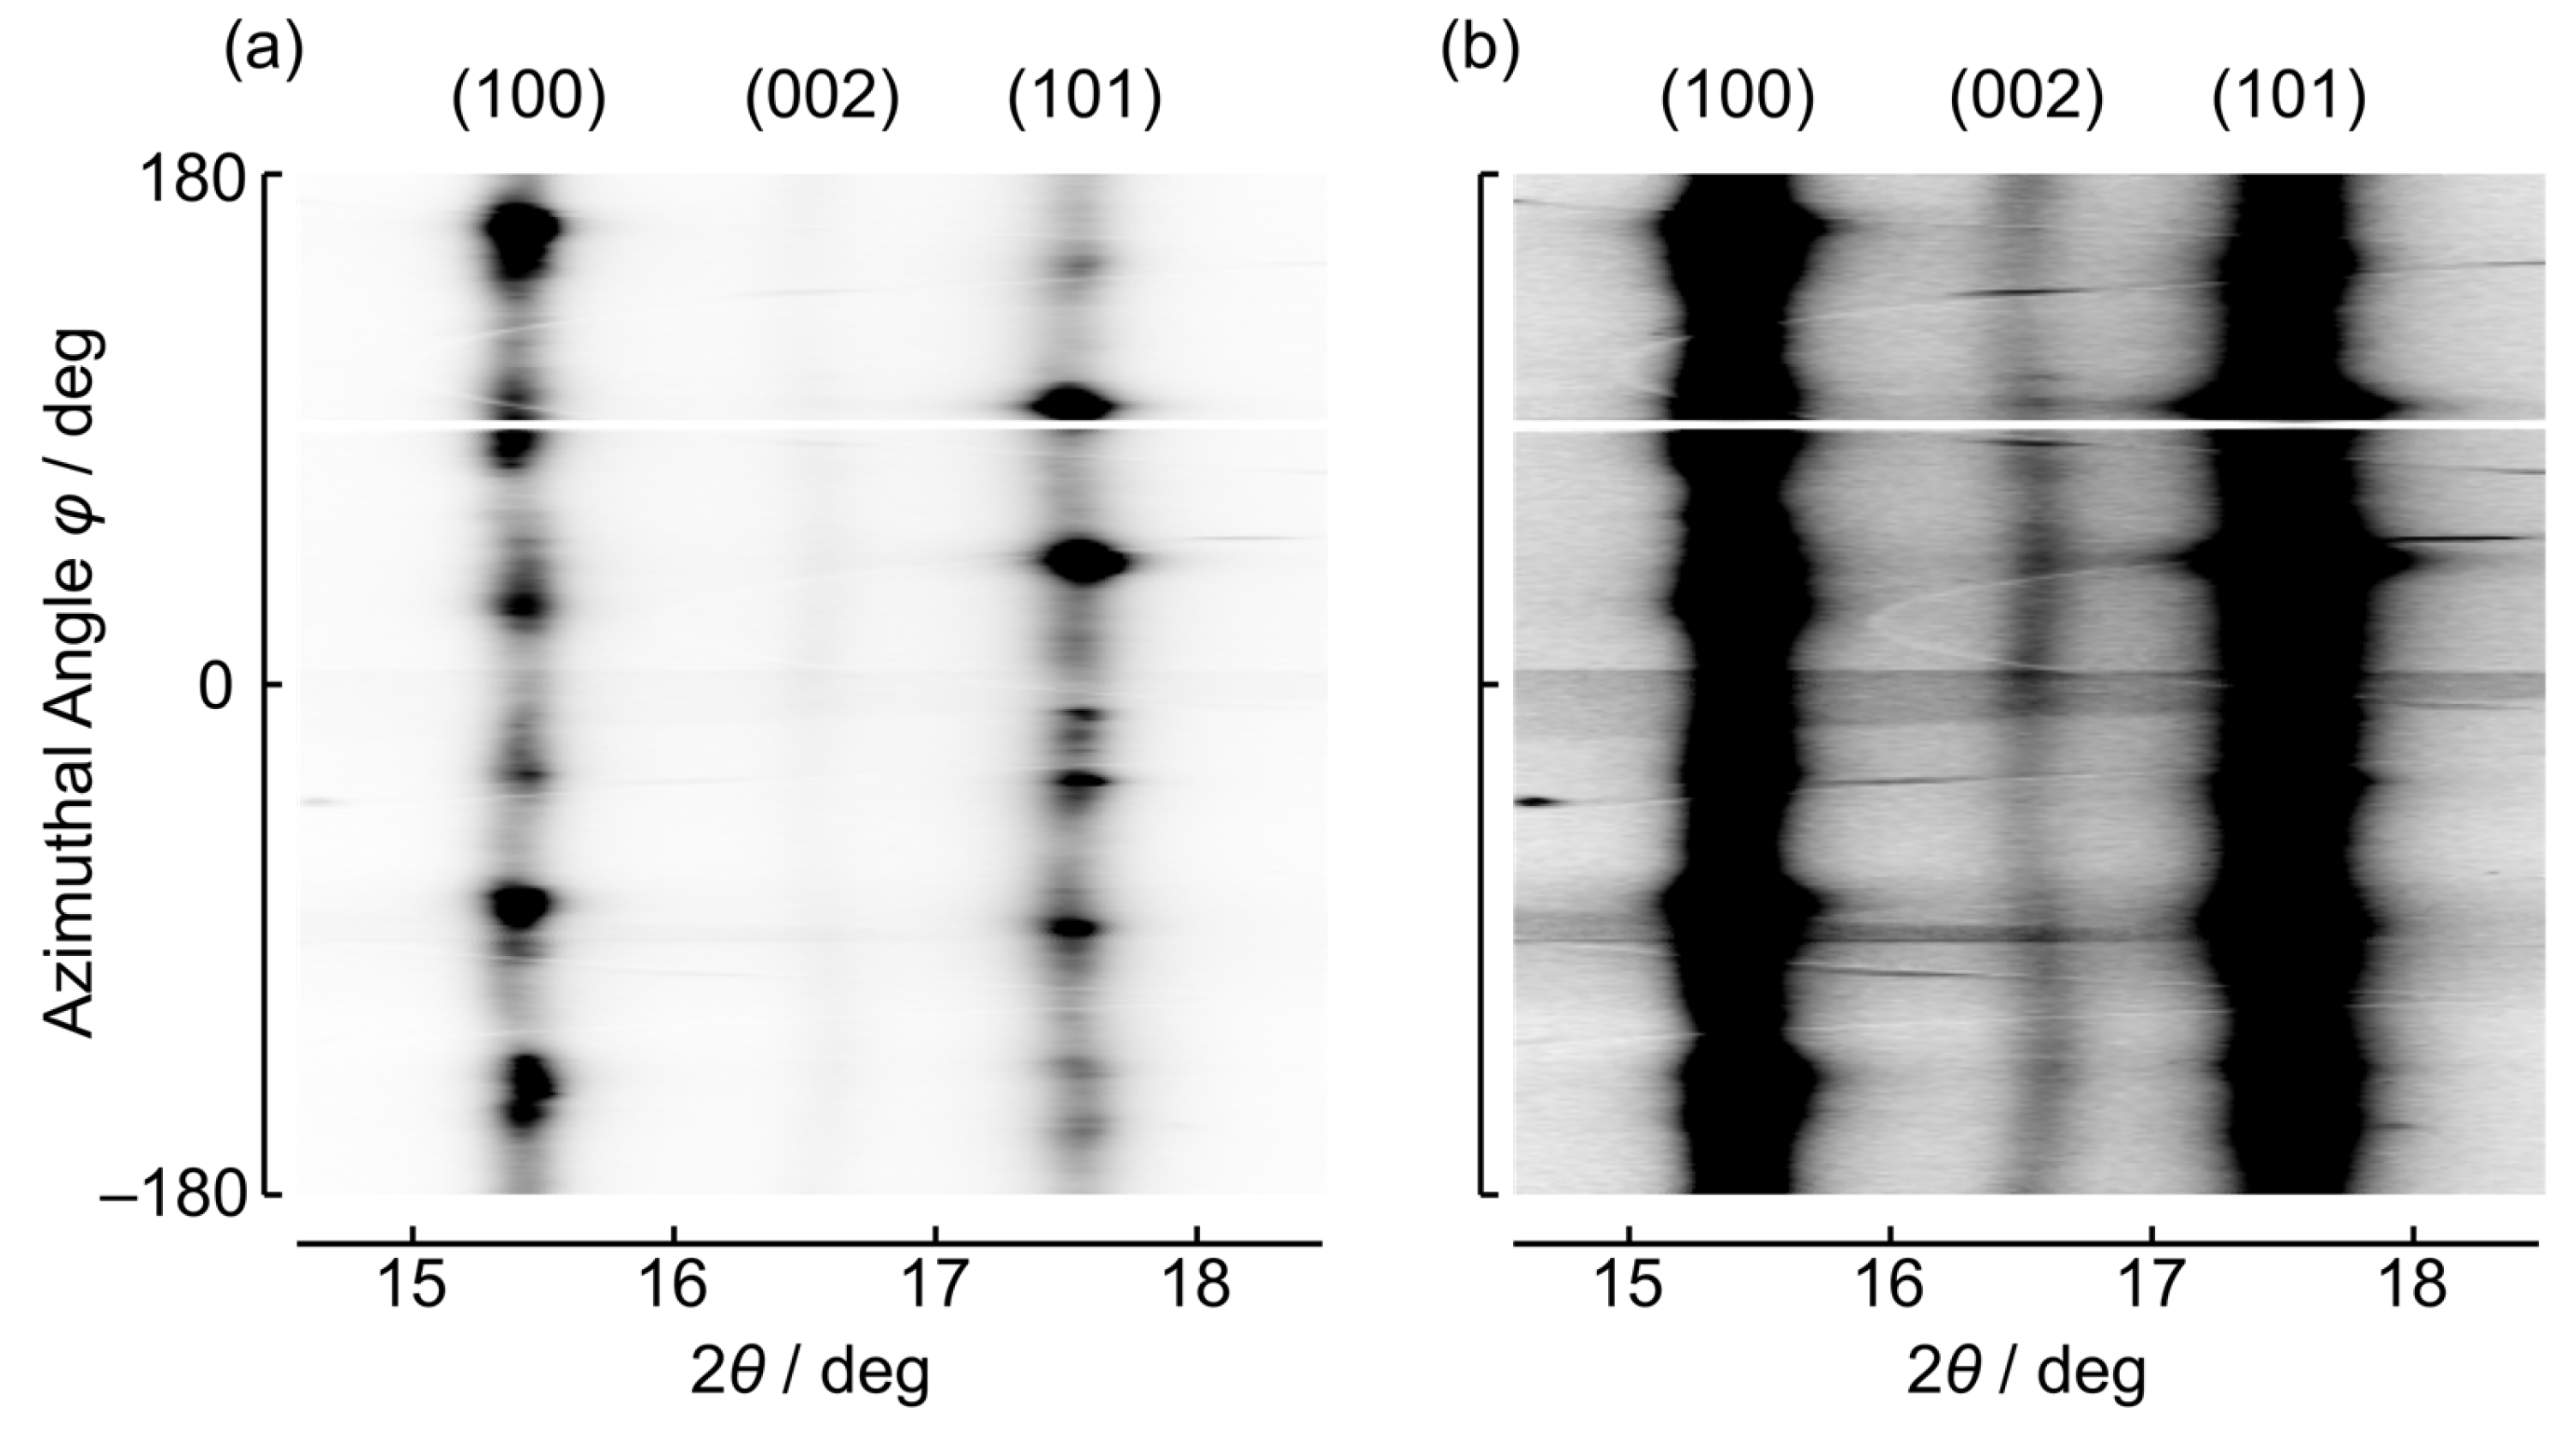
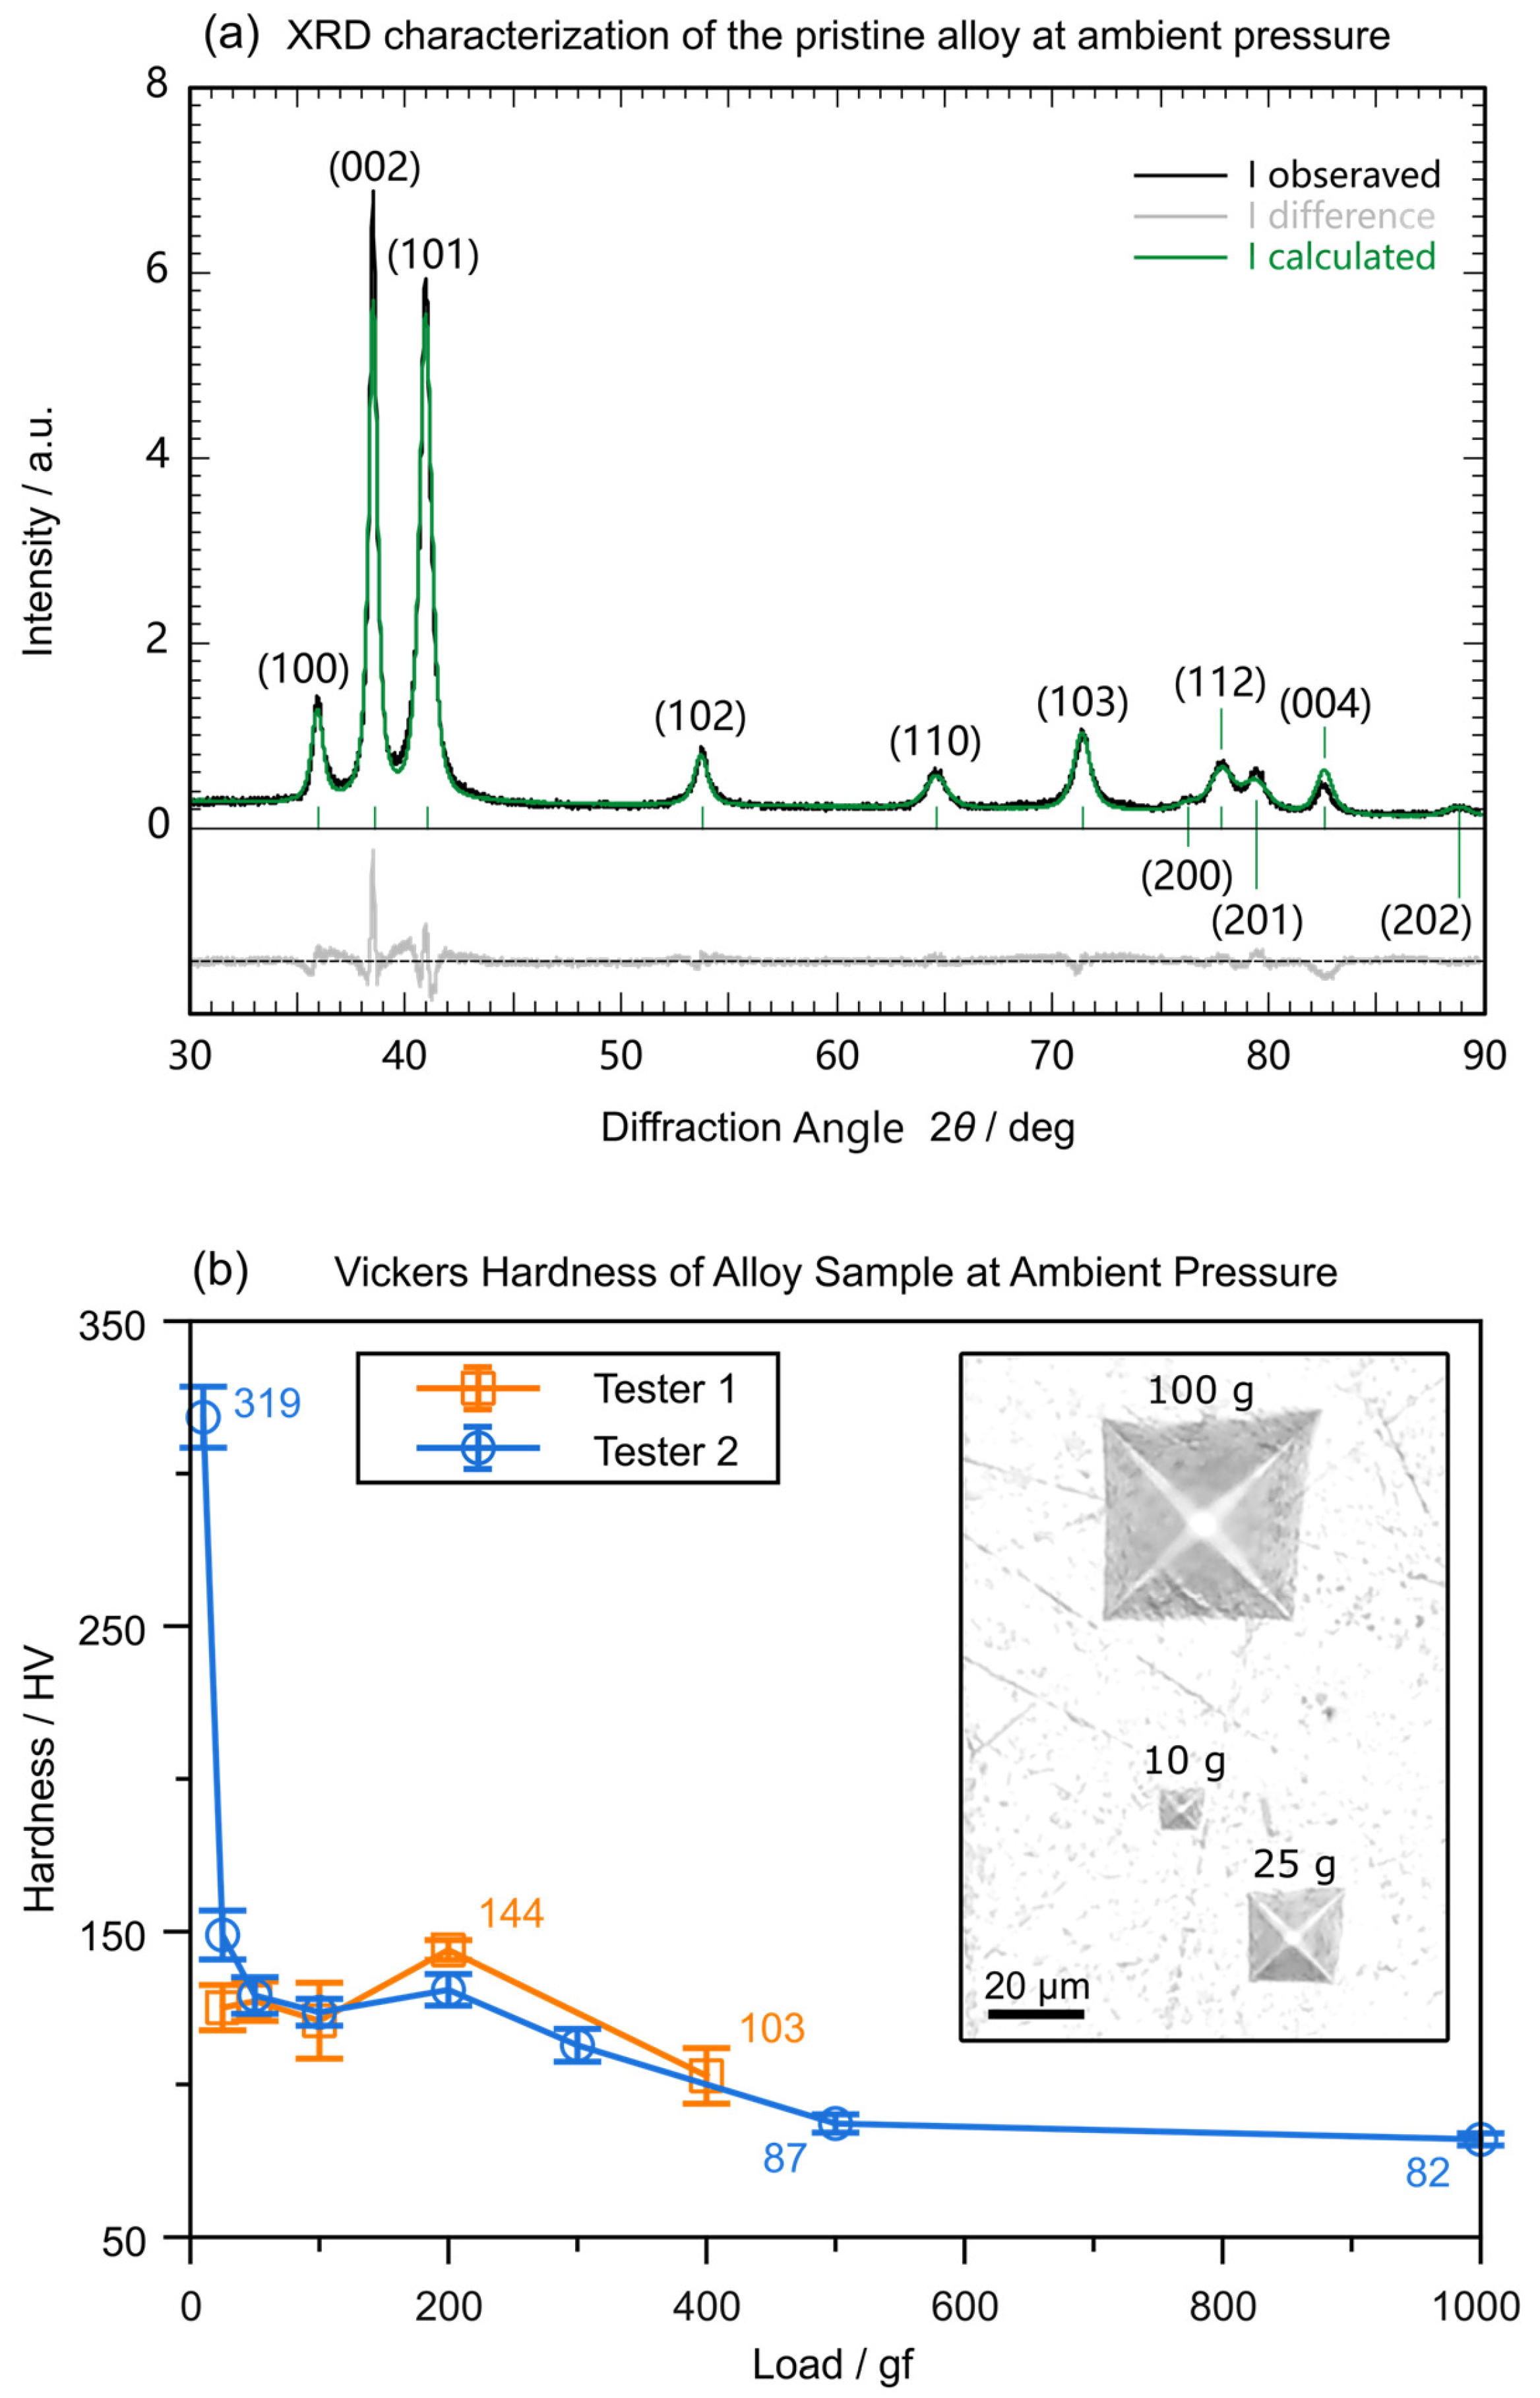
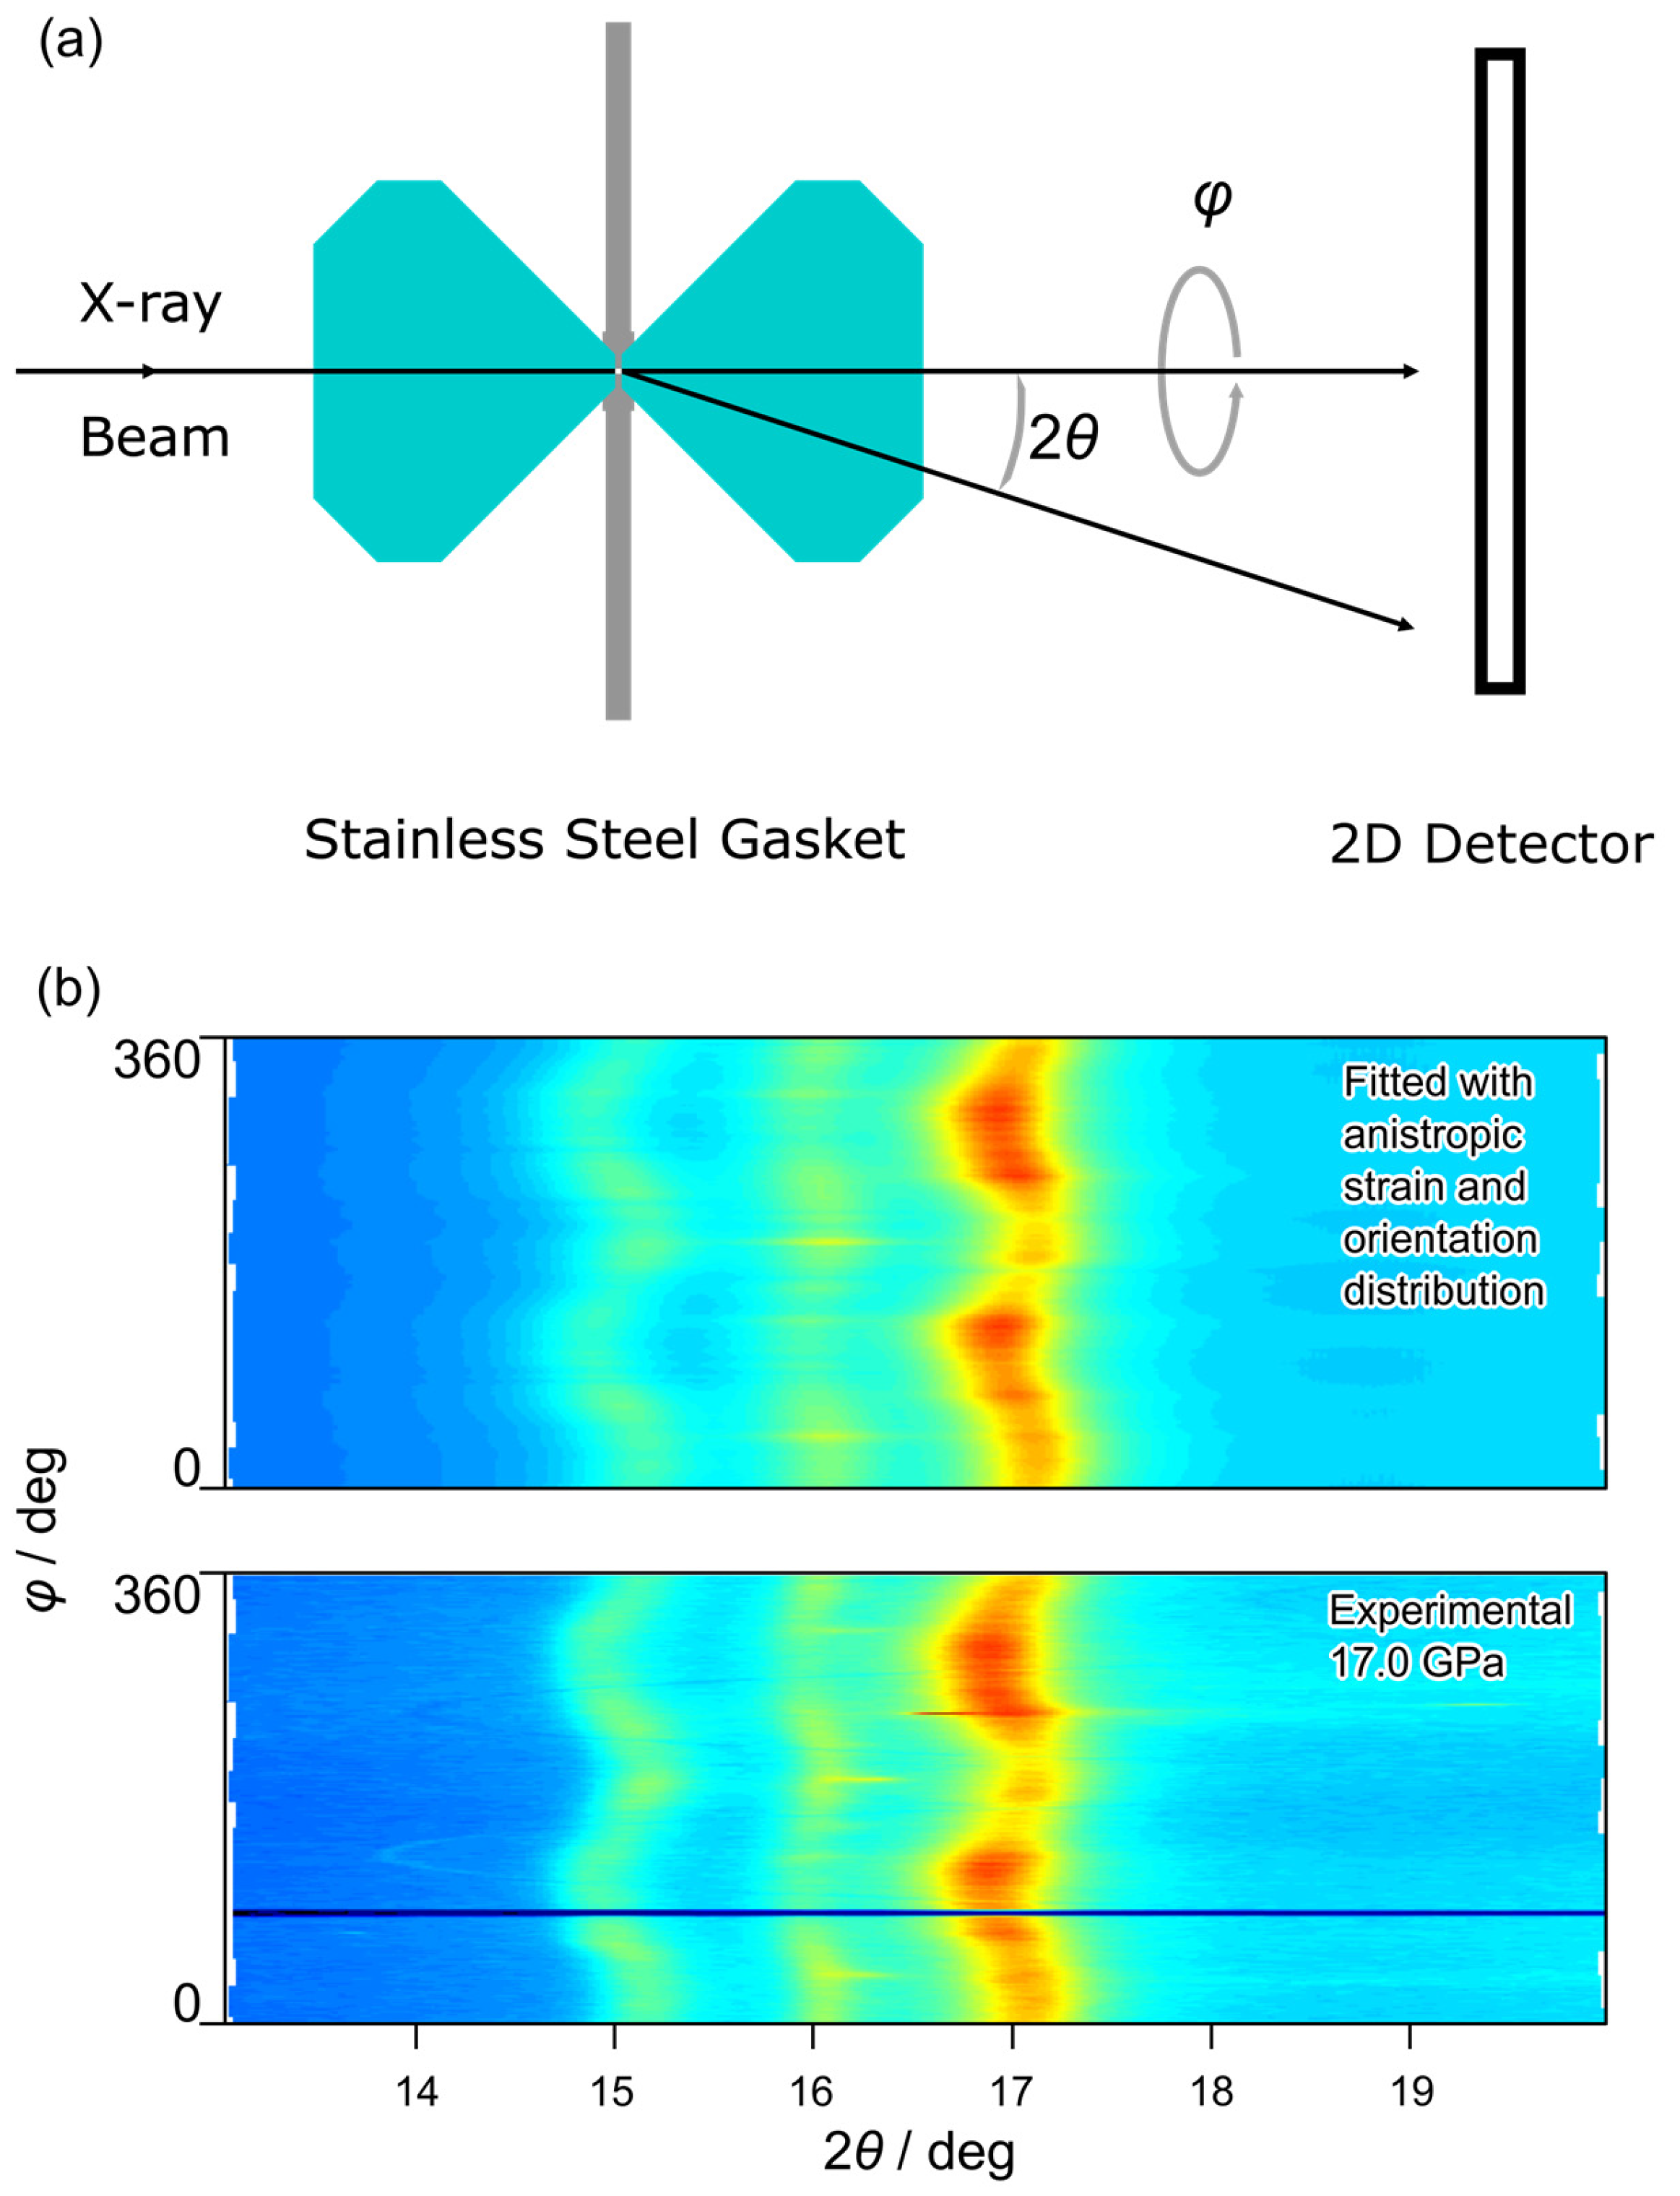
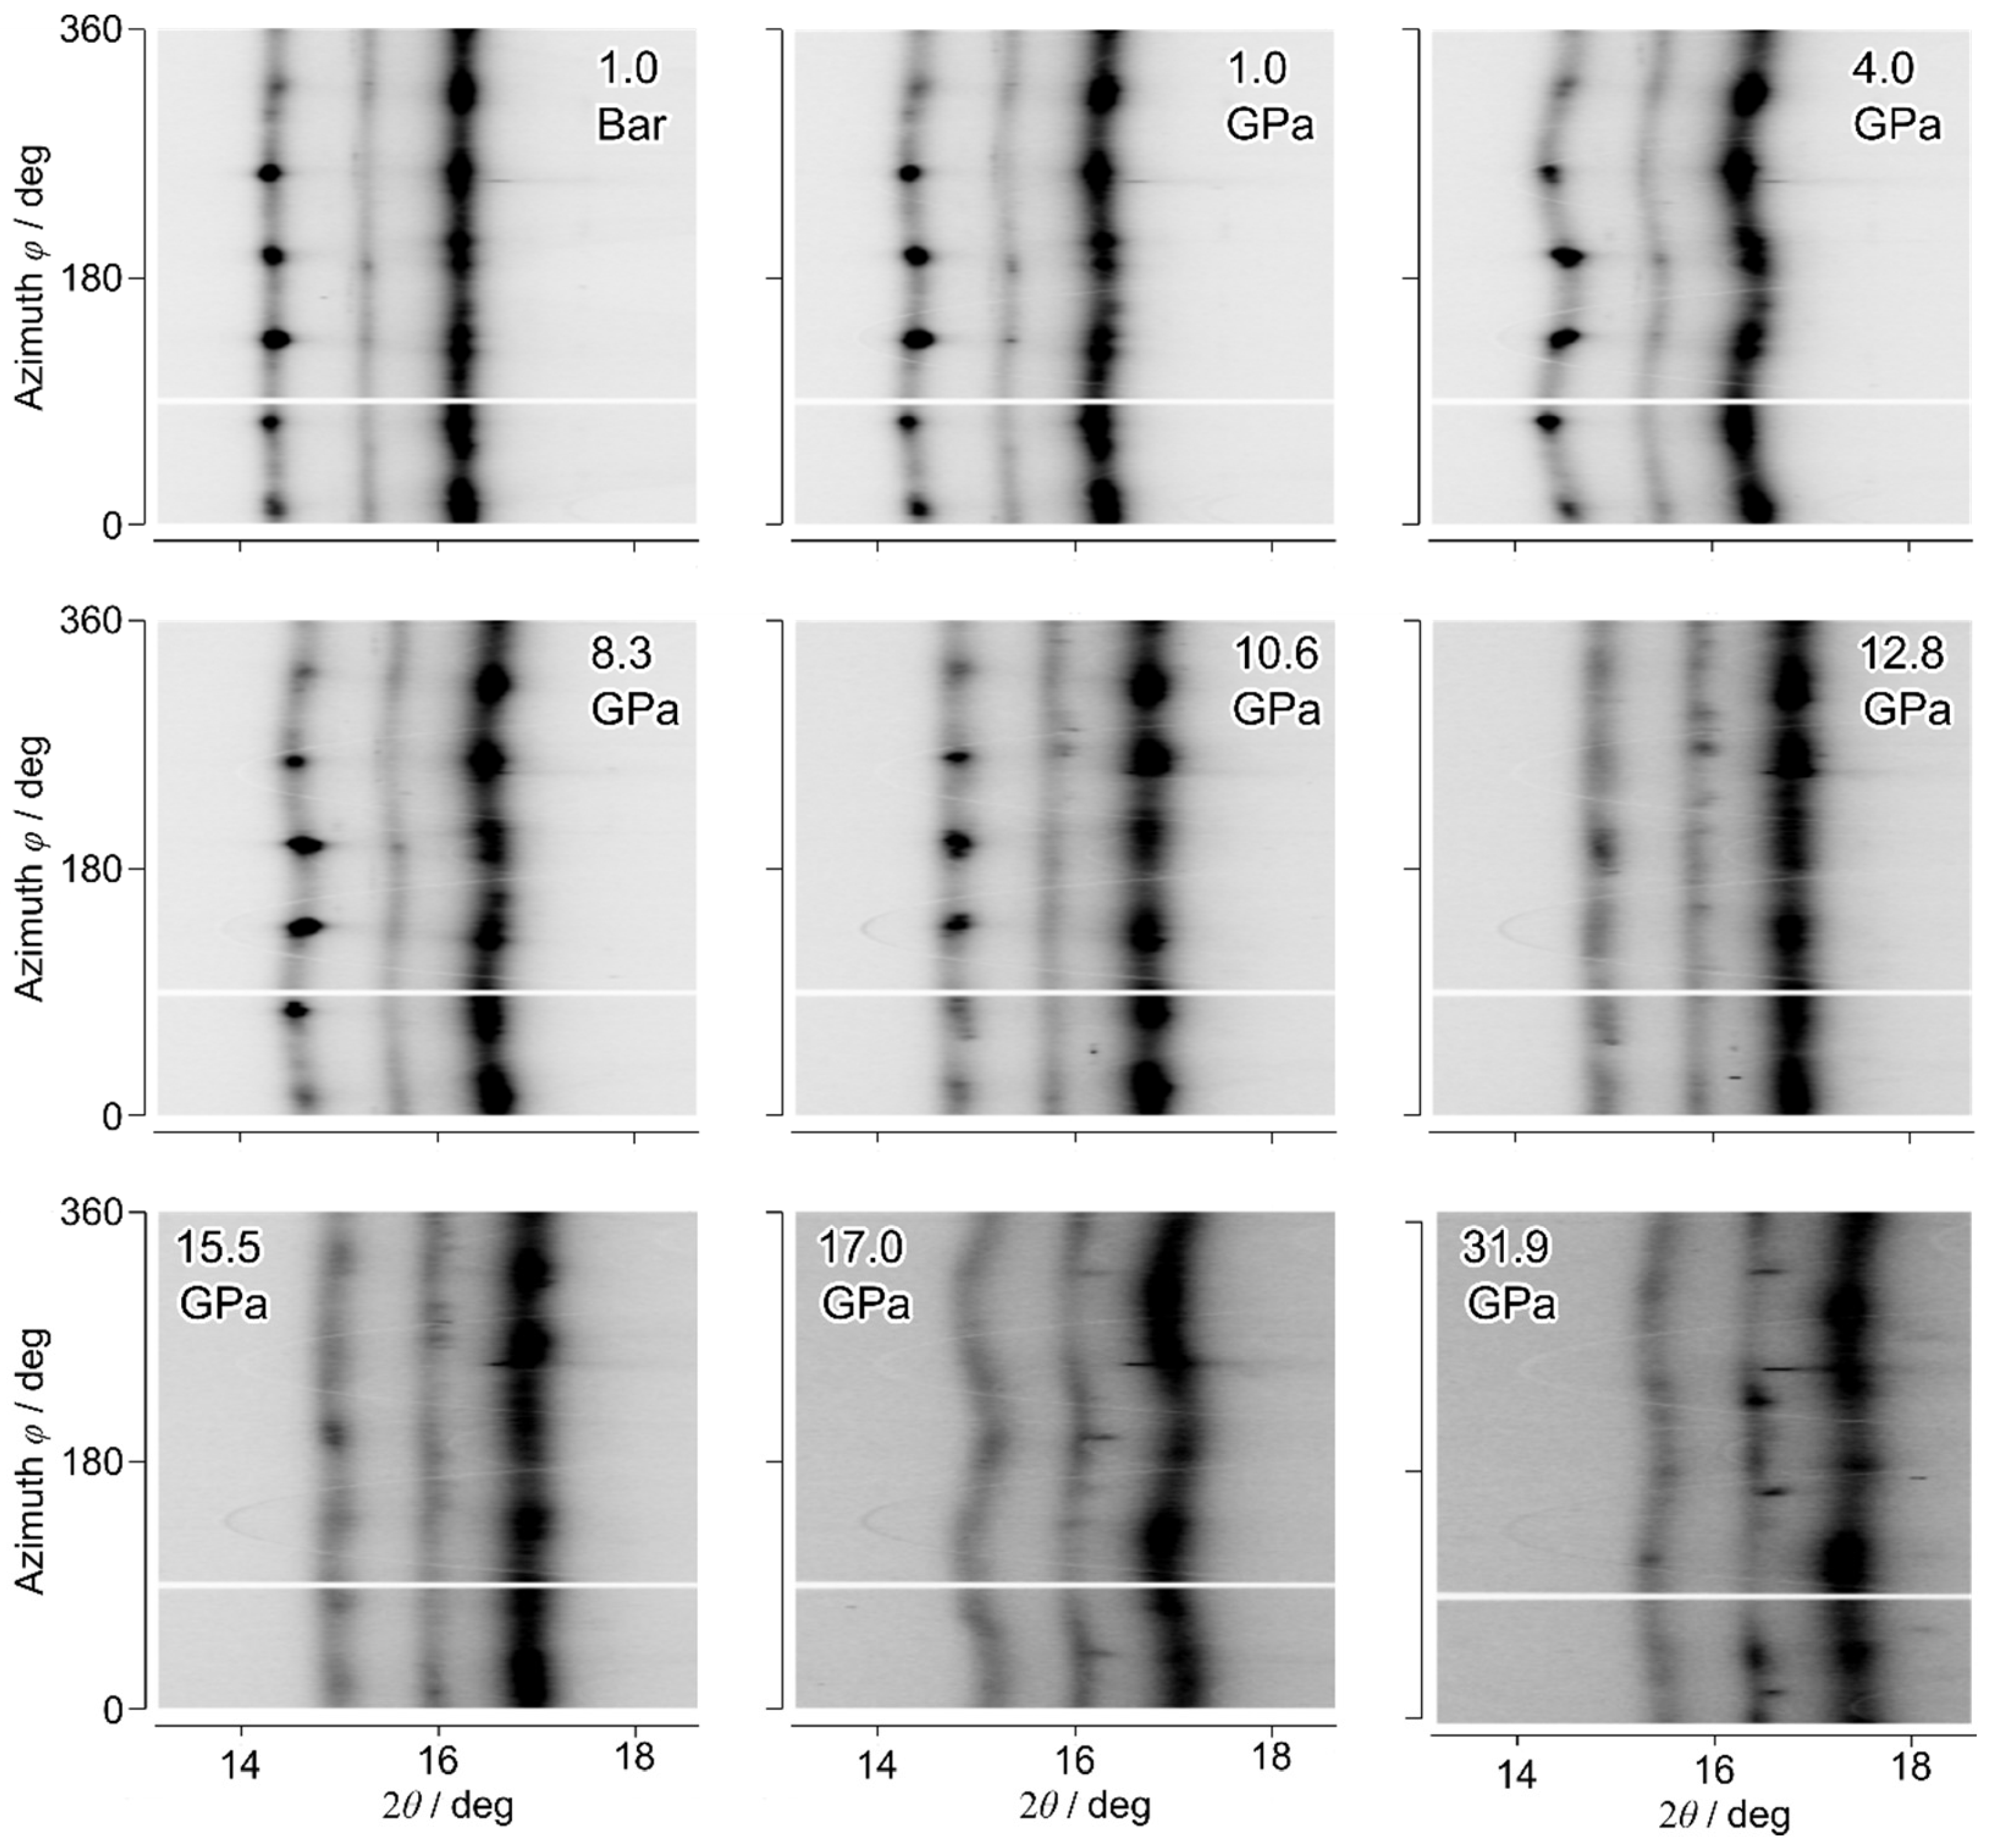
2. Materials and Methods

The HCP–Ag75Al25 alloy was chosen for its moderate bulk and shear modulus and its intrinsic anisotropic HCP structure while being stable in its phase structure until reasonably high pressure, compared with a reference for HCP metal (Figure A3). The Ag75Al25 alloy was synthesized in the following steps: coarse-grained Al pellets (Aladdin, Shanghai, China) and fine-grained Ag powders (Aladdin, Shanghai, China) with purity of 99.99% were weighed in a 1:3 in molar ratio, mixed in an alumina crucible with Ar–H2 mixture gas protection in a glove box, and sealed under vacuum into a quartz tube. The sealed tube was heated to 720 °C over 8 h, and maintained at 720 °C for 12 h, followed by cooling over 8 h from 720 °C to room temperature without extra annealing. For uniformity, this heating–cooling process was repeated for 3 times. Finally, a coin-shaped sample was removed from the crucible, and checking with energy dispersive spectrometer (EDS) showed 74.68% and 25.35%, by atomic percentage, of Ag and Al, respectively.
This pristine ingot was checked with a lab X-ray diffractometer equipped with a Cu target. As shown in Figure 1a, the sample demonstrated an homogeneous solid-solution HCP structure [37]. Mechanical tests on the synthesized HCP–Ag75Al25 alloy at ambient pressure show a higher hardness and bulk modulus than pure elemental silver or aluminum with FCC structure. These properties were comparable to those of other common HCP materials like Mg or Ti alloys. A suspicious step around 200 gf in the Vickers hardness test which reproduces well across tests indicated possible grain breakage due to the release of accumulated local stress–strain at the local maximum.
High-pressure in situ XRD measurements were conducted at the Shanghai Synchrotron Radiation Facility (SSRF) (Shanghai, China). These took place at beamline 15U, with an axial diffraction geometry (Figure 2a) of DAC, and with SX165 (Rayonix, Evanston, IL, USA) as detector. The grained sample was loaded into a stainless-steel gasket sample chamber without any pressure-transmitting medium (PTM), and a micro-focused X-ray beam (about 3.5   μ m × 3.5   μ m , FWHM) was applied with in situ non-hydrostatic high-pressure XRD measurements up to nearly 40 GPa.
It should be noted that the requirement of anisotropy in the structure of material selected, the mixed distribution of the coarse and fine grains, and the anisotropy (uniaxiality) of the applied pressure was essential for the anomalous anisotropic strain to show with axial XRD geometry in our experiment, as axial XRD would normally show no anisotropic strain pattern. A micro-focused X-ray beam was also necessary in order to probe such localized anisotropic strain. Otherwise, its effect would be averaged. For this reason, we term it as “mesoscopic”.
The two-dimensional XRD patterns were unrolled to 2 θ and φ coordination with Dioptas 0.5.8 [38] for further analysis about the localized anisotropic strain. Following Singh’s method for anisotropic lattice strain analysis for material subjected to uniaxial non-hydrostatic compression, we conducted lattice strain analysis with pressures up to 40 GPa.
The initial search for interested region during XRD of the specimen was rather a random process since the design of the experiment needed both coarse grains for observable anomalous anisotropic lattice strain and fine-grained powder for a smoother diffraction ring to extract enough anisotropic data for analysis. Such regions were throughout the specimen and when an interested region with both coarse and fine grains was selected at the lowest pressure in DAC, the other measurements, at higher pressure, were kept from the same region.
The localized anomalous anisotropic pattern observed in XRD was analyzed using a conventional model for normal anisotropic lattice strain with the parameter given extra purpose to describe its anomality. When a common material is compressed by axial pressure, the dispersing of lattice strain can be described by the angle with respect to the compressing axis. Singh et al. proposed [39,40] the following equation to describe anisotropic lattice strain for material subjected to axial non-hydrostatic compression.
d h k l φ , p d h k l φ d , p d h k l φ d , p = Q h k l p × 1 3 cos 2 φ φ c
where d h k l is the d-spacing of the ( h ,   k , l ) crystallographic plane, φ is the azimuthal angle (Figure 2a), and p is the pressure. Factor Q represents the extent of anisotropy of the strain. φ c is the azimuthal angle of compression axis, which should be 0 for conventional radial XRD [41,42] setup and was a variable in current study, as it was related to the direction of anomalous anisotropic pattern. φ d stands for the azimuth angle to give the theoretical intraplanar spacing at hydrostatic pressure, as shown in the following equation:
3 cos 2 φ d φ c = 1

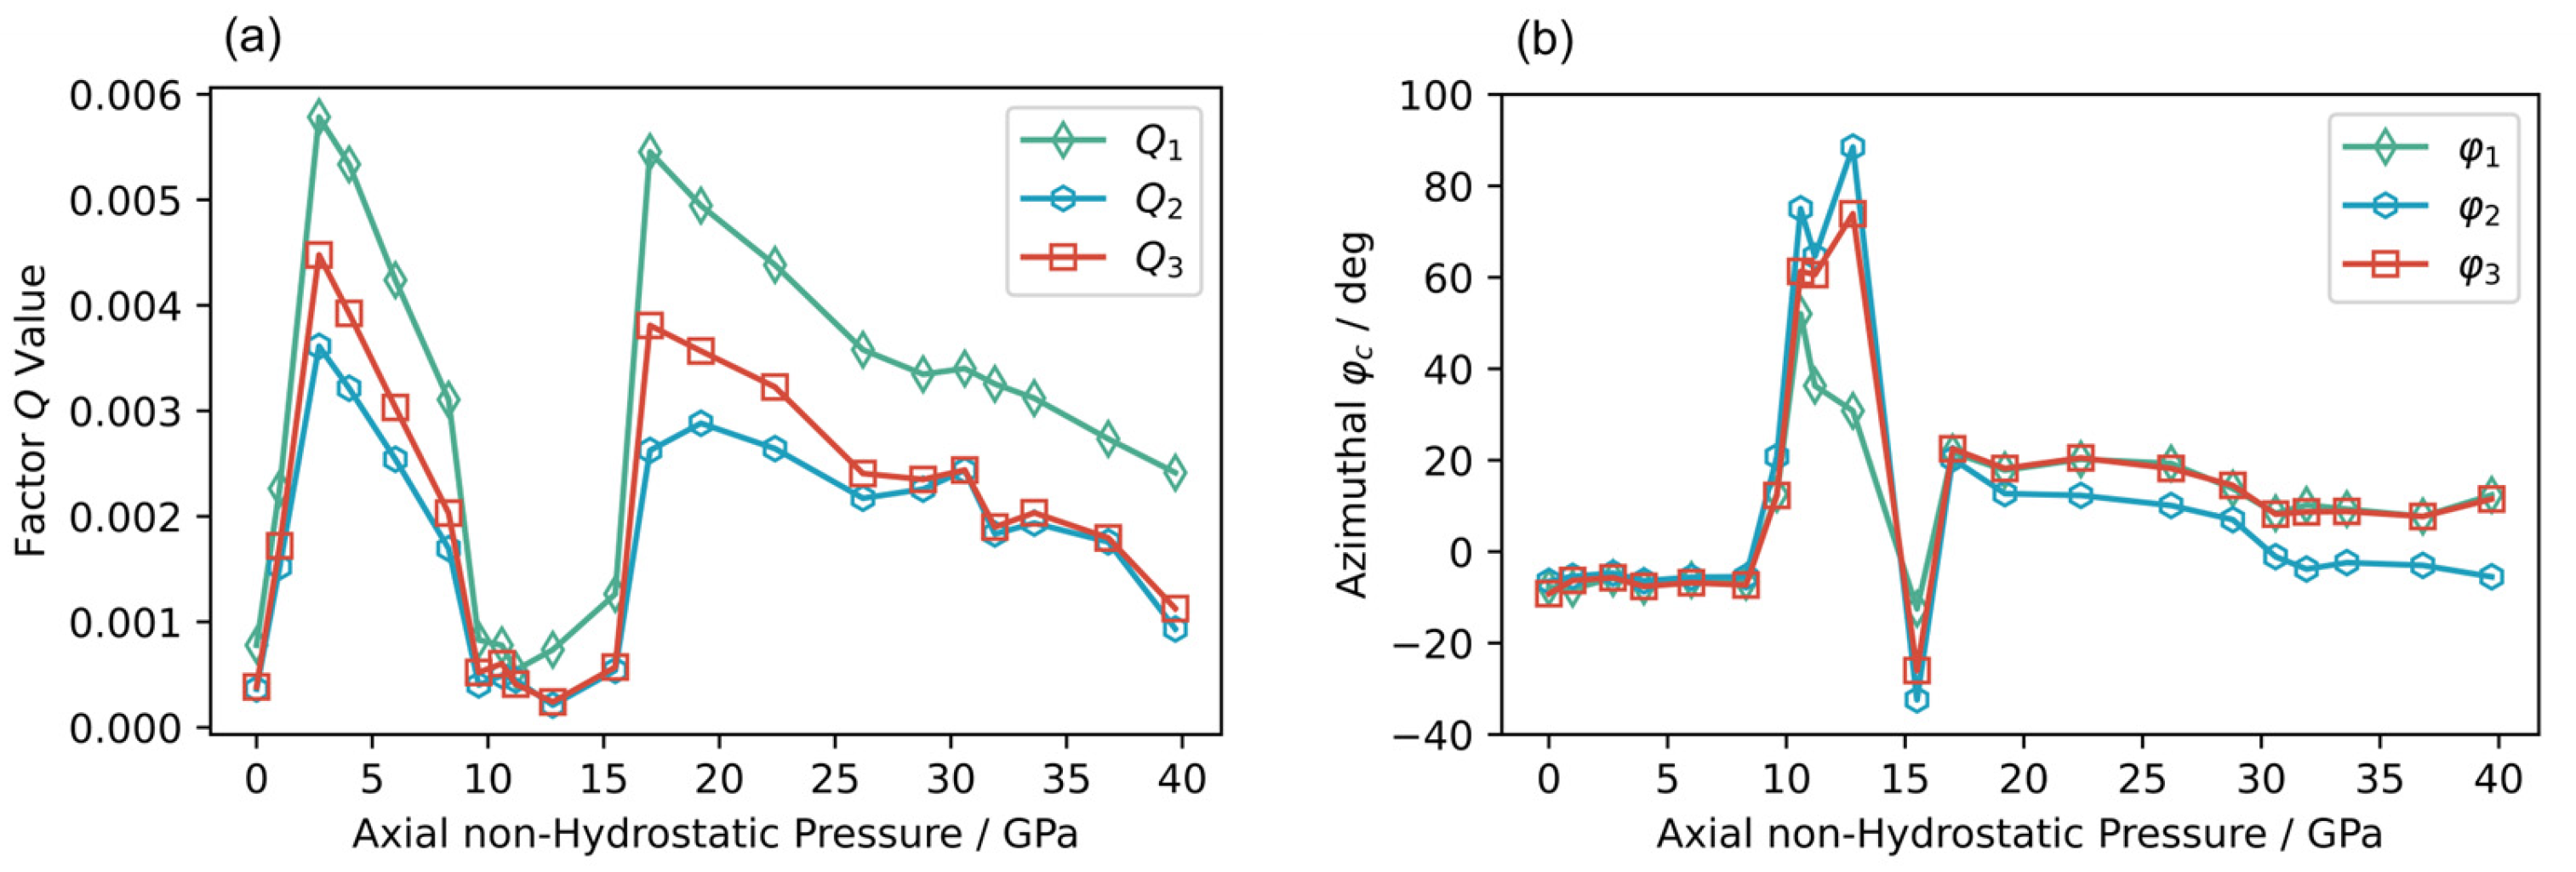
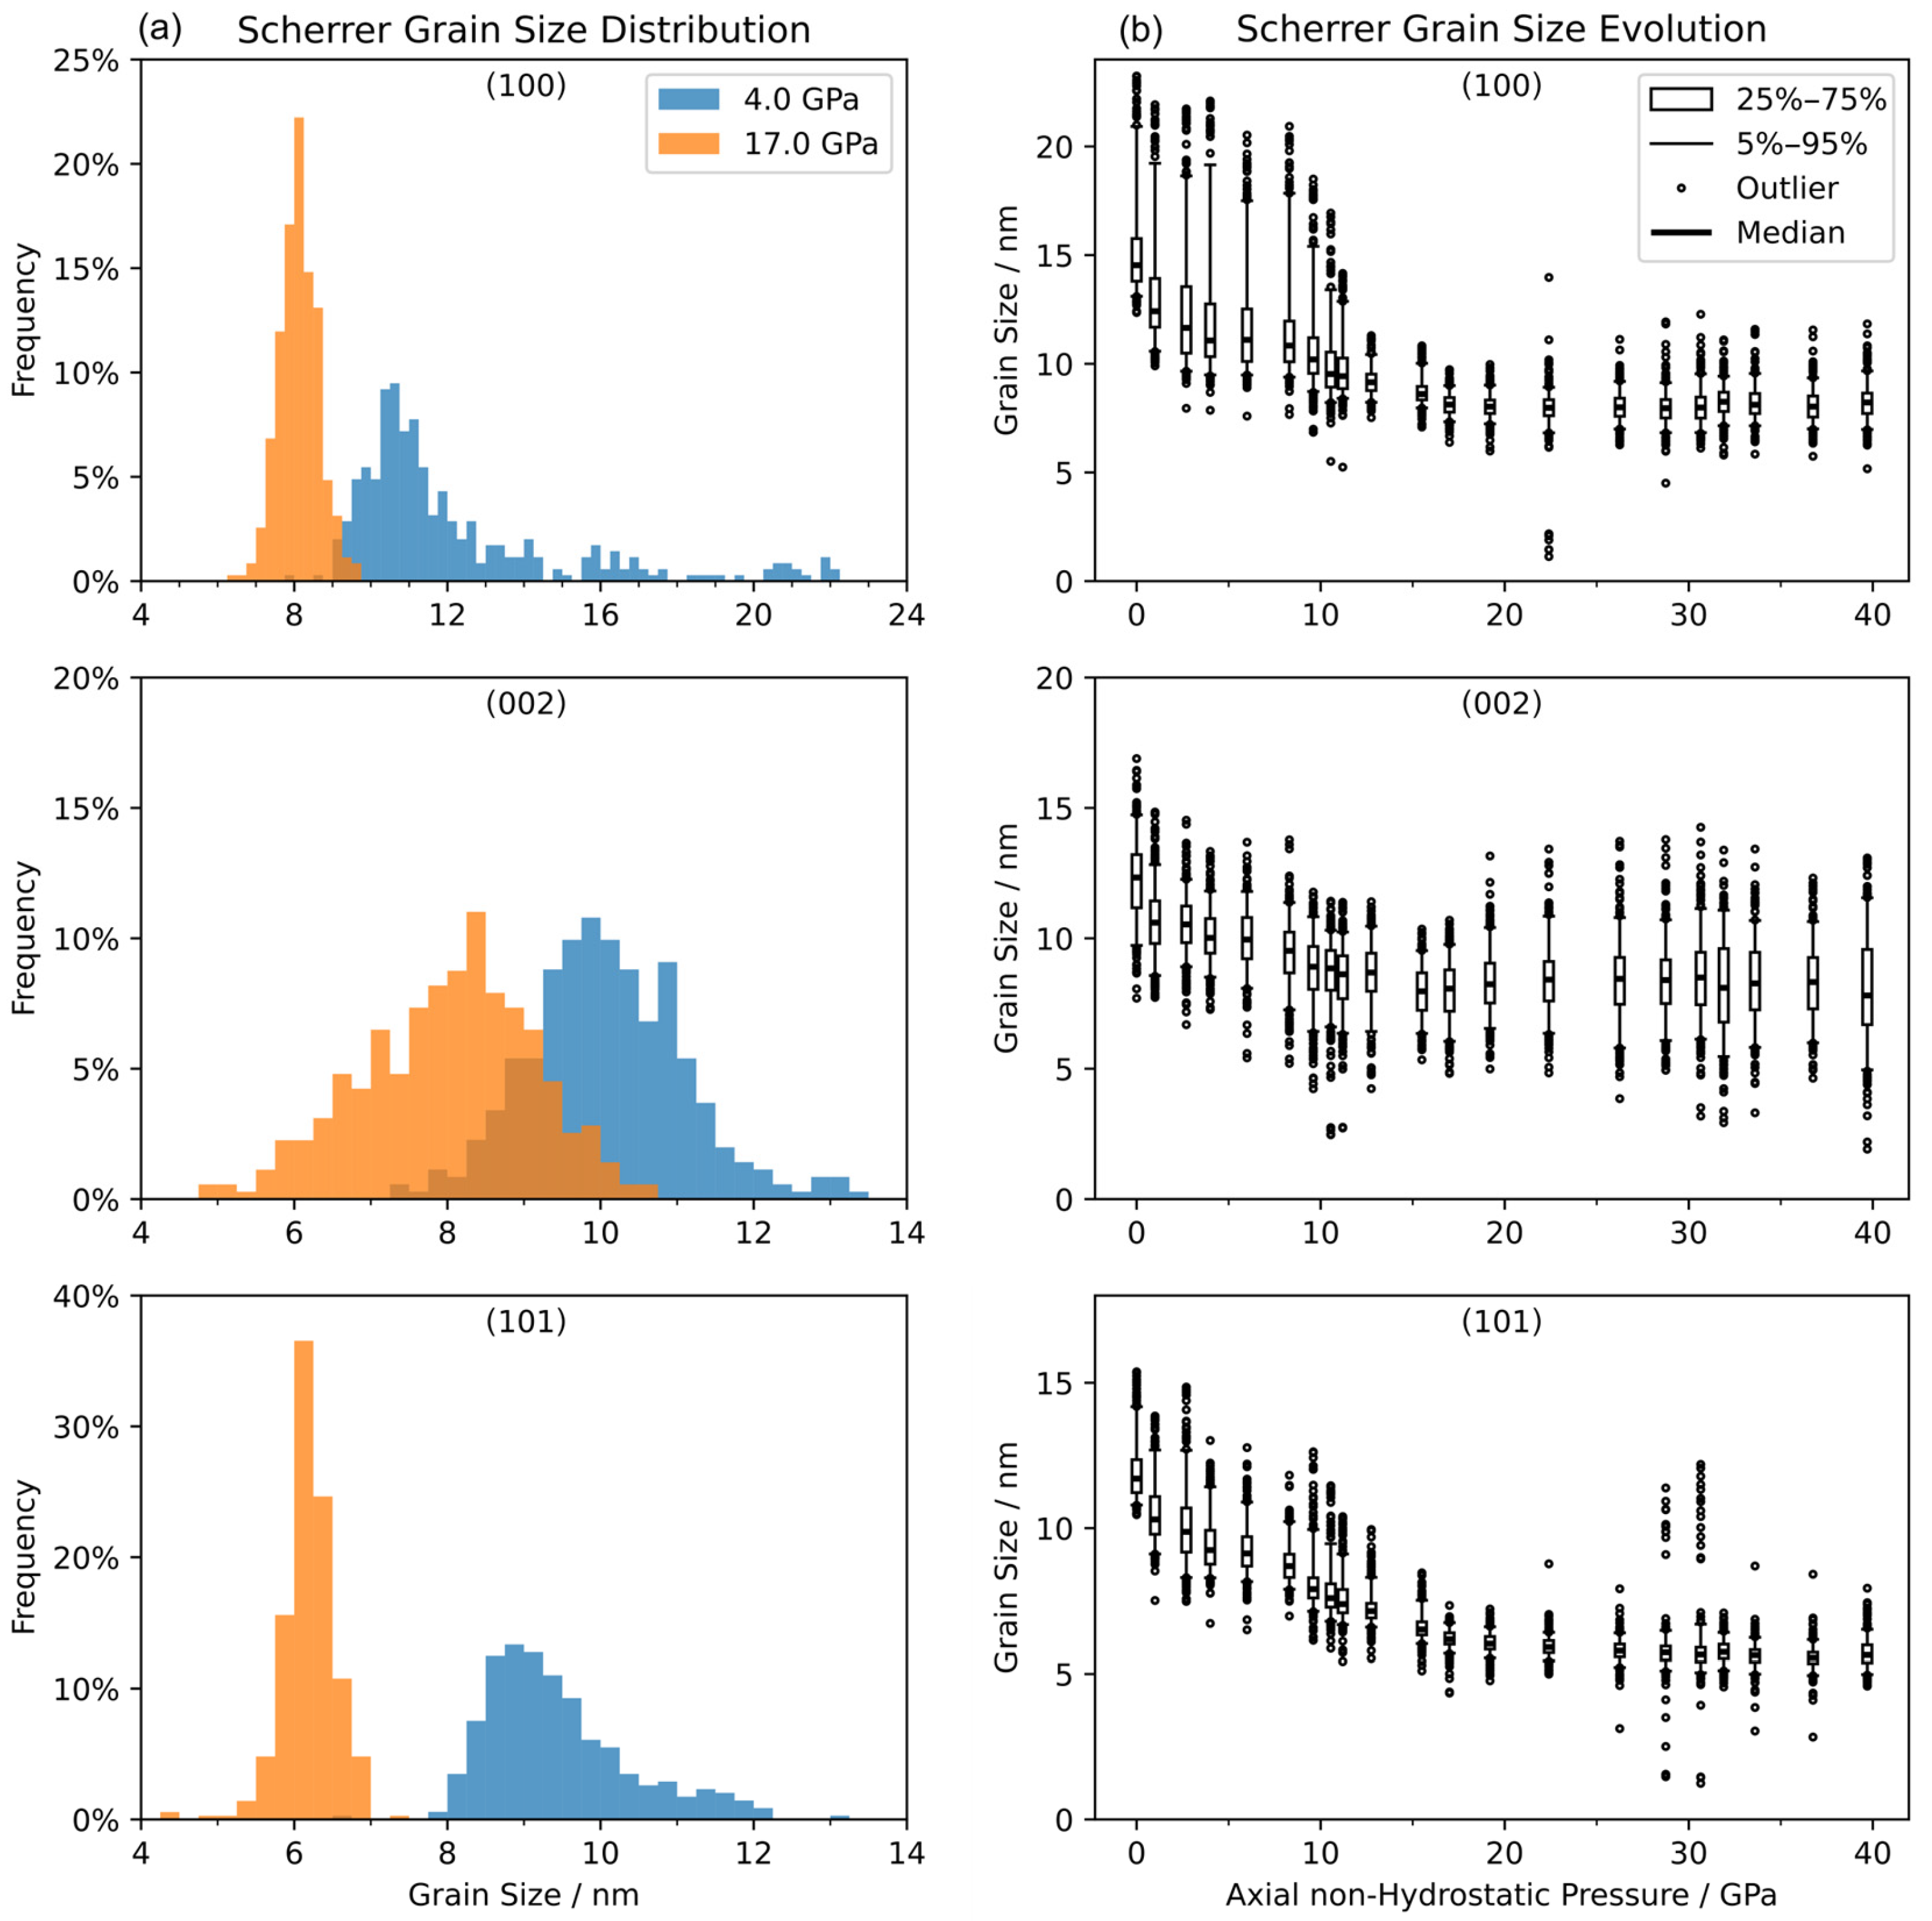
3. Results and Discussion

Figure 3 displays the typical evolution of the axial XRD pattern in the 2 θ - φ coordinate. The wavy shapes of 100 , 002 , 101 peaks across the azimuth angle present angular-dependent lattice strain. It is evident that the amplitude of anisotropy in strain reached a maximum below 10 GPa, remained nearly zero between 10.6 and 12.8 GPa, and exhibited a second maximum around 17.0 GPa. Fitting the experimental observations with Equation (1) shows a nice adoption of this conventional model for anisotropic strains normally observed in radial XRD describing anomalous anisotropic strains in axial XRD [43], as in one example shown in Figure 2b at 17.0 GPa. Intensity variation along the azimuth direction usually indicates the present of texture. In our case, the discrete strong diffraction spots along the azimuth direction below 10.6 GPa were mainly contributed by the big grains, while the smooth diffraction intensity was scattered from fine-grain powder. After 12.8 GPa, only the fine-grain powder pattern was left, indicating a grain size diminishing process between 10.6 GPa and 12.8 GPa.
In an isotropic structure, the lattice plane perpendicular to the compression axis should exhibit the smallest interplanar spacing, while planes parallel to the compression axis have the largest spacing. However, if the smallest interplanar spacing does not occur in the compression direction, or interplanar spacing show dispersion at the same angle with respect to the compression, then there is anomalous anisotropic lattice strain. The anomalous anisotropic strain pattern can be described with Equation (1) when it has a mechanism similar to axial compression (Figure 4).
We conducted the experimental axial XRD and fitting process up to nearly 40 GPa. The pressure-dependent Q 1 , Q 2 and Q 3 plots are summarized in Figure 5a. We can see the consistent trends for Q 1 ,   Q 2 and Q 3 . All Q i ( i = 1,2 , 3 ) reached the first peak values at 2.7 GPa (in good agreement with radial XRD results, see Figure A1), then dropped to nearly 0 between 10 GPa and 13 GPa, followed by a rapid increase to the second peak at 17.0 GPa, and a slow decrease afterward to 40 GPa. The azimuth angle φ c also showed an anomalous change between pressures 10 and 13 GPa. For the first time, we witnessed a double dome of localized anisotropic strain response over pressure, which was largely related to mesoscopic mechanical evolution without any structural phase transition [44].
As shown in Figure 5b, φ 1 ,   φ 2 , a n d   φ 3 were almost constant from 0 to 8 GPa, from 17 to 28 GPa, and from 32 to 40 GPa, while they changed dramatically around 10 GPa and 15 GPa and had a slight shift around 30 GPa. Analysis of φ c evolution gives more evidence of the localized anomalous anisotropic strain depending on the direction of the locally dominant grains’ micro-creep.
Using the Scherrer’s equation, one can estimate the grain size from XRD peak width. We conducted grain-size analysis for all in situ high-pressure XRD measurements up to 40 GPa. In Figure 6a, we present typical grain-size distributions at two applied pressures estimated from three diffraction peaks 100 , 002 , and 101 . The distributions of grain size vs. pressure are plotted in Figure 6b for all pressures measured, showing the pressure-driven grain-size evolution. The grain size had dramatically diminished between 10 and 13 GPa, where the anisotropy of anomalous strain level dropped to nearly zero, indicating the strain could be totally released during this fracturing and deformation process. After 13 GPa, the majority of the grain size was stable at sub-10 nm. It has to be mentioned that we extracted the diffraction peak width from 360 intensity vs. 2 θ profiles with φ angle from 0 to 360 degrees by 1-degree intervals to avoid the artificial peak broadening from integrating anisotropic strain distribution, but diffraction spots from big grains will always contain signals from small grains because the specimen had a mixture of coarse and fine grains. This happened especially when there were more brighter spots from big grains before the dramatic fracture at measured pressures less than 15 GPa. Such underestimation of initial grain sizes does not affect the analyzed trend of grain refinement.
Moreover, together with evidence of φ c evolution, the grain-size evolution (Figure 6b) also supports that while fracture of the dominant local grain happened, the localized strain changed its direction of anisotropy; otherwise, there was little change in anisotropic direction. In this specimen, grains with 100 planes at exact orientation to the diffraction angle contributed the most in fracture. Grain size in the detected local area stayed almost steady after the big drop around 10 GPa, which indicates a critical grain size of this type of compression deformation that remained until the pressure that we applied (39.7 GPa). The grain size indicated by the 002 plane pattern showed a different distribution of outliers above 15 GPa and the split of φ 2 from φ 1 and φ 3 indicates its orientation preference of micro-creep during the strain-relax and the fracture process before it, which also indicates LPO (Figure A2) in the direction of the stronger 002 planes that might dominate the direction of anomalous localized anisotropy of strain in the specimen.
The relaxation behavior of the anomalous strain at the maximum critical anisotropy was consistent throughout the entire specimen. However, the most strained azimuthal angle or the pressure at which secondary anisotropy peaks appears may vary depending on the specific region where the micro-focused X-ray beam is examined. This suggests that while overall behavior was the same as the observation, reflecting the intrinsic anisotropic properties of this alloy, strain characteristics are localized and may differ slightly. As mentioned in Section 2, identifying a region of interest within the specimen is largely a random process, and it is crucial to maintain the same probed region when studying the evolution of anisotropic strain in a specific target. For this reason, we describe it as “localized”.

4. Conclusions

In this work, analytical results obtained from in situ high-pressure XRD on the solid solution HCP–Ag75Al25 alloy give a clear picture that localized anomalous anisotropic strain induced by axial non-hydrostatic uniaxial high pressure follows a path of rapid increase during the initial compression, reaching a critical value of anisotropy, before releasing to nearly zero through the fracture and grain-refinement process. After the sample reaches almost homogeneous grain distribution with average size below a juncture, the local strain starts to build up and reaches another maximum at critical value, followed by a slow drop upon further compression.
The moderate modulus of HCP–Ag75Al25 and its stability in structure under high pressure provided us with an excellent chance to study the evolution of such anomalous anisotropic strain in localized grains induced by the mismatch of axialities between lattice structure and uniaxial compression, with a micro-focused X-ray beam. We root the reason for the localized anomalous anisotropic strain evolution behavior upon uniaxial compression to the LPO effects brought about by the intrinsic anisotropic nature of the material’s HCP structure, which was seen in HCP–Ag75Al25 (Figure A2) and also found in other HCP-structured metals.
Though the microscopic mechanism of such localized phenomena still needs further study, by gaining a deeper understanding of behavior due to such anomalous anisotropic lattice strain evolution under uniaxial pressure through a mesoscopic view, people may fine-tune processing methods such as rolling, bending, or extruding; develop new materials with tailored properties; improve the performance of existing materials; and advance technological applications in fields like electronics, energy, and manufacturing.

Author Contributions

Conceptualization and supervision, W.Y.; investigation, software, data analysis, visualization, and writing, Z.S.; resources and data curation, M.L. and N.L. All authors contributed to the discussion of the results and revision of the manuscript. All authors have read and agreed to the published version of the manuscript.

Funding

This work is supported by National Natural Science Foundation of China under grant Nos. U2230401 and 12204022.

Institutional Review Board Statement

Not applicable.

Informed Consent Statement

Not applicable.

Data Availability Statement

The original data presented in the study are openly available in FigShare at DOI: 10.6084/m9.figshare.28448858. The raw data supporting the conclusions of this article will be made available by the authors on request.

Acknowledgments

The in situ high-pressure XRD was conducted at BL15U of SSRF. We thank beamline staff at BL15U of SSRF for beamline support. We thank Jiayi Guan, Jia Qu, and Jiahao Ning for helping setting up the axial XRD, radial XRD, and ruby-fluorescent pressure-calibration equipment; Yiming Wang for discussing numerical computation and signal processing; Limin Yan and Hongliang Dong for instruction with specialized operations of lab XRD; Chen Xing, Tao Liang, and Qifan Wang for helping with mechanical testing; Yanping Yang for helping with EDS testing; and Mingbo Sun and Huiru Tian for timely machining of customized parts for DACs and holders.

Conflicts of Interest

The authors declare no conflicts of interest.

Abbreviations

The following abbreviations are used in this manuscript:
DACDiamond anvil cell
EDSEnergy dispersive spectrometer
FWHMFull width at half maximum
HCPHexagonal close-packed
LPOLattice-preferred orientation
PTMPressure-transmitting medium
XRDX-ray diffraction

Appendix A

It is quite common [45,46] to measure the normal anisotropic strain with in situ high pressure using the radial X-ray diffraction geometry, as shown in Figure A1a. An X-ray transparent beryllium gasket is used for this geometry. The direction of applied non-hydrostatic uniaxial pressure is perpendicular to the incident X-ray beam, and a panoramic DAC is used. Due to safety and health concerns related to the beryllium gasket, the highest pressure applied in this study was 8 GPa under restrict protection. The anisotropic strain factor Q i ( i = 1,2 , 3 ) at measured pressure is plotted in Figure A1b, the rapid increase of factor Q up to 2.7 GPa agrees with the measurements collected with axial XRD. After 2.7 GPa, factor Q fluctuates around its maximum, indicating the presence of fracturing.
Figure A1. (a) Schematic of radial XRD setup. (b) Factor Q analyzed from radial XRD of the HCP–Ag75Al25 alloy.
Materials 18 01650 g0a1
Radial XRD can also be used to extract the LPO properties of the material. Small grains of HCP–Ag75Al25 were aggregated and then compressed, cut, and stacked. This procedure of stacking, cutting, and compressing was repeated 10 times for better exhibition of effects by LPO, using a DAC equipped with 2 mm diameter culet diamonds forming a sheet-shaped specimen of around 1.5   m m × 1.5   m m . This sheet-like specimen was then cut, stacked, and compressed directly into a chamber with 300   μ m diameter. Radial XRD with an X-ray beam of normal spot size at ambient pressure showed the strong texture of the LPO with diffraction intensities of 002 distributed more around the compression direction, at φ = 0 ° and φ = 180 ° (Figure A2).
Figure A2. Pattern of the 10-times cycling compressed HCP–Ag75Al25 alloy specimen from radial XRD showing strong texture. Index of lattice planes (arrows at top) and instrumental backgrounds (Instr. Bkg., arrows at bottom) are marked.
Materials 18 01650 g0a2

Appendix B

For comparison, we conducted axial XRD measurement on a much stronger HCP metal, rhenium (99.98% commercial 0.25   m m thick foil, from Sigma-Aldrich, compressed to 30   μ m thick with DAC), up to 51.1 GPa with non-hydrostatic uniaxial pressure. Anomalous anisotropic strain showed in the coarse- and fine-grained rhenium. The anomalous anisotropy was smaller than in the HCP–Ag75Al25 alloy, and no obvious evolution was observed up to 51.1 GPa. The 2 θ - φ unrolled XRD pattern is presented in Figure A3 with axial non-hydrostatic pressure at the highest measured pressure of 51.1 GPa. In the pattern, it can be seen that φ c of 002 differed by 51 ° from φ c of 100 and 101 , which meant it could not be caused by bias from the geometry of the setup.
Figure A3. Unrolled axial XRD pattern of rhenium at 51.1 GPa. The same image is shown in (a,b), but with different applied contrast to show the bright 100   a n d 101 rings and the dim 002 ring.
Materials 18 01650 g0a3

References

  1. Kocks, U.F. The Relation between Polycrystal Deformation and Single-Crystal Deformation. Metall. Trans. 1970, 1, 1121–1143. [Google Scholar] [CrossRef]
  2. Cambou, B.; Dubujet, P.; Nouguier-Lehon, C. Anisotropy in Granular Materials at Different Scales. Mech. Mater. 2004, 36, 1185–1194. [Google Scholar] [CrossRef]
  3. Hutchinson, B. Critical Assessment 16: Anisotropy in Metals. Mater. Sci. Technol. 2015, 31, 1393–1401. [Google Scholar] [CrossRef]
  4. Nishihara, Y.; Ohuchi, T.; Kawazoe, T.; Seto, Y.; Maruyama, G.; Higo, Y.; Funakoshi, K.; Tange, Y.; Irifune, T. Deformation-Induced Crystallographic-Preferred Orientation of Hcp-Iron: An Experimental Study Using a Deformation-DIA Apparatus. Earth Planet. Sci. Lett. 2018, 490, 151–160. [Google Scholar] [CrossRef]
  5. Merkel, S.; Yagi, T. Effect of Lattice Preferred Orientation on Lattice Strains in Polycrystalline Materials Deformed under High Pressure: Application to Hcp-Co. J. Phys. Chem. Solids 2006, 67, 2119–2131. [Google Scholar] [CrossRef]
  6. Wang, Y.N.; Huang, J.C. Texture Analysis in Hexagonal Materials. Mater. Chem. Phys. 2003, 81, 11–26. [Google Scholar] [CrossRef]
  7. Barton, N.; Quadros, E. Anisotropy Is Everywhere, to See, to Measure, and to Model. Rock Mech. Rock Eng. 2015, 48, 1323–1339. [Google Scholar] [CrossRef]
  8. Koneva, N.A.; Trishkina, L.I.; Popova, N.A.; Kozlov, É.V. Accumulation of Defects During Plastic Deformation of Polycrystals of the Meso- and Microscale Grain Size. Russ. Phys. J. 2014, 57, 187–196. [Google Scholar] [CrossRef]
  9. Panin, V.E.; Egorushkin, V.E.; Elsukova, T.F.; Surikova, N.S.; Pochivalov, Y.I.; Panin, A.V. Multiscale Translation-Rotation Plastic Flow in Polycrystals. In Handbook of Mechanics of Materials; Schmauder, S., Chen, C.-S., Chawla, K.K., Chawla, N., Chen, W., Kagawa, Y., Eds.; Springer: Singapore, 2019; pp. 1255–1292. ISBN 978-981-10-6884-3. [Google Scholar]
  10. Yang, G.; Park, S.-J. Deformation of Single Crystals, Polycrystalline Materials, and Thin Films: A Review. Materials 2019, 12, 2003. [Google Scholar] [CrossRef]
  11. Koneva, N.A.; Potekaev, A.I.; Trishkina, L.I.; Cherkasova, T.V.; Klopotov, A.A. Critical Grain Size at Meso-Level after Deformation of Polycrystalline Metals and Alloys in Low-Stability State. Russ. Phys. J. 2020, 63, 773–778. [Google Scholar] [CrossRef]
  12. McAlister, A.J. The Ag−Al (Silver-Aluminum) System. Bull. Alloy Phase Diagr. 1987, 8, 526–533. [Google Scholar] [CrossRef]
  13. Zarkevich, N.A.; Johnson, D.D. Predicted Hcp Ag-Al Metastable Phase Diagram, Equilibrium Ground States, and Precipitate Structure. Phys. Rev. B 2003, 67, 064104. [Google Scholar] [CrossRef]
  14. Terlicka, S.; Dębski, A.; Gierlotka, W.; Wierzbicka-Miernik, A.; Budziak, A.; Sypien, A.; Zabrocki, M.; Gąsior, W. Structural and Physicochemical Properties of Silver-Rich Ag–Al Alloys. Calphad 2020, 68, 101739. [Google Scholar] [CrossRef]
  15. Guo, N.; Zhao, J. The Signature of Shear-Induced Anisotropy in Granular Media. Comput. Geotech. 2013, 47, 1–15. [Google Scholar] [CrossRef]
  16. Kumar, N.; Imole, O.I.; Magnanimo, V.; Luding, S. Effects of Polydispersity on the Micro–Macro Behavior of Granular Assemblies under Different Deformation Paths. Particuology 2014, 12, 64–79. [Google Scholar] [CrossRef]
  17. Messner, M.C.; Rhee, M.; Arsenlis, A.; Barton, N.R. A Crystal Plasticity Model for Slip in Hexagonal Close Packed Metals Based on Discrete Dislocation Simulations. Model. Simul. Mater. Sci. Eng. 2017, 25, 044001. [Google Scholar] [CrossRef]
  18. Imole, O.I.; Wojtkowski, M.; Magnanimo, V.; Luding, S. Micro-Macro Correlations and Anisotropy in Granular Assemblies under Uniaxial Loading and Unloading. Phys. Rev. E 2014, 89, 042210. [Google Scholar] [CrossRef]
  19. Capolungo, L.; Beyerlein, I.J.; Wang, Z.Q. The Role of Elastic Anisotropy on Plasticity in Hcp Metals: A Three-Dimensional Dislocation Dynamics Study. Model. Simul. Mater. Sci. Eng. 2010, 18, 085002. [Google Scholar] [CrossRef]
  20. Kondori, B.; Madi, Y.; Besson, J.; Benzerga, A.A. Evolution of the 3D Plastic Anisotropy of HCP Metals: Experiments and Modeling. Int. J. Plast. 2019, 117, 71–92. [Google Scholar] [CrossRef]
  21. Antonangeli, D.; Merkel, S.; Farber, D.L. Elastic Anisotropy in Hcp Metals at High Pressure and the Sound Wave Anisotropy of the Earth’s Inner Core. Geophys. Res. Lett. 2006, 33, L24303. [Google Scholar] [CrossRef]
  22. Antonangeli, D.; Occelli, F.; Requardt, H.; Badro, J.; Fiquet, G.; Krisch, M. Elastic Anisotropy in Textured Hcp-Iron to 112 GPa from Sound Wave Propagation Measurements. Earth Planet. Sci. Lett. 2004, 225, 243–251. [Google Scholar] [CrossRef]
  23. Wenk, H.-R.; Matthies, S.; Hemley, R.J.; Mao, H.-K.; Shu, J. The Plastic Deformation of Iron at Pressures of the Earth’s Inner Core. Nature 2000, 405, 1044–1047. [Google Scholar] [CrossRef] [PubMed]
  24. Stixrude, L.; Cohen, R.E. High-Pressure Elasticity of Iron and Anisotropy of Earth’s Inner Core. Science 1995, 267, 1972–1975. [Google Scholar] [CrossRef]
  25. Sokolov, A.S.; Trusov, P.V. Evaluation of the Effect of Considering Elastic Anisotropy on the Response of Polycrystals with Tetragonal and HCP Lattices. AIP Conf. Proc. 2021, 2371, 050009. [Google Scholar] [CrossRef]
  26. Hutchinson, J.W. Creep and Plasticity of Hexagonal Polycrystals as Related to Single Crystal Slip. Metall. Trans. A 1977, 8, 1465–1469. [Google Scholar] [CrossRef]
  27. Zhang, Z.; Jun, T.-S.; Britton, T.B.; Dunne, F.P.E. Intrinsic Anisotropy of Strain Rate Sensitivity in Single Crystal Alpha Titanium. Acta Mater. 2016, 118, 317–330. [Google Scholar] [CrossRef]
  28. Barannikova, S.A.; Kolosov, S.V. Localized Plastic Deformation Patterns in FCC Single Crystals. Russ. Phys. J. 2023, 66, 8–15. [Google Scholar] [CrossRef]
  29. Park, Y.; Wakamatsu, T.; Azuma, S.; Nishihara, Y.; Ohta, K. Characterization of the Lattice Preferred Orientation of Hcp Iron Transformed from the Single-Crystal Bcc Phase in Situ at High Pressures up to 80 GPa. Phys. Chem. Miner. 2024, 51, 31. [Google Scholar] [CrossRef]
  30. Bočan, J.; Maňák, J.; Jäger, A. Anisotropic Mechanical Properties of Pure Magnesium Analyzed by In Situ Nanoindentation. Key Eng. Mater. 2015, 662, 11–14. [Google Scholar] [CrossRef]
  31. Ma, Z.-C.; Tang, X.-Z.; Mao, Y.; Guo, Y.-F. The Plastic Deformation Mechanisms of Hcp Single Crystals with Different Orientations: Molecular Dynamics Simulations. Materials 2021, 14, 733. [Google Scholar] [CrossRef]
  32. Mao, W.L.; Struzhkin, V.V.; Baron, A.Q.R.; Tsutsui, S.; Tommaseo, C.E.; Wenk, H.-R.; Hu, M.Y.; Chow, P.; Sturhahn, W.; Shu, J.; et al. Experimental Determination of the Elasticity of Iron at High Pressure. J. Geophys. Res. Solid Earth 2008, 113, B09213. [Google Scholar] [CrossRef]
  33. Kádas, K.; Vitos, L.; Ahuja, R. Elastic Properties of Iron-Rich Hcp Fe–Mg Alloys up to Earth’s Core Pressures. Earth Planet. Sci. Lett. 2008, 271, 221–225. [Google Scholar] [CrossRef]
  34. Niu, Z.; Zeng, S.; Tang, M.; Yang, Z. Elastic Properties of Disordered Binary Hcp-Fe Alloys under High Pressure: Effects of Light Elements. ChemPhysMater 2023, 2, 155–163. [Google Scholar] [CrossRef]
  35. Antonangeli, D.; Krisch, M.; Fiquet, G.; Badro, J.; Farber, D.L.; Bossak, A.; Merkel, S. Aggregate and Single-Crystalline Elasticity of Hcp Cobalt at High Pressure. Phys. Rev. B 2005, 72, 134303. [Google Scholar] [CrossRef]
  36. Goncharov, A.F.; Crowhurst, J.; Zaug, J.M. Elastic and Vibrational Properties of Cobalt to 120 GPa. Phys. Rev. Lett. 2004, 92, 115502. [Google Scholar] [CrossRef]
  37. Momma, K.; Izumi, F. VESTA 3 for Three-Dimensional Visualization of Crystal, Volumetric and Morphology Data. J. Appl. Crystallogr. 2011, 44, 1272–1276. [Google Scholar] [CrossRef]
  38. Prescher, C.; Prakapenka, V.B. DIOPTAS: A Program for Reduction of Two-Dimensional X-ray Diffraction Data and Data Exploration. High Press. Res. 2015, 35, 223–230. [Google Scholar] [CrossRef]
  39. Singh, A.K.; Balasingh, C.; Mao, H.; Hemley, R.J.; Shu, J. Analysis of Lattice Strains Measured under Nonhydrostatic Pressure. J. Appl. Phys. 1998, 83, 7567–7575. [Google Scholar] [CrossRef]
  40. Duffy, T.S.; Shen, G.; Heinz, D.L.; Shu, J.; Ma, Y.; Mao, H.-K.; Hemley, R.J.; Singh, A.K. Lattice Strains in Gold and Rhenium under Nonhydrostatic Compression to 37 GPa. Phys. Rev. B 1999, 60, 15063–15073. [Google Scholar] [CrossRef]
  41. Merkel, S. Radial Diffraction in the Diamond Anvil Cell: Methods and Applications. In High-Pressure Crystallography; Springer: Dordrecht, The Netherlands, 2010; pp. 111–122. [Google Scholar]
  42. Hu, J.Z.; Mao, H.K.; Shu, J.F.; Guo, Q.Z.; Liu, H.Z. Diamond Anvil Cell Radial X-ray Diffraction Program at the National Synchrotron Light Source. J. Phys. Condens. Matter 2006, 18, S1091. [Google Scholar] [CrossRef]
  43. Lutterotti, L. Maud: A Rietveld Analysis Program Designed for the Internet and Experiment Integration. Acta Crystallogr. A 2000, 56, s54. [Google Scholar] [CrossRef]
  44. Yan, X.; Dong, H.; Li, Y.; Lin, C.; Park, C.; He, D.; Yang, W. Phase Transition Induced Strain in ZnO under High Pressure. Sci. Rep. 2016, 6, 24958. [Google Scholar] [CrossRef] [PubMed]
  45. Chen, H.; He, D.; Liu, J.; Li, Y.; Peng, F.; Li, Z.; Wang, J.; Bai, L. High-Pressure Radial X-ray Diffraction Study of Osmium to 58 GPa. Eur. Phys. J. B 2010, 73, 321–326. [Google Scholar] [CrossRef]
  46. Xiong, L.; Li, B.; Tang, Y.; Li, Q.; Hao, J.; Bai, L.; Li, X.; Liu, J. Radial X-ray Diffraction Study of the Static Strength and Texture of Tungsten to 96 GPa. Solid State Commun. 2018, 269, 83–89. [Google Scholar] [CrossRef]
Figure 1. Pristine sample characterization at ambient pressure. (a) XRD pattern with a lab Cu-target X-ray source. (b) Vickers hardness testing loading up to 1 kg. The inserted picture is an optical micrograph of indentations on the polished Ag75Al25 surface.
Materials 18 01650 g001
Figure 2. (a) Schematic of axial XRD experiment setup. (b) Contour plots of experimental and simulated XRD patterns with MAUD 2.998 of alloy specimen at 17 GPa show anisotropic strain and LPO.
Materials 18 01650 g002
Figure 3. Unrolled axial XRD pattern evolution with applied pressure. Axis ticks are shared along portrait and landscape direction for a compact presentation of the pattern evolution.
Materials 18 01650 g003
Figure 4. Fitting results of anomalous anisotropic strain in XRD patterns at pressures 4.0 GPa (ac) and 17.0 GPa (df). Factors Q and φ c for planes 100 , 002   a n d   101 are noted as Q 1 , Q 2 ,   a n d   Q 3 and φ 1 ,   φ 2 ,   a n d   φ 3 , respectively. Vertical bars are fitted peak positions at the given azimuthal angle φ .
Materials 18 01650 g004
Figure 5. (a) Evolution of factors Q i with applied pressure. (b) Evolution of φ c with applied pressure.
Materials 18 01650 g005
Figure 6. (a) Grain-size distribution estimated by Scherrer’s equation along the diffraction pattern ring at 4.0 GPa and 17.0 GPa. (b) Grain-size evolution at applied pressures.
Materials 18 01650 g006
Disclaimer/Publisher’s Note: The statements, opinions and data contained in all publications are solely those of the individual author(s) and contributor(s) and not of MDPI and/or the editor(s). MDPI and/or the editor(s) disclaim responsibility for any injury to people or property resulting from any ideas, methods, instructions or products referred to in the content.

