Communication

Photoluminescence and Crystal-Field Analysis of Reddish CaYAl3O7: Eu3+ Phosphors for White LEDs

1
School of Computing and Artificial Intelligence, Southwest Jiaotong University, Chengdu 610031, China
2
China Railway Engineering Group Limited, Beijing 100039, China
3
Key Laboratory of Advanced Technologies of Materials (Ministry of Education), School of Materials Science and Engineering, Southwest Jiaotong University, Chengdu 610031, China
*
Author to whom correspondence should be addressed.
Materials 2025, 18(7), 1578; https://doi.org/10.3390/ma18071578
Submission received: 18 February 2025 / Revised: 18 March 2025 / Accepted: 24 March 2025 / Published: 31 March 2025

Abstract

:
Red melilite structure CaY1−xAl3O7: Eux (x = 0.04–0.24) phosphors for white LEDs were synthesized through a straightforward solid-state reaction process. These phosphors exhibit efficient excitation under near-ultraviolet light at 398 nm (7F05L6), producing the desired emission peak at 622 nm from the transitions of 5D07F2. The Eu doping concentration was also optimized as x = 0.16. The complete 3003 × 3003 energy matrix was constructed based on an effective Hamiltonian including both free-ion and crystal-field interactions within a complete diagonalization method (CDM). Eighteen experimental fluorescent spectra for Eu3+ ions at the Y3+ site of CaYAl3O7 crystal were quantitatively identified with high accuracy through fitting calculations. The fitting values are in reasonable agreement with the experimental results, thereby showcasing the efficacy of the CDM in probing luminescent phosphors for white LEDs.

1. Introduction

Over the past few years, white light-emitting diodes (w-LEDs) have emerged at the forefront of next-generation lighting technology due to their superior features such as higher brightness, longer operation time (>100,000 h), and lower energy consumption [1,2,3,4,5,6,7,8,9]. Presently, there are two main ways to assemble commercial white LEDs. The first is the combination of GaN-based blue LED chips with yellow- and red-emitting phosphors [10,11,12]. This type of w-LED typically exhibits a low color-rendering index, which is attributed to the relatively strong blue light of blue LED chips and the comparatively low luminescence efficiency of red phosphors. Another method for generating white light involves utilizing GaAIN-based ultraviolet (UV) LEDs coated with three distinct phosphors emitting blue, green, and red wavelengths [13,14,15,16]. But there is still a big challenge in achieving high performance due to the relatively low luminescence efficiency of red-emitting phosphors [17]. As an attempt, various Eu3+ doped red phosphors were developed [2,11]. Although these phosphors can effectively overcome the poor color rendering of GaN-based (about 460 nm) white LEDs, they are more difficult to be excited by GaAIN-based near-UV chips at about 400 nm. Moreover, compared with the inherently excessive blue light of a GaN-based chip, near-UV-based w-LEDs should be a more effective packaging model for resolving the poor color rendering of w-LEDs [15,16]. As we know, the Eu3+-doped red phosphors can be excited by both blue (460 nm) and near UV (400 nm). Mostly, blue light is more effective than near-UV light because of the crystal-field interaction of host crystals [2]. For this reason, the crystal structure of host crystals can be used to effectively tune the excited spectra of Eu3+-doped red phosphors for near-UV light excited w-LEDs.
Recently, the melilite structure CaYAl3O7 (CYA) [18,19] was demonstrated to be an effective host crystal material for tuning the excitation spectra of red Eu3+-doped phosphors for w-LEDs [20,21,22]. The melilite group comprises minerals characterized by a general form ABC3O7, where both A and B occupy the 4e positions [18,19,20,21,22] (Figure 1a). As shown in Figure 1b, the Ca/Y in the polyhedron with a coordination number of eight will likely be replaced by Eu3+ [20,21,22]. Several studies successfully tuned the strongest excitation spectra from blue 460 nm to near-UV 400 nm by partly substituting trivalent Eu3+ ions for Y3+ ions. The red emission spectra mainly focused on the range of 613–618 nm [20,21,22]. However, the underlying luminescent mechanisms of red Eu3+-doping CYA phosphors have been ambiguous to date, and it is desirable to quantitatively identify these spectra.
Here, we demonstrated reddish Ca1−xYAl3O7: Eux (x = 0.04–0.24) (CYAE) phosphors for w-LEDs by using the trivalent Eu3+ ion to replace trivalent Y3+ ion at the same 4e position of the host crystal. The highest peak of the red emission spectra was red-shifted to 622 nm. In addition, the complete diagonalization (of energy matrix) method (CDM) of crystal-field theory (CFT) was employed to accurately discern the spectra of Eu3+ ions within crystals. This involved utilizing an effective Hamiltonian incorporating both free-ion and crystal-field interactions. The as-grown reddish CYAE phosphors exhibit robust red emission spectra, predominantly centered around 622 nm, upon excitation by near-UV light at 398 nm. More importantly, the origins of all experimental 18 emission spectra were accurately identified by the CDM method, which is useful for elucidating the fluorescent mechanism of Eu3+ ions at the Y3+ site of CYA crystals, particularly in the context of rare earth ion-doped phosphors tailored for applications in w-LEDs.

2. Experimental Methods

The reddish CYAE phosphors were synthesized via a straightforward solid-state reaction method. CaCO3 (99.5%), Y2O3 (99.99%), Al2O3 (99.99%), and Eu2O3 (99.99%) were selected as the source materials. These starting materials, in appropriate stoichiometric ratios, were thoroughly mixed in an agate mortar to ensure homogeneity. Subsequently, the mixture underwent pre-annealing at 500 °C for 3 h followed by annealing at 1500 °C for 5 h.
The crystal structures of the red CYAE phosphors were analyzed using the XPert Pro MPD (Malvern PANalytical, Almelo, The Netherlands) X-ray diffractometer, employing Cu Kα1 radiation (λ = 0.154 nm). The morphology and stoichiometry of the as-grown reddish-orange phosphors were assessed via scanning electron microscopy (SEM, FEI QUANTA FEG 250, Hillsboro, OR, USA) and energy-dispersive X-ray spectroscopy (EDS, FEI QUANTA FEG 250, Hillsboro, OR, USA), respectively. Additionally, their room-temperature photoluminescent (PL) spectra were examined utilizing a Hitachi F7000 spectrofluorometer (Hitachi High-Technologies Corporation, Tokyo, Japan), with a 150 W xenon lamp serving as the excitation energy source.
The calculated energy levels in Table 3 are obtained via the complete diagonalization method (CDM) based on crystal-field theory. An effective Hamiltonian, incorporating free-ion and crystal-field interactions, is constructed as a 3003 × 3003 matrix. The matrix is diagonalized to yield energy levels. Free-ion parameters and crystal-field parameters are optimized by minimizing the root mean square deviation (RMSD) between calculated and experimental spectra. The optimized parameters are then used to compute the energy levels listed in the Calc. column.

3. Results and Discussion

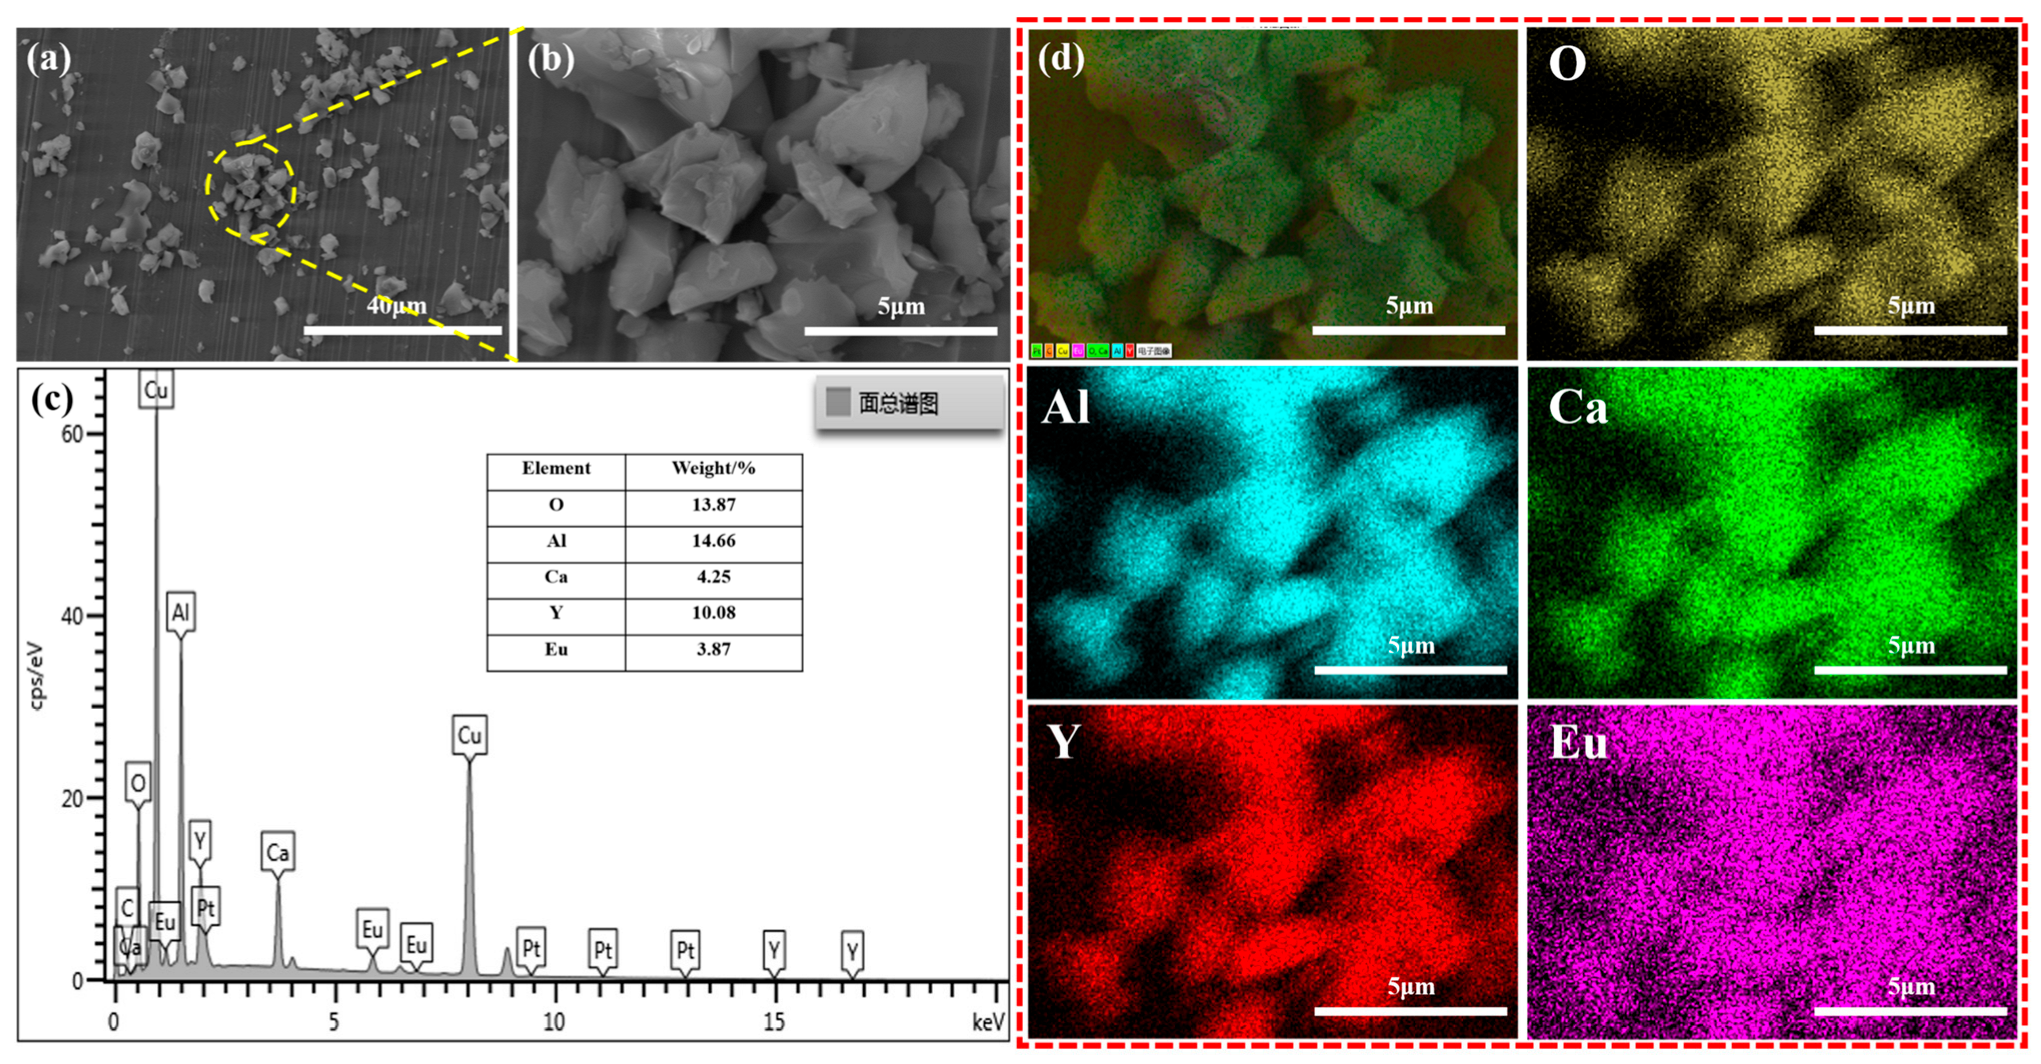
3.1. Crystal Structure and Morphology Characterization

All XRD patterns of the reddish CYAE phosphors are shown in Figure 2 and are in good agreement with JCPDS No. 49-0605 in the Inorganic Crystal Structure Database. This suggests that Eu3+-doped phosphors do not contain any other phases in the host structure. Moreover, the luminous and heat dissipation efficiencies of phosphors intended for white LEDs are frequently influenced by their size and shape, which were, therefore, investigated with SEM. As shown in Figure 3a,b, the CYAE crystalline grains have a diameter of around 2–7 µm, which is appropriate for encapsulation in white LEDs [2,3,11]. Additionally, EDS mapping was utilized to confirm the nominal stoichiometry of the red phosphors CaY0.76Al3O7:Eu0.24 (Figure 3c,d). The element mass ratio MCa:MY:MAl:MO:MEu (0.9:0.95:4.59:7.33:0.22) is close to the stoichiometry of CaY0.76Al3O7:Eu0.24 (1:0.76:3:7:0.24). The EDS mapping indicates that Eu3+-doping ions are uniformly dispersed in the CYAE phosphors.

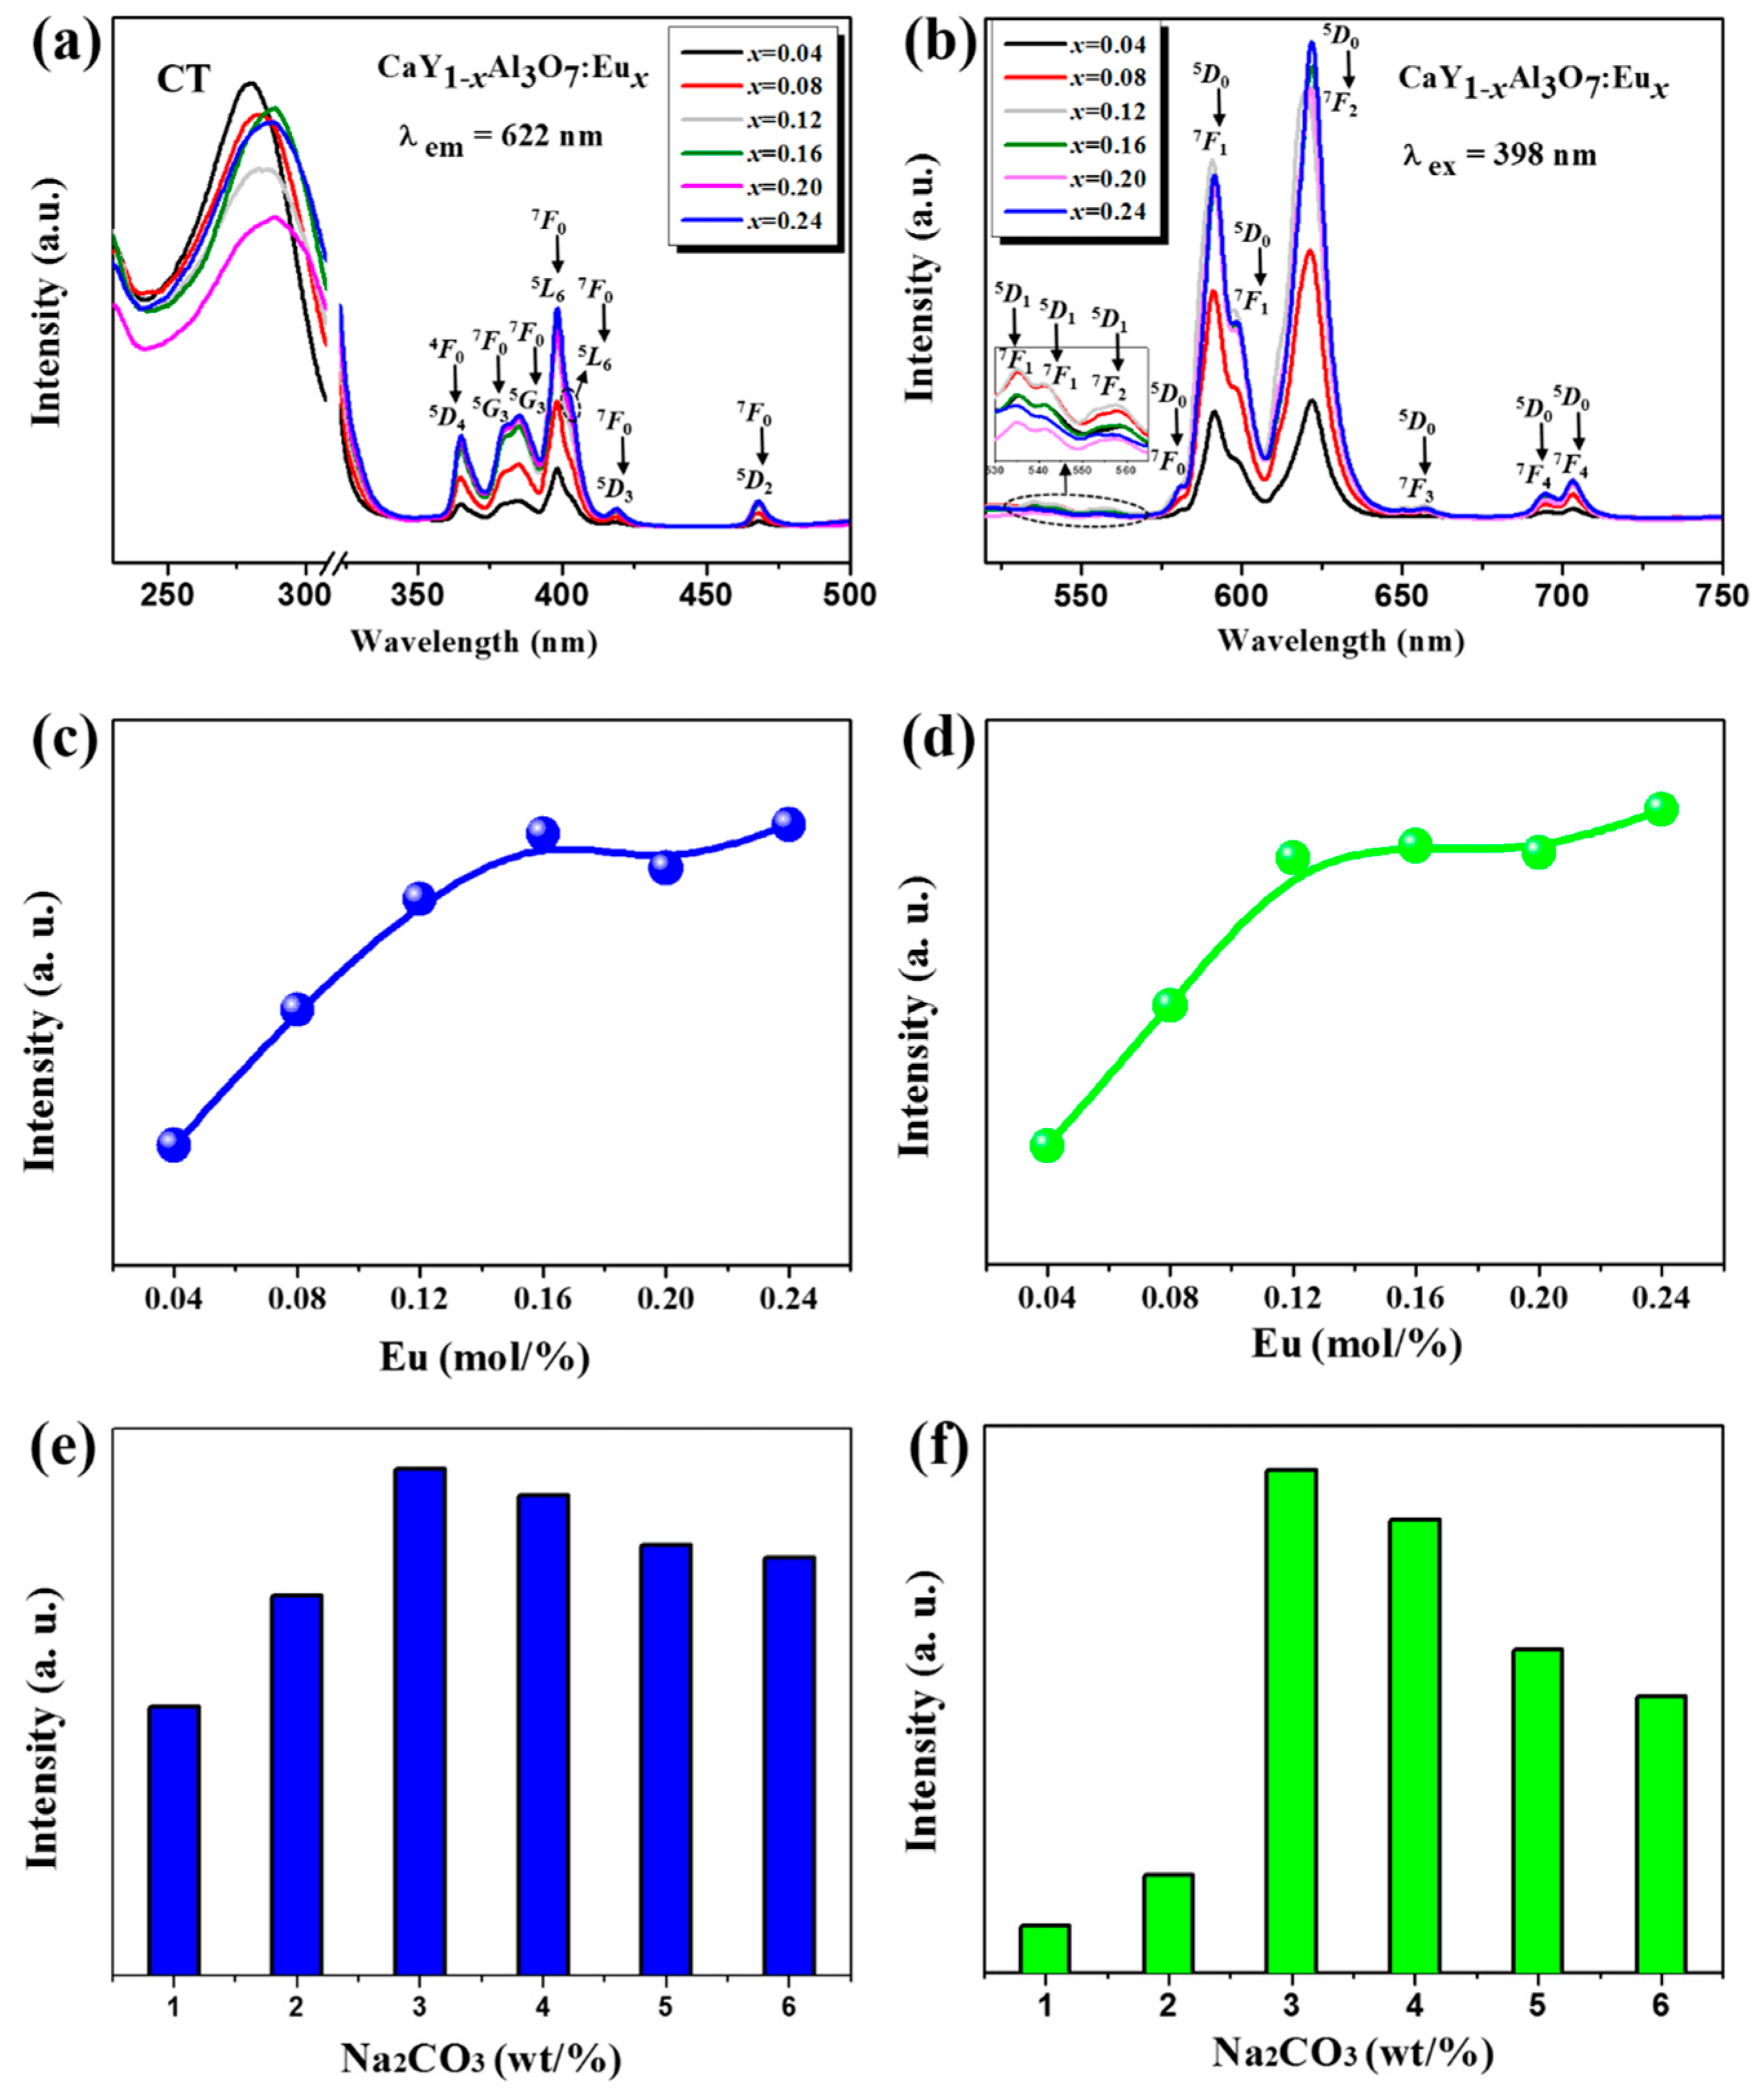
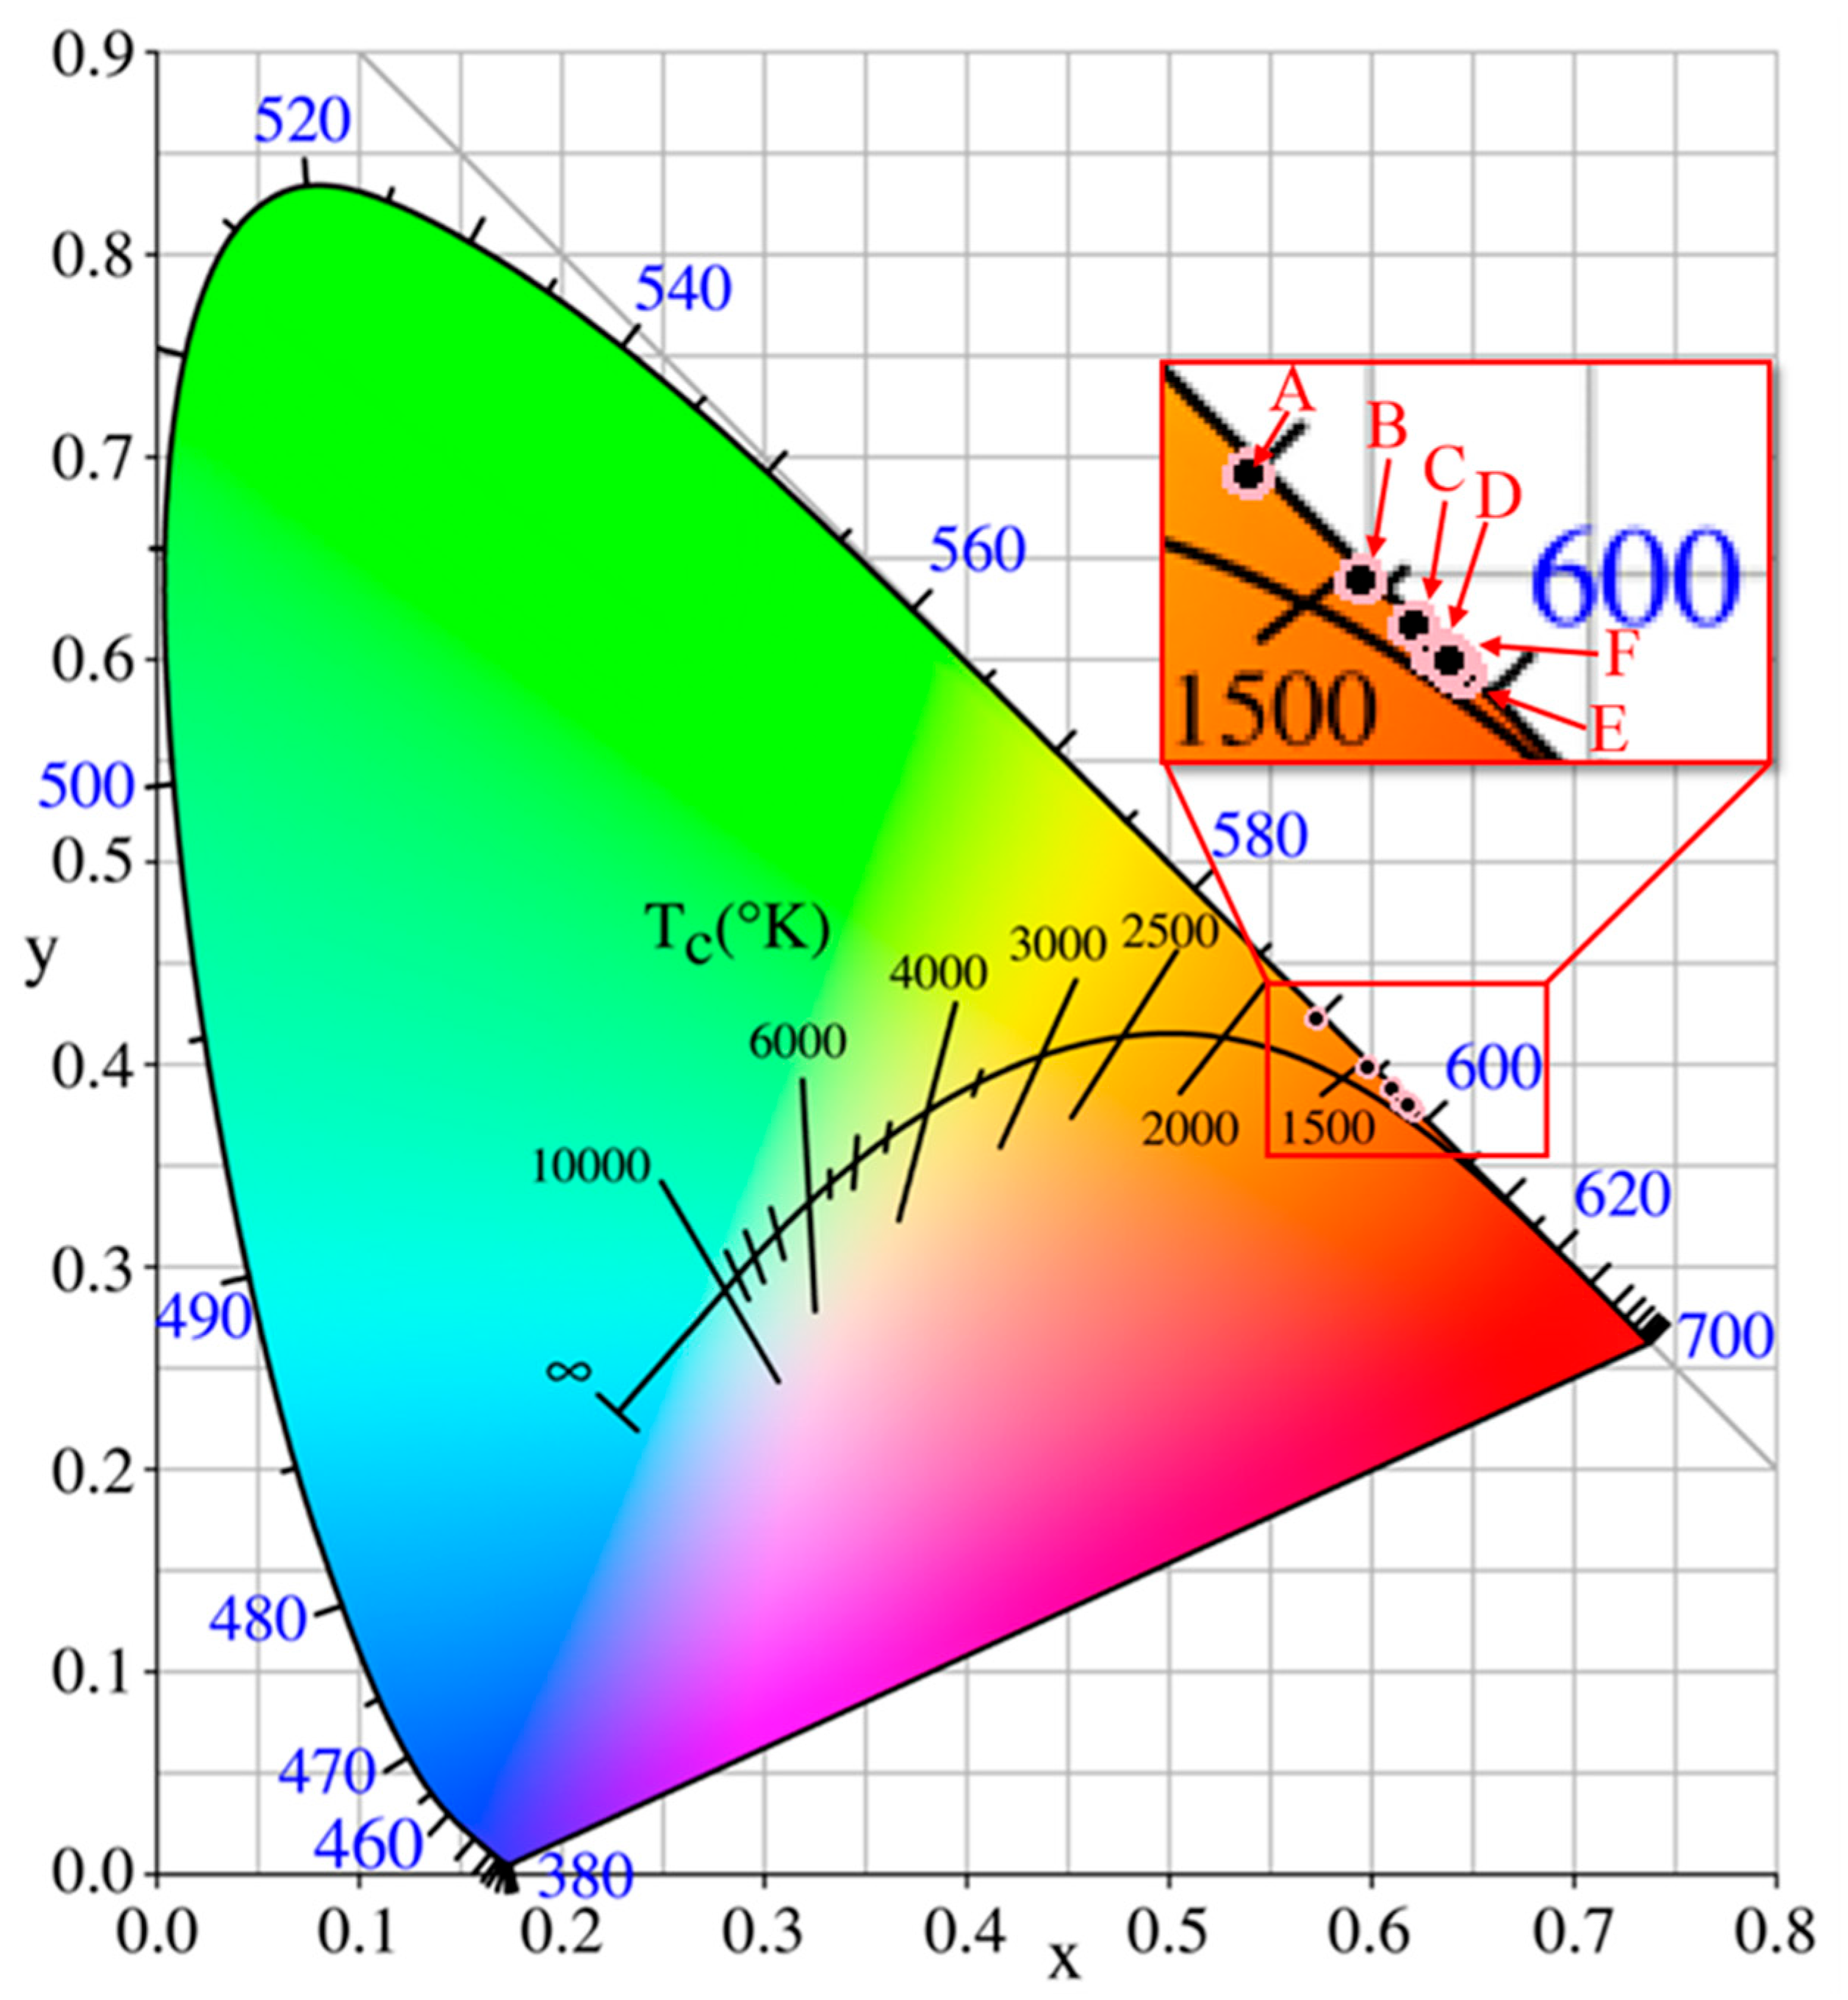
3.2. Photoluminescence Characteristics

Figure 4 details the photoluminescent properties of as-grown CYAE phosphors, including the optimal 3 wt% Na2CO3. In Figure 4a, the excitation spectra of the reddish CYAE phosphors precisely correspond to an emission wavelength of approximately λem = 622 nm. These spectra, characterized by a series of distinct peaks, originate from the f-f absorption of Eu3+ ions situated at the Y3+ site within the CaYAl3O7 crystal lattice. Notably, within these excitation spectra, a characteristic peak centered at the excitation wavelength of λex = 398 nm was observed, attributed to the 7F05L6 transition [16]. This observation unequivocally underscores the necessity for the excitation wavelength of the as-grown phosphors to align closely with the near-UV-light LED chips. Moreover, the intensity of this near-UV light is about five times more than that of blue excitation light 460 nm 7F05L6, obviously showing that the as-grown CYAE phosphors should be more effectively excited by near-UV light. This suggests that the crystal-field interaction of CYA would essentially tune the excited spectra of Eu3+ ions at the Y3+ site of CaYAl3O7 crystal. Furthermore, the broadband observed in the PLE spectra ranging from 220 to 300 nm stems from the CT of Eu3+-O2− in host crystal CYA [20,21,22]. Additionally, the other existing spectra centered at 365 nm (7F05D4), 380 nm (7F05G3), 385 nm (7F05G3), 403 nm (7F05L6), 419 nm (7F05D3), and 468 nm (7F05D2) were identified by the CDM method. Please see the detailed theoretical analysis in the next sections.
As depicted in Figure 4b, upon excitation at 398 nm, the as-grown phosphors exhibit numerous sharp emission peaks originating from Eu3+ ions within the host crystals CYA. These emission peaks are centered at wavelengths of 535, 541, 557, 581, 592, 599, 612, 622, 657, 695, and 703 nm. Among them, the main peaks centered at the red right of 622 nm should be ascribed to 5D07F2 transitions of Eu3+ [18]. Therefore, the crystal field of the host CYA crystal has successfully red-shifted toward the desirable red light of 622 nm from the common 613–616 nm of other Eu3+-doping host crystals. In addition, the other emission spectra have been identified by CDM (please see Section 3.3). Furthermore, the optimal Eu3+-doped concentration of as-grown phosphors CaY1−xAl3O7: Eux should be proved to be x = 0.16, as shown in Figure 4c,d. Additionally, Na2CO3 was applied as a latent solvent to enhance the photoluminescence properties of as-grown phosphors, as shown in Figure 4e,f. The higher doping concentration (x = 0.24) is favorable for exploring the effect of higher concentrations of Na2CO3 on the photoluminescence properties. The results show that the optimal doping concentration of Na2CO3 is 3 wt%. Also, it should be noted that for consistency, the same excitation wavelength (398 nm) and emission wavelength (622 nm) were used. In addition, as illustrated in Figure 5, the CIE chromaticity coordinates progressively shift toward the desired red hue with an increase in the Eu-doped concentration. This observation indicates that the Eu-doped concentration can effectively adjust the CIE chromaticity coordinates of the as-grown phosphors. The observed shifts are both instrumentally measurable and perceptible to the human eye, which highlights the potential for these phosphors to meet specific color requirements in white LED applications. Comparing these results with existing phosphor standards, the ability to adjust the emission color through Eu3+ concentration tuning is of practical significance, as it can enhance the performance of these phosphors in lighting applications by improving color rendering and achieving desired color outputs.

3.3. Crystal Field Analysis

A commonly employed approach for computing the optical spectroscopy of rare earth ions in crystals relies on parametric modeling calculations [23], which are considered more practical and less labor-intensive compared to prevalent first-principles methods [24,25,26]. In this study, the effective Hamiltonian for the CaYAl3O7: Eu3+ phosphor system can be succinctly expressed as Equation (1):
H = H F I + H C F
where the free-ion Hamiltonian HFI can be explicitly expressed as Equation (2):
H F I = E a v e + k = 2 , 4 , 6 F k f ^ k + ζ 4 f A ^ S O + α L ^ 2 + β G ^ ( G 2 ) + γ G ^ ( R 7 ) + i = 2 , 3 , 4 , 6 , 7 , 8 T i t ^ i + j = 0 , 2 , 4 M j m ^ j + k = 2 , 4 , 6 P k p ^ k
The significance of each interaction operator and its coefficient in Equation (2) has been extensively elaborated upon in various reviews and monographs [27,28,29]. The specific configuration of the crystal-field Hamiltonian HCF in Equation (1) heavily relies on the local site symmetry surrounding the central ion. In the CaYAl3O7 crystal, the Y3+ host ion is potentially substituted by the Eu3+-dopant ion, surrounded by the eight nearest oxygen ions.
The site symmetry for this [YO8] cluster is categorized under the Cs point group. However, the inclusion of both free-ion parameters and independent phenomenological ones for HCF with Cs symmetry would lead to a significantly larger number than that of the experimental optical spectra in this study, potentially leading to an ‘over-fit’ problem [30] in subsequent calculations.
Therefore, we approximate the Cs symmetry with D4h symmetry. This adjustment is supported by the rationale illustrated in Figure 1. Such an approach, known as the ascent/descent in symmetry (ADS) method, has been commonly employed in crystal-field modeling for rare earth ion-doped crystals [31,32,33].
Thus, under tetragonal D4h symmetry, the crystal-field interaction HCF in Equation (1) HCF can be written, in the Wybourne notation, as Equation (3) [27,29]:
H C F = B 20 C 20 + B 40 C 40 + B 44 ( C 44 + C 4 , 4 ) + B 60 C 60 + B 64 ( C 64 + C 6 , 4 )
where Bkq are crystal-field parameters (CFPs) and Ckq are the Racah spherical tensor operators. Typically, the experimental optical band positions for the CaYAl3O7: Eu3+ phosphor are determined by diagonalizing the complete 3003 × 3003 energy matrix of the Hamiltonian H in Equation (1). This diagonalization is performed based on the basic set of commonly used multiplets 2S+1LJ. Furthermore, each parameter, which characterizes the strength of the interaction in Equations (2) and (3), is determined through fitting procedures aimed at minimizing the root mean square (rms) deviation σ between experimental and calculated optical spectra [23]. In our experiments, only eighteen intraconfigurational f−f transitions are observed. Consequently, we consider dominant free-ion parameters Eave, Coulomb repulsions (F2, F4, F6), spin–orbit parameter ζ4f, and five CFPs Bkq as adjustable variables, while other secondary parameters are fixed at their mean values as provided in [27]. Therefore, the fitting calculations aim to find the global minimum in the ten-dimensional parameter space.
It is important to note that the initial values of the CFPs significantly influence the final fitting results [21], and these values can be reasonably estimated using the superposition model (SPM). The SPM relies on the approximate spherical polar coordinates of eight oxygen ligands provided in Table 1, along with the intrinsic CFPs of Eu3+ ions with eight-fold coordination [2].
All the best-fitted parameters, with a σ value of 26.7 cm−1, are listed in Table 2. Additionally, the calculated optical spectra are listed and compared with the experimental spectra in Table 3. It is worth mentioning that only the multiplets to which the experimental optical spectra are assigned are included in the list.
Table 3 and Figure 6 illustrate that the calculated optical spectra of CaYAl3O7: Eu3+ phosphors exhibit reasonable agreement with the experimental spectra, which suggests that the crystal-field modeling effectively explains the excitation and emission spectra of the phosphors under study. However, there are large standard deviations observed in the free-ion parameters listed in Table 2 and discrepancies between the calculated and experimental values presented in Table 3. Two potential reasons for these disparities are identified: (i) First is the limited number of observed optical band positions available for fitting calculations, as all optical spectroscopy experiments were conducted at room temperature. Obtaining additional optical spectra at cryogenic temperatures could enhance the accuracy of the fitting results. (ii) The substitution of the crystal field with D4h symmetry for the actual Cs symmetry introduces additional error.

4. Conclusions

In summary, reddish CYAE phosphors suitable for white LEDs were synthesized using a straightforward solid-state reaction approach. When excited by near-ultraviolet light (398 nm), these phosphors exhibit highly efficient emission, producing an intense reddish light centered at 622 nm. The complete 3003 × 3003 energy matrix of Eu3+ ions located at the approximately tetragonal (D4h) Y3+ site within the melilite structure of CaYAl3O7 crystal was successfully utilized to quantitatively identify the corresponding spectra through a diagonalization method, marking a pioneering achievement. This novel approach provides insights into the luminescent mechanisms of Eu3+-doped phosphors for w-LEDs. It holds promise for similar applications with phosphors doped with other rare earth elements, thereby facilitating the advancement and utilization of innovative fluorescent materials.

Author Contributions

Z.L.: conceptualization, methodology, validation, writing—original draft, and funding acquisition. D.Y.: conceptualization, formal analysis, software, methodology. T.X.: methodology, resources, formal analysis. Y.A.: visualization, investigation. W.Y.: funding acquisition, validation, formal analysis, supervision, project administration. All authors have read and agreed to the published version of the manuscript.

Funding

This work is supported by the Sichuan Province Foundation for Distinguished Young Team (No. 20CXTD0106).

Institutional Review Board Statement

Not applicable.

Informed Consent Statement

This study was approved by the School of Materials Science and Engineering, Southwest Jiaotong University. Relevant ethical safeguards have been met regarding subject protection, and no experiments involved human or animal experiments.

Data Availability Statement

Data will be made available on reasonable request.

Acknowledgments

The authors would like to thank the Analysis and Testing Center of Southwest Jiaotong University for supporting the XRD, SEM, Raman, and FTIR measurements. The authors are also grateful to Yau Yuen Yeung of the Hong Kong Institute of Education for providing us with the “f-shell Crystal Field Analysis Package”.

Conflicts of Interest

Author Da Yi was employed by the company China Railway Engineering Group Limited. The remaining authors declare that the research was conducted in the absence of any commercial or financial relationships that could be construed as a potential conflict of interest.

References

  1. Pan, C.; Dong, L.; Zhu, G.; Niu, S.; Yu, R.; Yang, Q.; Liu, Y.; Wang, Z.L. High-resolution electroluminescent imaging of pressure distribution using a piezoelectric nanowire LED array. Nat. Photon. 2013, 7, 752–758. [Google Scholar] [CrossRef]
  2. Bao, R.; Wang, C.; Dong, L.; Yu, R.; Zhao, K.; Wang, Z.L.; Pan, C. Flexible and controllable piezo-phototronic pressure mapping sensor matrix by ZnO NW/p-polymer LED array. Adv. Funct. Mater. 2015, 25, 2884–2891. [Google Scholar] [CrossRef]
  3. Yang, W.; Liu, Z.; Chen, J.; Huang, L.; Zhang, L.; Pan, H.; Wu, B.; Lin, Y. A high-performance white-light-emitting-diodes based on nano-single crystal divanadates quantum dots. Sci. Rep. 2015, 5, 10460. [Google Scholar] [CrossRef] [PubMed]
  4. Rajendran, M.; Vaidyanathan, S. High performance red/deep-red emitting phosphors for white LEDs. New J. Chem. 2020, 44, 5354–5365. [Google Scholar] [CrossRef]
  5. Yang, W.Q.; Liu, H.G.; Gao, M.; Bai, Y.; Zhao, J.T.; Xu, X.D.; Wu, B.; Zheng, W.C.; Liu, G.K.; Lin, Y. Dual-luminescence-center single-component white-light Sr2V2O7: Eu3+ phosphors for white LEDs. Acta Mater. 2013, 61, 5096–5104. [Google Scholar] [CrossRef]
  6. Pust, P.; Weiler, V.; Hecht, C.; Tücks, A.; Wochnik, A.S.; Henß, A.K.; Wiechert, D.; Scheu, C.; Schmidt, P.J.; Schnick, W. Narrow-band red-emitting Sr [LiAl3N4]: Eu2+ as a next-generation LED-phosphor material. Nat. Mater. 2014, 13, 891. [Google Scholar]
  7. Li, H.; Jiao, J.; Luo, D.; Xiong, D.; Gao, L. Controllable synthesis of Cu-based quantum dots/nanocrystals and application in white light-emitting diodes. Dalton Trans. 2022, 51, 17883–17894. [Google Scholar]
  8. Zhang, L.; Pan, H.; Liu, H.; Zhang, B.; Jin, L.; Zhu, M.; Yang, W. Theoretical spectra identification and fluorescent properties of reddish orange Sm-doped BaTiO3 phosphors. J. Alloys Compd. 2015, 643, 247–252. [Google Scholar]
  9. Pan, H.; Zhang, L.; Jin, L.; Zhang, B.; Yang, W.J. High-performance simultaneous two-photon absorption upconverted stimulated single-component Sr2V2O7 phosphor for white LEDs. Electron. Mater. 2015, 44, 3465–3470. [Google Scholar] [CrossRef]
  10. Nakamura, S.; Mukai, T.; Senoh, M. Candela-class high-brightness InGaN/AlGaN double-heterostructure blue-light-emitting diodes. Appl. Phys. Lett. 1994, 64, 1687. [Google Scholar] [CrossRef]
  11. Huang, X.; Guo, H.; Liang, J.; Wang, S. Synthesis and photoluminescence properties of novel red-emitting KBaLu(MoO4)3: Eu3+ phosphors with high thermal stability and high color purity. Inorg. Chem. Commun. 2020, 116, 107938. [Google Scholar] [CrossRef]
  12. Mehare, M.; Mehare, C.; Swart, H.; Dhoble, S. Recent development in color tunable phosphors: A review. Prog. Mater. Sci. 2023, 133, 101067. [Google Scholar]
  13. Jiang, L.; Jiang, X.; Zhang, Y.; Wang, C.; Liu, P.; Lv, G.; Su, Y. Multiobjective machine learning-assisted discovery of a novel cyan–green garnet: Ce phosphors with excellent thermal stability. ACS Appl. Mater. Interfaces 2022, 14, 15426–15436. [Google Scholar]
  14. Wang, Q.; Zhu, G.; Li, Y.; Wang, Y. Photoluminescent properties of Pr3+ activated Y2WO6 for light emitting diodes. Opt. Mater. 2015, 42, 385–389. [Google Scholar]
  15. He, X.; Liu, X.; Li, R.; Yang, B.; Yu, K.; Zeng, M.; Yu, R. Effects of local structure of Ce3+ ions on luminescent properties of Y3Al5O12: Ce nanoparticles. Sci. Rep. 2016, 6, 22238. [Google Scholar]
  16. Zhang, Z.; Ma, S.; Yu, H.J. Luminescence studies of Ba1−xMg2−y(PO4)2: xEu2+, yMn2+ phosphor. J. Alloys Compd. 2011, 509, 76. [Google Scholar]
  17. Yu, H.; Chung, W.; Park, S.; Kim, J.; Kim, S. Luminous properties of SrGa2S3Se phosphors doped with Eu2+ for LEDs application. Mater. Lett. 2011, 65, 474–476. [Google Scholar]
  18. Kadyan, S.; Singh, K.; Singh, S.; Sheoran, S.; Singh, J.; Singh, D. Photoluminescence and structural analysis of trivalent europium doped MLaAl3O7 (M = Ba, Ca, Mg and Sr) nanophosphors. Luminescence 2020, 35, 673–683. [Google Scholar]
  19. Zhang, W.; Shen, H.; Hu, X.L.; Wang, Y.; Li, J.F.; Zhu, Z.J.; You, Z.Y.; Tu, C.Y. Solid-state synthesis, structure and spectroscopic analysis of Dy: CaYAl3O7 phosphors. J. Alloys Compd. 2019, 781, 255–260. [Google Scholar]
  20. Wang, D.; Chen, L.; Jiang, L.; Yu, Y.; Lu, Y.; Li, H.; Li, Y.; Meng, Z.; Su, Q.; Zhang, Y.; et al. A high temperature macroscopically flexible inorganic CaYAl3O7: Eu3+ nanofiber luminescent membrane. J. Mater. Chem. C 2022, 10, 7594. [Google Scholar]
  21. Yim, C.; Unithrattil, S.; Chung, W.; Im, W. Comparative study of optical and structural properties of electrospun 1-dimensional CaYAl3O7: Eu3+ nanofibers and bulk phosphor. Mater. Character. 2014, 95, 27–35. [Google Scholar]
  22. Yang, X.; Zhao, L.; Zeng, W.; Liu, Z.; Fan, X.; Tian, S.; Zhang, H.; Xu, X.; Qiu, J.; Yu, X. Multiple-response anti-counterfeiting realized in CaYAl3O7 host with the dual coexistence of Eu2+/Eu3+. J. Am. Ceram. Soc. 2020, 103, 2235. [Google Scholar]
  23. Liu, G.; Jacquier, B. (Eds.) Spectroscopic Properties of Rare Earths in Optical Materials; Science & Business Media Springer: Berlin/Heidelberg, Germany, 2006. [Google Scholar]
  24. Qu, B.; Zhang, B.; Wang, L.; Zhou, R.; Zeng, X. Mechanistic study of the persistent luminescence of CaAl2O4: Eu, Nd. Chem. Mater. 2015, 27, 2195–2202. [Google Scholar]
  25. Gschneidner, K.; Bunzli, J.; Pecharsky, V. (Eds.) Handbook on the Physics and Chemistry of Rare Earths; Elsevier: Amsterdam, The Netherlands, 2005. [Google Scholar]
  26. Tanner, P.; Li, W.; Ning, L. Electronic spectra and crystal-field analysis of europium in hexanitritolanthanate systems. Inorg. Chem. 2012, 51, 2997–3006. [Google Scholar]
  27. Görller-Walrand, C.; Binnemans, K. (Eds.) Handbook on the Physics and Chemistry of Rare Earths; Elsevier: Amsterdam, The Netherlands, 1996. [Google Scholar]
  28. Hufner, S. (Ed.) Optical Spectra of Transparent Rare Earth Compounds; Elsevier: Amsterdam, The Netherlands, 2012. [Google Scholar]
  29. Wybourne, B.; Meggers, F. Spectroscopic properties of rare earths. Physics 1965, 18, 70–72. [Google Scholar] [CrossRef]
  30. Xie, L.; Yeung, Y. Study of the Defect Structure and Crystal-Field Parameters of α-Al2O3: Yb3+. Appl. Magn. Reson. 2013, 44, 917–925. [Google Scholar]
  31. Ghosh, R.; Sarkar, S.; Jana, Y.; Piwowarska, D.; Gnutek, P.; Rudowicz, C. Eu3+ ions as a crystal-field probe for low-symmetry sites in doped phosphors–a case study: Eu3+ at triclinic sites in Li6RE(BO3)3 (RE = Y, Gd), YBO3 and ZnO and at trigonal sites in YAl3(BO3)4. Phys. Chem. Chem. Phys. 2023, 25, 25537–25551. [Google Scholar]
  32. Liu, H.; Mei, Y.; Zheng, W. Reinvestigations of the optical spectra and EPR parameters for Yb3+ ions in AWO4 (A = Ca, Sr, Pb, Ba) scheelite crystals. Phys. Scr. 2012, 85, 035708. [Google Scholar]
  33. Liu, G.; Carnall, W.; Jones, R.; Cone, R.; Huang, J.J. Electronic energy level structure of Tb3+ in LiYF4. J. Alloys Compd. 1994, 207, 69–73. [Google Scholar]
Figure 1. Crystal structure of host crystal CaYAl3O7: (a) ABC3O7 crystal structure in general form. (b) The Ca/Y in the polyhedron with a coordination number of eight.
Materials 18 01578 g001
Figure 2. XRD patterns of CaY1−xAl3O7: Eux phosphors with different Eu concentrations.
Materials 18 01578 g002
Figure 3. Surface micrograph of CaY0.76Al3O7: Eu0.24 phosphors: (a) SEM, (b) enlarged SEM, and (c,d) EDS maps (The non-English words in Figure 3c represent: the total spectrum of maps; The non-English words in Figure 3d represent: the electron image).
Materials 18 01578 g003
Figure 4. Excitation (a) and emission (b) spectra of CaY1−xAl3O7: Eux (x = 0.04, 0.08, 0.12, 0.16, 0.20, 0.24) phosphors with emission wavelength 622 nm and excitation wavelength 398 nm; excitation (c) and emission (d) intensities of CaY1−xAl3O7: Eux with the various Eu3+ doping concentrations, excitation spectra of CaY1−xAl3O7: Eux phosphors measured at an excitation wavelength of 398 nm, emission spectra of CaY1−xAl3O7: Eux phosphors measured at an emission wavelength of 622 nm; excitation (e) and emission (f) intensities of CaY0.76Al3O7: Eu0.24 with the various Na2CO3 doping concentrations.
Materials 18 01578 g004
Figure 5. CIE chromaticity map of CaY1−xAl3O7: Eux phosphors (x = 0.04 (A), 0.08 (B), 0.12 (C), 0.16 (D), 0.20 (E), and 0.24 (F)) with near-UV light 398 nm.
Materials 18 01578 g005
Figure 6. Luminescence mechanism of Eu3+ ion-doped CaYAl3O7 phosphors for white LEDs.
Materials 18 01578 g006
Table 1. The spherical polar coordinates (R, θ, ϕ) of eight oxygen ligands for [YO8] cluster expressed in the coordinate system shown in Figure 1 for both the actual Cs and approximate D4h symmetry.
Ligand[YO8]-CS[YO8]-D4H
R (nm)θ (°) ∅ (°) R (nm)θ (°) ∅ (°)
O12.52467.57−4.122.46060.440
O22.39753.3290.852.46060.4490
O32.39753.32179.152.46060.44180
O42.52167.54−85.952.46060.44−90
O52.789123.2834.552.588123.7945
O62.394116.34135.062.588123.79135
O72.789123.28−124.552.588123.79−135
O82.38132.26−452.588123.79−45
Table 2. The best-fitted free-ion parameters and CFPs (in cm−1) for Eu3+ ion in CaYAl3O7 phosphors for white LEDs.
EaveF2F4F6ζ4fB20B40B44B60B64
63,30280,35168,11337,3631260−6692668128322652422
Table 3. The calculated and experimental energy levels (in cm−1) of Eu3+ ion in CaYAl3O7 phosphor.
MultipletCal c.Expt. E MultipletCal c.Expt. E
7F0570−575D323,89423,878−16
7F12943039 23,897
46250644 23,934
7F2824 23,968
947 23,985
10601050−105L624,441
111911234 24,515
7F31616 24,521
1781 24,539
1868 24,639
1880 24,76524,78924
1969199021 25,009
7F42375 25,11525,113−2
2415 25,206
28552809−46 25,316
2871 5G325,599
2943298138 25,695
3204 25,760
3263 25,835
5D017,20817,206−2 25,96125,9610
5D118,96318,99431 26,30226,274−28
18,98519,00419 26,800
5D221,321 27,002
21,333 27,193
21,38621,358−28 27,235
21,388 27,300
27,42127,421−9
Disclaimer/Publisher’s Note: The statements, opinions and data contained in all publications are solely those of the individual author(s) and contributor(s) and not of MDPI and/or the editor(s). MDPI and/or the editor(s) disclaim responsibility for any injury to people or property resulting from any ideas, methods, instructions or products referred to in the content.

