Article

Precursor-Derived Mo2C/SiC Composites with a Two-Dimensional Sheet Structure for Electromagnetic Wave Absorption

1
School of Materials Science and Engineering, Shandong University of Technology, Zibo 255000, China
2
School of Transportation and Verhicle Engineering, Shandong University of Technology, Zibo 255000, China
3
Weifang Kaihua Silicon Carbide Micropowder Co., Ltd., Weifang 261207, China
4
Yantai Glass Coating Micro-Nano Imprinting Technology Innovation Center, Conor Glass Science & Technology Co., Ltd., Yantai 265700, China
*
Authors to whom correspondence should be addressed.
Materials 2025, 18(7), 1573; https://doi.org/10.3390/ma18071573
Submission received: 20 February 2025 / Revised: 26 March 2025 / Accepted: 28 March 2025 / Published: 31 March 2025
(This article belongs to the Section Advanced and Functional Ceramics and Glasses)

Abstract

:
Precursor-derived silicon carbide (SiC) ceramics have been widely used as absorbing materials, but the residual carbon sink produced by ceramicization limits their application under high-temperature and oxygen-containing conditions, such as the nozzle or jet vane of high-speed aircraft. In this paper, a novel molybdenum carbide/silicon carbide (Mo2C/SiC) microwave-absorbing ceramic with a two-dimensional sheet structure was obtained through the pyrolysis of polycarbosilane-coated molybdenum sulfide (PCS@MoS2). The results indicate that addition of an appropriate amount of MoS2 can react with the free carbon generated during the pyrolysis of PCS, thereby reducing the material’s carbon content and forming Mo2C. Concurrently, the layered structural characteristics of MoS2 are utilized to create a two-dimensional composite structure within the material, which enhances the material’s absorption vastly. The as-prepared Mo2C/SiC ceramics sintered at 1300 °C exhibit a minimum reflection loss (RLmin) of −46.49 dB at 8.96 GHz with a thickness of 2.6 mm. Additionally, the effective absorption bandwidth (EAB) of Mo2C/SiC spans the entire X-band (8–12 GHz) due to the combined effect of multiple loss mechanisms.

1. Introduction

In recent years, as the requirements for wave-absorbing materials have become increasingly stringent, the preparation of ceramic-based wave-absorbing materials via precursor-derived ceramic (PDC) has gained much more attention [1,2,3,4,5]. The PDC method can be utilized to achieve the adjustability of the composition, structure, and properties of the product by designing the precursor, thereby meeting the requirements for different material properties. Various wave-absorbing ceramics have been prepared by the PDC route, such as SiCO [6,7], SiC [8,9], SiCN [10,11,12], and SiBCN [13,14,15].
However, the main chain or branch chain of the ceramic precursor molecule contains many carbon atoms, resulting in the conversion of the precursor to the ceramic being mostly carbon rich. The presence of carbon can also effectively improve the wave-absorbing properties of the material [16,17,18,19]. For example, Mo et al. prepared carbon rich porous SiCO ceramics by combining the hydrothermal method and the PDC method [20]. The findings revealed that the SiCO produced through annealing at 1400 °C possesses multiple crystalline phases and a substantial quantity of free carbon. Moreover, it develops an interconnected conductive network and a wealth of heterogeneous phase interfaces, thereby significantly boosting the material’s wave-absorbing capabilities. Nevertheless, such carbon-rich materials cannot operate efficiently for prolonged durations in oxygen-rich settings owing to the instability of carbon under high-temperature conditions [21].
Therefore, to prepare a high temperature absorbing material, it is necessary to convert the carbon in the precursor into a high temperature stable phase. Feng [22] used ferric acetylacetonate (FA) to modify the precursor, and PDCs-SiCN (Fe) ceramics containing the Fe3C phase were prepared by sintering at 1100 °C. PDCs-SiCN (Fe) ceramics with 50 wt% of FA addition have a wide effective absorption bandwidth (EAB) in 5.1–8.4 GHz. Wei [23] achieved SiCTi wave-absorbing ceramics with TiC, exhibiting outstanding performance, through the addition of tetrabutyl titanate as a modifier to the precursor. The results showed that the 3% tetrabutyl-titanate-modified PCS sintered SiC effectively, reducing the C content of the material. The minimum reflection loss (RLmin) of SiCTi is −16 dB at 8.9 GHz, and the EAB is 4.2 GHz (in the whole X-band) when the thickness is varied from 1.7 to 2.4 mm. In particular, incorporating the molybdenum (Mo) element into the precursor allows for the modification of the material. This confirms that Mo can interact with silicon (Si) and carbon (C) to form diverse phases, such as molybdenum carbide, molybdenum silicide, and silicon–carbon–molybdenum alloys. These phases expand the options for choosing wave-absorbing components. [24,25].
How to introduce molybdenum in the precursor with a molybdenum source using molybdenum powder or molybdenum oxide or molybdenum sulfide is a key problem. In our early research, a SiCO@BN 2D wave-absorbing material with better impedance matching and resonant cavity structure was prepared [26]. Similarly, the two-dimensional PCS@graphene [27], PCS@BN [28] were prepared for wave absorption. The newly generated wave-absorbing materials have a unique two-dimensional structure already rich in phase interfaces, which greatly improves the wave-absorbing properties of the materials.
Hence, in this paper, molybdenum disulfide (MoS2) is combined with the precursor to prepare a wave-absorbing material with a two-dimensional structure. In the high-temperature sintering process, MoS2 reacts with the PCS to generate molybdenum carbide (mainly Mo2C). Because of two-dimensional MoS2, these Mo2C/SiC materials contain a greater quantity of phase interfaces, which enhances the interfacial polarization and then improves the wave-absorbing property.

2. Experimental

2.1. Materials

Polycarbosilane (PCS) was provided by the Institute of Chemistry, Chinese Academy of Sciences (Beijing, China). Molybdenum disulfide (MoS2, 99.5%) and tetrahydrofuran (C4H8O, 99.5%) were purchased from the McLean Reagent platform.

2.2. Preparation of Mo2C/SiC Ceramics

This experiment adopts the PDC method to prepare Mo2C/SiC ceramic material. The specific process is shown in Figure 1. Firstly, the required solid PCS and MoS2 were added into tetrahydrofuran. After ultrasonic dispersion and uniform stirring for 0.5 h, the PCS was completely dissolved. In this process, the MoS2 nanosheets are uniformly dispersed in the solution, and the nanosheets gradually become thinner. Due to the encapsulation of PCS, the nanosheets will no longer agglomerate due to van der Waals’ force. The tetrahydrofuran was removed by vacuum distillation to obtain fluffy PCS@MoS2 powder. The four PCS@MoS2 were prepared with the mass ratio of PCS:MoS2 at 1:1, 2:1, 3:1, and 4:1, respectively. Finally, the prepared PCS@MoS2 were pyrolyzed at 1300 °C for 3 h under nitrogen (N2), and the samples of different ratios were named P1, P2, P3, and P4, respectively.

2.3. Characterization

X-ray diffraction spectroscopy (XRD, Rigaku XRD 2500, Tokyo, Japan) is mainly used to study the composition of materials, with Cu Kα radiation (30.0 kV, 20.0 mA) in the 2θ range from 10–90°. Infrared spectroscopy (FI-IR, Thermo Nicolet AVATAR 370, Richmond Scientific, Chorley, UK) was used to analyze the precursor properties before sintering, within the spectral range spanning from 4000 to 450 cm−1. Thermogravimetric analysis (TG, NETZSCH STA 449 F3, Selb, Germany) was used to study the material quality changes during the sintering process(RT−1000 °C) and then analyze the reaction at each stage at a heating rate of 10 °C/min in a N2 atmosphere. Raman spectroscopy (Alpha300R, Laser wavelength 532 nm, Oxford Instruments, Abingdon, UK) was used to analyze the degree of graphitization of materials within the spectral range spanning from 2500 to 500 cm−1. X-ray photoelectron spectroscopy (XPS, Thermo Fisher 0ESCALAB 250Xi, Waltham, MA, USA) was used to further analyze the chemical composition of the material. The surface morphology of the materials was observed by scanning electron microscopy (SEM, Zeiss Gemini 300, Jena, Germany). Transmission electron microscopy (TEM, JEM-F200, JEOL, Tokyo, Japan) was used to observe the microstructure of the materials.
The vector network analyzer (Agilent Technologies N5280A, Santa Clara, CA, USA) was used to measure the electromagnetic parameters of the absorber ring via the standard coaxial-line technique in the test range of 8 to 12 GHz (X-band). With paraffin wax serving as the foundational support at 55 wt%, an absorber ring(Φin = 3.04 mm, Φout = 7 mm) is produced with a thickness of 2 to 4 mm.

3. Result and Discussion

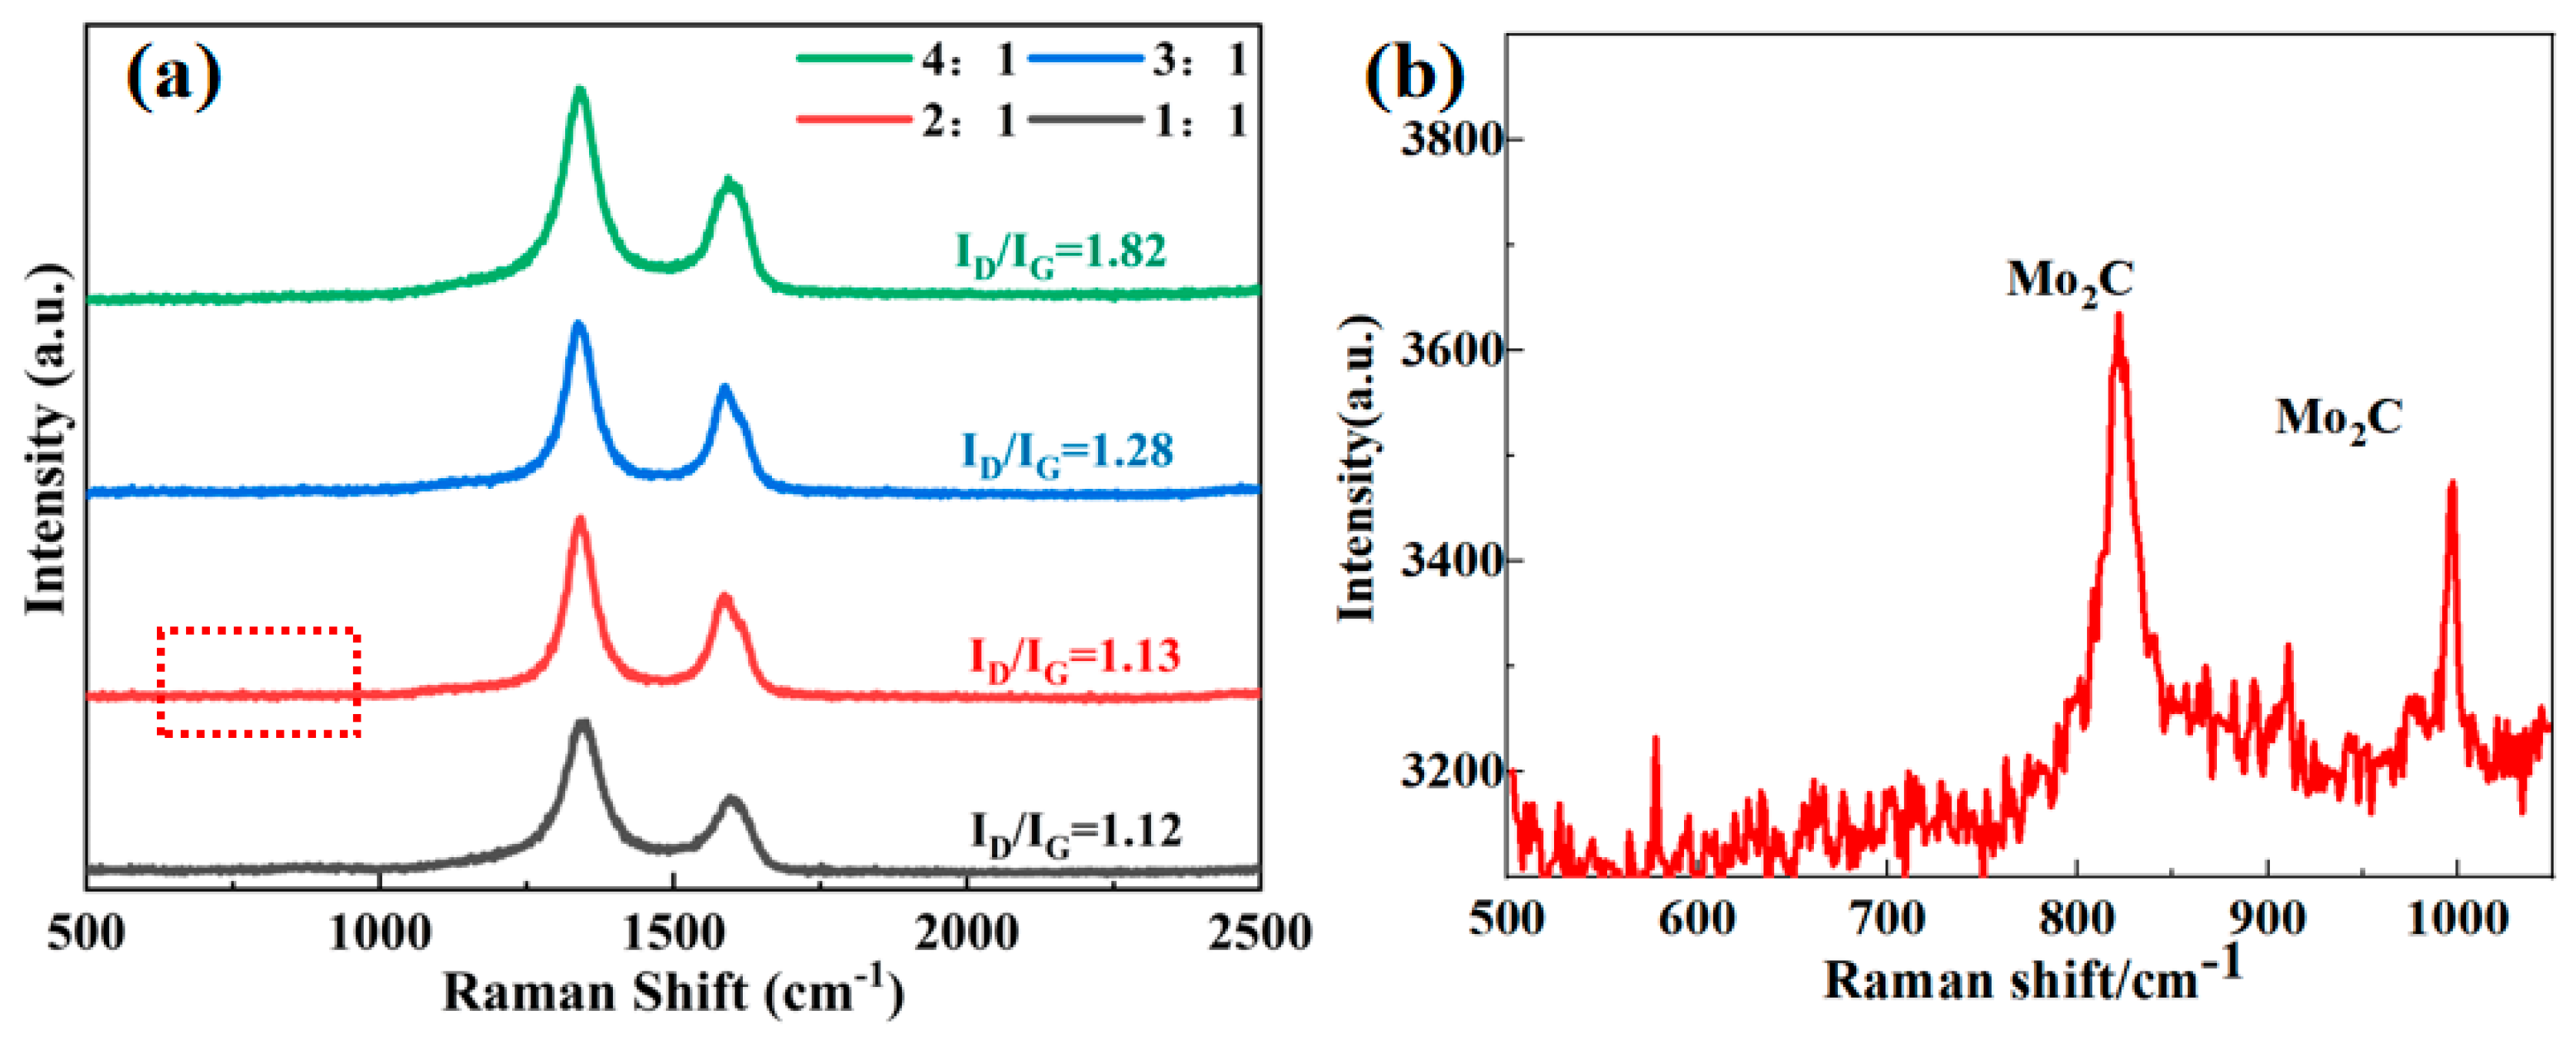
3.1. Characterizations of Mo2C/SiC

As shown in Figure 2a, the PCS@MoS2 exhibits obvious characteristic peaks at 690~860 cm−1, 1020 cm−1, 1250 cm−1, 2900, and 2950 cm−1, which are consistent with the Si-C bond, Si-C-Si bond, Si-H bond, and C-H bond of the precursor (PCS) [29,30]. This indicates that PCS does not react with MoS2 in unpyrolyzed PCS@MoS2. After pyrolysis at a high temperature, PCS will release the organic phase and gradually transform into SiC, while PCS@MoS2 shows different rules on the TG curve in Figure 2b. Compared to PCS(mass loss at 72.5%), the mass loss of the four PCS@MoS2 decreased apparently, while the ceramic yield of P1~P4 is maintained at 91.09%, 80.62%, 79.45%, and 81.56%, respectively. This shows that the doping of MoS2 will affect the ceramic transformation of PCS. The pyrolysis weight loss of PCS@MoS2 is divided into three stages [31,32]. During the 200–400 °C stage, some small molecules in PCS do not participate in cross-linking and curing and will be removed by gas. From the DTG curve(Supporting Information Figure S1), the quality loss of the attachment is the fastest at 380–390 °C DTG curves, which attributed to the low molecular weight oligomers. In the range of 400–600 °C, the PCS molecular chain breaks down to form smaller molecular chain fragments, especially in the 520–500 °C in the DTG curve. At 600–800 °C, the branched chain in PCS will break and generate methane (CH4), which is derived from the cleavage of-Si-CH3 on the branched chain of PCS. At higher temperatures, PCS is completely converted into amorphous SiC, and it will react with molybdenum sulfide to form a Mo2C/SiC alloy phase.
The XRD in Figure 3 shows the crystalline phase of the Mo2C/SiC derived from PCS@MoS2 after sintering at 1300 °C. Firstly, the sintered samples exhibit distinct diffraction peaks at angles of 35.6°, 60.2°, and 65.1°, which correspond to the (111), (110), and (012) crystal planes of β-SiC [33]. The peaks are at 39.4°, 52.1°, 61.5°, 69.6°, and 74.6°, which are associated with the (101), (102), (110), (103), and (112) crystal planes of β-Mo2C [34]. Furthermore, two diffraction peaks are observed at 41.8° and 43.6°, which correspond to the characteristic peaks of the Mo-Si-C alloy (Mo4.8Si3C0.6) [25]. With the increase in PCS ratio, the diffraction peaks corresponding to SiC and Mo2C are enhanced, while the peak intensity of Mo4.8Si3C0.6 is weakened. This indicates that the intermediate Mo-Si-C alloy phase exists during the pyrolysis process. With the increase in the ratio of carbon and silicon in the pyrolysis products, the Mo-Si-C alloy phase is induced to yield SiC and Mo2C phases.
In detail, this two-dimensional flaky PCS@MoS2 forms amorphous SiOC ceramic-coated MoS2 (SiOC@MoS2) in the low-temperature pyrolysis stage. As the temperature further increases, SiOC and MoS2 gradually react to form a Si-C-Mo alloy phase, which could continue to form SiC and Mo2C. With the increase in PCS, the MoS2 in the pyrolysis products will gradually decrease, and the SiC and Mo2C phases will gradually increase. The change in ceramic phase composition is shown in Equation (1).
P C S @ M o S 2 S i O C @ M o S 2 M o S i C a l l o y S i C + M o 2 C
The Raman spectra of PCS:MoS2 from 1:1 to 4:1 are shown in Figure 4. Typically, the vibrations associated with sp2-hybridized carbon and the presence of internal defects and disorder in the crystal structure are shown in the D-band (1350 cm−1) and G-band (1580 cm−1) of the Raman spectra [25,35]. The ID/IG values of P1, P2, P3, and P4 are 1.82, 1.28, 1.13, and 1.12, respectively, indicating that the amount of disordered carbon rises in tandem with the increase in the precursor PCS. A higher ID/IG ratio signifies a greater abundance of carbon defects within the Mo2C/SiC. This phenomenon occurs because the pyrolysis products contain an excess of carbon, and only a small amount of carbon and Mo react to form Mo2C. Moreover, when the region from 500–1000 cm−1 in the Raman spectrum is magnified, a distinct peak at 821 cm−1 and 992 cm−1 for Mo2C will become apparent in Figure 4b.

3.2. Microstructure of Mo2C/SiC

The microstructure and composition of Mo2C/SiC ceramics were investigated using transmission electron microscopy (TEM) in Figure 5. It is evident that both P1 and P3 samples retain a two-dimensional sheet structure, with the size of the P1 and P3 nanosheets ranging from 400–800 nm (Figure 5a,b,j). It is apparent that the P3 nanosheets are generally thinner, a result of the increased addition of PCS during the preparation of P3. In the formation of PCS@MoS2, PCS molecules impede the stacking of molybdenum sulfide sheets, which facilitates the dispersion of the molybdenum sulfide sheets. Elemental surface scans reveal that both nanosheets contain several elements: C, O, Si, S, and Mo (Figure 5e–i,n–r), suggesting that the prepared P1 and P3 maintain the composition of SiOC@ MoS2 elements. The surface scan image areas of SiOC cover sulfur and molybdenum elements, indicating that the molybdenum sulfide nanosheets are encapsulated by SiOC. Although the XRD analysis results suggest that SiOC and molybdenum sulfide form an alloy phase and further precipitate silicon carbide and molybdenum carbide, this reaction is incomplete. The molybdenum sulfide phase is present in both P1 and P3. The wrinkles of the MoS2 layered structure are visible in Figure 5j, and the lattice fringes of MoS2 are seen in Figure 5k, with a crystal plane spacing of 0.62 nm. However, the molybdenum sulfide in P1 is significantly larger than that in P3, indicating that molybdenum sulfide in P3 (with more PCS) is more extensively involved in the reaction, forming more silicon carbide and molybdenum carbide. Figure 5c,d display clear lattice fringes and diffraction patterns of the SiC (111) crystal plane, with a crystal plane spacing of 0.25 nm. The (101) crystal plane of Mo2C and the lattice fringes and diffraction patterns of unreacted surplus carbon are visible in Figure 5l,m, with interplanar spacings of 0.23 nm and 0.34 nm, respectively.
To further analyze the composition of Mo2C/SiC, XPS tests were performed on P1, P2, P3, and P4, and Figure 6a displays four characteristic peaks corresponding to Si2p, Si2s, C1s, and Mo3d. The Si2p spectrum in Figure 6b shows a single peak at 99.5 e V [23], indicating that only the SiC phase exists. The Si-C-Mo alloy phase in the pyrolysis product is a solid solution and does not form a chemical bond. The peaks of Mo3d spectra at 228.7 and 232 eV were typically attributed to Mo3+ in Mo2C in Figure 6c [36,37], while the peaks at 229.7 and 233.0 eV were attributed to Mo4+ and the peaks at 232.8 and 236 eV were Mo6+, which were assigned to the surface oxidation of Mo2C and unreacted MoS2. Figure 6d–g depict the C1S spectra of P1–P4, and three typical C-Si [9,23], C-Mo [36], and C-C [23] binding peaks are located near 284.5 eV, 283 eV, and 285 eV, respectively. The analysis of the P1 sample shows that there is no obvious C-C [23] binding peak, indicating that the Mo doping amount is relatively high at this ratio, and the pyrolytic carbon is fully combined with Mo to form Mo2C. With the increase in PCS ratio, the C-C peak increases relatively little from P1 to P4.

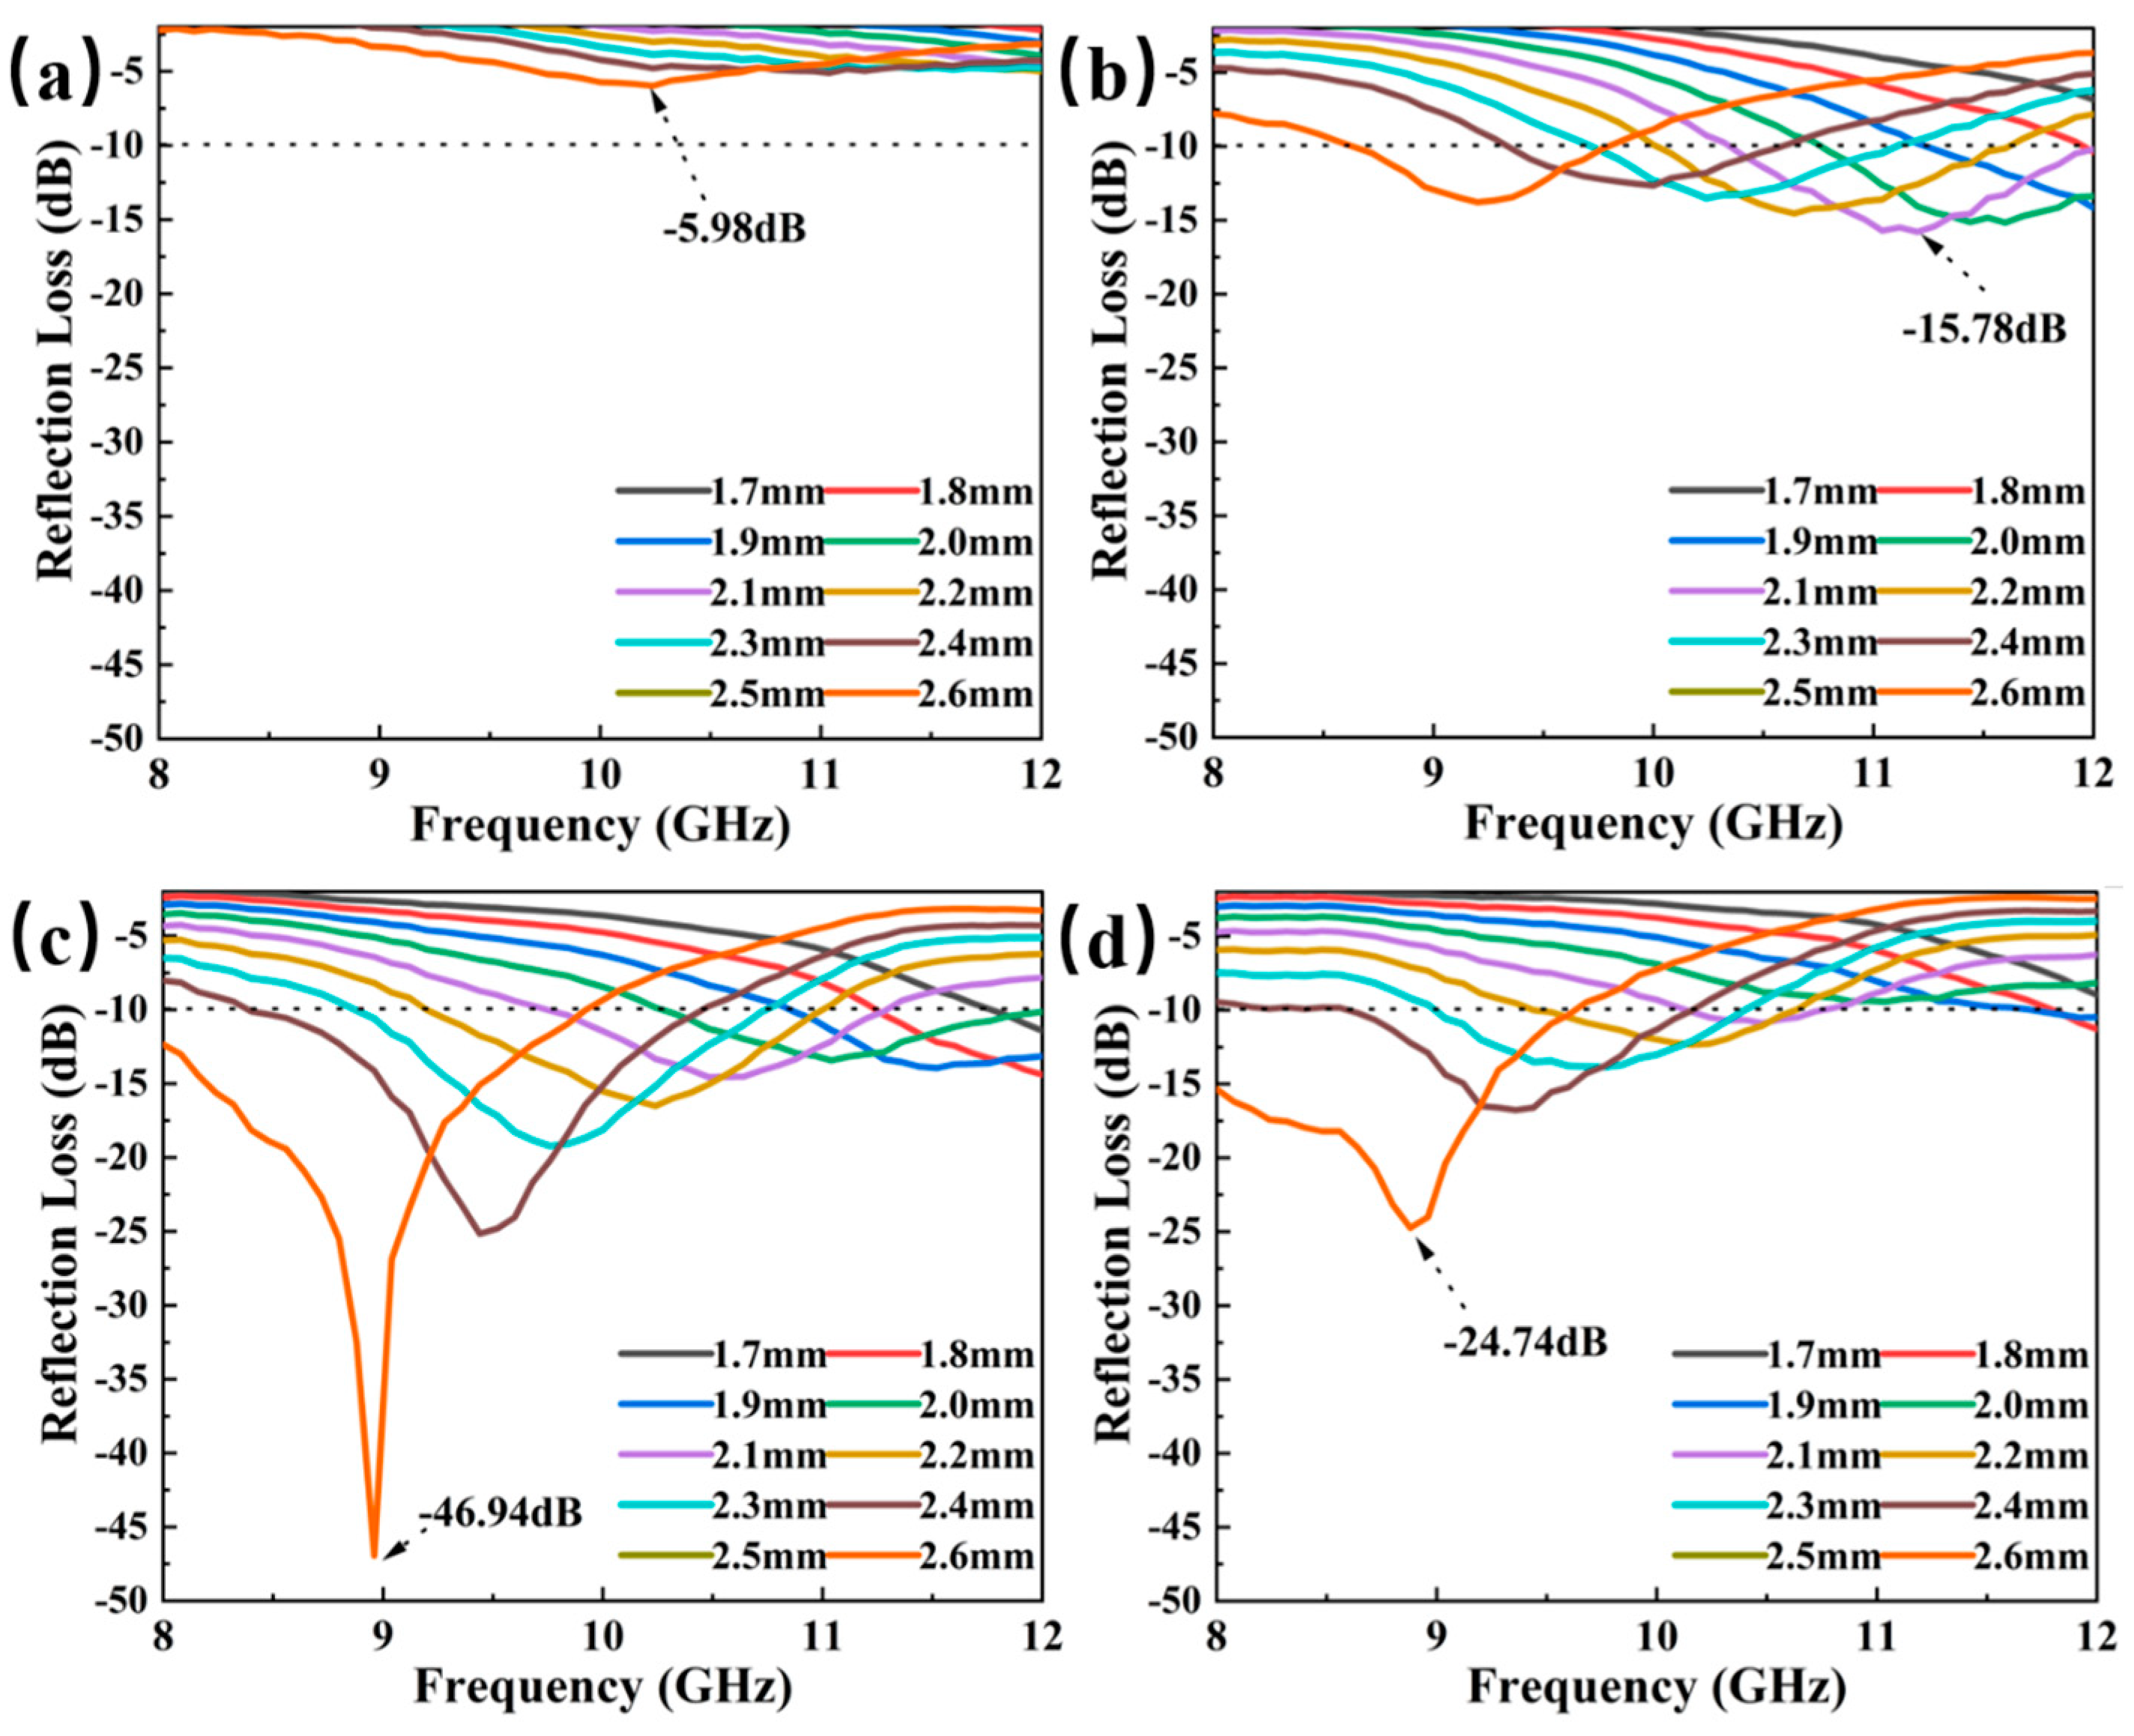
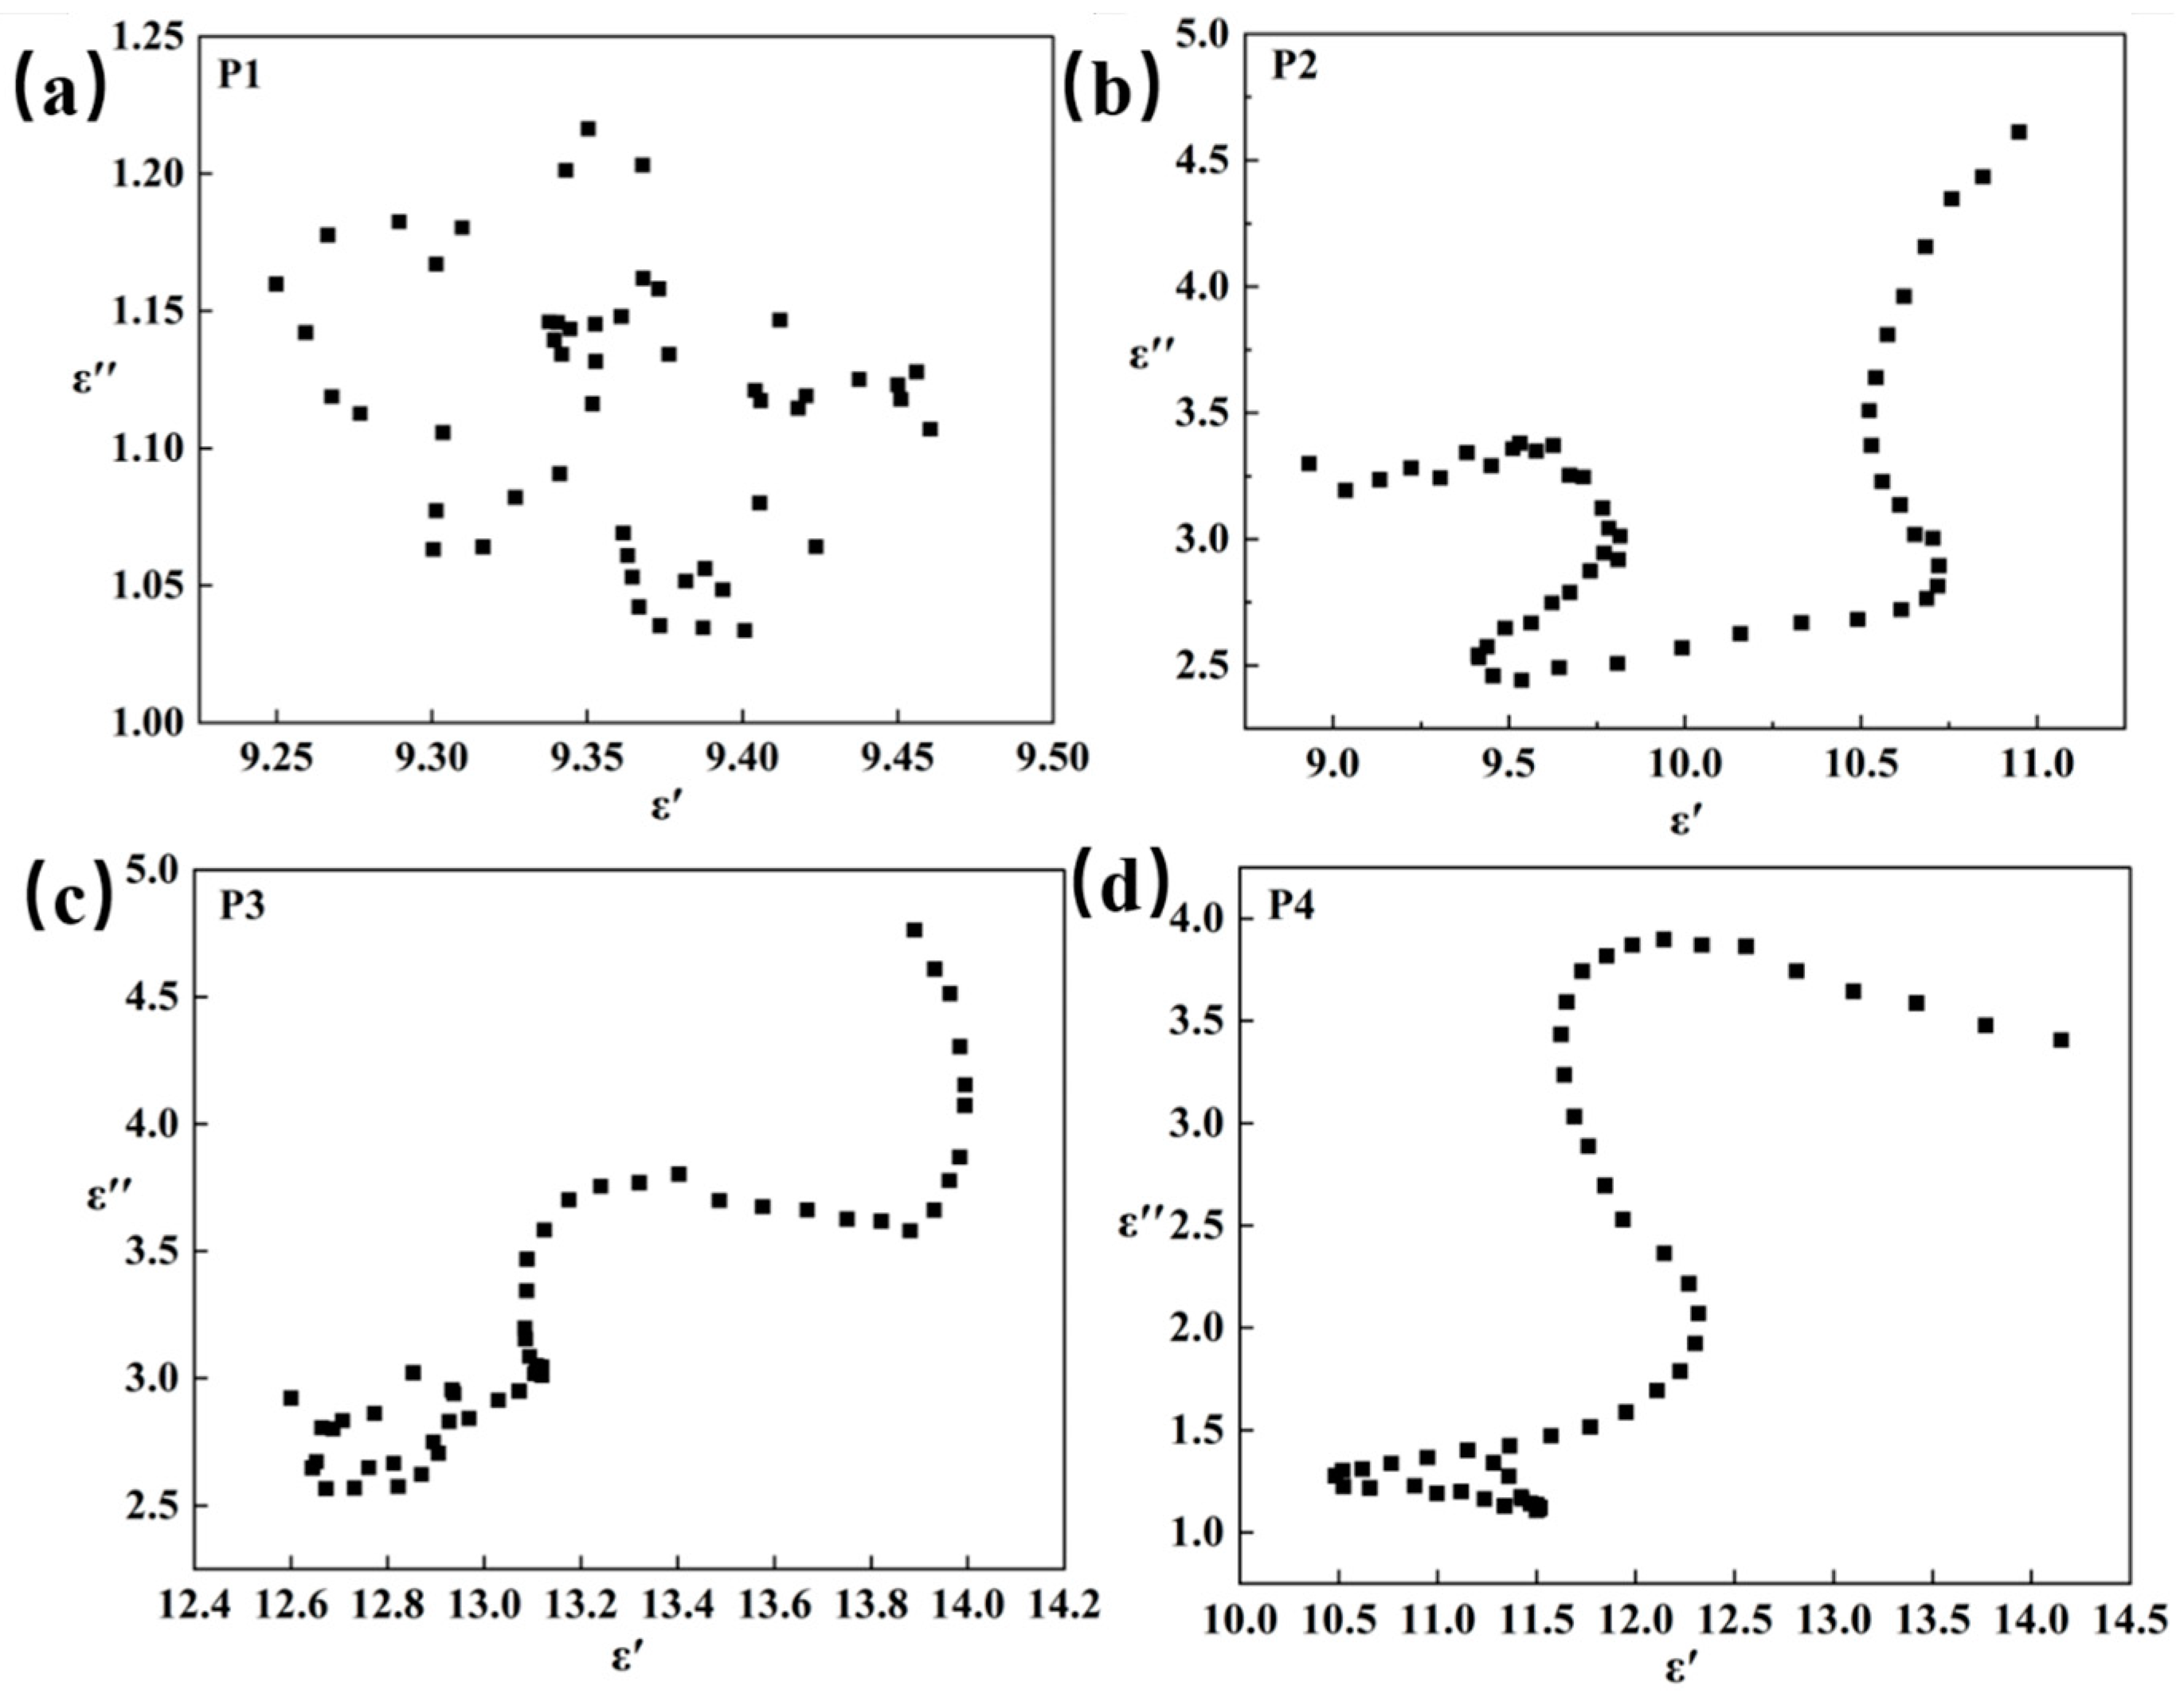
3.3. Electromagnetic Properties of the Mo2C/SiC

To investigate the electromagnetic wave absorption properties of Mo2C/SiC composites, the reflection loss (RL) was calculated based on the transmission line theory and the Equations (2) and (3) [38,39].
R L d B = 20 l g | Z 1 Z + 1 |
Z = Z i n Z 0 = μ r ε r t a n h ( j 2 π f d c μ r · ε r )
Here, Zin, Z0, μr, and εr denote the input impedance, intrinsic impedance, complex permittivity, and complex permeability of the absorber, respectively. The variable f represents the frequency of the electromagnetic wave, d signifies the thickness of the absorbing coating layer, and c is the speed of light in a vacuum.
In Figure 7, it can be seen that the electromagnetic wave absorption properties of Mo2C/SiC composites are very susceptible to the microstructure and composition changes of the materials. As shown in Figure 7a, when the thickness is 2.6 mm, the minimum RL (RLmin) of P1 is −5.96 dB, and the overall performance is weak. This is because P1 contains more MoS2, less nano-SiC and Mo2C formed in situ, and the interfacial polarization is weak. As depicted in Figure 7b,c, the imaginary component of the dielectric loss and the tangent of the dielectric loss represent the lowest values across the four sets of samples. However, with the increase in PCS content in the preparation of Mo2C/SiC, the absorbing properties are gradually enhanced. Comparatively, the composite electromagnetic wave absorption performance of P2, P3, and P4 has been significantly improved. For P2 (Figure 7b), the RLmin reaches −15.78 dB with a matching thickness of 2.1 mm, and the effective absorption bandwidth (EAB) spans 2.23 GHz (from 9.77 to 12 GHz). Notably, for P3 (Figure 7c), the RLmin is −46.94 dB at a thickness of 2.4 mm, while the EAB covers 2.51 GHz (from 8.48 to 11 GHz). Furthermore, with a thickness ranging from 1.7 to 2.6 mm, full-band absorption from 8 to 12 GHz can be achieved due to the cumulative layer thickness effect [23]. For P4 (Figure 7d), the RLmin and the EAB is −24.74 dB and 2 GHz at a thickness of 2.6 mm, respectively. Therefore, among the Mo2C/SiC composite materials, P3 exhibits the best electromagnetic wave absorption performance. To better compare the absorption properties, various Mo2C-based absorbing materials were analyzed in Table 1. It was discovered that these materials, primarily composed of Mo2C and C, are prone to oxidation at high temperatures, significantly limiting their application in aerobic high-temperature environment [25,34,40,41,42,43,44]. The Mo2C/SiC synthesized in this study not only exhibits high-temperature and oxidation resistance but also demonstrates outstanding wave absorption capabilities.
Additionally, the peak (RLmin) of the Mo2C/SiC waves shifts towards lower frequencies with increasing thickness, as explained by the quarter-wavelength attenuation theory depicted in Figure 7, which is described by Equation (4) [23]:
t m = n λ 4 = n c 4 f m μ r ε r   n = 1 , 3 , 5
where tm represents the thickness of the absorbers, λ denotes the wavelength, c is considered the speed of light in a vacuum, fm signifies the frequency at the peak, |μr| and |εr| stand for the moduli of the εr and μr at fm, respectively, and n is an odd number (1, 3, 5…).
The electromagnetic wave absorption performance of absorbers primarily depends on their electromagnetic parameters, including the complex permittivity (εr = ε′ − jε″) [45] and permeability (μr = μ′ − jμ″) [46]. To observe the variations in the electromagnetic wave absorption performance of Mo2C/SiC ceramics, the electromagnetic parameters of four samples were compared in Figure 8. Since Mo2C/SiC ceramics lack magnetic properties, their electromagnetic wave absorption performance primarily relies on their complex permittivity.
Within the 8–12 GHz frequency range, the real permittivity (ε′) of P1 exhibits minimal fluctuation, remaining essentially stable between 9.3–9.5. In contrast, the ε′ of P2, P3, and P4 experiences a slight increase, with P3 showing the most significant rise, ranging from 13.8–14. Regarding the imaginary permittivity (ε″), P1 maintains a value below 1.5 overall. However, P2 and P3 have imaginary parts exceeding 2.5 within the 8–12 GHz range, indicating an enhanced loss capacity. P4 only displays a higher imaginary part in the low-frequency region. This pattern is similarly reflected in the dielectric loss behavior. This occurrence is due to the rise in PCS, which leads to the in situ formation of various nanocrystalline phases, such as SiC and Mo2C. These abundant phase interfaces and defects significantly enhance the polarization effect, leading to a substantial improvement in the imaginary part.
Within most frequency ranges, the ε′ and ε″ values for samples P1 to P4 initially increase and then decrease. This phenomenon indicates that polarization loss significantly impacts the dissipation of electromagnetic energy. The polarization loss of Mo2C/SiC ceramics is primarily determined by Debye relaxation polarization [47], as depicted by Equations (5)–(7) [17,45].
ε r = ε j ε = ε + ε s ε 1 + j 2 π f τ
ε = ε + ε s ε 1 + ( 2 π f ) 2 τ 2
ε = 2 π f τ ( ε s ε ) 1 + ( 2 π f ) 2 τ 2
where ε represents the relative dielectric permittivity at infinite frequency, εs denotes the static dielectric permittivity, f is the frequency, and τ signifies the polarization relaxation time. Consequently, ε′ and ε″ are defined by Equations (6) and (7), respectively. According to the aforementioned formula, as the frequency increases, the dielectric constant should exhibit a gradual decrease. However, the peak at a specific frequency may be associated with the intrinsic resonance frequency. Furthermore, if Mo2C/SiC adheres to the Debye relaxation polarization equation, the real and imaginary components of the dielectric constant curve will exhibit a semicircular shape. As observed in Figure 9, Mo2C/SiC displays multiple semicircles, suggesting the presence of multiple relaxation polarization processes.
In addition, there is another parameter that can be used to judge the absorbing ability from another perspective, such as the attenuation constant (α), which can be calculated by Equation (8) [48].
α = 2 π f c μ ε μ ε + μ ε μ ε 2 + μ ε + μ ε 2 1 2
As shown in Figure 6d, sample P3 demonstrates the highest α among the four types of Mo2C/SiC ceramics with the value above 120, indicating its superior electromagnetic wave attenuation capability.
An ideal absorbing material should have good impedance matching in addition to strong loss ability, which can ensure that the electromagnetic wave is not reflected off. Impedance matching is typically indicated by the value of impedance matching (Z) [49]. The closer this value is to 1, the better the impedance matching condition of the absorber. As shown in Figure 10, in the four samples of Mo2C/SiC ceramics, the P1 and P4 values deviate from 1 by a large margin. The Z values of P2 and P3 are closer to 1, indicating that the sintered samples with this ratio have excellent impedance matching, which is due to its unique card-like stacking form composed of two-dimensional nanosheets.

3.4. Absorbing Mechanism

The absorption mechanism of Mo2C/SiC primarily involves good impedance matching, multiple scattering, dipole polarization, and interface polarization, as depicted in Figure 11. The Mo2C/SiC material features a distinctive two-dimensional sheet structure that forms a card-like stacking arrangement, with the stacking gaps contributing to the material’s excellent impedance matching. When electromagnetic waves pass through Mo2C/SiC, many more waves penetrate the material rather than being reflected. From a TEM perspective, numerous newly formed nano-SiC and Mo2C particles are observed on the two-dimensional structure of Mo2C/SiC, which enhance the multiple scattering of electromagnetic waves and aid in the gradual dissipation of these waves within the card-like structure. Notably, Mo2C/SiC produces a significant amount of nanocrystalline phases, which greatly benefit the aggregation of charge and enhance the material’s dielectric loss capabilities. Furthermore, the presence of numerous defects and dangling bonds in the disordered carbon exacerbates the uneven distribution of positive and negative charges, thereby intensifying the dipole polarization.

4. Conclusions

In this paper, a Mo2C/SiC ceramic wave-absorbing material is prepared by using PCS as a precursor and MoS2 as a modified material. After high-temperature ceramicization, PCS and MoS2 react in situ to form Mo2C/SiC alloy, and then the stable phases of Mo2C and SiC are precipitated, which solves the surplus carbon in the precursor conversion process. This new Mo2C/SiC features a graphite-like lamellar two-dimensional composite structure that enhances the material’s interfacial polarization loss capability and improves its electromagnetic wave loss capability. By adjusting the ratio of raw materials, sintering temperature, and filler ratio, the optimal conditions of Mo2C/SiC ceramics were obtained. The peak value of −46.49 dB appeared at 8.96 GHz and 2.6 mm, and the EAB could cover the whole X-band (8–12 GHz). Overall, the Mo2C/SiC wave-absorbing ceramics feature a unique lamellar two-dimensional composite structure that offers excellent electromagnetic wave absorption. In addition, the prepared ceramic absorbing materials possess excellent high-temperature and oxidation resistance, enabling their use as stealth coatings in extreme environments, such as the tail nozzles and jet vanes of high-speed aircraft.

Supplementary Materials

The following supporting information can be downloaded at: https://www.mdpi.com/article/10.3390/ma18071573/s1, Figure S1: TG and DTG curves of PCS@MoS2.

Author Contributions

Conceptualization, Y.M. and G.W.; Methodology, M.J. and G.W.; Software, J.Z.; Resources, W.Y. and M.J.; Writing—original draft, Y.L. and W.Y.; Writing—review & editing, Y.H. and M.J.; Supervision, W.Y. and G.X.; Funding acquisition, G.W and Y.H. All authors have read and agreed to the published version of the manuscript.

Funding

We are deeply thankful for the financial support from National Natural Science Foundation of China (52432002 and 52102364), the National Key Research and Development Program of China (2022YFB3706300), and the Shandong Natural Science Foundation Project (ZR2021QE200 and ZR2021QA095).

Institutional Review Board Statement

Not applicable.

Informed Consent Statement

Not applicable.

Data Availability Statement

The original contributions presented in the study are included in the article/Supplementary Material, further inquiries can be directed to the corresponding authors.

Conflicts of Interest

Authors Yongzhao Hou and Guodong Xin were employed by the company Weifang Kaihua Silicon Carbide Micropowder Co., Ltd. Authors Yongzhao Hou, Meixian Jiang and Yongqiang Ma were employed by the company Conor Glass Science & Technology Co., Ltd. The remaining authors declare that the research was conducted in the absence of any commercial or financial relationships that could be construed as a potential conflict of interest.

References

  1. Jiang, J.; Yan, L.; Song, M.; Li, Y.; Guo, A.; Du, H.; Liu, J. Thermally insulated C/SiC/SiBCN composite ceramic aerogel with enhanced electromagnetic wave absorption performance. Ceram. Int. 2025, 51, 17–24. [Google Scholar] [CrossRef]
  2. Yan, Q.; Chen, S.; Shi, H.; Gao, B.; Li, J.; Meng, S. Novel anti-oxidation coating prepared by polymer-derived ceramic for harsh environments up to 1200 °C. Surf. Coat. Technol. 2024, 494, 131420. [Google Scholar]
  3. Zhao, H.; Chen, L.; Luan, X.; Zhang, X.; Yun, J.; Xu, T. Synthesis, pyrolysis of a novel liquid SiBCN ceramic precursor and its application in ceramic matrix composites. J. Eur. Ceram. Soc. 2017, 37, 1321–1329. [Google Scholar] [CrossRef]
  4. Li, Q.; Yin, X.; Kong, L.; Duan, W.; Zhang, L.; Cheng, L. High Temperature Dielectric and Microwave Absorption Properties of Polymer Derived SiCN Ceramic in X Band. High Temp. Ceram. Matrix Compos. 2014, 8, 193–202. [Google Scholar]
  5. Luo, C.; Jiao, T.; Tang, Y.; Kong, J. Excellent Electromagnetic Wave Absorption of Iron-Containing SiBCN Ceramics at 1158 K High-Temperature. Adv. Eng. Mater. 2018, 20, 1701168. [Google Scholar] [CrossRef]
  6. Yang, W.; Yang, D.; Mei, H.; Yao, L.; Xiao, S.; Yao, Y.; Chen, C.; Cheng, L. 3D printing of PDC-SiOC@SiC twins with high permittivity and electromagnetic interference shielding effectiveness. J. Eur. Ceram. Soc. 2021, 41, 5437–5444. [Google Scholar]
  7. Ye, F.; Cao, Y.; Liang, J.; Cheng, L. Fabrication and electromagnetic absorbing properties of CNTs modified PDCs-SiOC. Mater. Charact. 2023, 203, 113037. [Google Scholar] [CrossRef]
  8. Li, Q.; Yin, X.; Duan, W.; Kong, L.; Hao, B.; Ye, F. Electrical, dielectric and microwave-absorption properties of polymer derived SiC ceramics in X band. J. Alloys Compd. 2013, 565, 66–72. [Google Scholar] [CrossRef]
  9. Wei, H.; Zhou, C.; Feng, P.; Yu, Y.; Xue, J.; Zhao, F.; Wang, Q. Rear earth (Re: Sc, Y, and Ce) modified PDCs-SiC ceramics for efficient microwave absorption. Mater. Charact. 2022, 190, 112048. [Google Scholar]
  10. Xue, J.; Tang, Z.; Wang, C.; Wei, H. Microstructure and EMW absorption properties of PDCs-SiCN(Ti) ceramics with adjustable SiC nanowires and TiC nanocrystallines. Mater. Res. Bull. 2024, 176, 112804. [Google Scholar]
  11. Xue, J.; Hu, S.; Li, X.; Li, F.; Liu, Y.; Wei, H. Enhanced microwave absorbing properties of Y2O3 modified PDC SiCN ceramics with heterogeneous amorphous interface. J. Alloys Compd. 2023, 931, 167499. [Google Scholar]
  12. Lu, J.; Feng, Y.; Liu, J.; Liu, C.; Tong, Y.; Wu, S.; Sun, H.; Gong, H.; Guo, X. Improved electromagnetic wave absorbing performance of PDCs-SiCN(Ni) fibers with different nickel content. Ceram. Int. 2022, 48, 23578–23589. [Google Scholar] [CrossRef]
  13. Jiang, J.; Yan, L.; Li, J.; Xue, Y.; Zhang, C.; Hu, X.; Guo, A.; Du, H.; Liu, J. Lightweight, thermally insulating SiBCN/Al2O3 ceramic aerogel with enhanced high-temperature resistance and electromagnetic wave absorption performance. Chem. Eng. J. 2024, 501, 157656. [Google Scholar]
  14. Zhang, Y.; Yin, X.; Ye, F.; Kong, L. Effects of multi-walled carbon nanotubes on the crystallization behavior of PDCs-SiBCN and their improved dielectric and EM absorbing properties. J. Eur. Ceram. Soc. 2014, 34, 1053–1061. [Google Scholar]
  15. Liu, C.; Tong, Y.; Liu, C.; Liu, J.; Sun, H.; Hu, Q.; Wu, S.; Zhao, Y.; Li, J.; Guo, X.; et al. Novel and efficient electromagnetic wave absorption of SiBCN(Fe) nanofibers. Colloids Surf. A Physicochem. Eng. Asp. 2023, 679, 132605. [Google Scholar]
  16. Tang, H.; Ren, K.; Wang, Y. Polysiloxane encapsulating strategy to enhance the high-temperature electromagnetic wave absorption performance of carbon-rich SiOC ceramics. Ceram. Int. 2024, 50, 51392–51402. [Google Scholar]
  17. Wang, S.; Ashfaq, M.Z.; Qi, D.; Yue, X.; Gong, H. Electromagnetic wave absorption properties of polymer-derived magnetic carbon-rich SiCN-based composite ceramics. Ceram. Int. 2022, 48, 4986–4998. [Google Scholar]
  18. Song, Y.; He, L.; Zhang, X.; Liu, F.; Tian, N.; Tang, Y.; Kong, J. Highly Efficient Electromagnetic Wave Absorbing Metal-Free and Carbon-Rich Ceramics Derived from Hyperbranched Polycarbosilazanes. J. Phys. Chem. C 2017, 121, 24774–24785. [Google Scholar]
  19. Yang, L.; Liu, H.; Zu, M. Enhanced microwave-absorbing property of precursor infiltration and pyrolysis derived SiCf/SiC composites at X band: Role of carbon-rich interphase. J. Am. Ceram. Soc. 2018, 101, 3402–3413. [Google Scholar]
  20. Mo, P.; Shui, A.; Yu, H.; Qian, J. Synthesis and high electromagnetic wave absorption performance of carbon-enriched porous SiOC ceramics. J. Alloys Compd. 2025, 1010, 177120. [Google Scholar]
  21. Sádovská, G.; Honcová, P.; Morávková, J.; Jirka, I.; Vorokhta, M.; Pilař, R.; Rathouský, J.; Kaucký, D.; Mikysková, E.; Sazama, P. The thermal stability of carbon materials in the air: Quantitative structural investigation of thermal stability of carbon materials in air. Carbon 2023, 206, 211–225. [Google Scholar] [CrossRef]
  22. Feng, Y.; Guo, X.; Gong, H.; Zhang, Y.; Liu, Y.; Lin, X.; Mao, J. Microwave absorption performance of PDCs-SiCN(Fe) ceramics with negative imaginary permeability. Ceram. Int. 2018, 44, 10420–10425. [Google Scholar] [CrossRef]
  23. Wei, H.; Yang, S.; Feng, P.; Zhou, C.; Xue, J.; Wang, C.; Chen, L.; Zhao, F.; Wang, Q. Optimization of Ti with modified SiC ceramics for electromagnetic absorption properties. Mater. Charact. 2023, 198, 112761. [Google Scholar] [CrossRef]
  24. Huang, W.; Wang, Y.; Ning, Z.; Mao, S.; Xue, Z.; Zhu, Y.; Tao, Q.; Lan, S.; Yao, R. Design of lightweight and antioxidant SiCnws/SiC(Mo, rGO) nanocomposite from molybdenum-modified precursors for aerospace vehicle components. Ceram. Int. 2023, 49, 25998–26014. [Google Scholar] [CrossRef]
  25. Zhu, Y.; Jin, C.; Ning, Z.; Huang, W.; Mao, S.; Xue, Z.; Lan, S.; Tao, Q.; Yao, R. In-situ construction of oxidation resistant porous Mo4.8Si3C0.6/SiC(rGO) composite PDCs served as thermal insulation components of hypersonic vehicles. Ceram. Int. 2023, 49, 37280–37292. [Google Scholar] [CrossRef]
  26. Hou, Y.; Yang, W.; Zhong, C.; Wu, S.; Wu, Y.; Liu, F.; Huang, X.; Wen, G. Thermostable SiCO@BN sheets with enhanced electromagnetic wave absorption. Chem. Eng. J. 2019, 378, 122239. [Google Scholar] [CrossRef]
  27. Han, Y.; Zhong, L.; Zheng, Y.; Zhou, R.; Liao, L.; Chen, G.; Huang, W.; Lin, S.; Zhong, Y.; Li, J.; et al. Enhanced electrical and thermal conductivities of 3D-SiC(rGO, Gx) PDCs based on polycarbosilane-vinyltriethoxysilane-graphene oxide (PCS-VTES-GO) precursor containing graphene fillers. Ceram. Int. 2020, 46, 950–958. [Google Scholar] [CrossRef]
  28. Ren, B.; Deng, Y.; Jia, Y.; Wu, X.; Feng, G.; Wang, Q.; Li, H. Electromagnetic wave absorbing ceramics composites made of polymer-derived SiC with BN@CNTs pyrolyzed higher than 1200 °C. J. Mater. Sci. Technol. 2023, 167, 213–227. [Google Scholar] [CrossRef]
  29. Zheng, C.-m.; Li, X.-d.; Wang, H.; Zhu, B. Thermal stability and curing kinetics of polycarbosilane fibers. Trans. Nonferrous Met. Soc. China 2006, 16, 44–48. [Google Scholar] [CrossRef]
  30. Kita, K.I.; Usukawa, R.; Hotta, M. A polymer blend containing polycarbosilane and polysilaethylene for designing improved silicon carbide based fibers. Ceram. Int. 2025, 51, 1227–1232. [Google Scholar] [CrossRef]
  31. Hackbarth, H.G.; Key, T.S.; Ackley, B.J.; Opletal, G.; Rawal, A.; Gallington, L.; Yang, Y.; Thomsen, L.; Dickerson, M.B.; Pruyn, T.L.; et al. Uncovering atomic-scale polymer-to-ceramic transformations in SiC polymer derived ceramics from polycarbosilanes. J. Eur. Ceram. Soc. 2024, 44, 1932–1945. [Google Scholar]
  32. Wang, J.; Wang, L.; Zhu, Y.; Luo, R.; Dong, X.; Song, J.; Wu, X. Microwave absorption properties of PDCs-SiC(N) based on heat treatment at different temperatures. Ceram. Int. 2024, 50, 40666–40677. [Google Scholar] [CrossRef]
  33. Li, Q.; Zhang, J.; Wang, Z.; Wang, Y.; Yang, J.; Bordia, R.K. Influence of microstructure evolution on temperature-dependent dielectric and electromagnetic wave absorption properties of PDCs-SiC. Ceram. Int. 2022, 48, 8596–8604. [Google Scholar] [CrossRef]
  34. Zhang, Y.; Fang, Y.; Hou, X.; Wen, J.; Chen, J.; Wang, S.; Cao, K.; Ye, W.; Zhao, R.; Wang, W.; et al. Construction of three-dimensional mesh porous Mo2C/carbon composites by chitosan salting-out for efficient microwave absorption. Carbon 2023, 214, 118323. [Google Scholar] [CrossRef]
  35. Roy, D.; Kanojia, S.; Mukhopadhyay, K.; Eswara Prasad, N. Analysis of carbon-based nanomaterials using Raman spectroscopy: Principles and case studies. Bull. Mater. Sci. 2021, 44, 31. [Google Scholar] [CrossRef]
  36. Wang, L.; Lu, J.; Zhang, J.; Zhu, J. Facile preparation and high microwave absorption of flower-like carbon nanosheet aggregations embedded with ultrafine Mo2C. J. Colloid Interface Sci. 2023, 641, 729–736. [Google Scholar]
  37. Koverga, A.A.; Gómez-Marín, A.M.; Dorkis, L.; Flórez, E.; Ticianelli, E.A. Role of Transition Metals on TM/Mo2C Composites: Hydrogen Evolution Activity in Mildly Acidic and Alkaline Media. ACS Appl. Mater. Interfaces 2020, 12, 27150–27165. [Google Scholar] [CrossRef]
  38. Yang, Q.; Qiu, R.; Ma, X.; Hou, R.; Sun, K. Surface reconstruction and the effect of Ni-modification on the selective hydrogenation of 1,3-butadiene over Mo2C-based catalysts. Catal. Sci. Technol. 2020, 10, 3670–3680. [Google Scholar]
  39. Zhou, W.; Li, Y.; Long, L.; Luo, H.; Wang, Y. High-temperature electromagnetic wave absorption properties of Cf/SiCNFs/Si3N4 composites. J. Am. Ceram. Soc. 2020, 103, 6822–6832. [Google Scholar]
  40. Zhang, N.; Chen, P.; Wang, Y.; Zong, M.; Chen, W. Supramolecular self-assembly derived Mo2C/FeCo/NC hierarchical nanostructures with excellent wideband microwave absorption properties. Compos. Sci. Technol. 2022, 221, 109325. [Google Scholar]
  41. Zeng, X.; Ning, Y.; Guo, H.; Xie, N.; Yu, R. Dual template induced assembly of 2D nanosheets to 3D porous Mo2C/NiFe-NC networkers for electromagnetic wave absorption. Mater. Today Phys. 2023, 34, 101077. [Google Scholar]
  42. Dong, Y.; Yuan, X.; Wu, H.; Wang, W.; Zhou, M. Synthesis of Mo2C/C nanoclusters attached on rGO nanosheets for high-Efficiency electromagnetic wave absorption. Appl. Surf. Sci. 2024, 672, 160886. [Google Scholar]
  43. Huang, J.; Mahariq, I.; Kumar, S.M.; Abdullaev, S.; Kannan, S.; Thi Xuan Dieu, N.; Fouad, Y. Facile fabrication of bilayer electromagnetic wave absorber via hierarchical Mo2C/La0.6Sr0.4MnO3 nanocomposite with multi-heterointerfaces for efficient low-frequency absorption. Colloids Surf. A Physicochem. Eng. Asp. 2024, 689, 133664. [Google Scholar]
  44. Yang, X.; Qiang, R.; Shao, Y.; Ren, F.; Rong, L.; Fang, J.; Xue, R.; Liu, Z. Hollow hydrangea-like Mo2C/MoO2/C composites with tunable phase compositions as highly efficient microwave absorbers. Appl. Surf. Sci. 2025, 682, 161633. [Google Scholar]
  45. Liu, J.; Wei, X.; Gao, L.; Tao, J.; Xu, L.; Peng, G.; Jin, H.; Wang, Y.; Yao, Z.; Zhou, J. An overview of C-SiC microwave absorption composites serving in harsh environments. J. Eur. Ceram. Soc. 2023, 43, 1237–1254. [Google Scholar]
  46. Du, H.; Zhang, W.; Wang, L.; Shen, S.; Dong, W.; Hu, Y.; Rehman, S.U.; Zou, H.; Liang, T. Heterostructured C@Fe3O4@FeSiCr composite absorbing material derived from MIL-88(Fe)@FeSiCr. J. Alloys Compd. 2023, 968, 172129. [Google Scholar]
  47. Xue, J.; Wu, C.; Du, X.; Ma, W.; Wen, K.; Huang, S.; Liu, Y.; Liu, Y.; Zhao, G. Preparation and properties of functional particle Fe3O4-rGO and its modified fiber/epoxy composite for high-performance microwave absorption structure. Mater. Res. Express 2020, 7, 045303. [Google Scholar]
  48. Wang, X.; Lu, Y.; Zhu, T.; Chang, S.; Wang, W. CoFe2O4/N-doped reduced graphene oxide aerogels for high-performance microwave absorption. Chem. Eng. J. 2020, 388, 124317. [Google Scholar]
  49. Huang, Y.; Ji, J.; Chen, Y.; Li, X.; He, J.; Cheng, X.; He, S.; Liu, Y.; Liu, J. Broadband microwave absorption of Fe3O4BaTiO3 composites enhanced by interfacial polarization and impedance matching. Compos. Part B Eng. 2019, 163, 598–605. [Google Scholar]
Figure 1. (a) The preparation diagram, (b) Composition change process of Mo2C/SiC ceramic.
Materials 18 01573 g001
Figure 2. (a) IR spectrum and (b) TG curves of PCS@MoS2.
Materials 18 01573 g002
Figure 3. XRD pattern of Mo2C/SiC.
Materials 18 01573 g003
Figure 4. Raman spectrum of Mo2C/SiC. (a) Raman spectrum of Mo2C/SiC, (b) Amplification of Raman spectra in the red dotted box in Figure 4a (500–1000 cm−1).
Materials 18 01573 g004
Figure 5. (a,b) Morphology of P1, (c) lattice fringe of P1, (d) diffraction pattern of p1, (ei) element surface scanning of P1, (j) morphology of P3, (k,l) lattice fringe of P3, (m) diffraction pattern of P3, (nr) element surface scanning of P3.
Materials 18 01573 g005
Figure 6. Sample XPS diagram: (a) total energy spectrum, (b) Si2p, (c) Mo3d, (d) C1s of the P1 sample, (e) C1s of the P2 sample, (f) C1s of the P3 sample, (g) C1s of the P4 sample.
Materials 18 01573 g006
Figure 7. Reflection loss of P1 (a), P2 (b), P3 (c), and P4 (d).
Materials 18 01573 g007
Figure 8. Comparison of permittivity: (a) ε’, (b) ε″, (c) tanδε, and (d) Attenuation factor (α).
Materials 18 01573 g008
Figure 9. Cole-Cole diagram of P1 (a), P2 (b), P3 (c), and P4 (d).
Materials 18 01573 g009
Figure 10. Impedance matching diagram (Z) of P1 (a), P2 (b), P3 (c), and P4 (d).
Materials 18 01573 g010
Figure 11. Absorbing mechanism of Mo2C/SiC.
Materials 18 01573 g011
Table 1. The RLmin and EBW of the samples prepared in this experiment were compared with other types of Mo2C absorbing materials.
AbsorbersRLmin/ThicknessEBW/ThicknessRefs.
Mo2C/SiC−46.94 dB/2.6 mm4 GHz/2.6 mmThis work
Mo2C/FeCo/NC−56.03 dB/3.4 mm10.27 GHz/3.4 mm[40]
FCN-Mo2C−36.80 dB/2.9 mm7.04 GHz/2.9 mm[25]
Mo2C/NiFe-NC−51.56 dB/1.4 mm3.7 GHz/1.4 mm[41]
Mo2C/C composites−20.38 dB/1.8 mm5.04 GHz/1.8 mm[34]
Mo2C/C-rGO−30.00 dB/1.6 mm5.12 GHz/1.6 mm[42]
Mo2C/La0.6Sr0.4MnO3−39.00 dB/1.2 mm5.40 GHz/1.2 mm[43]
Mo2C/MoO2/C−62.9 dB/1.9 mm6.20 GHz/1.9 mm[44]
Disclaimer/Publisher’s Note: The statements, opinions and data contained in all publications are solely those of the individual author(s) and contributor(s) and not of MDPI and/or the editor(s). MDPI and/or the editor(s) disclaim responsibility for any injury to people or property resulting from any ideas, methods, instructions or products referred to in the content.

