
Experimental Study on Mechanical Properties of Desert Sand Concrete Under Freeze–Thaw Cycles

Abstract
1. Introduction
2. Materials and Methods
2.1. Materials
2.2. Mix Proportions
2.3. Method
2.3.1. Freeze–Thaw Cycling
- upon completion of the specified 200 F-T cycles;
- when the mass loss rate of the specimen exceeds or equals 5%;
- when the relative dynamic elastic modulus of the specimen drops below 60%.
2.3.2. Macro Characterization
2.3.3. Microstructure
3. Analysis of the Test Results
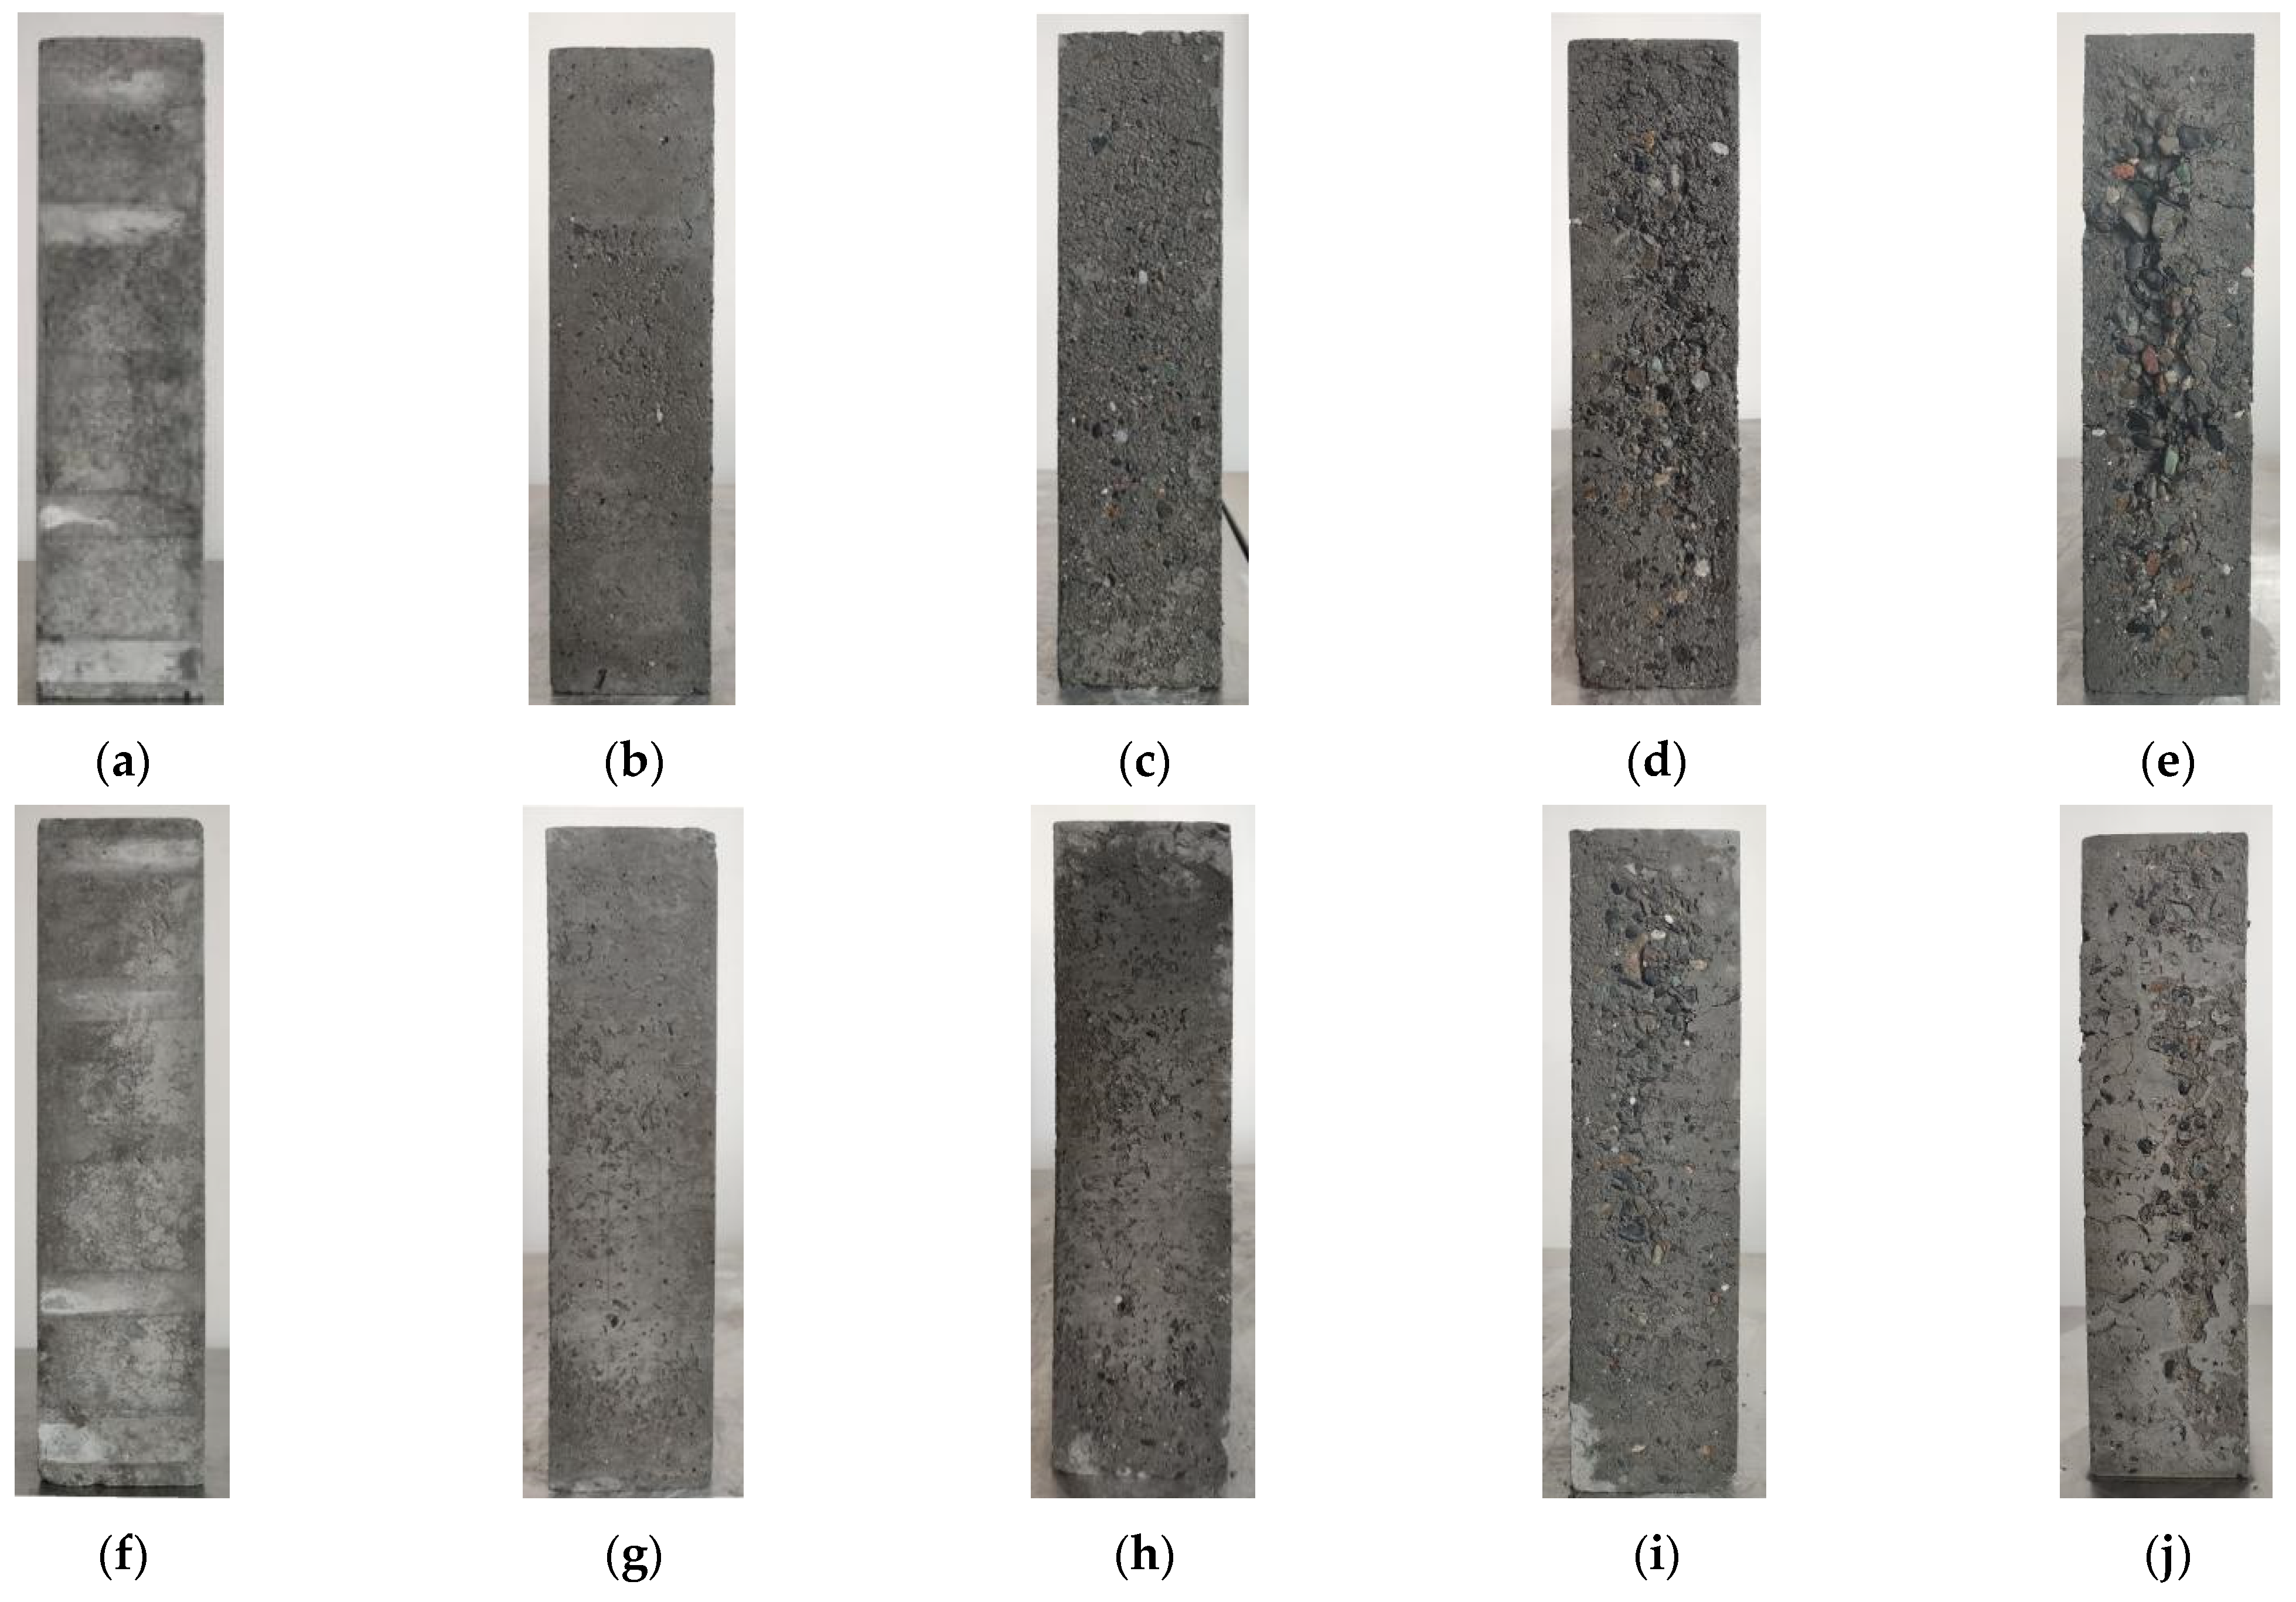
3.1. Scaling Damage
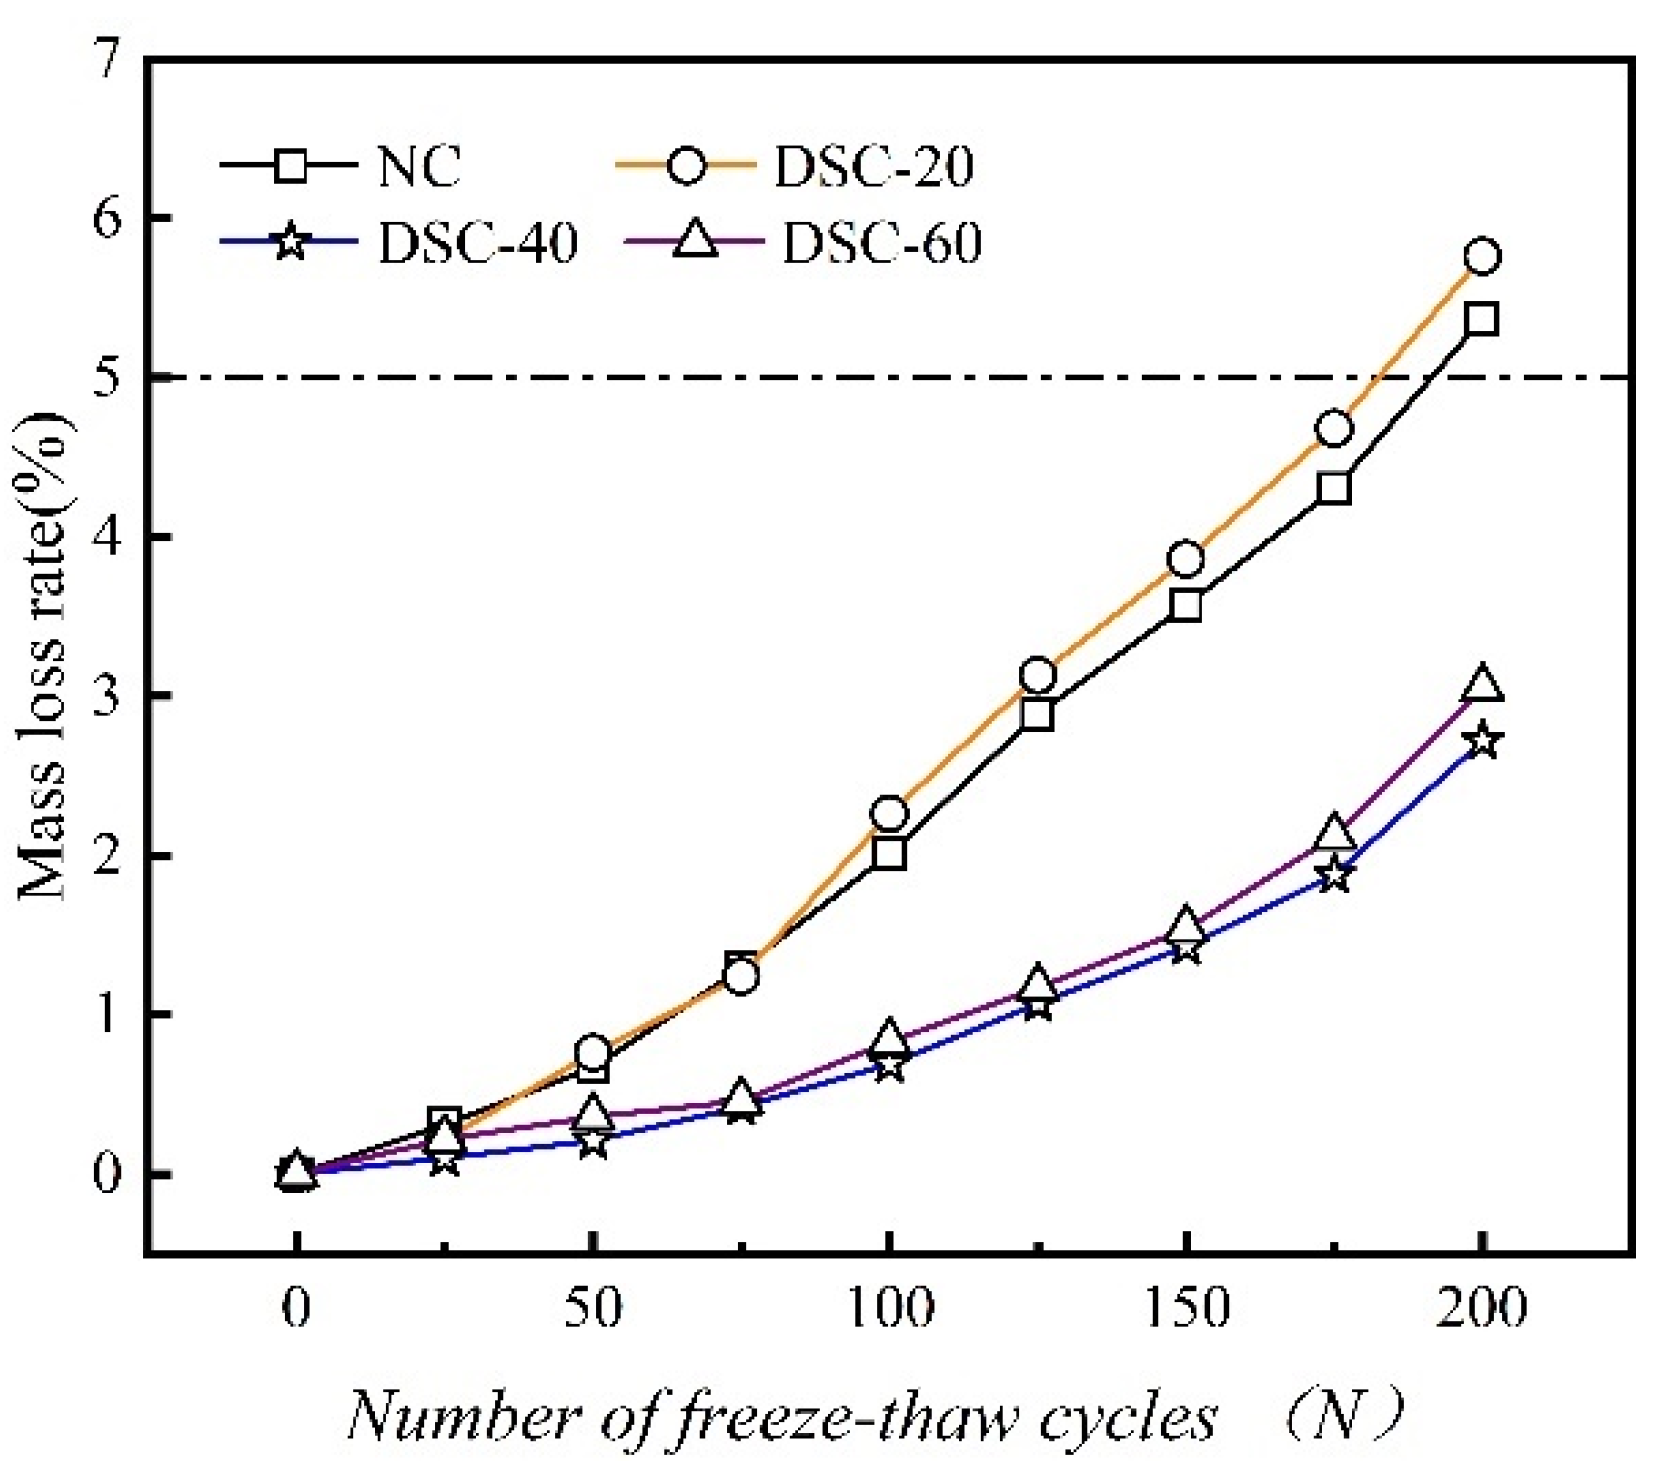
3.2. Mass Loss Rate
3.3. Relative Dynamic Elastic Modulus
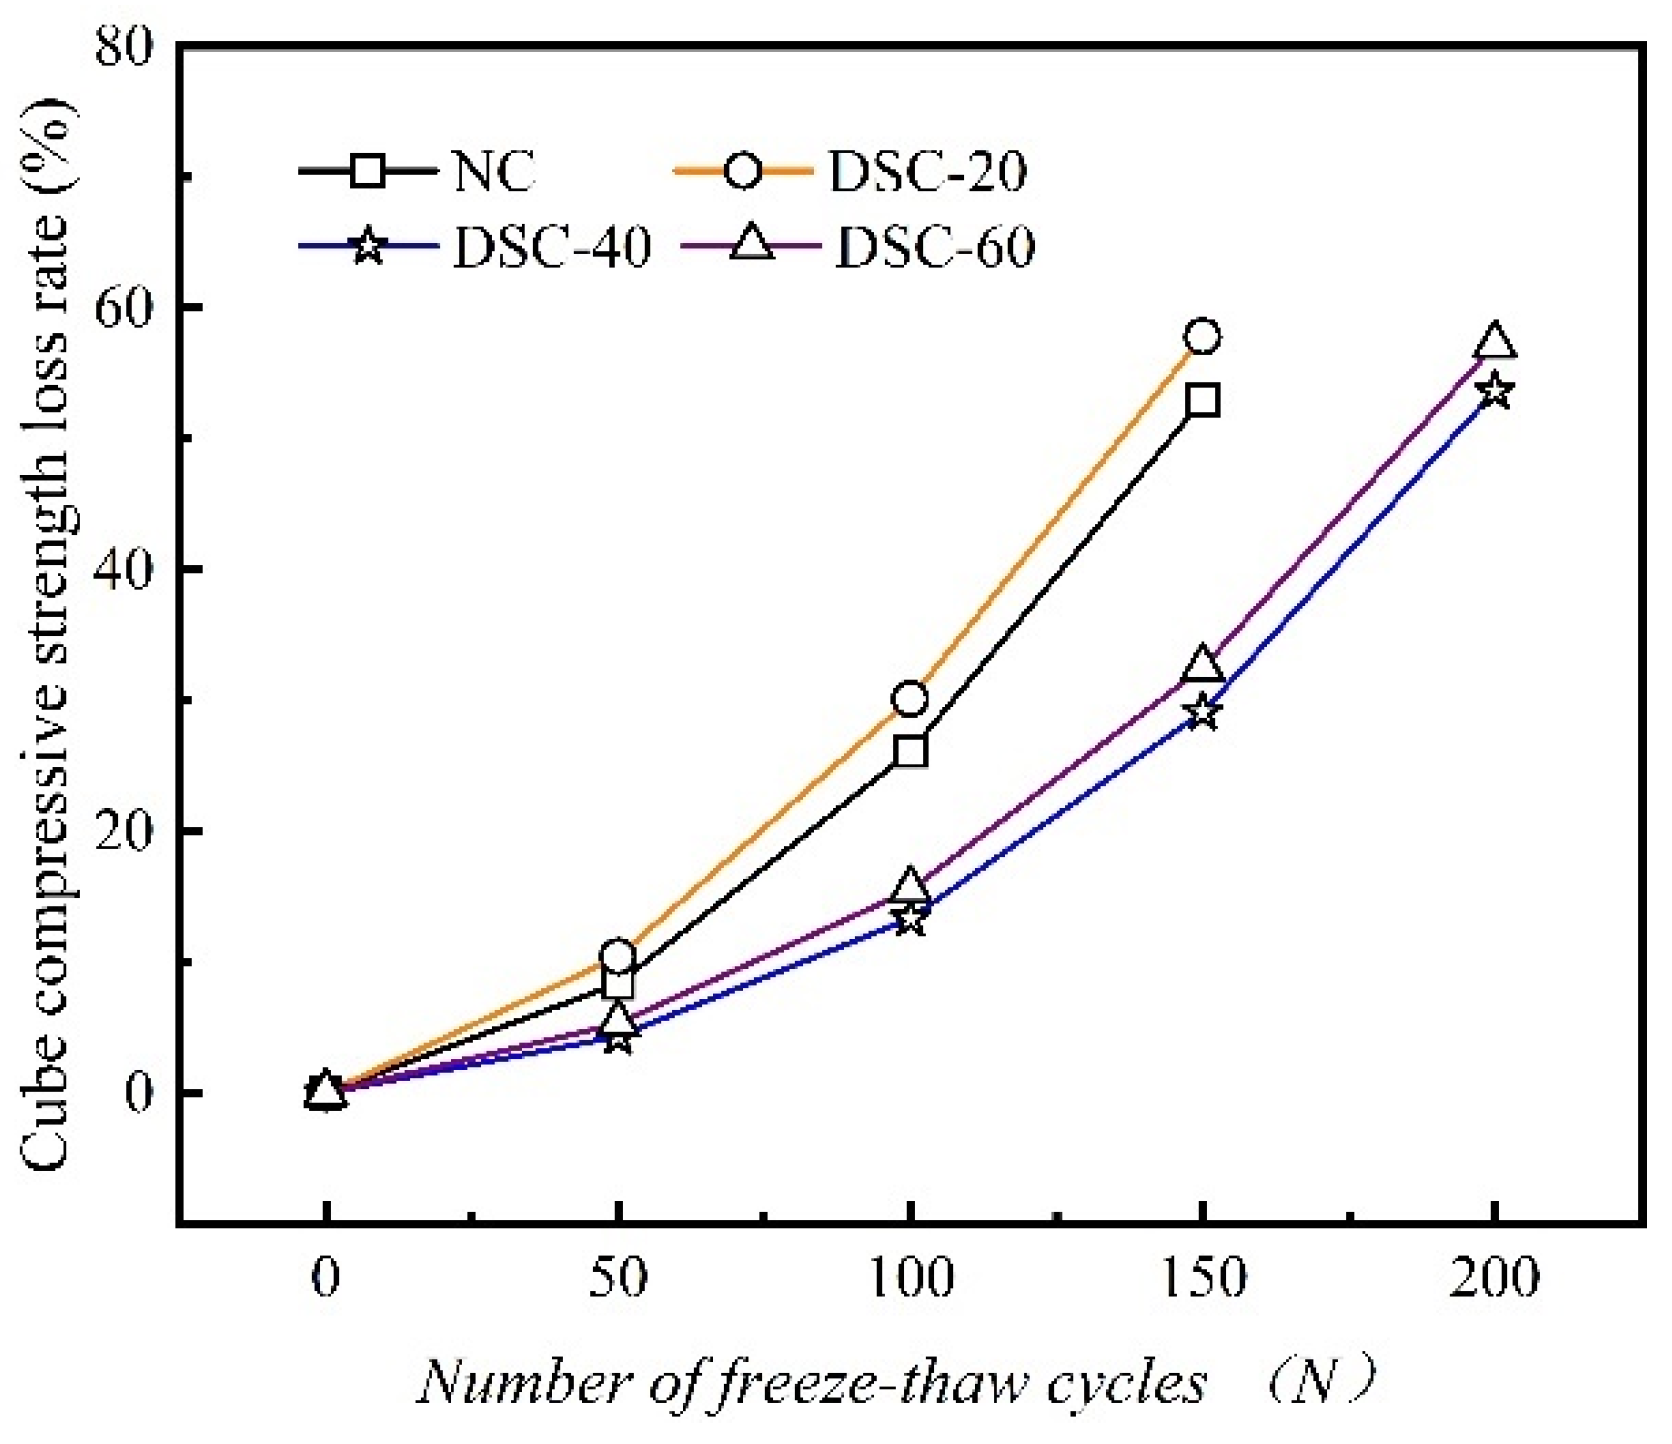
3.4. Cube Compressive Strength Loss Rate
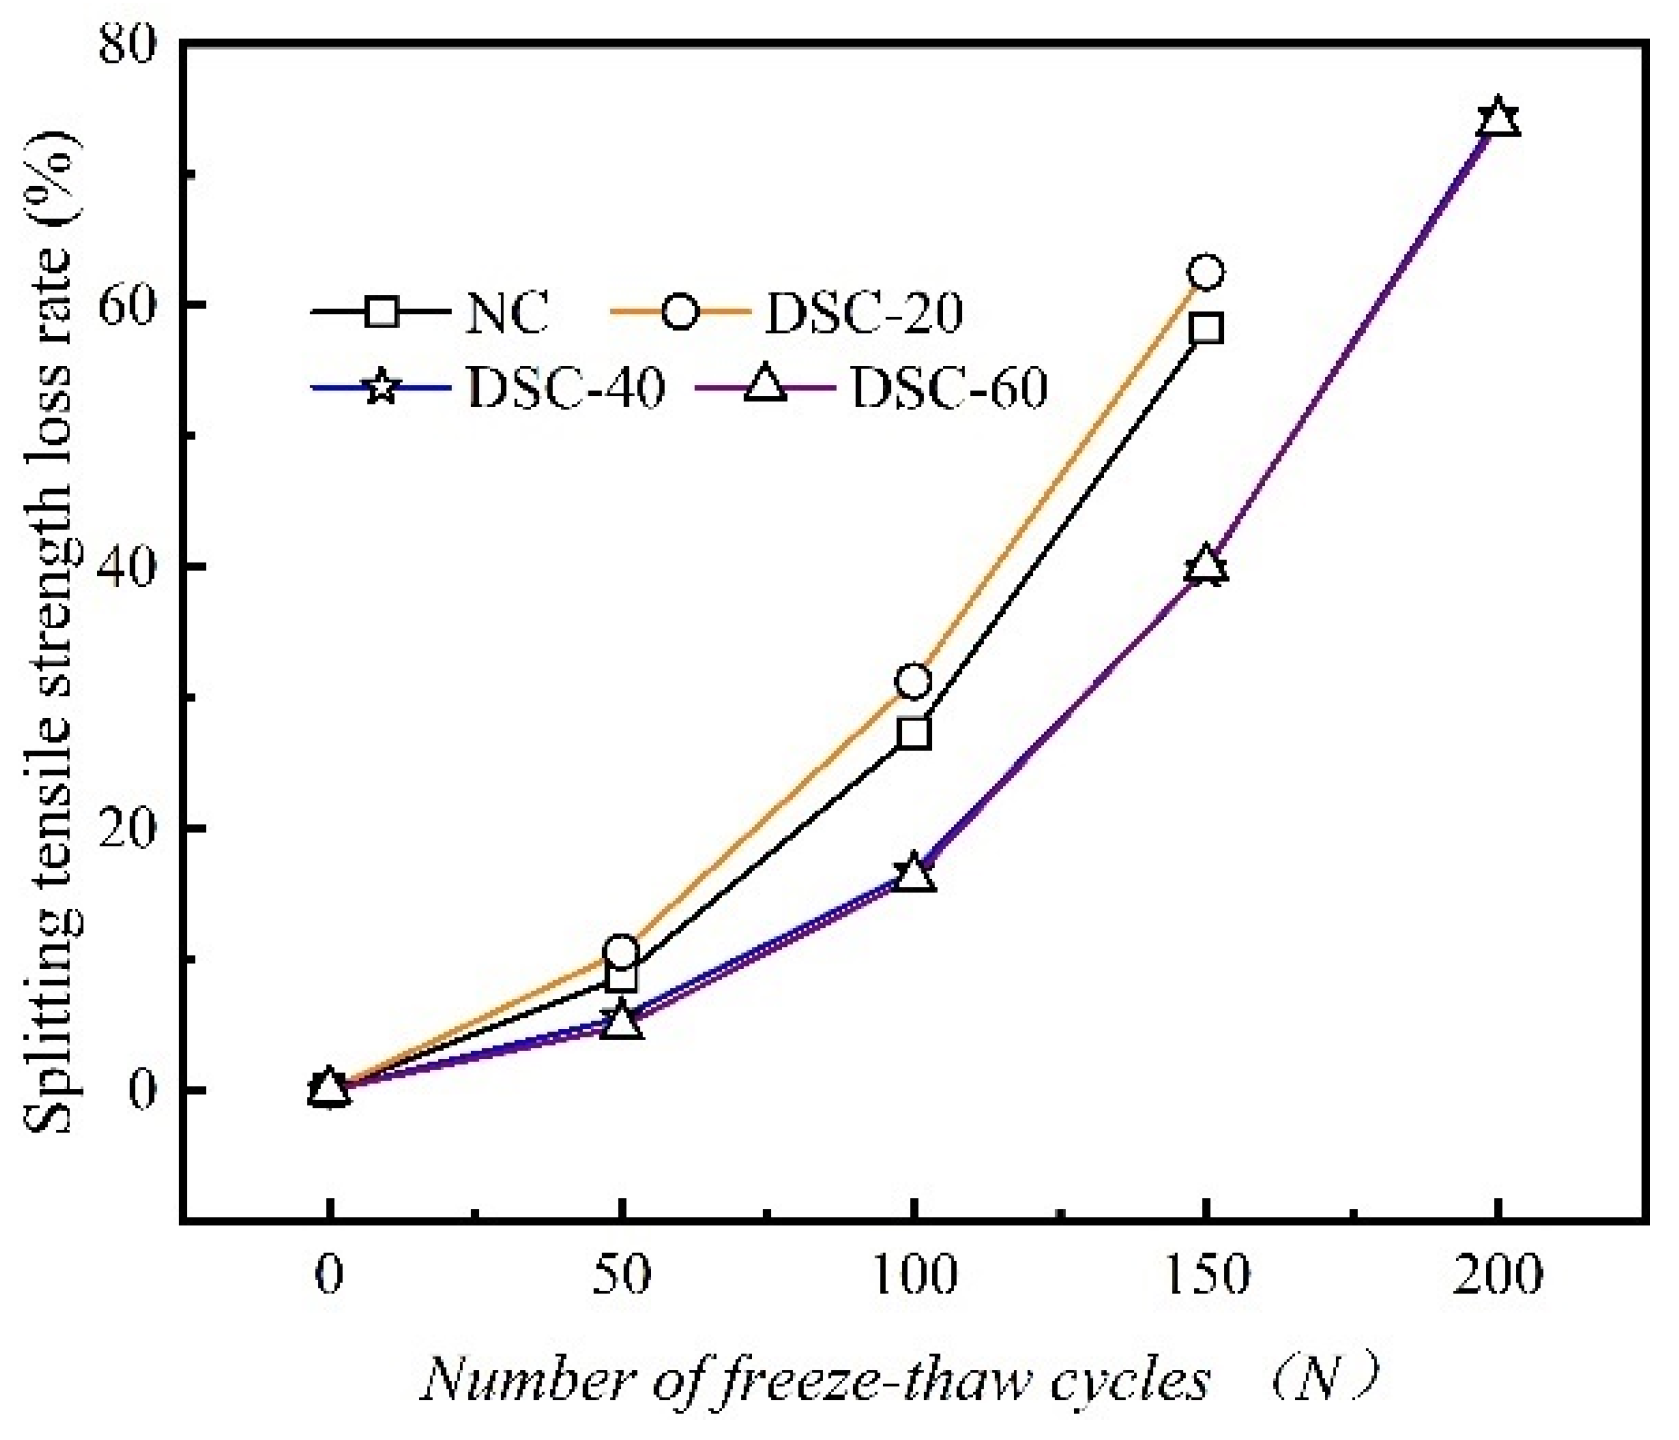
3.5. Splitting Tensile Strength Loss Rate
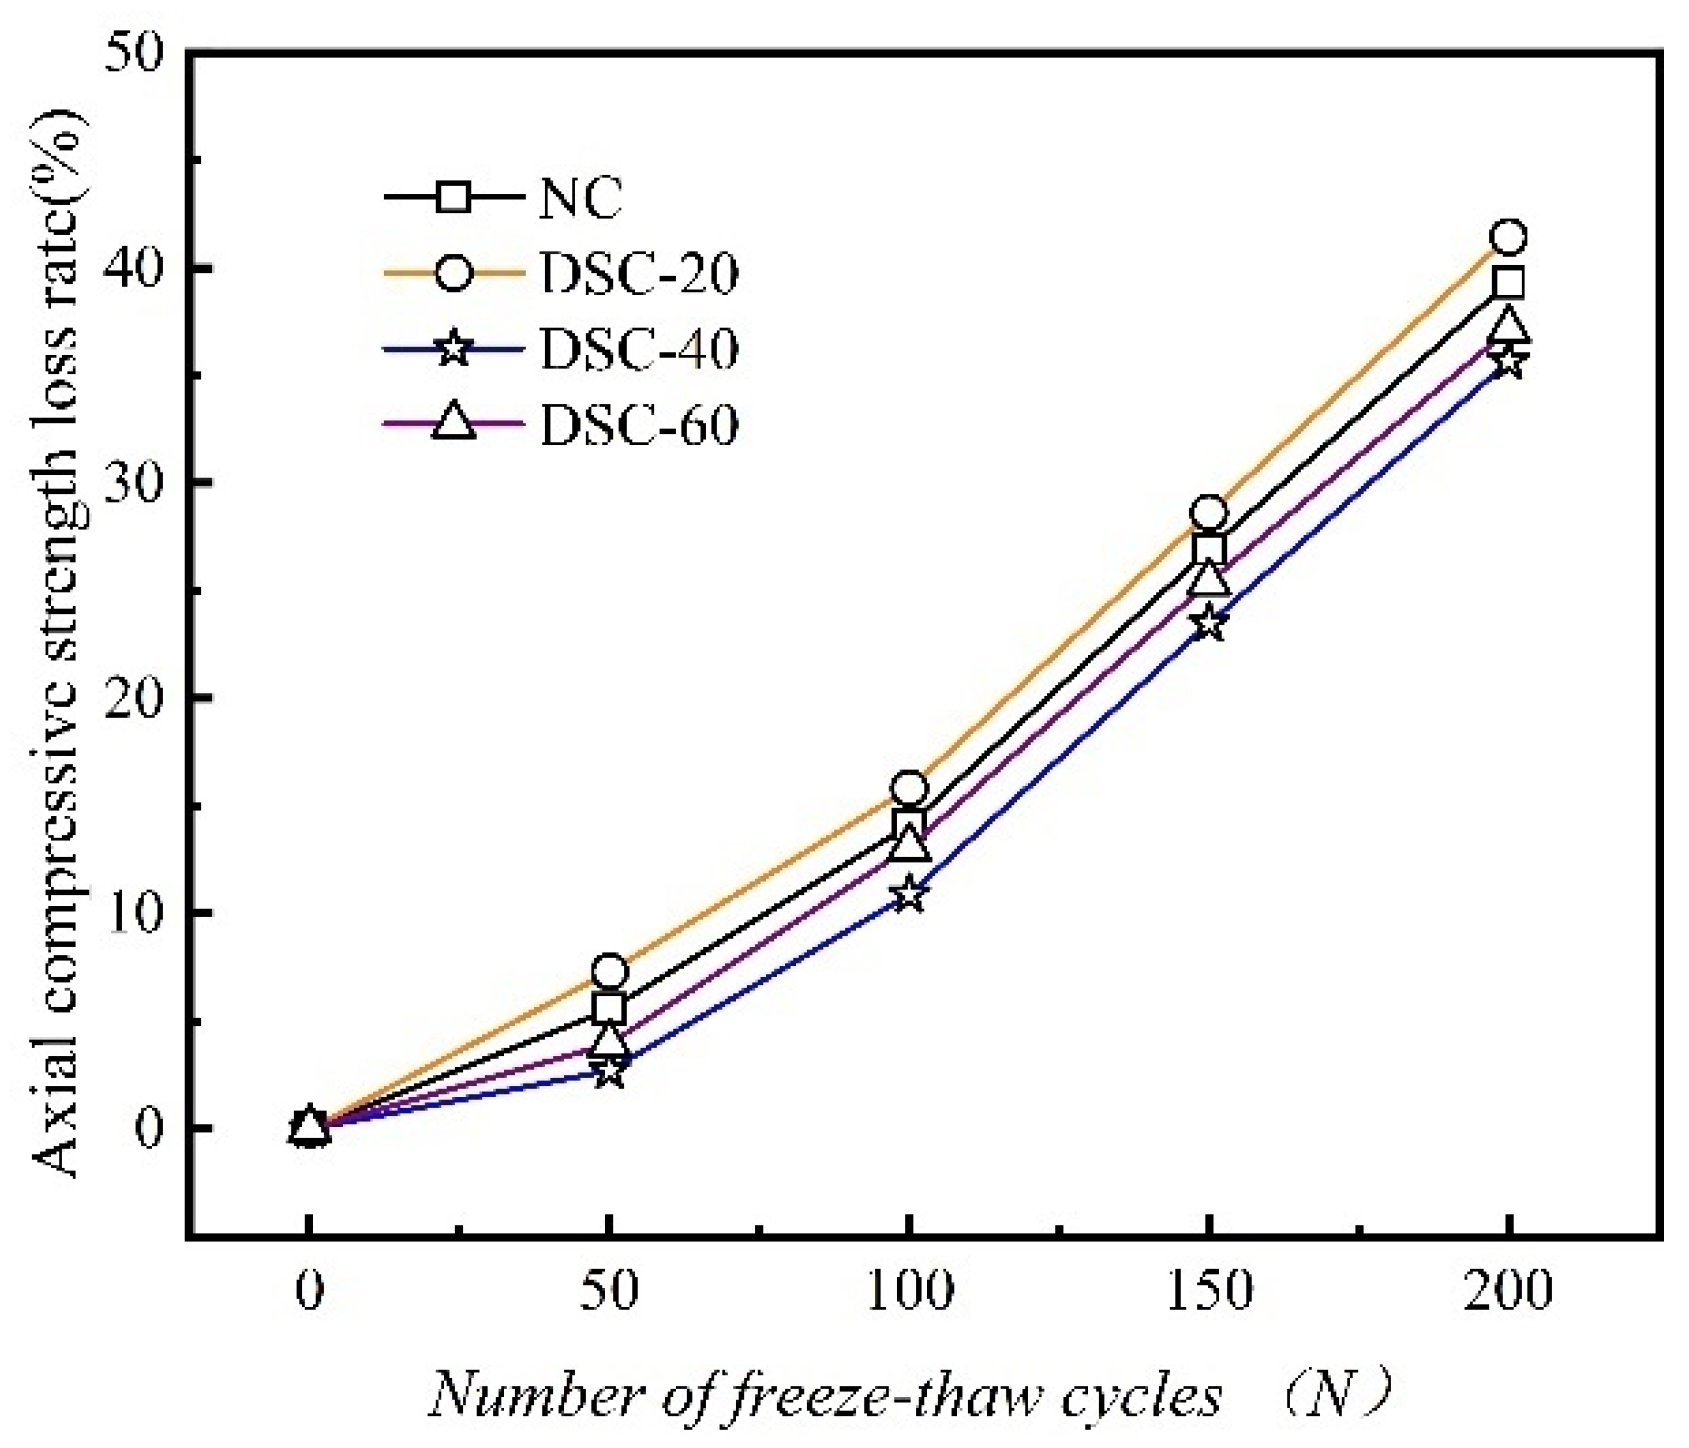
3.6. Axial Compressive Strength Loss Rate
3.7. Microscopic Characterization
4. Freeze–Thaw Damage Model of Concrete
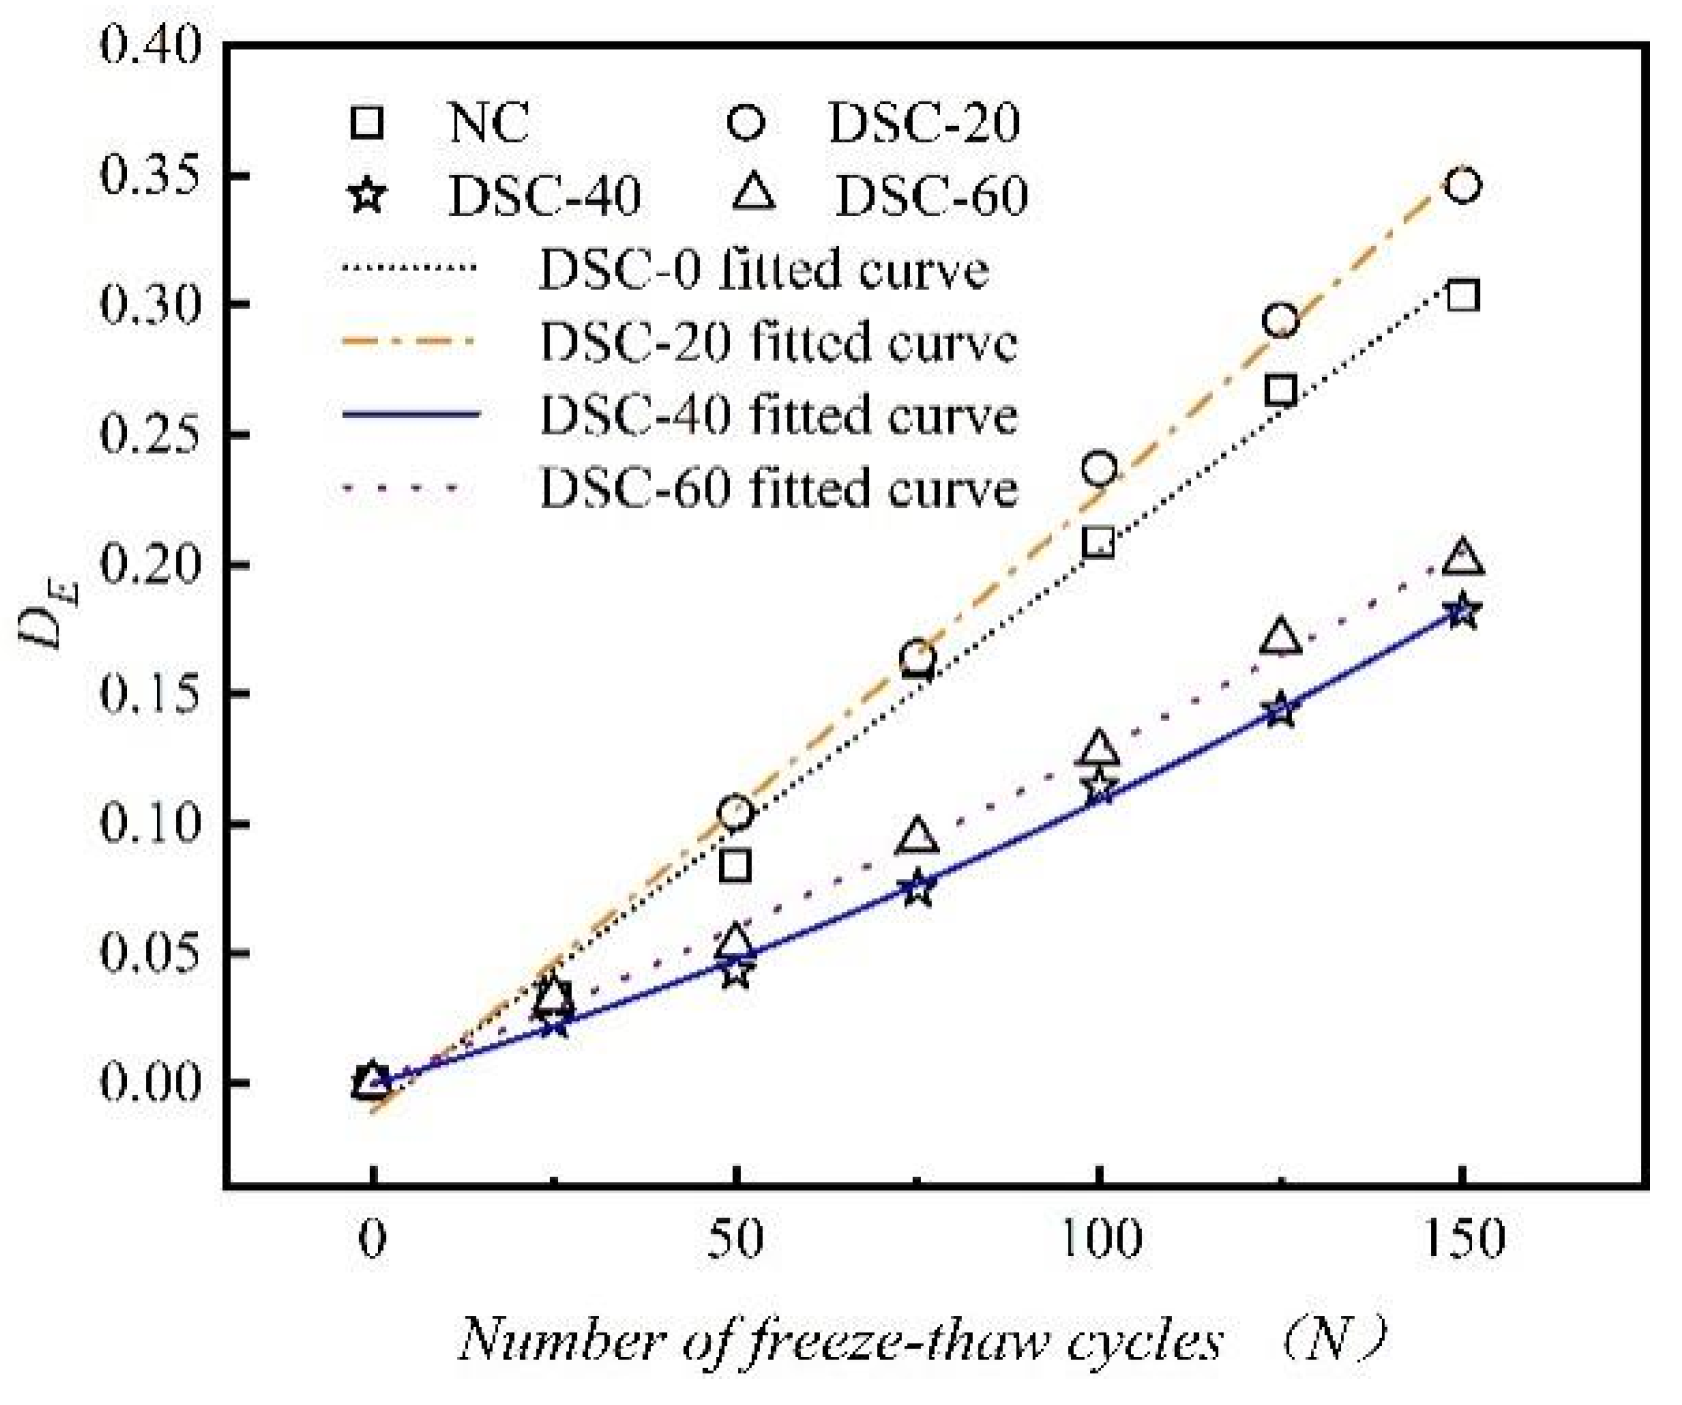
4.1. Dynamic Elastic Modulus Damage Attenuation Model
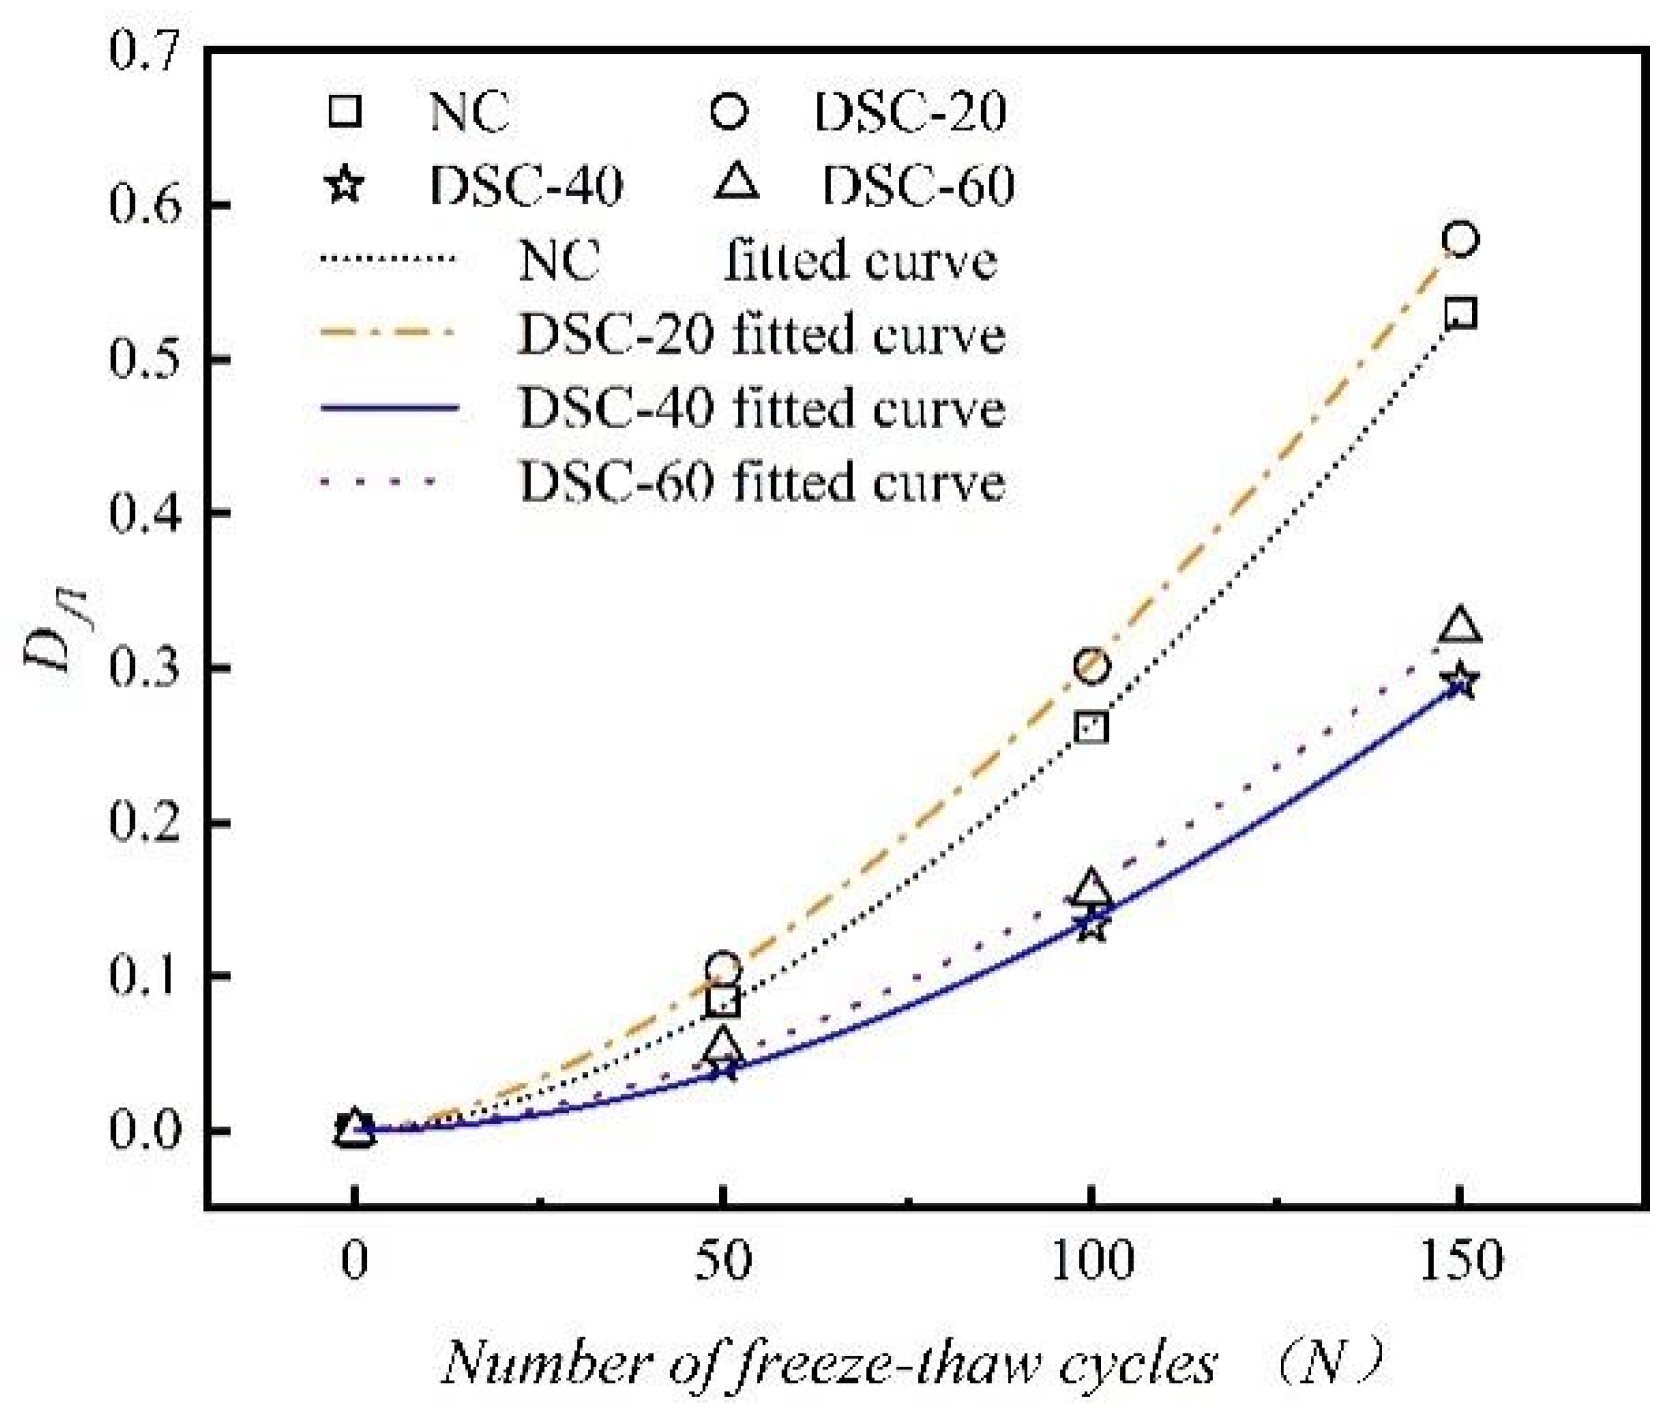
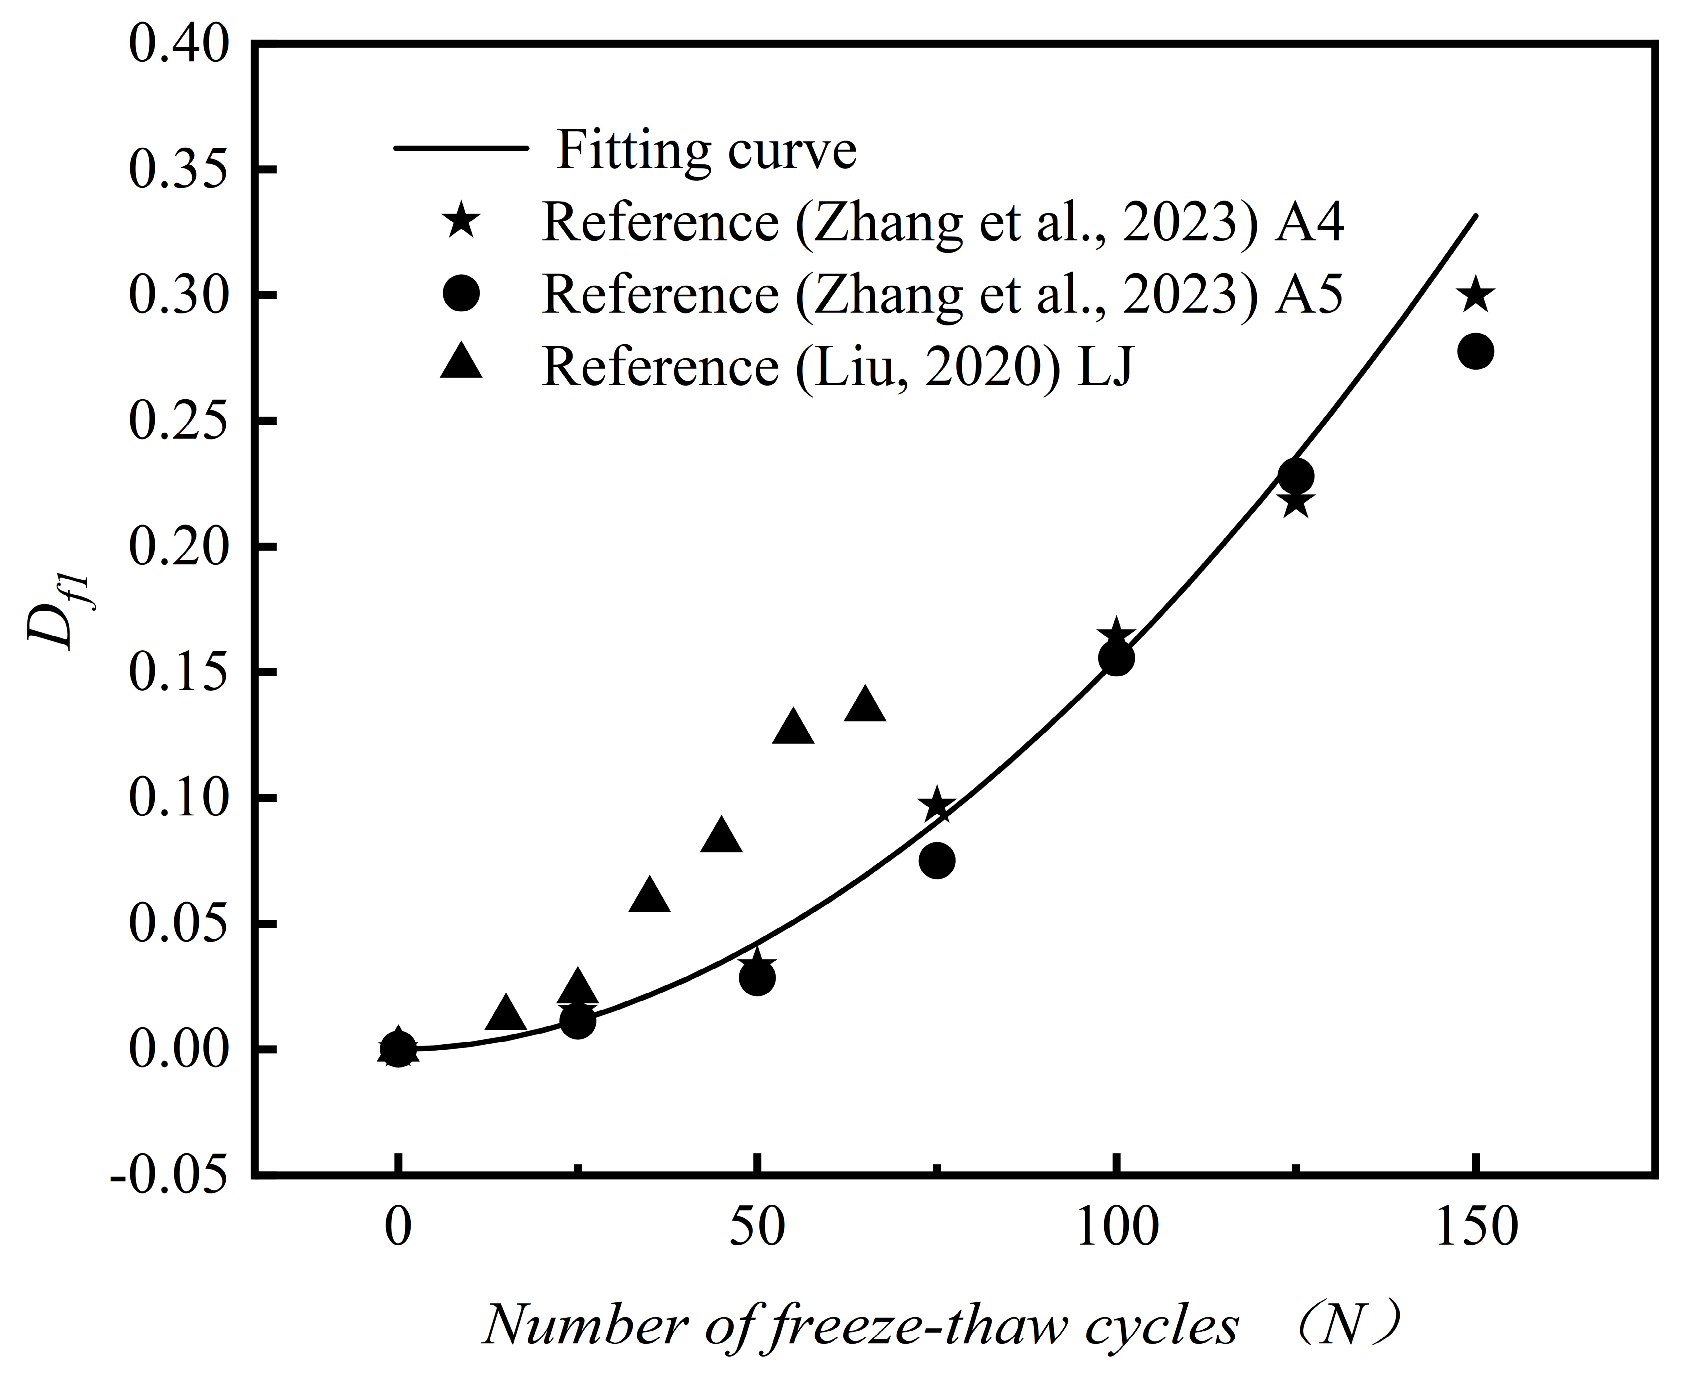
4.2. Compressive Strength Damage Attenuation Model
4.3. Predicting the Lifespan of Desert Sand Concrete Under Freeze–Thaw Cycles
5. Conclusions
- (1)
- After F-T cycling, the trend of mass loss rate is essentially similar to that of the dynamic elastic modulus. As the number of F-T cycles increases, the damage to the specimens progressively worsens. After 175 cycles, the specimens from the NC and DSC-20 groups exhibit severe damage.
- (2)
- The F-T resistance of DSC exhibits a trend that begins with an increase, is succeeded by a decline, and then experiences another rise with the progressive augmentation of the desert sand substitution ratio. The concrete achieves optimal F-T resistance at a 40% replacement rate. After 150 F-T cycles, the cubic compressive strength loss, splitting tensile strength loss, and axial compressive strength loss for the DSC-40 group specimens are 29.1%, 39.8%, and 23.5%, respectively.
- (3)
- Scanning electron microscopy (SEM) was performed on both ordinary concrete and desert sand concrete (DSC) specimens after F-T cycling. The observations indicated that desert sand effectively occupies the pores in cement mortar. At a replacement ratio of 40%, the microstructure of specimens subjected to F-T cycles shows considerable enhancement.
- (4)
- This study established a power function model to describe F-T damage decay based on relative compressive strength. The model achieved a fitting accuracy exceeding 0.998, demonstrating superior fitting effectiveness compared to the dynamic elastic modulus model. This model can effectively reflect the changes in mechanical properties and the extent of damage in DSC under the action of F-T cycles.
- (5)
- This study focuses on the typical cold regions of northwest, north, and northeast China. It analyzes the F-T durability of concrete with varying desert sand replacement ratios. Among them, DSC-40 exhibits the highest F-T durability, reaching up to 44 years of life. At the predicted service life, the calculated compressive strength loss rates, based on the compressive strength damage model, are in the order of DSC-60 < DSC-40 < NC < DSC-20.
Author Contributions
Funding
Institutional Review Board Statement
Informed Consent Statement
Data Availability Statement
Conflicts of Interest
References
- Wang, R.J.; Hu, Z.Y.; Li, Y.; Wang, K.; Zhang, H. Review on the deterioration and approaches to enhance the durability of concrete in the freeze-thaw environment. Constr. Build. Mater. 2022, 321, 126371. [Google Scholar]
- Padmakumar, G.P.; Srinivas, K.; Uday, K.V.; Iyer, K.R.; Pathak, P.; Keshava, S.M.; Singh, D.N. Characterization of aeolian sands from Indian desert. Eng. Geol. 2012, 139, 38–49. [Google Scholar]
- Bendixen, M.; Best, J.; Hackney, C.; Iversen, L.L. Time is running out for sand. Nature 2019, 571, 29–31. [Google Scholar]
- Elipe, M.G.M.; López-Querol, S. Aeolian sands: Characterization, options of improvement and possible employment in construction—The State-of-the-art. Constr. Build. Mater. 2014, 73, 728–739. [Google Scholar]
- Yan, W.; Wu, G.; Dong, Z. Optimization of the mix proportion for desert sand concrete based on a statistical model. Constr. Build. Mater. 2019, 226, 469–482. [Google Scholar]
- Li, Z.; Gan, D. Cyclic behavior and strength evaluation of RC columns with dune sand. J. Build. Eng. 2022, 47, 103801. [Google Scholar] [CrossRef]
- Li, Z.; Ma, R.; Li, G. Experimental Study on the Shear Strength of Dune Sand Concrete Beams. Adv. Civ. Eng. 2020, 2020, 8062691. [Google Scholar]
- Li, Z.; Zhai, D.; Li, J. Seismic behavior of the dune sand concrete beam-column joints under cyclic loading. Structures 2022, 40, 1014–1024. [Google Scholar]
- Zhang, S.L.; Yuan, K.; Zhang, J.M.; Guo, J.L. Experimental Study on Performance Influencing Factors and Reasonable Mixture Ratio of Desert Sand Ceramsite Lightweight Aggregate Concrete. Adv. Civ. Eng. 2020, 2020, 8613932. [Google Scholar]
- Li, Y.G.; Zhang, H.M.; Liu, G.X.; Hu, D.W.; Ma, X.R. Multi-scale study on mechanical property and strength prediction of aeolian sand concrete. Constr. Build. Mater. 2020, 247, 118538. [Google Scholar]
- Li, Y.; Zhang, H.; Liu, X.; Liu, G.; Hu, D.; Meng, X. Time-Varying Compressive Strength Model of Aeolian Sand Concrete considering the Harmful Pore Ratio Variation and Heterogeneous Nucleation Effect. Adv. Civ. Eng. 2019, 2019, 5485630. [Google Scholar]
- Zhang, W.; Zheng, M.L.; Zhu, L.L.; Lv, Y.Z. Mix design and characteristics evaluation of high-performance concrete with full aeolian sand based on the packing density theory. Constr. Build. Mater. 2022, 349, 3148. [Google Scholar]
- Zhou, Y.; Li, H.; Yu, S.Y.; Guo, H.L. Experimental Investigation of the Impact of Blended Fibers on the Mechanical Properties and Microstructure of Aeolian Sand Concrete. Materials 2024, 17, 1952. [Google Scholar] [CrossRef] [PubMed]
- Jiang, L.; Niu, D.; Yuan, L.; Fei, Q. Durability of concrete under sulfate attack exposed to freeze-thaw cycles. Cold Reg. Sci. Technol. 2015, 112, 112–117. [Google Scholar]
- Tian, J.; Wang, W.; Du, Y. Damage behaviors of self-compacting concrete and prediction model under coupling effect of salt freeze-thaw and flexural load. Constr. Build. Mater. 2016, 119, 241–250. [Google Scholar]
- Wang, X.; Shen, X.; Wang, H.; Gao, C. Nuclear magnetic resonance analysis of concrete-lined channel freeze-thaw damage. J. Ceram. Soc. Jpn. 2015, 123, 43–51. [Google Scholar]
- Wang, L.; Xiao, W.; Wang, Q.; Jiang, H.L.; Ma, G.W. Freeze-thaw resistance of 3D-printed composites with desert sand. Cem. Concr. Compos. 2022, 133, 104693. [Google Scholar]
- Zhang, H.; Wang, D.; Jing, P. Study on freeze-thaw damage characteristics of aeolian sand concrete with different replacement ratios. J. Henan Univ. Sci. Technol. (Nat. Sci.) 2023, 44, 70–78+8–9. [Google Scholar]
- Dong, W.; Shen, X.-D.; Xue, H.-J.; He, J.; Liu, Y. Research on the freeze-thaw cyclic test and damage model of Aeolian sand lightweight aggregate concrete. Constr. Build. Mater. 2016, 123, 792–799. [Google Scholar]
- Bai, J.; Zhao, Y.; Shi, J.; He, X. Damage degradation model of aeolian sand concrete under freeze-thaw cycles based on macro-microscopic perspective. Constr. Build. Mater. 2022, 327, 126885. [Google Scholar]
- JGJ 55; Specification for Mix Proportion Design of Ordinary Concrete. Ministry of Housing and Urban-Rural Construction of the People’s Republic of China: Beijing, China, 2011.
- ASTM C33/33M; Standard Specification for Concrete Aggregates. American Society of Testing and Materials Standards: West Conshohocken, PA, USA, 2013.
- GB/T 50082-2009; Standard for Test Method of Long-Term Performance and Durability of Ordinary Concrete. Ministry of Housing and Urban-Rural Development of PRC: Beijing, China, 2010.
- Powers, T.C. A working hypothesis for further studies of frost resistance of concrete. J. Am. Concr. Inst. 1945, 16, 245–272. [Google Scholar]
- Powers, T.C.; Helmuth, R.A. Theory of Volume Changes in Hardened Portland Cement Paste During Freezing. Highw. Res. Board Proc. 1953, 32, 285–297. [Google Scholar]
- Liu, H.; Liu, Y.; Jiang, Y.; Che, J.; Yang, W. Study on frost resistance of desert sand concrete under freeze-thaw cycle. Ind. Constr. 2023, 53, 616–622. [Google Scholar]
- Li, Y.; Zhang, H.; Chen, S.; Wang, H.; Liu, G. Multi-scale study on the durability degradation mechanism of aeolian sand concrete under freeze-thaw conditions. Constr. Build. Mater. 2022, 340, 127433. [Google Scholar] [CrossRef]
- Hamada, H.M.; Abed, F.; Al-Sadoon, Z.A.; Elnassar, Z.; Hassan, A. The use of treated desert sand in sustainable concrete: A mechanical and microstructure study. J. Build. Eng. 2023, 79, 107843. [Google Scholar]
- Li, G.F.; Shen, X.D. A Study of the deterioration law and mechanism of aeolian-sand powder concrete in the coupling environments of freeze-thaw and carbonization. J. Ceram. Soc. Jpn. 2019, 127, 551–563. [Google Scholar] [CrossRef]
- Zhang, G.; Geng, T.; Lu, H.; Wang, M.; Li, X. Damage Model of Desert Sand Fiber Reinforced Concrete under Freeze-Thaw Cycles. Bull. Chin. Ceram. Soc. 2021, 40, 2225–2231. [Google Scholar] [CrossRef]
- Wang, C.; Liu, L.; Cao, F.; Chen, X.; Ni, L.; Zhang, Z. Experimental study on mechanical properties of recycled concrete after freeze-thaw cycles. J. Build. Struct. 2020, 41, 193–202. [Google Scholar]
- Gan, L.; Liu, Y.; Shen, Z.; Chen, G. Damage evolution law of concrete under sulfate attack and freeze-thaw cycle. J. Huazhong Univ. Sci. Technol. (Nat. Sci. Ed.) 2023, 51, 134–141. [Google Scholar]
- Liu, Y. Experimental Study on Mechanical Properties and Durability of Aeolian sand Concrete; Xi’an University of Science and Technology: Xi’an, China, 2020. [Google Scholar]
- GB/T50476-2019; Standard for Design of Concrete Structure Durability. China Architecture & Building Press: Beijing, China, 2019.
- Li, J.; Peng, X.; Deng, Z.; Cao, J.; Guan, Y.; Lin, L.; Tian, J.; Li, F.; Wang, A.; Wang, Z.; et al. Quantitative Design on the Frost-resistance of Concrete. Concrete 2000, 12, 61–65. [Google Scholar]
- Wu, H.; Jin, W.; Yan, Y.; Xia, J. Environmental zonation and life prediction of concrete in frost environments. J. Zhejiang Univ. (Eng. Sci.) 2012, 46, 650–657. [Google Scholar]


| Fine Aggregate Category | Fineness Modulus/ kg·m−3 | Apparent Density/ kg·m−3 | Bulk Density/ kg·m−3 | Mud Content/% | Water Absorption/% |
|---|---|---|---|---|---|
| Dune sand | 0.198 | 2630 | 1615 | 1.9 | 2.1 |
| River sand | 2.58 | 2038 | 1350 | 2.2 | 0.8 |
| Specimens | Water–Binder Ratio | Sand Rate | Material Consumption/kg·m−3 | |||||
|---|---|---|---|---|---|---|---|---|
| Water | Cement | Water Reducer | Coarse Aggregates | River Sand | Dune Sand | |||
| NC | 0.4 | 0.3 | 160 | 400 | 1.6 | 1288 | 552.0 | 0 |
| DSC-20 | 0.4 | 0.3 | 160 | 400 | 1.6 | 1288 | 441.6 | 110.4 |
| DSC-40 | 0.4 | 0.3 | 160 | 400 | 1.6 | 1288 | 331.2 | 220.8 |
| DSC-60 | 0.4 | 0.3 | 160 | 400 | 1.6 | 1288 | 220.8 | 331.2 |
| Specimen Number | Desert Sand Substitution Rate | Specimen Size | Number of Freeze–Thaw Cycles n | Number of Test Blocks | ||
|---|---|---|---|---|---|---|
| Length/ mm | Height/ mm | Width/ mm | ||||
| NC-1 | 0 | 100 | 100 | 100 | 0, 50, 100, 150, 200 | 30 |
| NC-2 | 100 | 100 | 400 | 3 | ||
| NC-3 | 100 | 100 | 300 | 0, 50, 100, 150 | 12 | |
| DSC-20-1 | 20 | 100 | 100 | 100 | 0, 50, 100, 150, 200 | 30 |
| DSC-20-2 | 100 | 100 | 400 | 3 | ||
| DSC-20-3 | 100 | 100 | 300 | 0, 50, 100, 150 | 12 | |
| DSC-40-1 | 40 | 100 | 100 | 100 | 0, 50, 100, 150, 200 | 30 |
| DSC-40-2 | 100 | 100 | 400 | 3 | ||
| DSC-40-3 | 100 | 100 | 300 | 0, 50, 100, 150 | 12 | |
| DSC-60-1 | 60 | 100 | 100 | 100 | 0, 50, 100, 150, 200 | 30 |
| DSC-60-2 | 100 | 100 | 400 | 3 | ||
| DSC-60-3 | 100 | 100 | 300 | 0, 50, 100, 150 | 12 | |
| No. | Test Project | 0 | 25 | 50 | 75 | 100 | 125 | 150 | 175 | 200 |
|---|---|---|---|---|---|---|---|---|---|---|
| NC | ΔWn (%) | 0 | 0.31 | 0.67 | 1.29 | 2.01 | 2.89 | 3.57 | 4.3 | 5.37 |
| ΔEn (%) | 100 | 96.71 | 91.61 | 83.75 | 79.12 | 73.28 | 69.65 | 64.8 | 58.68 | |
| Δfc1 (%) | 0 | - | 8.40 | - | 26.14 | - | 52.99 | - | 80.87 | |
| Δft (%) | 0 | - | 8.68 | - | 27.27 | - | 58.26 | - | 86.78 | |
| Δfc2 (%) | 0 | - | 5.55 | - | 14.12 | - | 26.92 | - | 39.33 | |
| DSC-20 | ΔWn (%) | 0 | 0.22 | 0.76 | 1.24 | 2.26 | 3.13 | 3.86 | 4.68 | 5.76 |
| ΔEn (%) | 100 | 96.93 | 89.58 | 83.58 | 76.3 | 70.59 | 65.38 | 61.36 | 54.86 | |
| Δfc1 (%) | 0 | - | 10.43 | - | 30.13 | - | 57.83 | - | 84.45 | |
| Δft (%) | 0 | - | 10.57 | - | 31.28 | - | 62.56 | - | 89.43 | |
| Δfc2 (%) | 0 | - | 7.29 | - | 15.81 | - | 28.62 | - | 41.43 | |
| DSC-40 | ΔWn (%) | 0 | 0.1 | 0.21 | 0.42 | 0.69 | 1.07 | 1.43 | 1.88 | 2.72 |
| ΔEn (%) | 100 | 97.58 | 95.68 | 92.49 | 88.56 | 85.62 | 81.8 | 78.38 | 74.37 | |
| Δfc1 (%) | 0 | - | 4.33 | - | 13.35 | - | 29.13 | - | 53.67 | |
| Δft (%) | 0 | - | 5.58 | - | 16.73 | - | 39.84 | - | 74.50 | |
| Δfc2 (%) | 0 | - | 2.72 | - | 10.88 | - | 23.47 | - | 35.65 | |
| DSC-60 | ΔWn (%) | 0 | 0.22 | 0.36 | 0.46 | 0.83 | 1.17 | 1.54 | 2.12 | 3.05 |
| ΔEn (%) | 100 | 96.73 | 94.68 | 90.59 | 87.23 | 82.9 | 79.86 | 75.83 | 72.41 | |
| Δfc1 (%) | 0 | - | 5.33 | - | 15.51 | - | 32.53 | - | 57.20 | |
| Δft (%) | 0 | - | 4.91 | - | 16.23 | - | 40 | - | 73.96 | |
| Δfc2 (%) | 0 | - | 3.95 | - | 13.08 | - | 25.39 | - | 37.14 |
| Specimen Number | A | B | C | Correlation Coefficient |
|---|---|---|---|---|
| NC-2 | −2.019 × 10⁻⁷ | 2.18 × 10⁻³ | −1.052 × 10⁻² | 0.9915 |
| DSC-20-2 | 9.638 × 10⁻⁷ | 2.28 × 10⁻³ | 1.088 × 10⁻² | 0.9947 |
| DSC-40-2 | 2.606 × 10⁻⁶ | 8.326 × 10⁻⁴ | −3.714 × 10⁻⁴ | 0.9978 |
| DSC-60-2 | 1.674 × 10⁻⁶ | 1.11 × 10⁻³ | 3.571 × 10⁻⁵ | 0.9969 |
| Specimen Number | a | b | Correlation Coefficient |
|---|---|---|---|
| NC-3 | 9.937 × 10⁻⁵ | 1.712 | 0.9981 |
| DSC-20-3 | 2.071 × 10⁻⁴ | 1.583 | 0.9998 |
| DSC-40-3 | 2.810 × 10⁻⁵ | 1.845 | 0.9987 |
| DSC-60-3 | 5.181 × 10⁻⁵ | 1.744 | 0.9986 |
| Specimen Number | NC | DSC-20 | DSC-40 | DSC-60 |
|---|---|---|---|---|
| Ultimate number Of F-T cycles | 192 | 160 | 264 | 259 |
| Region | Area | Average Annual Number of Freeze–Thaw Cycles | NC | DSC- 20 | DSC- 40 | DSC- 60 |
|---|---|---|---|---|---|---|
| Northwestern China | Urumqi | 107 | 21.5 | 17.9 | 29.6 | 29.0 |
| Xining | 117 | 19.7 | 16.4 | 27.1 | 26.6 | |
| Lanzhou | 93 | 24.8 | 20.6 | 34.1 | 33.4 | |
| Hohhot | 120 | 19.2 | 16.0 | 26.4 | 25.9 | |
| Yinchuan | 106 | 21.7 | 18.1 | 29.9 | 29.3 | |
| Northern China | Shijiazhuang | 73 | 31.6 | 26.3 | 43.4 | 42.6 |
| Taiyuan | 100 | 23.0 | 19.2 | 31.7 | 31.1 | |
| Beijing | 84 | 27.4 | 22.9 | 37.7 | 37.0 | |
| Tianjin | 77 | 29.9 | 24.9 | 41.1 | 40.4 | |
| Northeast China | Mudanjiang | 128 | 18.0 | 15.0 | 24.8 | 24.3 |
| Changchun | 118 | 19.5 | 16.3 | 26.8 | 26.3 | |
| Harbin | 125 | 18.4 | 15.4 | 25.3 | 24.9 | |
| Yanji | 127 | 18.1 | 15.1 | 24.9 | 24.5 | |
| Shenyang | 105 | 21.9 | 18.3 | 30.2 | 29.6 | |
| Dalian | 73 | 31.6 | 26.3 | 43.4 | 42.6 |
| Specimen Number | NC | DSC-20 | DSC-40 | DSC-60 |
|---|---|---|---|---|
| strength loss rate/% | 19.41 | 36.13 | 17.48 | 16.21 |
Disclaimer/Publisher’s Note: The statements, opinions and data contained in all publications are solely those of the individual author(s) and contributor(s) and not of MDPI and/or the editor(s). MDPI and/or the editor(s) disclaim responsibility for any injury to people or property resulting from any ideas, methods, instructions or products referred to in the content. |
© 2025 by the authors. Licensee MDPI, Basel, Switzerland. This article is an open access article distributed under the terms and conditions of the Creative Commons Attribution (CC BY) license (https://creativecommons.org/licenses/by/4.0/).
Share and Cite
Xi, W.; Li, Z.; Zhou, Y.; Li, G.; Ji, F. Experimental Study on Mechanical Properties of Desert Sand Concrete Under Freeze–Thaw Cycles. Materials 2025, 18, 1546. https://doi.org/10.3390/ma18071546
Xi W, Li Z, Zhou Y, Li G, Ji F. Experimental Study on Mechanical Properties of Desert Sand Concrete Under Freeze–Thaw Cycles. Materials. 2025; 18(7):1546. https://doi.org/10.3390/ma18071546
Chicago/Turabian StyleXi, Wenjie, Zhiqiang Li, Yang Zhou, Gang Li, and Feng Ji. 2025. "Experimental Study on Mechanical Properties of Desert Sand Concrete Under Freeze–Thaw Cycles" Materials 18, no. 7: 1546. https://doi.org/10.3390/ma18071546
APA StyleXi, W., Li, Z., Zhou, Y., Li, G., & Ji, F. (2025). Experimental Study on Mechanical Properties of Desert Sand Concrete Under Freeze–Thaw Cycles. Materials, 18(7), 1546. https://doi.org/10.3390/ma18071546