
Low-Cost Chestnut-Based Biocarbons Physically Activated via CO2 or Steam: Evaluation of the Structural and Adsorption Properties


Highlights
- Biomass is a potential sustainable precursor for activated biocarbon production.
- Physical activation is applied in the surface and porosity development process.
- Process parameters and activation factors affect the properties of activated biocarbons.
- Multiple applications in environmental cleaning and protection are reviewed.
- Future perspectives on activated biocarbon applications are highlighted.
Abstract

1. Introduction
2. Materials and Methods
2.1. Biocarbons Preparation
2.2. Methods
3. Results and Discussion
4. Conclusions
Author Contributions
Funding
Institutional Review Board Statement
Informed Consent Statement
Data Availability Statement
Conflicts of Interest
References
- Pallarés, J.; González-Cencerrado, A.; Arauzo, I. Production and Characterization of Activated Carbon from Barley Straw by Physical Activation with Carbon Dioxide and Steam. Biomass Bioenergy 2018, 115, 64–73. [Google Scholar] [CrossRef]
- Yahya, M.A.; Al-Qodah, Z.; Ngah, C.W.Z. Agricultural Bio-Waste Materials as Potential Sustainable Precursors Used for Activated Carbon Production: A Review. Renew. Sustain. Energy Rev. 2015, 46, 218–235. [Google Scholar] [CrossRef]
- Dsikowitzky, L.; Schwarzbauer, J. Industrial Organic Contaminants: Identification, Toxicity and Fate in the Environment. Environ. Chem. Lett. 2014, 12, 371–386. [Google Scholar] [CrossRef]
- Tkaczyk, A.; Mitrowska, K.; Posyniak, A. Synthetic Organic Dyes as Contaminants of the Aquatic Environment and Their Implications for Ecosystems: A Review. Sci. Total Environ. 2020, 717, 137222. [Google Scholar] [CrossRef]
- Wilkinson, J.L.; Boxall, A.B.A.; Kolpin, D.W.; Leung, K.M.Y.; Lai, R.W.S.; Galbán-Malagón, C.; Adell, A.D.; Mondon, J.; Metian, M.; Marchant, R.A.; et al. Pharmaceutical Pollution of the World’s Rivers. Proc. Natl. Acad. Sci. USA 2022, 119, e2113947119. [Google Scholar] [CrossRef]
- Ślósarczyk, K.; Jakóbczyk-Karpierz, S.; Różkowski, J.; Witkowski, A.J. Occurrence of Pharmaceuticals and Personal Care Products in the Water Environment of Poland: A Review. Water 2021, 13, 2283. [Google Scholar] [CrossRef]
- Lee, C.S.; Robinson, J.; Chong, M.F. A Review on Application of Flocculants in Wastewater Treatment. Process Saf. Environ. Prot. 2014, 92, 489–508. [Google Scholar] [CrossRef]
- Muruganandam, L.; Saravana Kumar, M.P.; Jena, A.; Gulla, S.; Godhwani, B. Treatment of Waste Water by Coagulation and Flocculation Using Biomaterials. In IOP Conference Series: Materials Science and Engineering; IOP Publishing: Bristol, UK, 2017; Volume 263, p. 032006. [Google Scholar] [CrossRef]
- Deng, Y.; Zhao, R. Advanced Oxidation Processes (AOPs) in Wastewater Treatment. Curr. Pollut. Rep. 2015, 1, 167–176. [Google Scholar] [CrossRef]
- Pandis, P.K.; Kalogirou, C.; Kanellou, E.; Vaitsis, C.; Savvidou, M.G.; Sourkouni, G.; Zorpas, A.A.; Argirusis, C. Key Points of Advanced Oxidation Processes (AOPs) for Wastewater, Organic Pollutants and Pharmaceutical Waste Treatment: A Mini Review. ChemEngineering 2022, 6, 8. [Google Scholar] [CrossRef]
- Oller, I.; Malato, S.; Sánchez-Pérez, J.A. Combination of Advanced Oxidation Processes and Biological Treatments for Wastewater Decontamination—A Review. Sci. Total Environ. 2011, 409, 4141–4166. [Google Scholar] [CrossRef]
- Kathi, S.; El Din Mahmoud, A. Trends in Effective Removal of Emerging Contaminants from Wastewater: A Comprehensive Review. Desalination Water Treat. 2024, 317, 100258. [Google Scholar] [CrossRef]
- Karpińska, J.; Kotowska, U. Removal of Organic Pollution in the Water Environment. Water 2019, 11, 2017. [Google Scholar] [CrossRef]
- Jedynak, K.; Charmas, B. Activated Biocarbons Obtained from Lignocellulosic Precursors as Potential Adsorbents of Ammonia. Physicochem. Probl. Miner. Process. 2023, 59, 169835. [Google Scholar] [CrossRef]
- Singh, N.B.; Nagpal, G.; Agrawal, S. Rachna Water Purification by Using Adsorbents: A Review. Environ. Technol. Innov. 2018, 11, 187–240. [Google Scholar] [CrossRef]
- Ali, I.; Gupta, V.K. Advances in Water Treatment by Adsorption Technology. Nat. Protoc. 2006, 1, 2661–2667. [Google Scholar] [CrossRef]
- Wiśniewska, M.; Nowicki, P.; Gruszczyńska, K.; Urban, T. Activated Biocarbons Obtained from Post-Fermentation Residue as Potential Adsorbents of Organic Pollutants from the Liquid Phase. Physicochem. Probl. Miner. Process. 2022, 58, 146357. [Google Scholar] [CrossRef]
- Amalina, F.; Razak, A.S.A.; Krishnan, S.; Sulaiman, H.; Zularisam, A.W.; Nasrullah, M. Biochar Production Techniques Utilizing Biomass Waste-Derived Materials and Environmental Applications—A Review. J. Hazard. Mater. 2022, 7, 100134. [Google Scholar] [CrossRef]
- Mp, D.; Misra, M.; Mohanty, A.K. Recent Advances on Value-Added Biocarbon Preparation by the Pyrolysis of Renewable and Waste Biomass, Their Structure and Properties: A Move toward an Ecofriendly Alternative to Carbon Black. Environ. Sci. Adv. 2023, 2, 1282–1301. [Google Scholar] [CrossRef]
- Li, S.; Tasnady, D. Biochar for Soil Carbon Sequestration: Current Knowledge, Mechanisms, and Future Perspectives. C 2023, 9, 67. [Google Scholar] [CrossRef]
- Skubiszewska-Zięba, J.; Charmas, B.; Kołtowski, M.; Oleszczuk, P. Active Carbons from Waste Biochars: Structural and Thermal Properties. J. Therm. Anal. Calorim. 2017, 130, 15–24. [Google Scholar] [CrossRef]
- Álvarez-Torrellas, S.; Rodríguez, A.; Ovejero, G.; García, J. Comparative Adsorption Performance of Ibuprofen and Tetracycline from Aqueous Solution by Carbonaceous Materials. Chem. Eng. J. 2016, 283, 936–947. [Google Scholar] [CrossRef]
- Jedynak, K.; Charmas, B. Adsorption Properties of Biochars Obtained by KOH Activation. Adsorption 2024, 30, 167–183. [Google Scholar] [CrossRef]
- Farma, R.; Anakis, R.P.; Apriyani, I. Activated Carbons (AC) Prepared by Direct CO2 Activation of Parsea Americana Seeds Biomass for Supercapacitor Electrodes. In Journal of Physics: Conference Series; IOP Publishing: Bristol, UK, 2021; Volume 2049, p. 012067. [Google Scholar] [CrossRef]
- Sajjadi, B.; Chen, W.-Y.; Egiebor, N.O. A Comprehensive Review on Physical Activation of Biochar for Energy and Environmental Applications. Rev. Chem. Eng. 2019, 35, 735–776. [Google Scholar] [CrossRef]
- Angın, D.; Altintig, E.; Köse, T.E. Influence of Process Parameters on the Surface and Chemical Properties of Activated Carbon Obtained from Biochar by Chemical Activation. Bioresour. Technol. 2013, 148, 542–549. [Google Scholar] [CrossRef]
- Panwar, N.L.; Pawar, A. Influence of Activation Conditions on the Physicochemical Properties of Activated Biochar: A Review. Biomass Convers. Biorefin. 2022, 12, 925–947. [Google Scholar] [CrossRef]
- Wigmans, T. Industrial Aspects of Production and Use of Activated Carbons. Carbon 1989, 27, 13–22. [Google Scholar] [CrossRef]
- Charmas, B.; Zięzio, M.; Jedynak, K. Assessment of the Porous Structure and Surface Chemistry of Activated Biocarbons Used for Methylene Blue Adsorption. Molecules 2023, 28, 4922. [Google Scholar] [CrossRef]
- Molina-Sabio, M.; Gonzalez, M.T.; Rodriguez-Reinoso, F.; Sepúlveda-Escribano, A. Effect of Steam and Carbon Dioxide Activation in the Micropore Size Distribution of Activated Carbon. Carbon 1996, 34, 505–509. [Google Scholar] [CrossRef]
- Chang, C.-F.; Chang, C.-Y.; Tsai, W.-T. Effects of Burn-off and Activation Temperature on Preparation of Activated Carbon from Corn Cob Agrowaste by CO2 and Steam. J. Colloid Interface Sci. 2000, 232, 45–49. [Google Scholar] [CrossRef]
- Walker, P.L. Production of Activated Carbons: Use of CO2 versus H2O as Activating Agent. Carbon 1996, 34, 1297–1299. [Google Scholar] [CrossRef]
- Marsh, H.; Rodríguez-Reinoso, F. Activation Processes (Chemical). In Activated Carbon; Elsevier: Amsterdam, The Netherlands, 2006; pp. 322–365. ISBN 978-0-08-044463-5. [Google Scholar]
- Januszewicz, K.; Cymann-Sachajdak, A.; Kazimierski, P.; Klein, M.; Łuczak, J.; Wilamowska-Zawłocka, M. Chestnut-Derived Activated Carbon as a Prospective Material for Energy Storage. Materials 2020, 13, 4658. [Google Scholar] [CrossRef] [PubMed]
- Durak, H.; Genel, S. Investigation of the Effect of Metal Powder and Metal-Supported MCM-41 Catalysts on the Pyrolysis of Horse Chestnut Fruits and Shells (Aesculus hippocastanum L.). Biomass Conv. Biorefin. 2024, 14, 30789–30800. [Google Scholar] [CrossRef]
- Haul, R.S.J. Gregg, K.S.W. Sing: Adsorption, Surface Area and Porosity. 2. Auflage, Academic Press, London 1982. 303 Seiten. Berichte Bunsenges. Phys. Chem. 1982, 86, 957. [Google Scholar] [CrossRef]
- Gun’ko, V.M. Composite Materials: Textural Characteristics. Appl. Surf. Sci. 2014, 307, 444–454. [Google Scholar] [CrossRef]
- Gun’ko, V.M.; Mikhalovsky, S.V. Evaluation of Slitlike Porosity of Carbon Adsorbents. Carbon 2004, 42, 843–849. [Google Scholar] [CrossRef]
- Boehm, H.P. Surface Oxides on Carbon and Their Analysis: A Critical Assessment. Carbon 2002, 40, 145–149. [Google Scholar] [CrossRef]
- Charmas, B.; Wawrzaszek, B.; Jedynak, K. Effect of Pyrolysis Temperature and Hydrothermal Activation on Structure, Physicochemical, Thermal and Dye Adsorption Characteristics of the Biocarbons. ChemPhysChem 2024, 25, e202300773. [Google Scholar] [CrossRef]
- Goertzen, S.L.; Thériault, K.D.; Oickle, A.M.; Tarasuk, A.C.; Andreas, H.A. Standardization of the Boehm Titration. Part I. CO2 Expulsion and Endpoint Determination. Carbon 2010, 48, 1252–1261. [Google Scholar] [CrossRef]
- Calvelo Pereira, R.; Kaal, J.; Camps Arbestain, M.; Pardo Lorenzo, R.; Aitkenhead, W.; Hedley, M.; Macías, F.; Hindmarsh, J.; Maciá-Agulló, J.A. Contribution to Characterisation of Biochar to Estimate the Labile Fraction of Carbon. Org. Geochem. 2011, 42, 1331–1342. [Google Scholar] [CrossRef]
- Harvey, O.R.; Kuo, L.-J.; Zimmerman, A.R.; Louchouarn, P.; Amonette, J.E.; Herbert, B.E. An Index-Based Approach to Assessing Recalcitrance and Soil Carbon Sequestration Potential of Engineered Black Carbons (Biochars). Environ. Sci. Technol. 2012, 46, 1415–1421. [Google Scholar] [CrossRef]
- Nowicki, P. The Effect of Mineral Matter on the Physicochemical and Sorption Properties of Brown Coal-Based Activated Carbons. Adsorption 2016, 22, 561–569. [Google Scholar] [CrossRef]
- Naima, A.; Ammar, F.; Abdelkader, O.; Rachid, C.; Lynda, H.; Syafiuddin, A.; Boopathy, R. Development of a Novel and Efficient Biochar Produced from Pepper Stem for Effective Ibuprofen Removal. Bioresour. Technol. 2022, 347, 126685. [Google Scholar] [CrossRef] [PubMed]
- Thommes, M.; Kaneko, K.; Neimark, A.V.; Olivier, J.P.; Rodriguez-Reinoso, F.; Rouquerol, J.; Sing, K.S.W. Physisorption of Gases, with Special Reference to the Evaluation of Surface Area and Pore Size Distribution (IUPAC Technical Report). Pure Appl. Chem. 2015, 87, 1051–1069. [Google Scholar] [CrossRef]
- Ferrari, A.C.; Robertson, J. Raman Spectroscopy of Amorphous, Nanostructured, Diamond–like Carbon, and Nanodiamond. Philos. Trans. Math. Phys. Eng. Sci. 2004, 362, 2477–2512. [Google Scholar] [CrossRef]
- Martins Ferreira, E.H.; Moutinho, M.V.O.; Stavale, F.; Lucchese, M.M.; Capaz, R.B.; Achete, C.A.; Jorio, A. Evolution of the Raman Spectra from Single-, Few-, and Many-Layer Graphene with Increasing Disorder. Phys. Rev. B 2010, 82, 125429. [Google Scholar] [CrossRef]
- Li, Z.; Deng, L.; Kinloch, I.A.; Young, R.J. Raman Spectroscopy of Carbon Materials and Their Composites: Graphene, Nanotubes and Fibres. Prog. Mater. Sci. 2023, 135, 101089. [Google Scholar] [CrossRef]
- Gao, N.; Li, J.; Qi, B.; Li, A.; Duan, Y.; Wang, Z. Thermal Analysis and Products Distribution of Dried Sewage Sludge Pyrolysis. J. Anal. Appl. Pyrolysis 2014, 105, 43–48. [Google Scholar] [CrossRef]
- Bagreev, A.; Bandosz, T.J.; Locke, D.C. Pore Structure and Surface Chemistry of Adsorbents Obtained by Pyrolysis of Sewage Sludge-Derived Fertilizer. Carbon 2001, 39, 1971–1979. [Google Scholar] [CrossRef]
- Méndez, A.; Gascó, G.; Freitas, M.M.A.; Siebielec, G.; Stuczynski, T.; Figueiredo, J.L. Preparation of Carbon-Based Adsorbents from Pyrolysis and Air Activation of Sewage Sludges. Chem. Eng. J. 2005, 108, 169–177. [Google Scholar] [CrossRef]
- Bouchelta, C.; Medjram, M.S.; Bertrand, O.; Bellat, J.-P. Preparation and Characterization of Activated Carbon from Date Stones by Physical Activation with Steam. J. Anal. Appl. Pyrolysis 2008, 82, 70–77. [Google Scholar] [CrossRef]
- Jing, F.; Pan, M.; Chen, J. Kinetic and Isothermal Adsorption-Desorption of PAEs on Biochars: Effect of Biomass Feedstock, Pyrolysis Temperature, and Mechanism Implication of Desorption Hysteresis. Environ Sci Pollut Res 2018, 25, 11493–11504. [Google Scholar] [CrossRef] [PubMed]
- Figueiredo, J.L.; Pereira, M.F.R.; Freitas, M.M.A.; Órfão, J.J.M. Modification of the Surface Chemistry of Activated Carbons. Carbon 1999, 37, 1379–1389. [Google Scholar] [CrossRef]
- Yusof, J.; Salleh, A.; Rashid, S.A.; Ismail, I.; Adam, S.N. Characterisation of Carbon Particles (CPs) Derived from Dry Milled Kenaf Biochar. J. Eng. Sci. Technol. 2014, 10, 125–131. [Google Scholar]
- National Library of Medicine. Available online: https://pubchem.ncbi.nlm.nih.gov (accessed on 1 March 2025).
- Caminati, G.; Puggelli, M. Europium in Phospholipid Nanoscaffolds for the Photophysical Detection of Antibiotic Traces in Solution. In Europium: Compounds, Production and Applications; Nova Science Publishers Inc.: New York, NY, USA, 2011; pp. 203–228. ISBN 978-1-61668-993-3. [Google Scholar]
- Oueslati, W. Effect of Soil Solution pH during the Tetracycline Intercalation on the Structural Properties of a Dioctahedral Smectite: Microstructural Analysis. J. Nanomater. 2019, 2019, 7414039. [Google Scholar] [CrossRef]
- Tomul, F.; Arslan, Y.; Kabak, B.; Trak, D.; Kendüzler, E.; Lima, E.C.; Tran, H.N. Peanut Shells-Derived Biochars Prepared from Different Carbonization Processes: Comparison of Characterization and Mechanism of Naproxen Adsorption in Water. Sci. Total Environ. 2020, 726, 137828. [Google Scholar] [CrossRef]
- Pap, S.; Taggart, M.A.; Shearer, L.; Li, Y.; Radovic, S.; Turk Sekulic, M. Removal Behaviour of NSAIDs from Wastewater Using a P-Functionalised Microporous Carbon. Chemosphere 2021, 264, 128439. [Google Scholar] [CrossRef]
- Chaukura, N.; Murimba, E.C.; Gwenzi, W. Synthesis, Characterisation and Methyl Orange Adsorption Capacity of Ferric Oxide–Biochar Nano-Composites Derived from Pulp and Paper Sludge. Appl. Water Sci. 2017, 7, 2175–2186. [Google Scholar] [CrossRef]
- Diaz-Uribe, C.; Ortiz, J.; Duran, F.; Vallejo, W.; Fals, J. Methyl Orange Adsorption on Biochar Obtained from Prosopis Juliflora Waste: Thermodynamic and Kinetic Study. ChemEngineering 2023, 7, 114. [Google Scholar] [CrossRef]
- Marzbali, M.H.; Esmaieli, M.; Abolghasemi, H.; Marzbali, M.H. Tetracycline Adsorption by H3PO4-Activated Carbon Produced from Apricot Nut Shells: A Batch Study. Process Saf. Environ. Prot. 2016, 102, 700–709. [Google Scholar] [CrossRef]
- Yazidi, A.; Atrous, M.; Edi Soetaredjo, F.; Sellaoui, L.; Ismadji, S.; Erto, A.; Bonilla-Petriciolet, A.; Luiz Dotto, G.; Ben Lamine, A. Adsorption of Amoxicillin and Tetracycline on Activated Carbon Prepared from Durian Shell in Single and Binary Systems: Experimental Study and Modeling Analysis. Chem. Eng. J. 2020, 379, 122320. [Google Scholar] [CrossRef]
- Czech, B.; Kończak, M.; Rakowska, M.; Oleszczuk, P. Engineered Biochars from Organic Wastes for the Adsorption of Diclofenac, Naproxen and Triclosan from Water Systems. J. Clean. Prod. 2021, 288, 125686. [Google Scholar] [CrossRef]
- Tcheka, C.; Conradie, M.M.; Assinale, V.A.; Conradie, J. Mesoporous Biochar Derived from Egyptian Doum Palm (Hyphaene thebaica) Shells as Low-Cost and Biodegradable Adsorbent for the Removal of Methyl Orange Dye: Characterization, Kinetic and Adsorption Mechanism. Chem. Phys. Impact 2024, 8, 100446. [Google Scholar] [CrossRef]
- Li, H.; Sun, Z.; Zhang, L.; Tian, Y.; Cui, G.; Yan, S. A Cost-Effective Porous Carbon Derived from Pomelo Peel for the Removal of Methyl Orange from Aqueous Solution. Colloids Surf. A Physicochem. Eng. Asp. 2016, 489, 191–199. [Google Scholar] [CrossRef]
- Zhang, P.; Li, Y.; Cao, Y.; Han, L. Characteristics of Tetracycline Adsorption by Cow Manure Biochar Prepared at Different Pyrolysis Temperatures. Bioresour. Technol. 2019, 285, 121348. [Google Scholar] [CrossRef]
- Jang, H.M.; Yoo, S.; Choi, Y.-K.; Park, S.; Kan, E. Adsorption Isotherm, Kinetic Modeling and Mechanism of Tetracycline on Pinus Taeda-Derived Activated Biochar. Bioresour. Technol. 2018, 259, 24–31. [Google Scholar] [CrossRef]
- Sağlam, S.; Türk, F.N.; Arslanoğlu, H. Tetracycline (TC) Removal from Wastewater with Activated Carbon (AC) Obtained from Waste Grape Marc: Activated Carbon Characterization and Adsorption Mechanism. Environ. Sci. Pollut. Res. 2024, 31, 33904–33923. [Google Scholar] [CrossRef]
- Pham, T.D.; Nguyen, D.T.; Nguyen, H.L.; Nguyen, M.Q.; Tran, T.M.; Nguyen, M.V.; Nguyen, T.L.; Ngo, T.M.V.; Namakamura, K.; Tsubota, T. Adsorption Characteristics of Ciprofloxacin and Naproxen from Aqueous Solution Using Bamboo Biochar. Biomass Conv. Biorefin. 2025, 15, 3071–3082. [Google Scholar] [CrossRef]
- Jung, C.; Boateng, L.K.; Flora, J.R.V.; Oh, J.; Braswell, M.C.; Son, A.; Yoon, Y. Competitive Adsorption of Selected Non-Steroidal Anti-Inflammatory Drugs on Activated Biochars: Experimental and Molecular Modeling Study. Chem. Eng. J. 2015, 264, 1–9. [Google Scholar] [CrossRef]
- Şensoy, R.; Kabak, B.; Kendüzler, E. Kinetic and Isothermal Studies of Naproxen Adsorption from Aqueous Solutions Using Walnut Shell Biochar. React. Kinet. Mech. Catal. 2024, 137, 1031–1049. [Google Scholar] [CrossRef]
- Lee, H.; Fiore, S.; Berruti, F. Adsorption of Methyl Orange and Methylene Blue on Activated Biocarbon Derived from Birchwood Pellets. Biomass Bioenergy 2024, 191, 107446. [Google Scholar] [CrossRef]
- Yu, J.; Zhang, X.; Wang, D.; Li, P. Adsorption of Methyl Orange Dye onto Biochar Adsorbent Prepared from Chicken Manure. Water Sci. Technol. 2018, 77, 1303–1312. [Google Scholar] [CrossRef]
- Lu, Y.; Chen, J.; Bai, Y.; Gao, J.; Peng, M. Adsorption Properties of Methyl Orange in Waterby Sheep Manure Biochar. Pol. J. Environ. Stud. 2019, 28, 3791–3797. [Google Scholar] [CrossRef]


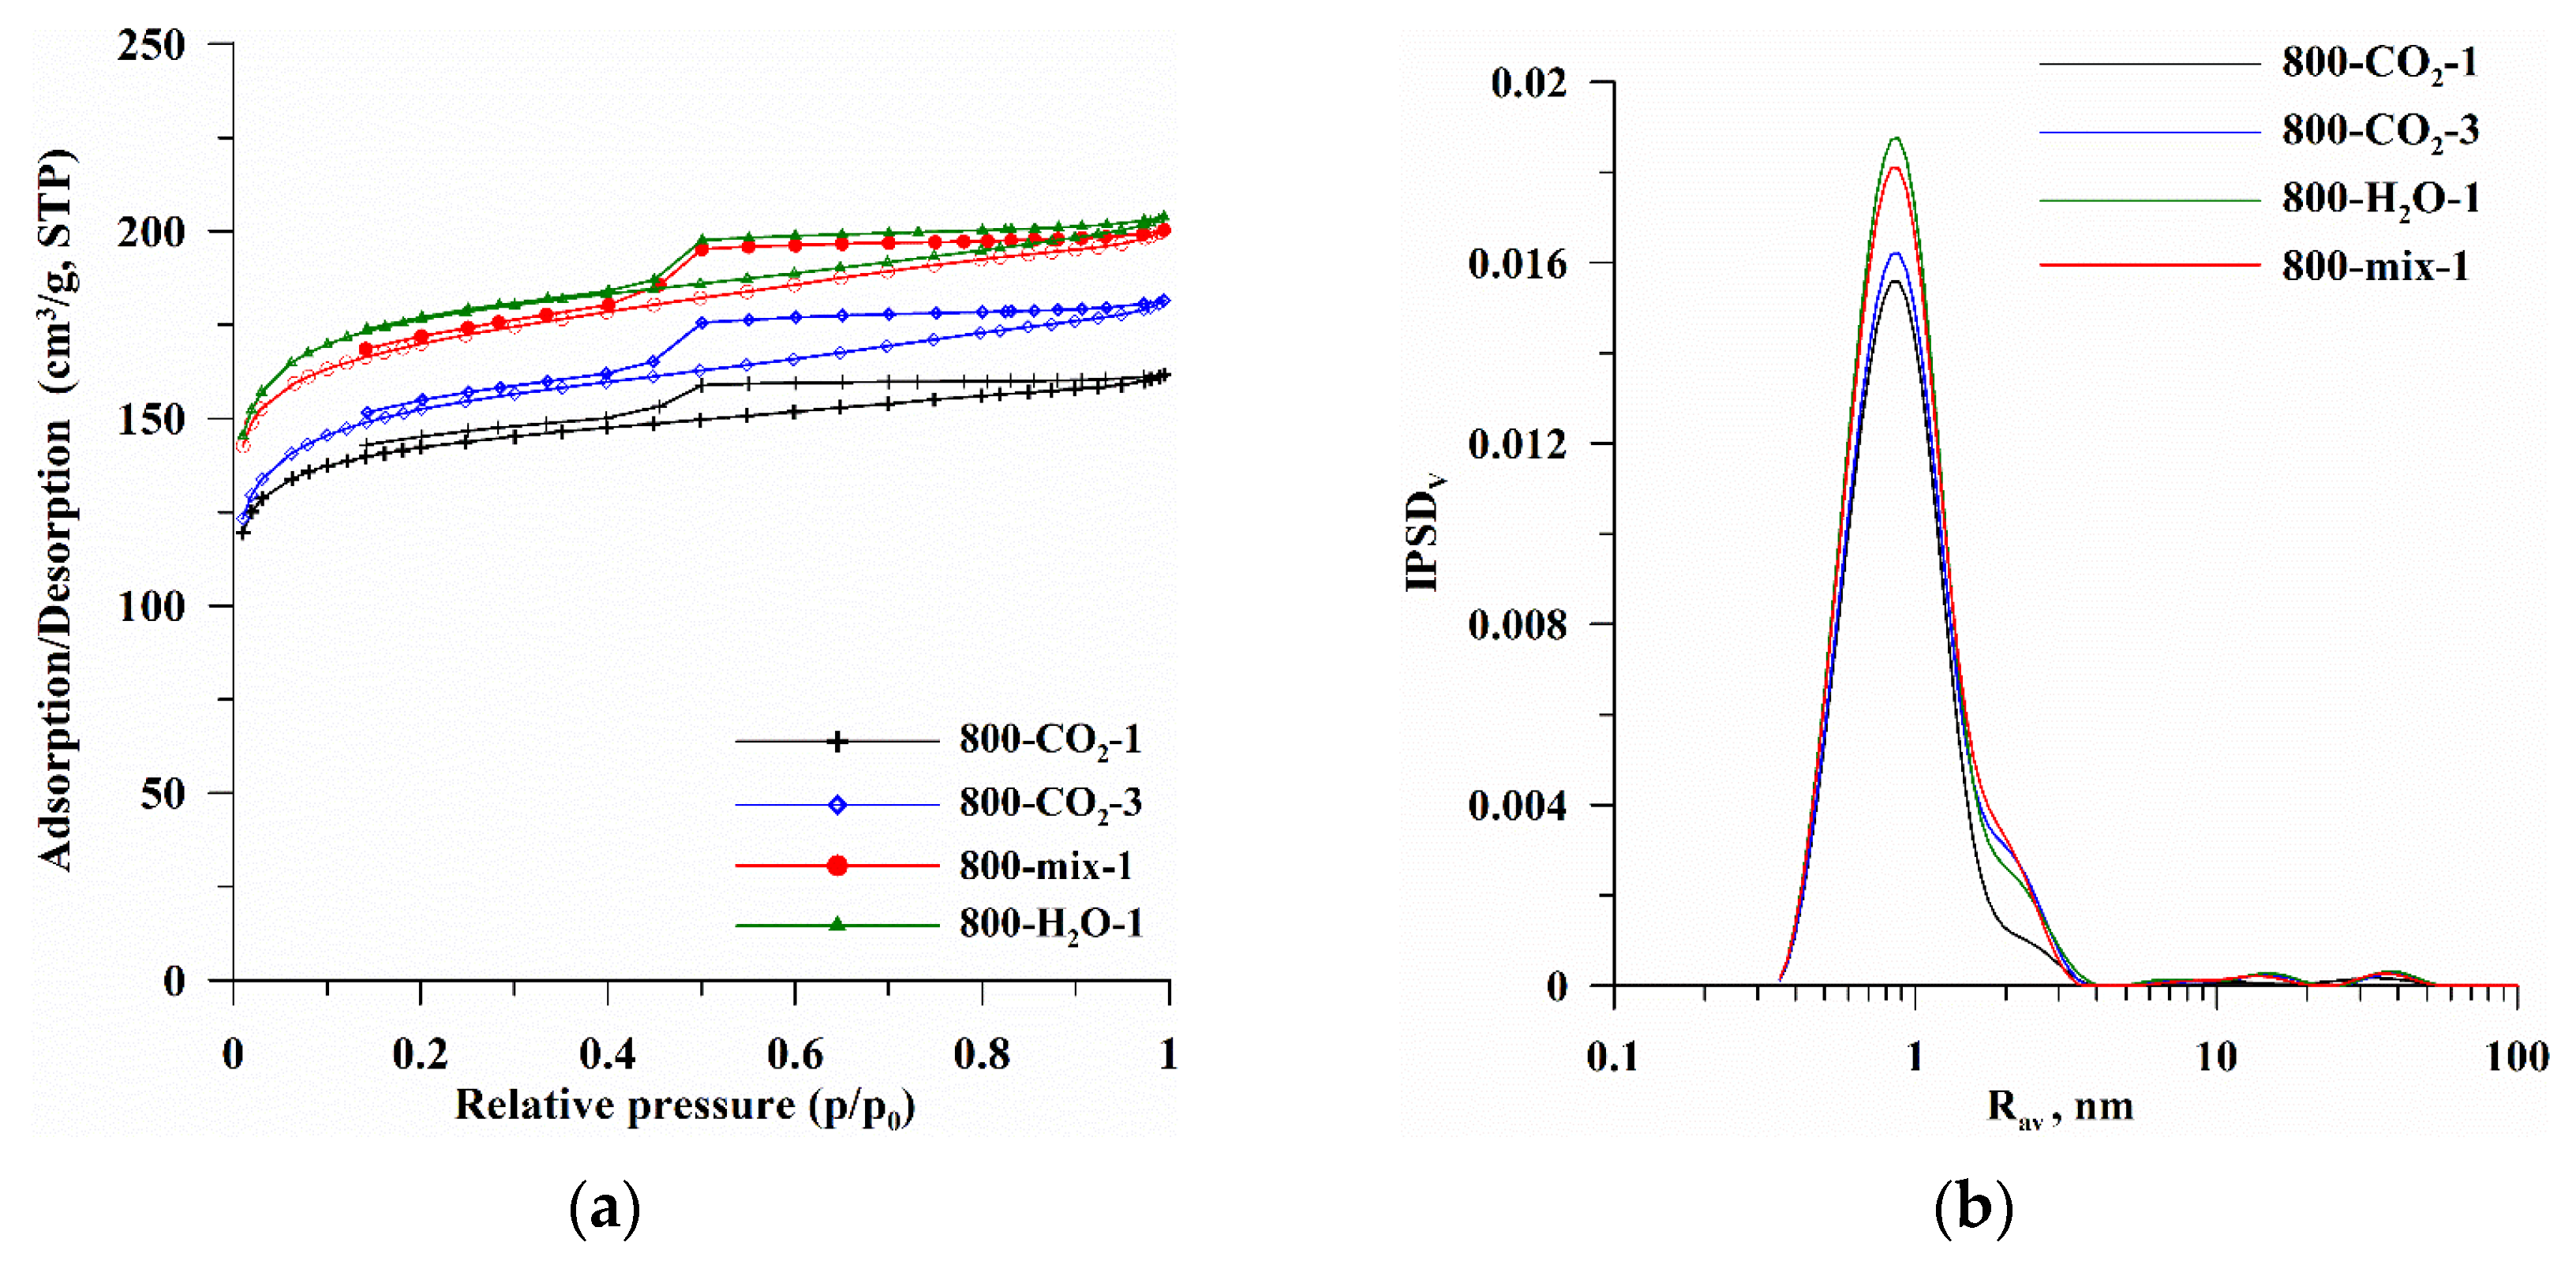
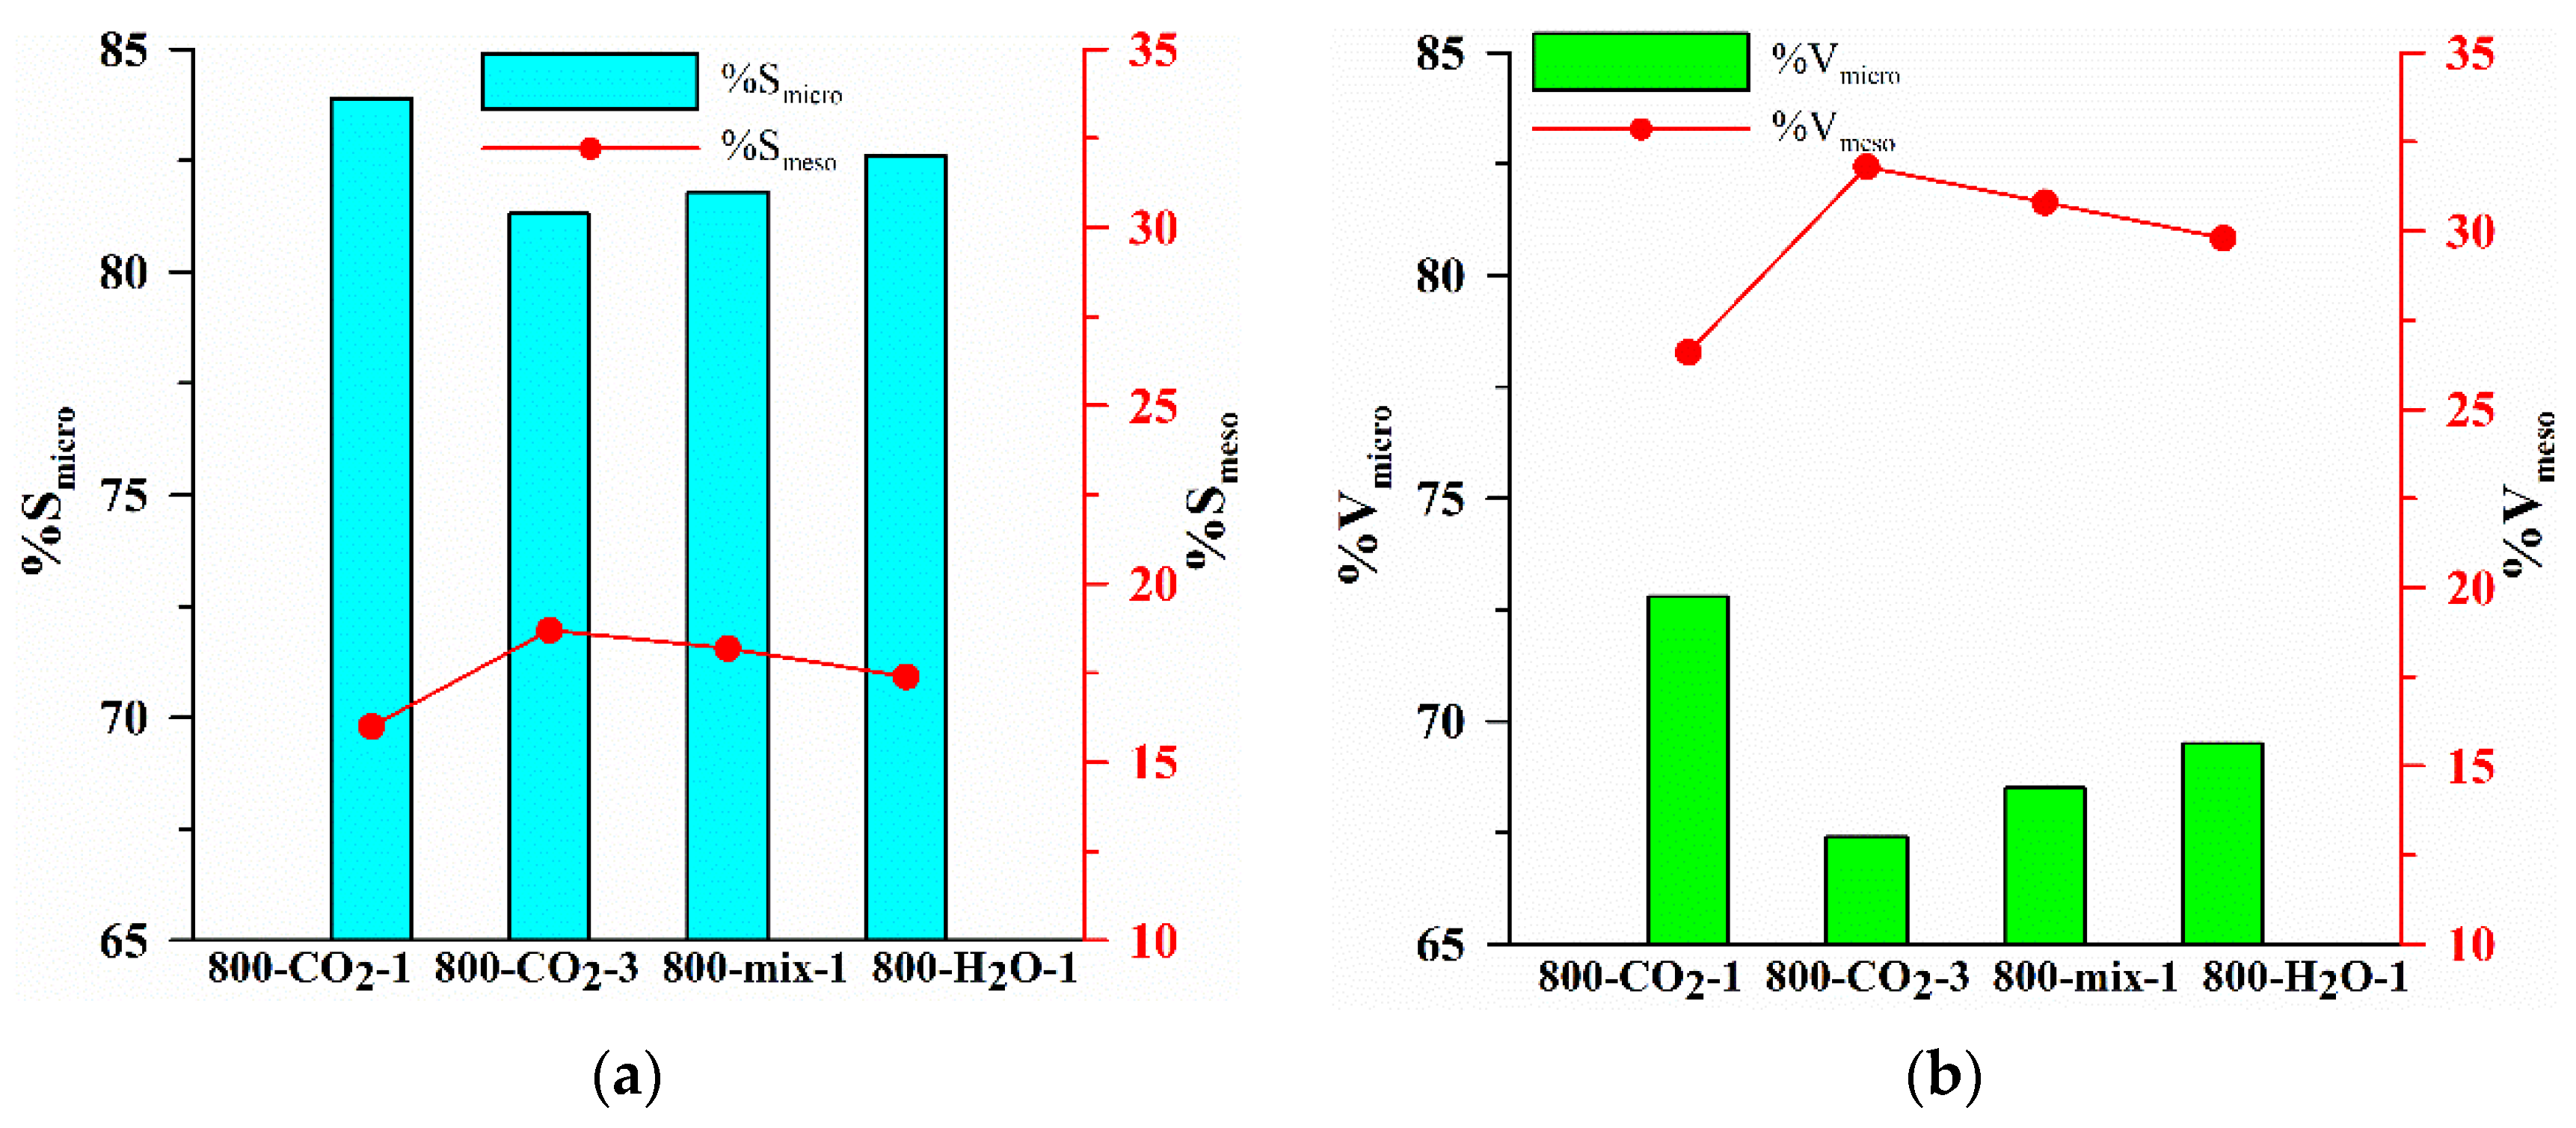
| Biocarbon | SBET [m2/g] | Smicro [m2/g] | Smeso [m2/g] | Vtotal [cm3/g] | Rdom [nm] | Rav [nm] |
|---|---|---|---|---|---|---|
| 800-CO2-1 | 534.6 | 448.7 | 85.8 | 0.0042 | 0.94 | 1.2 |
| 800-CO2-3 | 569.5 | 463.0 | 106.4 | 0.0054 | 0.99 | 1.3 |
| 800-mix-1 | 644.0 | 526.7 | 117.2 | 0.0039 | 0.96 | 1.3 |
| 800-H2O-1 | 663.1 | 547.5 | 115.6 | 0.1134 | 0.95 | 1.3 |
| Biocarbon | Vp [cm3/g] | Vmicro [cm3/g] | Vmeso [cm3/g] | ρ [g/cm3] | w | PY [%] |
| 800-CO2-1 | 0.251 | 0.182 | 0.067 | 0.0029 | 0.31 | 18.5 |
| 800-CO2-3 | 0.280 | 0.189 | 0.089 | 0.0137 | 0.25 | 8.7 |
| 800-mix-1 | 0.310 | 0.212 | 0.096 | 0.0051 | 0.29 | 20.2 |
| 800-H2O-1 | 0.315 | 0.219 | 0.094 | 0.0123 | 0.25 | 9.6 |
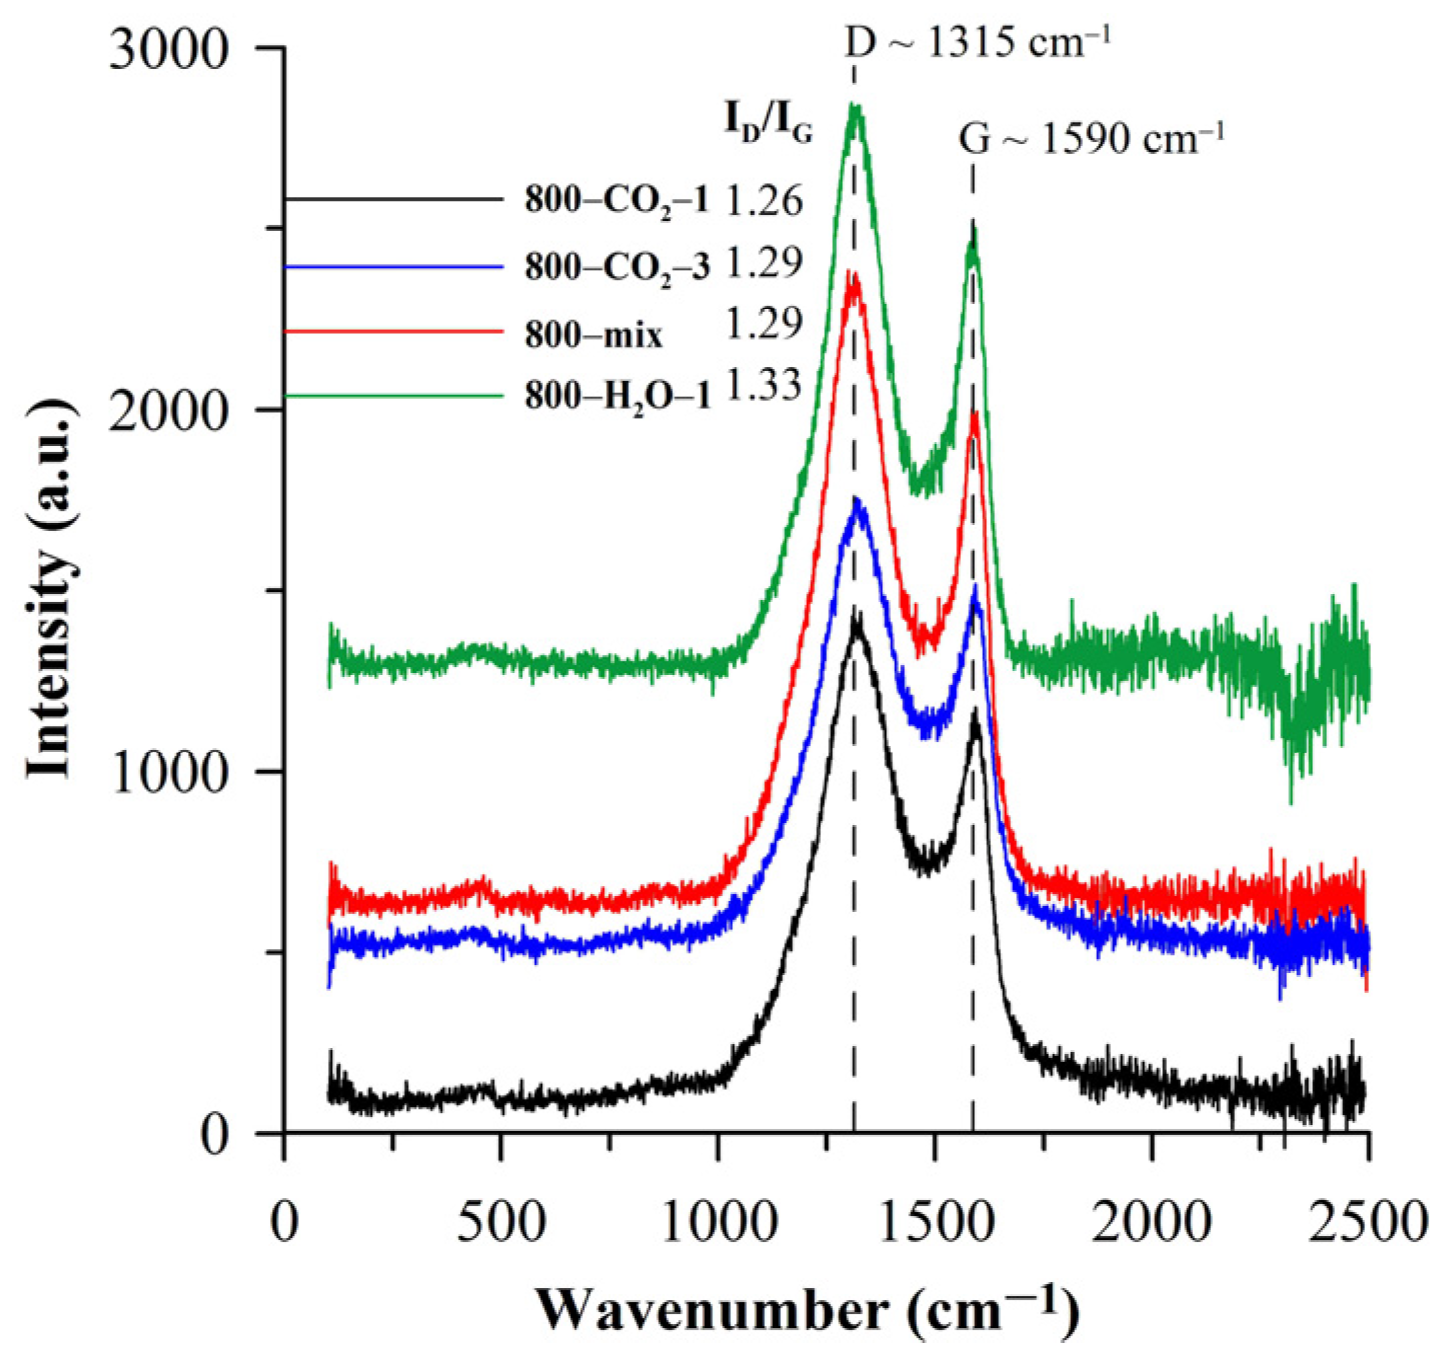
| TG | DTAmax | %A | %VC | %FC | Cthermo | T50 | R50 |
|---|---|---|---|---|---|---|---|
| INI | 330; 473 | 1.93 | 75.9 | 22.1 | 0.226 | 343 | 0.387 |
| 800-CO2-1 | 374; 830 | 5.86 | 25.9 | 68.2 | 0.724 | 530 | 0.599 |
| 800-CO2-3 | 370; 660 | 23.5 | 23.9 | 52.6 | 0.687 | 484 | 0.546 |
| 800-mix-1 | 376; 820 | 3.54 | 17.0 | 79.4 | 0.823 | 543 | 0.612 |
| 800-H2O-1 | 334; 700 | 18.33 | 19.2 | 62.4 | 0.765 | 487 | 0.550 |
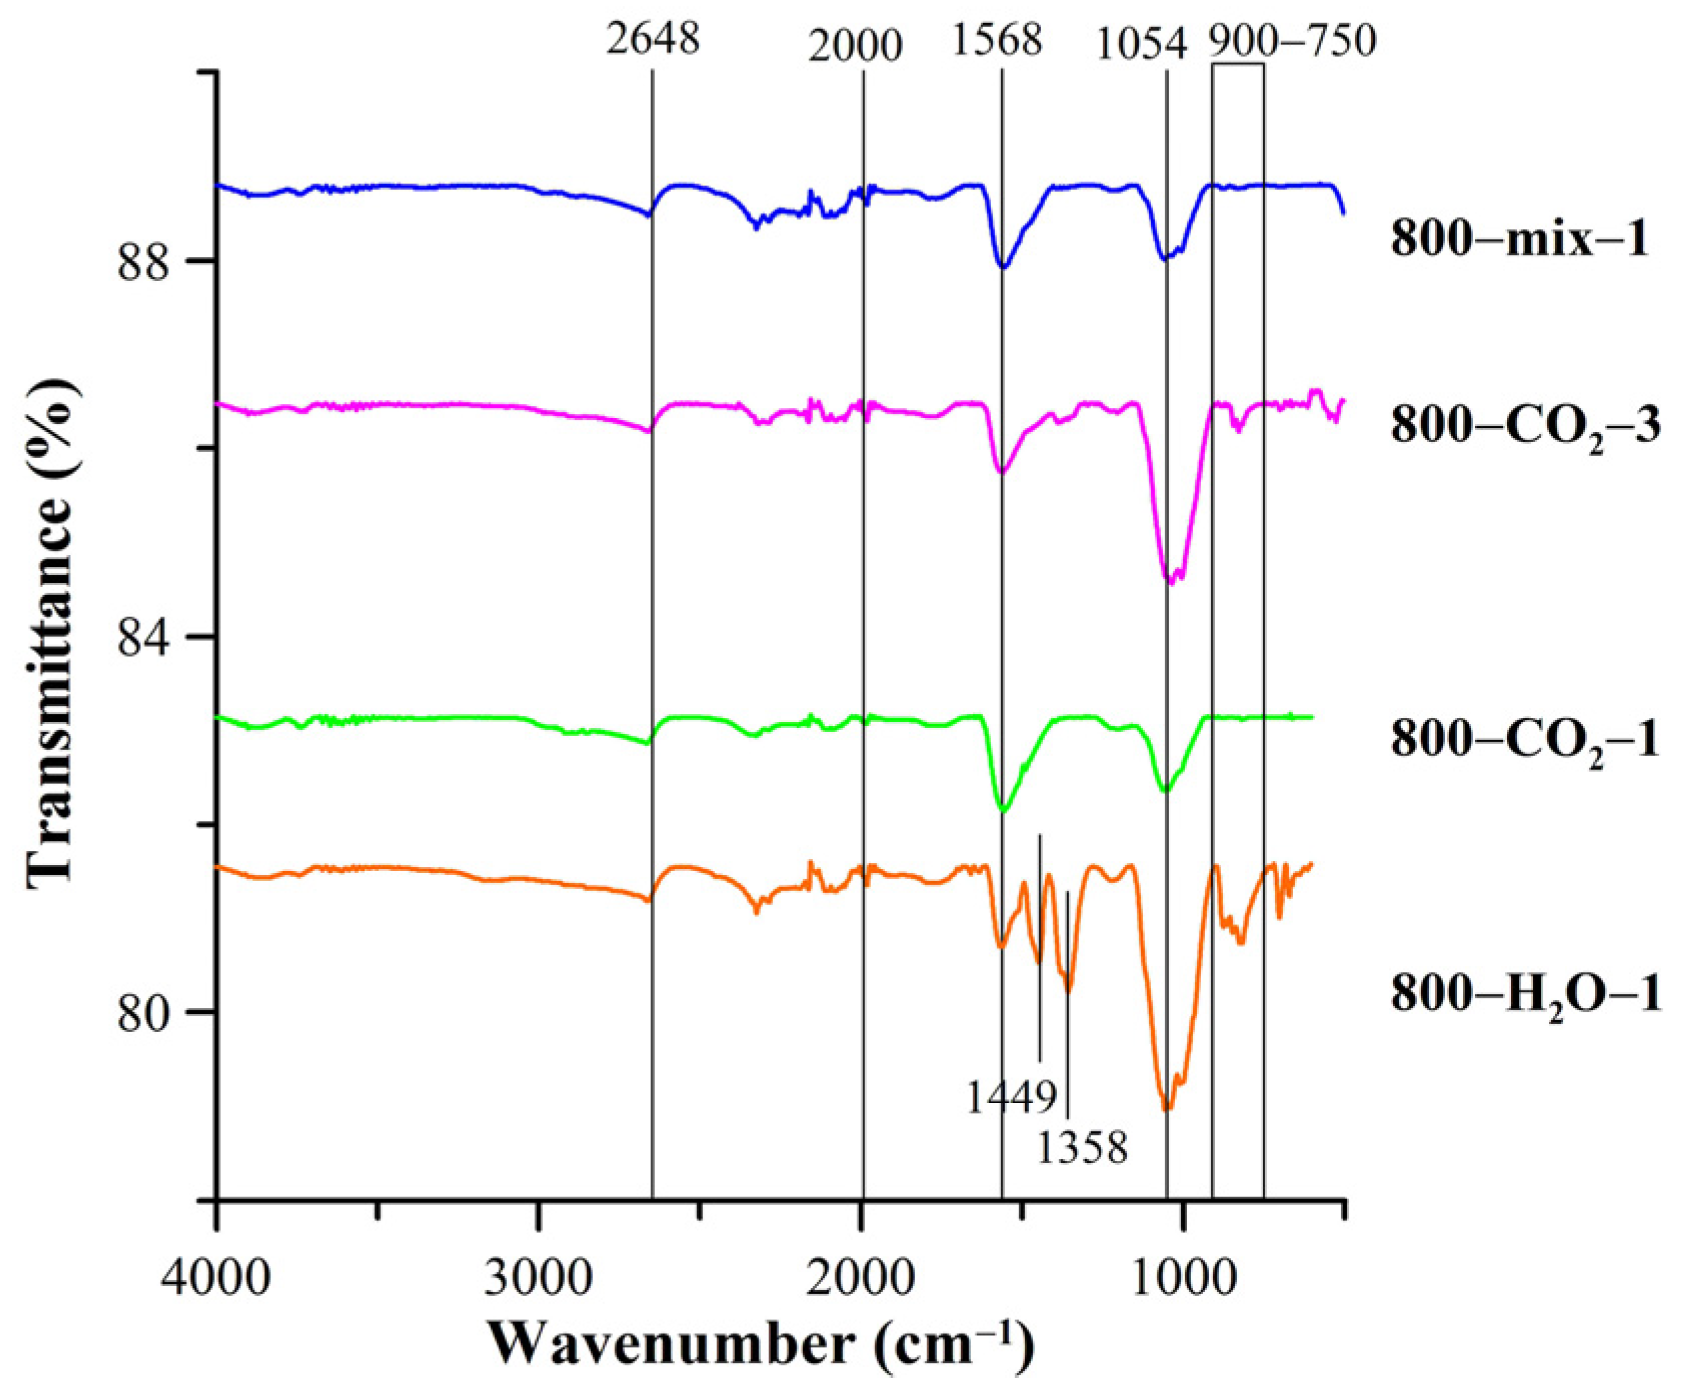
| Biocarbon | Acidic Groups [mmol/g] | Basic Groups [mmol/g] | pH |
|---|---|---|---|
| 800-CO2-1 | 0.0202 | 0.0116 | 0.0208 |
| 800-CO2-3 | 0.0059 | 0.0060 | 0.0265 |
| 800-mix-1 | 0.0041 | 0.0083 | 0.0513 |
| 800-H2O-1 | 0.0028 | 0.0406 | 0.0153 |
| Name | Structure | Molecular Weight [g/mol] | Molecular Formula | Topological Polar Surface Area, nm2 |
|---|---|---|---|---|
| Tetracycline hydrochloride (TC) | 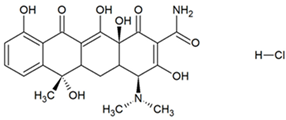 | 480.9 | C22H25ClN2O8 | 1.82 |
| Sodium naproxen (NPX) |  | 252.2 | C14H13NaO3 | 0.494 |
| Methyl orange (MO) |  | 327.3 | C14H14N3NaO3S | 0.935 |
| Biocarbon | TC Adsorption mg/g | NPX Adsorption mg/g | MO Adsorption mg/g | ||
|---|---|---|---|---|---|
| C0 = 50 mg/L | C0 = 300 mg/L | C0 = 50 mg/L | C0 = 300 mg/L | C0 = 700 mg/L | |
| 800-CO2-1 | 0.0479 | 1.8811 | 0.4493 | 2.9525 | 2.0878 |
| 800-CO2-3 | 1.7532 | 0.0939 | 0.0809 | 0.7860 | 8.9964 |
| 800-mix-1 | 0.1679 | 1.2068 | 0.3742 | 0.2519 | 6.5172 |
| 800-H2O-1 | 0.0672 | 1.3557 | 0.1611 | 2.0165 | 1.5711 |
| Biocarbon | TC %R | NPX %R | MO %R | ||
|---|---|---|---|---|---|
| C0 = 50 mg/L | C0 = 300 mg/L | C0 = 50 mg/L | C0 = 300 mg/L | C0 = 700 mg/L | |
| 800-CO2-1 | 1.0236 | 0.7880 | 1.7534 | 0.1096 | 0.6334 |
| 800-CO2-3 | 0.3697 | 0.0651 | 0.3187 | 0.3889 | 2.9222 |
| 800-mix-1 | 1.1794 | 0.7971 | 1.6370 | 0.6321 | 1.9633 |
| 800-H2O-1 | 0.4488 | 1.1856 | 0.0868 | 0.5389 | 0.3443 |
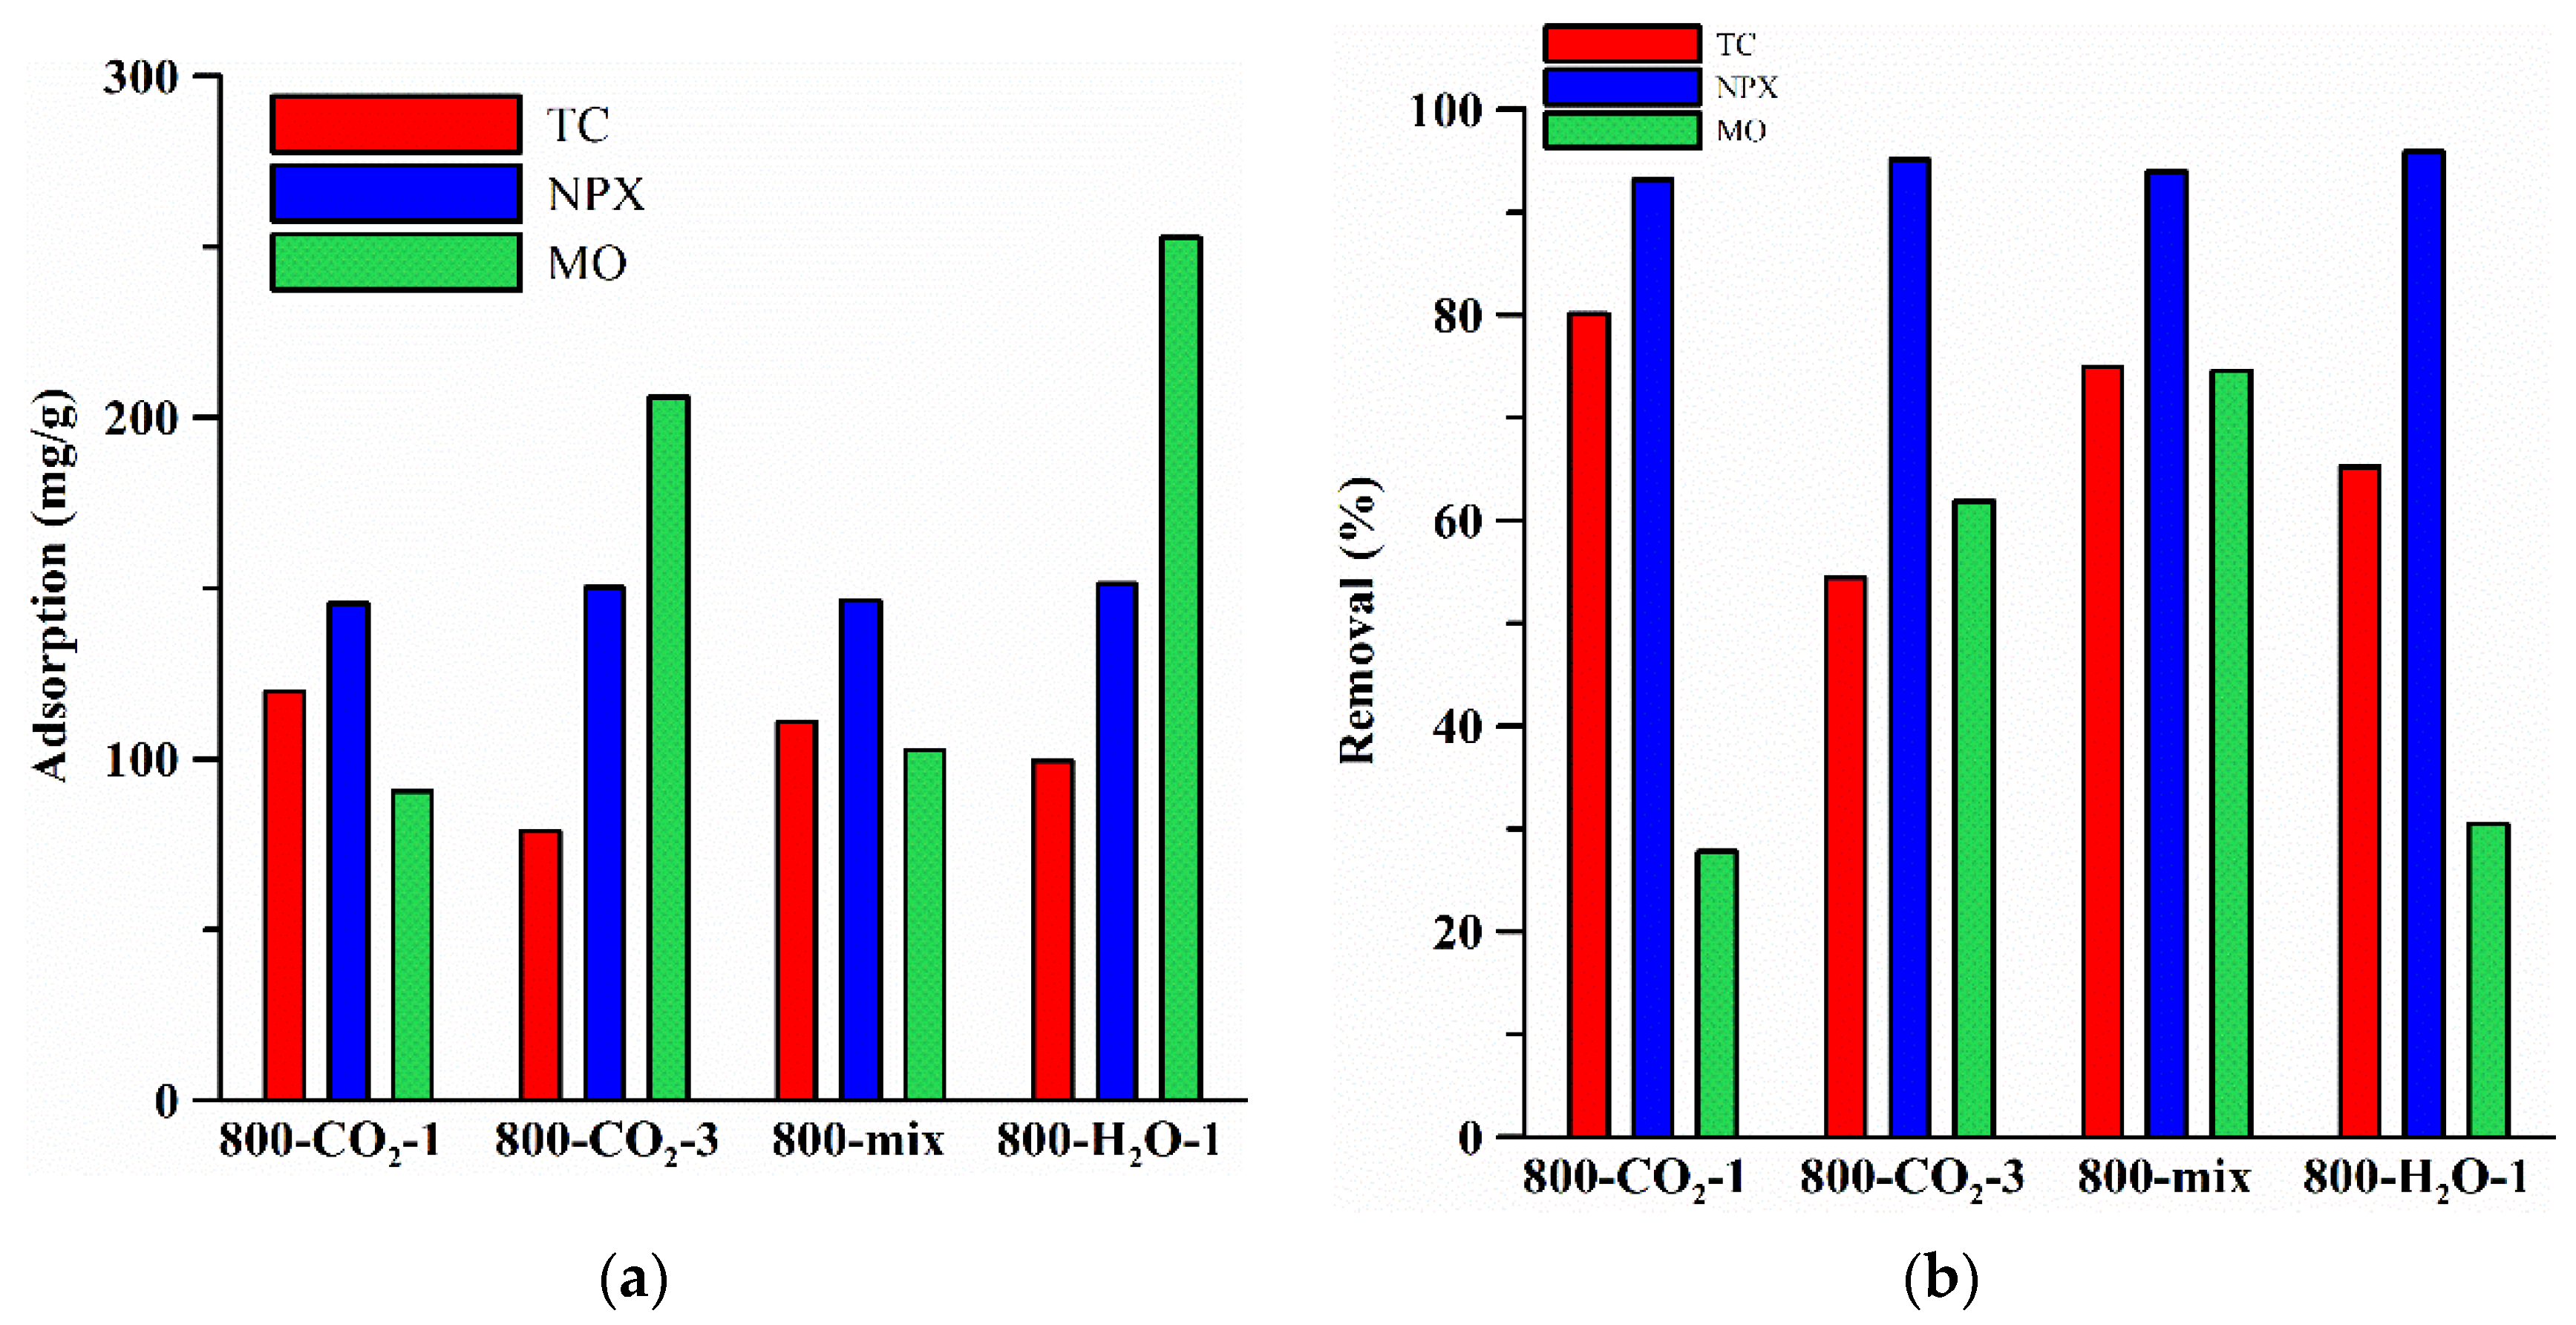
| Precursor | Preparation (Pyrolysis Temp.) | Activation | SSA (m2/g) | C0 (mg/L) | qm TC (mg/g) | qm NPX (mg/g) | qm MO (mg/g) | Ref. |
|---|---|---|---|---|---|---|---|---|
| Cow manure | Pyrolysis, 300 °C | - | 1.55 | 10–80 | 26.73 | - | - | [69] |
| Cow manure | Pyrolysis, 500 °C | - | 1.77 | 10–80 | 15.06 | - | - | [69] |
| Cow manure | Pyrolysis, 700 °C | - | 31.23 | 10–80 | 22.55 | - | - | [69] |
| Apricot nut shells | Pyrolysis, 400 °C | H3PO4 imp. | 307.6 | 100–200 | 308.33 | - | - | [64] |
| Debarked loblolly pine chips | Pyrolysis, 300 °C | - | 1.4 | 10–100 | 29.42 | - | - | [70] |
| Durian shell powder | Pyrolysis, 550 °C | CO2 | 917 | 250 | 126.08 | - | - | [65] |
| Grape marc | Pyrolysis, 300 °C | HCl | 4.25 | 10 | 6.56 | - | - | [71] |
| Grape marc | Pyrolysis, 500 °C | HCl | 25.94 | 10 | 14.01 | - | - | [71] |
| Grape marc | Pyrolysis, 700 °C | HCl | 44.23 | 10 | 17.88 | - | - | [71] |
| Chestnut seeds | Pyrolysis, 800 °C | CO2 | 534.6 | 300 | 119.79 | - | - | This work |
| Sewage sludge | Pyrolysis, 500–700 °C | CO2 | - | - | - | 123–128 | - | [66] |
| Peanut shells | Pyrolysis, 800 °C | air atm. | 571 | 5–1000 | - | 105 | - | [72] |
| Peanut shells | Pyrolysis, 800 °C | air atm. repeated 2 times | 596 | 5–1000 | - | 215 | - | [72] |
| Bamboo | Pyrolysis, 800–1000 °C | - | 459.8 | 10–1000 | - | 56.49 | - | [72] |
| Torrefied loblolly pine chips | Pyrolysis, 300 °C | - | 1360 | 20 (μM) | - | 290 | - | [73] |
| Torrefied loblolly pine chips | Pyrolysis, 300 °C | O2 | 1151 | 20 (μM) | - | 228 | - | [73] |
| Walnut shell | Pyrolysis, 700 °C | Pyrolysis, 700 °C | 649.9 | 10–400 | - | 58.87 | - | [74] |
| Chestnut seeds | Pyrolysis, 800 °C | H2O | 663.1 | 300 | - | 151.28 | - | This work |
| Birchwood pellets | Pyrolysis, 450–500 °C | CO2, 900 °C | 437.34 | 500–2500 | - | - | 153.99 | [75] |
| Chicken manure | Pyrolysis, 600 °C | - | - | 40–90 | - | - | 39.37 | [76] |
| Egyptian doum palm shells | Calcining, 500 °C | NaOH | 3.38 | 25–300 | - | - | 264.92 | [67] |
| Pomelo peel | Pyrolysis, 450 °C | KOH, 800 °C | 1892.1 | 50–300 | - | - | 680.3 | [68] |
| Sheep manure | Pyrolysis, 600 °C | HCl | 181.76 | 10–80 | - | - | 42.51 | [77] |
| Chestnut seeds | Pyrolysis, 800 °C | H2O | 663.1 | 700 | - | - | 252.67 | This work |
Disclaimer/Publisher’s Note: The statements, opinions and data contained in all publications are solely those of the individual author(s) and contributor(s) and not of MDPI and/or the editor(s). MDPI and/or the editor(s) disclaim responsibility for any injury to people or property resulting from any ideas, methods, instructions or products referred to in the content. |
© 2025 by the authors. Licensee MDPI, Basel, Switzerland. This article is an open access article distributed under the terms and conditions of the Creative Commons Attribution (CC BY) license (https://creativecommons.org/licenses/by/4.0/).
Share and Cite
Charmas, B.; Wawrzaszek, B.; Jedynak, K.; Jawtoszuk, A. Low-Cost Chestnut-Based Biocarbons Physically Activated via CO2 or Steam: Evaluation of the Structural and Adsorption Properties. Materials 2025, 18, 1497. https://doi.org/10.3390/ma18071497
Charmas B, Wawrzaszek B, Jedynak K, Jawtoszuk A. Low-Cost Chestnut-Based Biocarbons Physically Activated via CO2 or Steam: Evaluation of the Structural and Adsorption Properties. Materials. 2025; 18(7):1497. https://doi.org/10.3390/ma18071497
Chicago/Turabian StyleCharmas, Barbara, Barbara Wawrzaszek, Katarzyna Jedynak, and Agata Jawtoszuk. 2025. "Low-Cost Chestnut-Based Biocarbons Physically Activated via CO2 or Steam: Evaluation of the Structural and Adsorption Properties" Materials 18, no. 7: 1497. https://doi.org/10.3390/ma18071497
APA StyleCharmas, B., Wawrzaszek, B., Jedynak, K., & Jawtoszuk, A. (2025). Low-Cost Chestnut-Based Biocarbons Physically Activated via CO2 or Steam: Evaluation of the Structural and Adsorption Properties. Materials, 18(7), 1497. https://doi.org/10.3390/ma18071497