Abstract
This study investigates the potential use of biochar derived from residues—such as spruce wood, spent coffee grounds, tea waste, and nutshells—as a sustainable coal substitute—to enhance the decarbonization of European energetic systems and decrease the dependence on fossil fuels. The biomasses were pyrolyzed at 250–550 °C, analyzed for calorific value and composition, and evaluated for energy retention and mass loss. The results show significant energy density improvements, with optimal temperatures varying by material (e.g., spruce wood reached 31.56 MJ·kg−1 at 550 °C, retaining 21.84% of its mass; spent coffee grounds peaked at 31.26 MJ·kg−1 at 350 °C, retaining 37.53%). Economic analysis confirmed pyrolyzed biomass as a cost-effective alternative to coal, especially considering emission allowance costs. Integrating biomass pyrolysis into regional energy systems supports decarbonization, reduces emissions, and advances us towards a circular economy.
Keywords:
biomass; biochar; calorific value; energy residual; spruce wood; spent coffee ground; tea waste; nut shells 1. Introduction
The dwindling reserves of fossil fuels, coupled with Europe’s goal to reduce dependency on them [1], have spurred interest in sustainable alternatives like biomass waste within a circular economy framework. Renewable energy sources such as solar, hydro, wind, and biomass are crucial for sustaining economic growth while protecting the environment [2]. Biomasses from agricultural and forestry by-products such as sawdust, bagasse, coffee husk, and nutshells are already commonly used as solid fuels in developing regions [3,4,5] and have the potential to replace fossil fuels in developed countries [6,7]. Biomass can also be co-combusted with coal in existing coal power plants in order to achieve reduced greenhouse gas emissions and reduced solid waste from the combustion process [8]. The results show that blends with 70 wt. %, 50 wt. % and 30 wt. % biomass could reduce the non-renewable CO2 emissions per produced unit of energy by about 75%, 57% and 34%, respectively [9]. Purohit and Chaturvedi [10] estimated that associated carbon dioxide mitigation potential in India would be 205 Mt in 2030–2031 if the entire biomass surplus is to be diverted for power generation. Coal remains the primary global fuel for heat and power production, but its use significantly contributes to greenhouse gas emissions [11]. Major CO2 emitters include China, the USA, India, and European nations such as Germany and Poland [12]. Finding viable alternatives to fossil fuels remains a pressing challenge [13,14,15]; however, pyrolysis technologies utilizing renewable biological resources show promise in producing substitutes for coal [16].
Recent advancements in biochar research have further reinforced its potential use as a sustainable energy resource. For example, a study from Prabha [17] highlighted that biochar could significantly contribute to improving soil health and mitigating climate change. This is due to its carbon sequestration capabilities and its ability to act as a clean-burning fuel source. Other studies, such as one by Rajput [18], have emphasized the role of optimized pyrolysis processes in tailoring biochar properties to enhance its calorific value and material applications, ranging from renewable energy to industrial uses. These findings underline the critical importance of refining production methods to maximize both efficiency and versatility, paving the way for broader applications across sectors.
A bibliometric analysis of biochar trends published by Wu [19] demonstrated a growing focus on the economic feasibility of biochar applications in agricultural, environmental, and energy sectors. Such advances underscore the importance of improving biochar’s production efficiency and scalability, ensuring that its benefits extend beyond niche uses to become a cornerstone of renewable energy strategies.
In the Czech Republic, energy policy prioritizes the use of alternative biomass resources like damaged timber and logging residues for fuel, aligning with plans to decarbonize the energy sector [20,21]. The region’s significant challenges, including extensive forest disturbances [22,23] caused by climate change [24,25,26,27] and associated salvage logging [28], provide a substantial supply of by-products suitable for biochar production. These by-products not only offer an environmentally friendly solution for waste management, but also present an economically viable resource for renewable energy [29].
One of the key technologies for enhancing biomass energy properties is low-temperature pyrolysis, often called torrefaction, a process involving the slow heating of organic materials like wood, spent coffee ground [30,31,32], straw, and nutshells in a low-oxygen environment. This method not only improves the energy properties of biomass, but also makes it a more effective, clean-burning fuel [33,34,35]. Pyrolysis increases biochar’s energy density, making it easier to handle and transport, and reduces overall logistics costs. Furthermore, biochar production supports renewable energy generation and aids in carbon sequestration, which is crucial for mitigating climate change [36,37].
Recent research has demonstrated that pyrolysis can be optimized using machine learning techniques to enhance energy recovery and adapt material properties to specific applications [38,39]. Studies have also explored the co-pyrolysis of multiple biomass types, revealing synergistic effects that enhance yield and quality, a promising area for further exploration [40,41].
Economic evaluations have also underscored the viability of using biochar as a substitute for coal. The economic and environmental benefits of transitioning to biochar-based fuels are supported by their lower emissions [42], reduced waste disposal costs, and ability to create new markets for agricultural by-products [43,44,45,46]. Studies, including those examining the use of biochar in decentralized energy systems, emphasize the efficiency of localized production and utilization [47,48,49], with additional benefits such as soil conditioning for biochar [50]. Decentralized approaches not only reduce the environmental costs associated with transportation, but also increase resilience by enabling energy generation close to biomass sources. These findings further bolster the argument for incorporating pyrolyzed biomass into the Czech Republic’s energy mix [51], supporting EU decarbonization goals and promoting circular economy approaches.
In summary, advancements in biochar research and its integration into renewable energy policies suggest that optimizing local waste materials for energy production contributes towards achieving energy security and sustainability in the region. This study aims to evaluate the potential of pyrolyzed biofuels made from residues and waste materials, including spruce wood, spent coffee grounds, tea waste, walnut shells, pistachio shells, and peanut shells, as substitutes for coal. Aside from comparing the proximate and ultimate analysis results with those of other authors, this article also focuses on the economic aspect of biochar usage.
By leveraging recent technological and economic insights, the potential for biochar to transform energy systems and contribute to environmental sustainability is made increasingly apparent.
2. Materials and Methods
To confirm data consistency, results from prior research conducted in 2020–2022 [52,53,54,55] are here re-evaluated alongside new analyses performed in 2023. Additional analyses were conducted on the samples to assess the overall energy potential of these sustainable biochar materials as substitutes for fossil resources.
The selected pyrolysis temperatures (250 °C, 300 °C, 350 °C, 450 °C, and 550 °C), along with a non-pyrolyzed sample (designated as 0 °C), were chosen to represent the full range of slow pyrolysis processes, from low to moderately high temperatures. Pyrolysis at 250 °C induced notable changes in material composition for most samples, as illustrated in the Van Krevelen diagram (Section 3.5), with a minimal correlation between temperature and mass loss [56]. In contrast, pyrolysis at 550 °C led to highly active pyrolysis reactions, depending on the nature of the tested materials [57], resulting in the transformation of the material into gaseous and liquid states. These selected temperature points align with those from previous studies, ensuring methodological consistency and enabling reliable comparisons across datasets.
The samples, sourced from renewable energy materials, were selected as by-products from the forestry and food industries. The primary focus was to determine the optimal energy utilization of these samples as substitutes for fossil fuels.
Spruce timber was harvested from the Vysočina region in the Czech Republic in 2023. The samples, sourced from logs cut 12 to 18 months earlier, were processed into wood chips and combined to form a representative composite sample. In 2020, the EU had around 159 million hectares of forests, a 10% increase since 1990. Forest areas grew in most EU countries, with Ireland, Spain, and Malta experiencing notable expansions. In 2019, the EU’s wood stocks were 28.4 billion m3, with Germany, Sweden, and France leading in volume [29]. The Czech Republic’s wood volume rose by 15%, representing 2.7% of European wood stocks [58].
Spent coffee grounds (SCG) were obtained from Coffea arabica, which constitutes approximately 75% of global coffee production [59,60]. These grounds, collected from a single household (4 kg total), were sun-dried for several days until reaching a stable moisture content of 8.45%. Coffee, as one of the world’s most widely consumed beverages, generates substantial amounts of spent coffee grounds, totaling approximately 6.5 megatons annually worldwide [61]. In the Czech Republic, about 3 billion cups of coffee consumed in 2019 produced roughly 24,000 tons of SCG [62]. Rich in cellulose, sugars, minerals, and lipids, coffee beans are valuable for producing biodiesel or fuel pellets, with a calorific value of about 20.9 MJ·kg−1 [63,64,65].
Black tea residues (Camellia sinensis L. Kuntze) were gathered from domestic brewing processes over four months and sun-dried to reach a moisture content of 8.31%. Tea is the second most popular non-alcoholic drink globally, with nearly 6 million tons produced annually [66,67,68]. In Czech Republic, the annual production is approximately 2000 tons of tea waste [62]. Like coffee, tea consumption generates significant waste, with over 90% of the tea material left unused after brewing [69]. Studies have demonstrated tea waste’s potential as a fuel pellet resource, showing high calorific values and suitability as a natural additive to other biomass materials [70,71,72,73,74]. However, tea waste-based pellets may contain high ash levels and deposit-forming elements [75,76].
Nutshells, namely, walnut shells harvested from English walnut (Juglans regia L.), pistachio shells from Pistacia vera L., and peanut shells derived from Arachis hypogaea L., were also used. The United States is a leading producer of nuts [77,78], with its industries generating significant by-products. In California, there were 1.5 million tons of almonds, 0.5 million tons of pistachios and 0.4 million tons of walnuts produced [79], while in Czech Republic, 22 tons of nut of waste was generated [62] in 2020. Walnut and almond shells, often discarded, can be converted into biochar, offering enhanced properties and reduced emissions compared to direct combustion. Processing companies report that utilizing nutshells as biochar or biofuel offsets disposal costs and provides an environmentally friendly alternative [80,81,82,83,84,85,86].
All samples were ground to a particle size of 1 mm using a Retsch SM 100 mill (Haan, Germany) and then subjected to pyrolysis in a LECO TGA 701 analyzer (St. Joseph, MI, USA) at five distinct temperatures: 250 °C, 300 °C, 350 °C, 450 °C, and 550 °C. Each sample was heated in an inert atmosphere at a rate of 10 °C per minute and held at the target temperature for an additional 30 min. The 30-min residence time was selected based on the available literature, as this duration has been shown to optimize pyrolysis performance. This has been demonstrated in the processing of fruit bio-waste [87], as well as in the pyrolysis of olive pits [88].
2.1. Proximate and Ultimate Analysis
Each sample underwent proximate and ultimate analysis to understand its material composition and characteristics. In the proximate analysis, measurements included elemental composition, moisture content, and ash content. The ultimate analysis involved determining the calorific value [89]. All measurements were conducted 5 times, and the average value was used for the following calculations.
A LECO TGA 701 thermogravimetric analyzer was used for measuring moisture and ash contents [90]. To calculate moisture content, 1 g of each sample was dried at 105 °C to a constant weight [91]. For ash content, 1 g of each sample was heated to a constant weight up to 550 °C.
The chemical compositions were analyzed using a LECO CHN628+S elemental analyzer (LECO Corporation, St. Joseph, MI, USA) through the LECO instrumental biomass combustion method. Each 0.1-gram sample was burned in oxygen at 950 °C to measure the amounts of carbon (C), hydrogen (H), and nitrogen (N). The oxygen content was determined by difference to a total of 100% on a dry basis. The LECO elemental analyzer was regularly calibrated using ethylenediaminetetraacetic acid, rice flour, and oatmeal.
To determine the calorific value, 1 g of each sample was placed in a stainless-steel crucible and secured in a cylinder. The pressure increased to 3 MPa at a reference temperature of 28 °C. The sample was then ignited with a cotton thread inside a LECO AC600 isoperbolic calorimeter (LECO Corporation, St. Joseph, MI, USA). Benzoic acid was used to calibrate the instrument. All proximate and ultimate analysis results were reported on a dry basis.
Net calorific value was calculated from the measured gross calorific value using the equation
where Qn (kJ·kg−1) is net calorific value, Qv (kJ·kg−1) is gross calorific value, W (%) is water contain in the sample, H (kg·kg−1) is hydrogen content in the sample, 24.42 is the amount equal to energy needed to evaporate 1% of water at 25 °C and 8.94 is the coefficient for the conversion of hydrogen to water.
2.2. Energy Residual
The energy residual of the original mass was calculated by adjusting the calorific value for the material’s enthalpy and accounting for the mass loss.
The enthalpy of the material (kJ·kg−1) was determined using the standard for spruce wood. Weight loss was measured with a LECO TGA 701 (LECO Corporation, St. Joseph, MI, USA). During the material’s pyrolysis, weight measurements were taken with an accuracy of 10−4 g.
2.3. Thermogravimetric Analysis
To express the dynamics of volatile matter loss during heating, LECO TGA 701 was used to perform a TGA analysis. The samples were enclosed in aluminum foil and put in covered crucibles. The temperature program consisted of two phases. In the first one, the samples were dried at 105 °C until constant weight. In the second, the temperature would ramp up at a rate of 5 °C min−1 from 105 °C to 580 °C. The results were processed into weight loss curves (TGA) and their derivations (DTG curves). The values were converted to express the loss of combustible matter. The DTG curves were then taken to represent the rate of loss (wt. % min−1) of combustible matter as a function of temperature.
2.4. Economic Assessment of Material Pyrolysis
An economic assessment was performed considering the price of the material and energy residual from the pellet produced.
Pellet production was calculated as a fixed energy cost Ep.
where QP (kJ·kg−1) is energy residual in the pellet, QT (kJ·kg−1) is energy residual in the material and EP = 108 kJ·kg−1 is the fixed energy cost of pellet production [92].
The final price of 1 MWh (EUR) for all materials in the form of a pellet was calculated by use of the following equation:
where PMWh (EUR) is a price of 1 MWh, Pkg is a price of 1 kg, QP (kJ·kg−1) is energy residual in the pellet and 0.2778 is a coefficient to display kg in MWh.
2.5. Statistical Analysis
The statistical analysis of the results was conducted using the STATISTICA 14.0.0.15 CZ (StatSoft, Tulsa, OK, USA) software. The data were subjected to a one-way ANOVA.
3. Results and Discussion
3.1. Proximate and Ultimate Analysis
Elemental composition, ash and water content, and calorific value were measured for all samples. Measurements were performed five times for all the samples. The final average results with the given deviation are shown in the Table 1.

Table 1.
Proximate and ultimate analysis of all samples.
The overall results of the proximate and ultimate analysis of the present materials do not fundamentally differ from those reported by other authors, e.g., from the processing of olive pits [88] and other agricultural waste materials [87]. The only notable differences are in moisture and ash content, which are specific to the region where the original samples were collected and have a significant impact on the net calorific value.
The spruce wood samples’ results are very close to those of Jenicek et al., Malatak et al. and Arias et al. [53,93,94].
The spent coffee ground proximate analysis results are in line with those of Fermoso and Mašek, Masek et al. and Mayson and Williams [95,96,97]. The calorific values of SCG are similar to those found by Silva et al. and Colantoni et al. [98,99].
The tea waste results here are similar to those found by Tunklova et al. [54], while the calorific value in the non-torrefied sample here is bit lower than that in Sermyagina et al. [100], whose result was 20.39 MJ·kg−1.
The results for nutshells are very close to those found by Jenicek et al. and Vassilev et al. [55,101] in all aspects of proximate and ultimate analysis.
3.2. Calorific Value and Energy Residual of the Samples
The net calorific value in the dry state (Table 2) was calculated from the calorific value, which was measured using the LECO AC600 isoperbolic calorimeter (Table 1).
Table 2.
Net calorific value in the dry state of samples (MJ·kg−1).
The results here are very close to those of Malatak et al. [93], Gendek et al. [102] and Jenicek et al. [42] for spruce wood, with 18.6 MJ·kg−1 for dried material and 31.56 MJ·kg−1 for the sample pyrolyzed at 550 °C.
Colantoni et al. [99] and Silva et al. [98] reported the calorific values of spent coffee grounds with approximate results of 20.92 MJ·kg−1 and 22.36 MJ·kg−1, respectively. Similar results were also achieved by Kovalcik et al., McNutt and He, Nepal et al., Bejenari et al. and Ballesteros et al. [103,104,105,106,107].
Tea waste net calorific values were close to the results derived by Tunklova et al. [54], in the range of 17.04–24.31 MJ·kg−1 depending on the level of pyrolysis, but were slightly lower compared to Sermyagina et al. [108], who reported gross calorific values of 20.39 MJ·kg−1 in green tea and 20.26 MJ·kg−1 in black tea.
Measuring the nutshell’s net calorific value, we find results close to those of Jenicek et al. [55], who used the same method, with a walnut net calorific value of 18.66 MJ·kg−1 (non-pyrolyzed) to 30.55 MJ·kg−1 (550 °C), a pistachio net calorific value of 17.58 MJ·kg−1 (non-pyrolyzed) to 31.35 MJ·kg−1 (550 °C) and a peanut net calorific value of 19.93 MJ·kg−1 (non-pyrolyzed) to 28.78 MJ·kg−1 (550 °C).
Material enthalpy for spruce wood was applied for all samples to estimate the energy needed for material pyrolysis. Enthalpy varied from 0.274 MJ·kg−1 for the material pyrolyzed at 250 °C to 0.602 MJ·kg−1 at 550 °C. The results for net calorific value adjusted by material enthalpy are shown in Table 3.
Table 3.
Net calorific values of samples adjusted by material enthalpy (MJ·kg−1).
Another important parameter when assessing the pyrolyzed material is the weight loss under each process temperature. There is an overview in Table 4 of what percentage of original mass remained after the material was pyrolyzed. The highest level of material loss when pyrolyzed at 250 °C was seen in pistachio shells, with only 72.35% of original mass left. The highest loss at 550 °C occurred for spent coffee grounds, which kept only 20.05% of their original mass.
Table 4.
Material mass residue (%).
When combining the net calorific value of the pyrolyzed material adjusted by the material enthalpy and weight loss of the pyrolyzed material, we get the energy residual of the original mass weight unit. As we can see in Table 5, for spruce wood, pyrolysis led to a decrease in energy residual from 18.600 MJ·kg−1 to 6.762 MJ·kg−1. In other words, the direct combustion of 1 kg of dried spruce wood would lead to the generation of 18.600 MJ·kg−1, or if the same 1 kg of dried spruce wood is first pyrolyzed at 550 °C, the total output would lead to the generation of only 6.762 MJ·kg−1. This energy loss was significantly greater than that measured by Liu et al. [109], who showed bamboo pellet mass losses of 2.12%, 3.31% and 7.45% at 180 °C, 200 °C and 220 °C, respectively. The difference in mass loss is caused by the lower temperature in the experiments of Liu, as well as different materials and different processes of pyrolysis.
Table 5.
Energy residual of original mass (MJ·kg−1).
To summarize the results, Table 2 shows the net calorific value of the sample; the higher pyrolysis of the material leads to higher energy density and therefore higher net calorific value. On contrary, Table 5 shows that the total energy output of the original dried material was lowered by the material enthalpy and the weight loss caused by the pyrolysis. An equilibrium between increasing the material energy density and losing the energy of original mass when modifying the material by pyrolysis needs to be set for each material separately.
3.3. Calorific Value Density and Weight Loss Comparison
Spruce wood showed a significant drop in energy residual between pyrolysis temperatures of 300 °C and 350 °C; in the same interval, spruce wood increases its calorific value density from 20.83 MJ·kg−1 to 27.31 MJ·kg−1 (see Figure 1). The recommended temperature for spruce wood pyrolysis is 300 °C. This is lower in comparison to that found by Jenicek et al. [53], recommending pyrolysis at 350 °C, as the mass loss was not considered in this respective article.
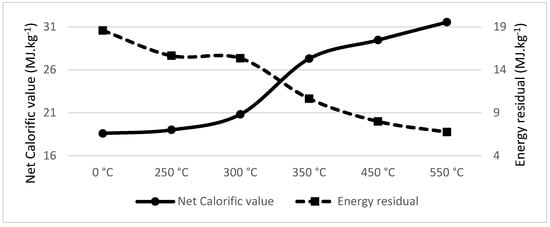
Figure 1.
Net calorific value (MJ·kg−1) and energy residual (MJ·kg−1) of Spruce wood.
Spent coffee ground dropped in total energy considerably from the temperature level of 250 °C, as seen in Figure 2. The energy density increased substantially between 250 °C and 300 °C. The recommended pyrolysis temperature was also 300 °C, as it was for spruce wood, which is slightly lower than recommended by Jenicek et al. [52], who recommended 350 °C as an ideal pyrolysis temperature for spent coffee ground, and did not show the mass loss figure estimations in their original article.
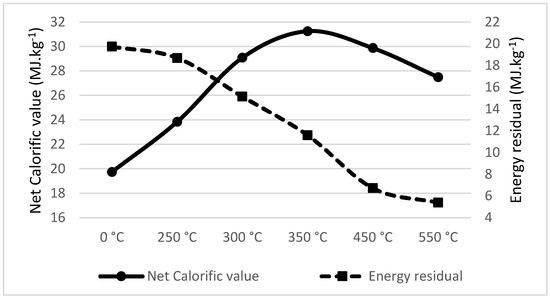
Figure 2.
Net calorific value (MJ·kg−1) and energy residual (MJ·kg−1) of spent coffee ground.
Tea waste pyrolysis showed a significant drop in total energy produced above the temperature of 250 °C. From the research of Tunklova et al. [54], it can be confirmed that increasing the share of ash also occurred for tea waste pyrolysis; therefore, its recommended temperature is no more than 250 °C. Detailed curve of net calorific values and energy residuals of the pyrolyzed material are visible on Figure 3.
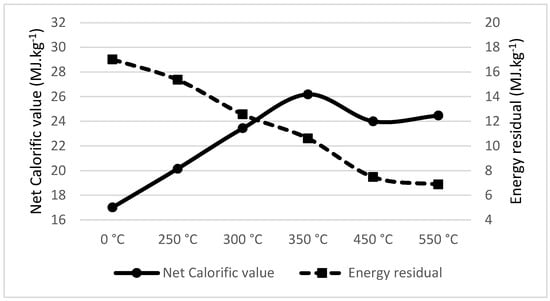
Figure 3.
Net calorific value (MJ·kg−1) and energy residual (MJ·kg−1) of Tea waste.
Walnut shell pyrolysis significantly increases the net calorific value at the temperature of 300 °C; for higher temperatures, the net calorific value remains stable or increases indistinctly. On the other hand, the energy residual drops at the temperature of 350 °C, as seen in Figure 4. As such, the recommended temperature for the pyrolysis of walnut shell is 300 °C, the same as measured by Jenicek et al. [55].
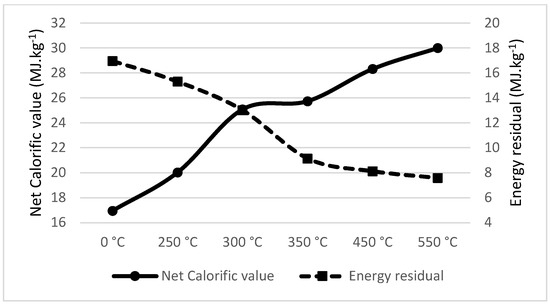
Figure 4.
Net calorific value (MJ·kg−1) and energy residual (MJ·kg−1) of Walnut shell.
Pistachio shell shows an almost linear increase in net calorific value and an almost linear decrease in energy residual with pyrolysis temperature increases. To keep at least 14 MJ·kg−1 of total residual, the recommended temperature for pyrolysis should not surpass 250 °C. This is slightly lower than Jenicek et al.’s [55] recommendation of 300 °C pyrolysis. Detailed results are shown in Figure 5.
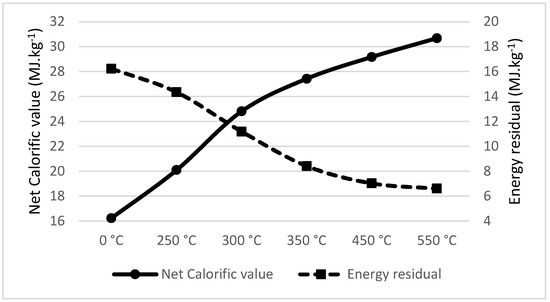
Figure 5.
Net calorific value (MJ·kg−1) and energy residual (MJ·kg−1) of Pistachio shell.
Peanut shell shows a similar nearly linear increase in net calorific value and decrease in energy residual with pyrolysis temperature increases. On the contrary, the maximum net calorific value of a peanut shell sample pyrolyzed at 550 °C was 28.11 MJ·kg−1 with the energy residual 7.661 MJ·kg−1; meanwhile, the pistachio shell sample showed a higher residual net calorific value of 30.68 MJ·kg−1 with a lower energy residual of 6.589 MJ·kg−1 in the same laboratory conditions. Detailed results are shown in Figure 6. The recommended temperature for the pyrolysis of peanut shell is 300 °C—far lower than suggested by Jenicek et al., who recommended 550 °C.
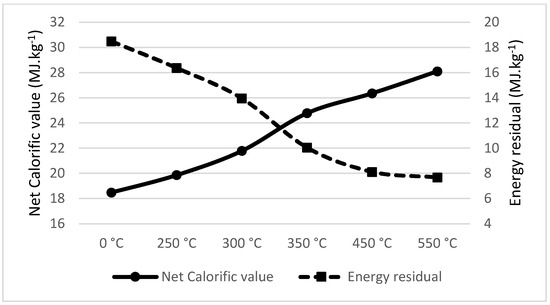
Figure 6.
Net calorific value (MJ·kg−1) and energy residual (MJ·kg−1) of Peanut shell.
3.4. Economic Assessment of Material Pyrolysis
In order to assess the economic aspects of pyrolysis, let us first adjust the energy residual of dried material by pellet production losses. Pyrolyzed material is pressed into a form of a pellet of 8 mm in diameter and 15 to 20 mm in length. During the pellet production, approximately 0.108 MJ·kg−1 [92] of energy is used. The net calorific value of a pellet shown in original mass weight units is presented in Table 6.
Table 6.
Energy residual of original mass—pellet production (MJ·kg−1).
In real operation, the production of pellets from material pyrolyzed at high temperatures (more than 400 °C) requires additional components to ensure sufficiently high mechanical durability. This fact is omitted for the purpose of the purity of results of this research [110].
The energy residual of original material combined with the price of the original material gives us the result of price per MWh for each analyzed sample. The spruce wood price was set as EUR 50 m−3, which is ca. EUR 106 ton−1 of dried spruce wood. The prices of all other materials are very complicated to estimate, as the market is not centralized and not yet well developed; therefore, the prices for spent coffee grounds, tea waste and all nutshells were set as EUR 200 ton−1.
The final material prices are shown in Table 7. The lowest price was derived for naturally dried spruce wood, with EUR 20.71 MWh−1; the highest price is for spent coffee ground pyrolyzed at 550 °C, with EUR 134.06 MWh−1. Recommended pyrolysis conditions are marked in bold letters, with the lowest value of EUR 25.07 MWh−1 for spruce wood pyrolyzed at 300 °C, and the highest value of EUR 55.55 MWh−1 for walnut shell pyrolyzed at 300 °C.
Table 7.
Material price (EUR MWh−1).
For a complete overview, these results need to be compared to those of the standard fossil fuel brown coal, which is today still the most widely used fuel around the world. The average price of brown coal for the last 12 months was EUR 110 ton−1, which is approximately EUR 28.5 MWh−1. Next to the price of coal itself, the price of emission allowances needs to be combined with the 12-month average of EUR 57.58 t(CO2)−1, which is approximately ERU 86.77 MWh−1. In total, this gives over EUR 115 MWh−1 in material costs when using brown coal. Due to the high price of emission allowance, any pyrolyzed biomass would be cheaper to use, as it is not burdened by emission allowances. The economic assessment of biomass usage as an alternative to brown coal in municipal power plants was also calculated by Malatak et al. [93], with positive results when considering timber as a more profitable fuel than coal.
Economic evaluations highlight biochar’s viability as a coal substitute due to its lower emissions, reduced waste disposal costs, and potential to create new markets for agricultural by-products [54,55,93]. However, the lack of centralized markets for materials like spent coffee grounds, tea waste, and nutshells leads to price variability. Additionally, collection and transportation costs can significantly impact economic feasibility, particularly for dispersed sources.
Decentralized waste collection, co-locating pyrolysis units near waste generation sites, and integrating with existing supply chains can reduce logistical costs. Future analyses should include transportation impact modeling to improve economic assessments. Strategies such as leveraging local supply chains and minimizing transport distances further enhance cost efficiency.
In summary, while biochar’s benefits are clear, overcoming logistical and economic barriers is vital for large-scale adoption.
3.5. Van Krevelen Diagram
The van Krevelen diagram (Figure 7 and Figure 8) shows the evolution of the three main components of fuel—carbon, oxygen, and hydrogen. During carbonization, oxygen is released approximately twice as fast as hydrogen until black coal is formed. Further transformation into anthracite decreases the H/C ratio while keeping the oxygen content low.
Figure 7 shows the van Krevelen diagram for biochar produced from spruce wood, spent coffee grounds, and tea waste, where it is evident that increasing process temperatures lead to a reduction in the H/C and O/C ratios. Figure 8 shows similar trends for biochar derived from walnut, pistachio, and peanut shells.
Like fossil fuels, the O/C ratio drops faster than the H/C ratio. Temperatures between 300 and 350 °C cause the greatest decrease in these ratios. For spruce wood, a 100 °C increase lowers the O/C ratio from 0.42 to 0.17, and a further 100 °C increase drops the H/C ratio from 0.17 to 0.11. Similar reductions are seen in other wood biomasses, with the H/C ratio dropping from 1.37 to 0.75 between 250 and 350 °C [111]. Spent coffee grounds and tea waste show ratio changes starting at 250 °C. Walnut, pistachio, and peanut shells display almost identical changes in ratios with rising temperatures.
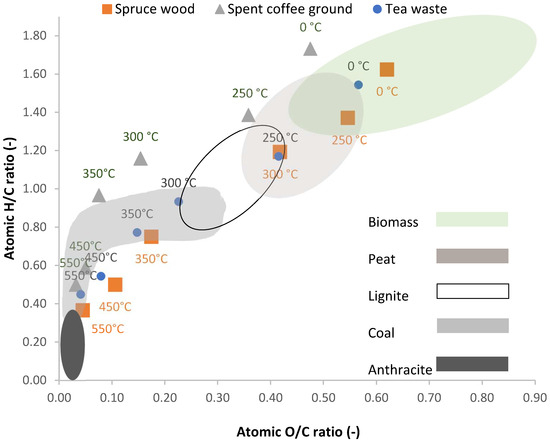
Figure 7.
Van Krevelen diagram for spruce wood, spent coffee ground and tea waste ranges for material types according to Van Loo and Koppejan [112].
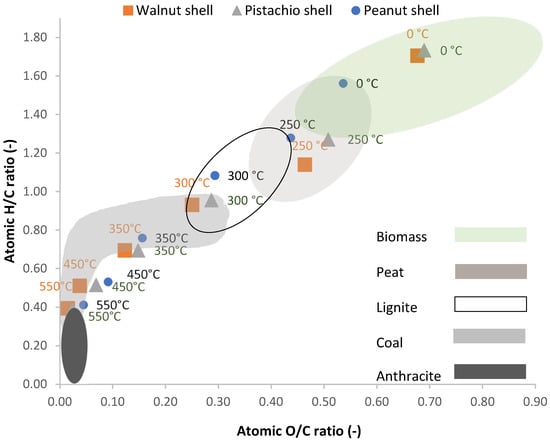
Figure 8.
Van Krevelen diagram for walnut shell, pistachio shell and peanut shell ranges for material types according to Van Loo and Koppejan [112].
3.6. Thermogravimetric Curves
To express the differences in the release of volatile matter, e.g., during the first phase of combustion, between the original biomass materials and the biochar, all samples have undergone TGA analysis. The results are expressed as DTG curves of combustible matter in Figure 9, Figure 10 and Figure 11. In raw biomass materials, the spread of results is relatively broad. The significant release of volatiles starts at 250 °C for all materials; however, the trends do vary, owing to the differences in chemical constitution, between the source biomasses, i.e., different proportions of hemicelluloses, cellulose and lignin, all of which tend to decompose in different temperature ranges [113]. In particular, in all samples apart from SCG, the lignin content is apparent in the second DTG peak around 350 °C.
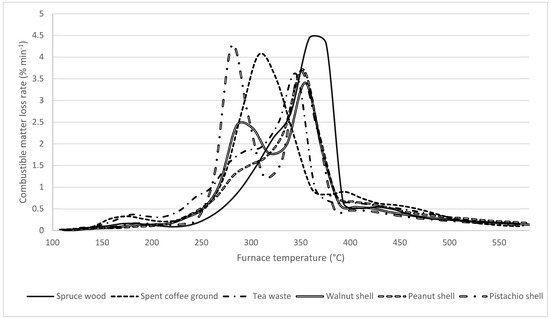
Figure 9.
DTG curves of untreated biomass. The curves were converted to express the rate of loss of combustible matter, i.e., dry, ash-free state.
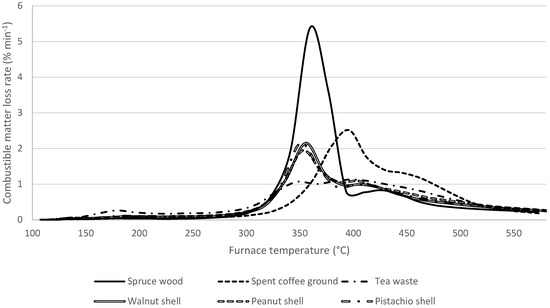
Figure 10.
DTG curves of samples treated at 300 °C. The curves were converted to express the rate of loss of combustible matter, i.e., dry, ash-free state.
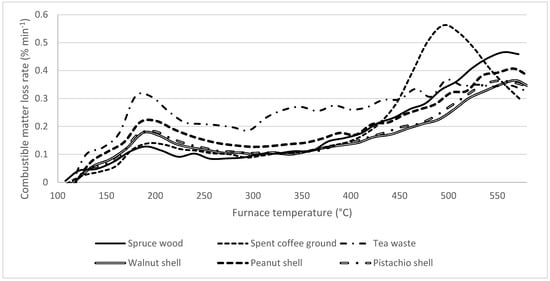
Figure 11.
DTG curves of samples treated at 400 °C. The curves were converted to express the rate of loss of combustible matter, i.e., the dry, ash-free state.
In biochar produced at 300 °C (Figure 10), significant decomposition starts above 300 °C, with the first DTG peak being almost uniform around 350 °C. Markedly different again is the SCG, with a different combustible release profile, possibly thanks to it already being thermally treated as a part of coffee production. Spruce wood biochar achieved a very high maximum (over 5% min−1) in volatile release. However, in the other biochar, the release was more gradual, with peaks approximately half as significant compared to raw biomass. This would make the combustion process more similar to coal combustion, or better suited for coal-fired boilers [39,45,48].
In the biochar produced at 400 °C, the DTG curves were much lower than in the previous case, with DTG peaks generally below 0.5% min−1. Here, the volatile matter release is not finished by the end of the analysis at 580 °C. In all samples, there is an early peak around 200 °C, which can be inferred to be caused by bound water release. Above this temperature, the profile seems to correlate relatively well with that of, e.g., lignite coal [114,115]. Importantly, the volatile release profiles correlate very well with each other, and therefore are expected to behave similarly in combustion.
4. Conclusions
This study underscores the transformative potential of pyrolyzed biomass derived from daily residues and waste materials, such as spruce wood, spent coffee grounds, tea waste, walnut shells, pistachio shells, and peanut shells, as sustainable and high-calorific-value substitutes for coal. By harnessing these underutilized agro-waste resources, which often end up in mixed municipal waste landfills, this approach not only provides a renewable energy solution, but also promotes circular economy principles. These raw materials demonstrate significant promise for local energy applications, ensuring long-term sustainability while maintaining critical quality metrics, such as calorific value and elemental composition. This work reinforces the viability of integrating pyrolyzed biomass into energy systems to reduce dependence on fossil fuels and meet decarbonization goals effectively.
The results demonstrate that pyrolysis significantly enhances the net calorific value of these materials, with optimal temperatures varying based on the feedstock. For instance, spruce wood achieves a net calorific value of 31.56 MJ·kg−1 at 550 °C, while spent coffee grounds reach their peak at 31.26 MJ·kg−1 at 350 °C. However, higher temperatures also result in greater mass loss, reducing the overall energy retained per unit of original biomass. For example, spruce wood retains only 21.84% of its original mass at 550 °C, while spent coffee grounds retain 37.53% at 350 °C, highlighting a critical trade-off between maximizing energy density and preserving material mass. These findings emphasize the importance of determining material-specific pyrolysis conditions to optimize both energy yield and resource efficiency.
Economically, pyrolyzed biomass offers a cost-effective alternative to fossil fuels when factoring in emission allowances, which significantly increase the cost of coal. The decentralized production of biochar, particularly near waste generation sites, not only reduces logistical and transportation costs, but also supports local economies and waste management strategies. Furthermore, the use of renewable waste materials aligns with circular economy principles, reducing environmental impacts and diversifying energy sources.
In summary, integrating pyrolyzed biofuels into the Czech Republic’s energy framework can play a pivotal role in achieving EU decarbonization targets. By leveraging local biomass resources and prioritizing decentralized energy production, this approach addresses logistical, economic, and environmental challenges, advancing the transition toward a more sustainable and resilient energy system.
Author Contributions
Conceptualization, L.J. and M.N.; methodology, J.M. and J.V.; validation, J.V. and J.M.; formal analysis, L.J.; investigation, L.J. and M.N.; resources, L.J. and M.N.; data curation, L.J.; writing—original draft preparation, L.J.; writing—review and editing, J.M., L.J., J.V. and M.N.; visualization, L.J.; supervision, J.M.; project administration, L.J.; funding acquisition, L.J. All authors have read and agreed to the published version of the manuscript.
Funding
This study was supported by the Internal Grant Agency of the Faculty of Engineering, Czech University of Life Science Prague, grant number: 2022:31170/1312/3104.
Institutional Review Board Statement
Not applicable.
Informed Consent Statement
Not applicable.
Data Availability Statement
The raw data supporting the conclusions of this article will be made available by the authors on request.
Conflicts of Interest
The authors declare no conflict of interest.
References
- European Environment Agency Closing the Loop—An EU Action Plan for the Circular Economy COM/2015/0614 Final—European Environment Agency. Available online: https://www.eea.europa.eu/policy-documents/com-2015-0614-final (accessed on 28 August 2022).
- Okedu, K.; Al Senaidi, A.S.; Al Hajri, I.; Al Rashdi, I.; Salmani, W. Al Real Time Dynamic Analysis of Solar PV Integration for Energy Optimization. Int. J. Smart Grid 2020, 4, 68–79. [Google Scholar] [CrossRef]
- Lubwama, M.; Yiga, V.A. Development of Groundnut Shells and Bagasse Briquettes as Sustainable Fuel Sources for Domestic Cooking Applications in Uganda. Renew Energy 2017, 111, 532–542. [Google Scholar] [CrossRef]
- Lubwama, M.; Yiga, V.A. Characteristics of Briquettes Developed from Rice and Coffee Husks for Domestic Cooking Applications in Uganda. Renew Energy 2018, 118, 43–55. [Google Scholar] [CrossRef]
- Ujjinappa, S.; Sreepathi, L.K. Production and Quality Testing of Fuel Briquettes Made from Pongamia and Tamarind Shell. Sadhana—Acad. Proc. Eng. Sci. 2018, 43, 58. [Google Scholar] [CrossRef]
- IEA Technology Roadmap—Delivering Sustainable Bioenergy—Analysis—IEA. Available online: https://www.iea.org/reports/technology-roadmap-delivering-sustainable-bioenergy (accessed on 1 September 2022).
- Garrido, M.A.; Conesa, J.A.; Garcia, M.D. Characterization and Production of Fuel Briquettes Made from Biomass and Plastic Wastes. Energies 2017, 10, 850. [Google Scholar] [CrossRef]
- Variny, M.; Varga, A.; Rimár, M.; Janošovský, J.; Kizek, J.; Lukáč, L.; Jablonský, G.; Mierka, O. Advances in Biomass Co-Combustion with Fossil Fuels in the European Context: A Review. Processes 2021, 9, 100. [Google Scholar] [CrossRef]
- Vasileiadou, A. Reduction of CO2 Emissions Through the Co-Combustion of Lignite with Biomass Residues: Renewable and Non-Renewable CO2 per Produced Megajoule and Fuel Characterization. Therm. Sci. Eng. Prog. 2024, 50, 102566. [Google Scholar] [CrossRef]
- Purohit, P.; Chaturvedi, V. Biomass Pellets for Power Generation in India: A Techno-Economic Evaluation. Environ. Sci. Pollut. Res. 2018, 25, 29614–29632. [Google Scholar] [CrossRef]
- Falup, O.; Mircea, I.; Ivan, R.; Ionel, I. Novel Approach for the Current State of Greenhouse Gases Emissions. Rom. Case Study. J. Environ. Prot. Ecol. 2014, 15, 807–818. [Google Scholar]
- Lee, M.; Zhang, N. Technical Efficiency, Shadow Price of Carbon Dioxide Emissions, and Substitutability for Energy in the Chinese Manufacturing Industries. Energy Econ 2012, 34, 1492–1497. [Google Scholar] [CrossRef]
- Demirbas, A. Potential Applications of Renewable Energy Sources, Biomass Combustion Problems in Boiler Power Systems and Combustion Related Environmental Issues. Prog Energy Combust. Sci. 2005, 31, 171–192. [Google Scholar] [CrossRef]
- Goyal, H.B.; Seal, D.; Saxena, R.C. Bio-Fuels from Thermochemical Conversion of Renewable Resources: A Review. Renew. Sustain. Energy Rev. 2008, 12, 504–517. [Google Scholar] [CrossRef]
- Gürdil, G.A.K.; Selvi, K.C.; Malaták, J.; Pinar, Y. Biomass Utilization for Thermal Energy. AMA Agric. Mech. Asia Afr. Lat. Am. 2009, 20, 80–85. [Google Scholar]
- Mohan, D.; Pittman, C.U.; Steele, P.H. Pyrolysis of Wood/Biomass for Bio-Oil: A Critical Review. Energy Fuels 2006, 20, 848–889. [Google Scholar] [CrossRef]
- Key Advances in Biochar Research from 2024—Biochar Today. Available online: https://biochartoday.com/2024/12/20/key-advances-in-biochar-research-from-2024/?utm_source=chatgpt.com (accessed on 16 January 2025).
- Rajput, V.; Saini, I.; Parmar, S.; Pundir, V.; Kumar, V.; Kumar, V.; Naik, B.; Rustagi, S. Biochar Production Methods and Their Transformative Potential for Environmental Remediation. Discov. Appl. Sci. 2024, 6, 408. [Google Scholar] [CrossRef]
- Wu, P.; Fu, Y.; Vancov, T.; Wang, H.; Wang, Y.; Chen, W. Analyzing the Trends and Hotspots of Biochar’s Applications in Agriculture, Environment, and Energy: A Bibliometrics Study for 2022 and 2023. Biochar 2024, 6, 78. [Google Scholar] [CrossRef]
- Šafařík, D.; Hlaváčková, P.; Michal, J. Potential of Forest Biomass Resources for Renewable Energy Production in the Czech Republic. Energies 2022, 15, 47. [Google Scholar] [CrossRef]
- Rečka, L.; Ščasný, M. Brown Coal and Nuclear Energy Deployment: Effects on Fuel-Mix, Carbon Targets, and External Costs in the Czech Republic up to 2050. Fuel 2018, 216, 494–502. [Google Scholar] [CrossRef]
- Červenka, J.; Bače, R.; Brůna, J.; Wild, J.; Svoboda, M.; Heurich, M. Mapping of Mountain Temperate Forest Recovery After Natural Disturbance: A Large Permanent Plot Established on Czech-German Border. Silva Gabreta 2019, 25, 492–510. [Google Scholar]
- Purwestri, R.C.; Hájek, M.; Hochmalová, M.; Palátová, P.; Huertas-Bernal, D.C.; Garciá-Jácome, S.P.; Jarský, V.; Kašpar, J.; Riedl, M.; Marušák, R. The Role of Bioeconomy in the Czech National Forest Strategy: A Comparison with Sweden. Int. For. Rev. 2022, 23, 31–41. [Google Scholar] [CrossRef]
- Hlásny, T.; Zimová, S.; Merganičová, K.; Štěpánek, P.; Modlinger, R.; Turčáni, M. Devastating Outbreak of Bark Beetles in the Czech Republic: Drivers, Impacts, and Management Implications. For. Ecol. Manag. 2021, 490, 119075. [Google Scholar] [CrossRef]
- Cheng, T.; Veselská, T.; Křížková, B.; Švec, K.; Havlíček, V.; Stadler, M.; Kolařík, M. Insight into the Genomes of Dominant Yeast Symbionts of European Spruce Bark Beetle, Ips typographus. Front. Microbiol. 2023, 14, 1108975. [Google Scholar] [CrossRef]
- Blake, M.; Straw, N.; Kendall, T.; Whitham, T.; Manea, I.A.; Inward, D.; Jones, B.; Hazlitt, N.; Ockenden, A.; Deol, A.; et al. Recent Outbreaks of the Spruce Bark Beetle Ips typographus in the UK: Discovery, Management, and Implications. Trees For. People 2024, 16, 100508. [Google Scholar] [CrossRef]
- Netherer, S.; Schebeck, M.; Morgante, G.; Rentsch, V.; Kirisits, T. European Spruce Bark Beetle, Ips typographus (L.) Males Are Attracted to Bark Cores of Drought-Stressed Norway Spruce Trees with Impaired Defenses in Petri Dish Choice Experiments. Forests 2022, 13, 537. [Google Scholar] [CrossRef]
- Maitah, M.; Toth, D.; Malec, K.; Appiah-Kubi, S.N.K.; Maitah, K.; Pańka, D.; Prus, P.; Janků, J.; Romanowski, R. The Impacts of Calamity Logging on the Sustainable Development of Spruce Fuel Biomass Prices and Spruce Pulp Prices in the Czech Republic. Forests 2022, 13, 97. [Google Scholar] [CrossRef]
- Eurostat Forests, Forestry and Logging—Statistics Explained. Available online: https://ec.europa.eu/eurostat/statistics-explained/index.php?title=Forests,_forestry_and_logging#Forests_in_the_EU (accessed on 30 September 2022).
- Nosek, R.; Tun, M.M.; Juchelkova, D. Energy Utilization of Spent Coffee Grounds in the Form of Pellets. Energies 2020, 13, 1235. [Google Scholar] [CrossRef]
- Chen, Y.C.; Jhou, S.Y. Integrating Spent Coffee Grounds and Silver Skin as Biofuels Using Torrefaction. Renew Energy 2020, 148, 275–283. [Google Scholar] [CrossRef]
- Cardarelli, A.; Pinzi, S.; Barbanera, M. Effect of Torrefaction Temperature on Spent Coffee Grounds Thermal Behaviour and Kinetics. Renew Energy 2022, 185, 704–716. [Google Scholar] [CrossRef]
- Malaťák, J.; Passian, L. Heat-Emission Analysis of Small Combustion Equipments for Biomass. Res. Agric. Eng. 2011, 57, 37–50. [Google Scholar] [CrossRef]
- Malaták, J.; Velebil, J.; Bradna, J.; Gendek, A.; Tamelová, B. Evaluation of Co and NoxEmissions in Real-Life Operating Conditions of Herbaceous Biomass Briquettes Combustion. Acta Technol. Agric. 2020, 23, 53–59. [Google Scholar] [CrossRef]
- Tamelová, B.; Malaťák, J.; Velebil, J.; Gendek, A.; Aniszewska, M. Impact of Torrefaction on Fuel Properties of Aspiration Cleaning Residues. Materials 2022, 15, 6949. [Google Scholar] [CrossRef] [PubMed]
- Oldfield, T.L.; Sikirica, N.; Mondini, C.; López, G.; Kuikman, P.J.; Holden, N.M. Biochar, Compost and Biochar-Compost Blend as Options to Recover Nutrients and Sequester Carbon. J. Environ. Manag. 2018, 218, 465–476. [Google Scholar] [CrossRef] [PubMed]
- Sang, F.; Yin, Z.; Wang, W.; Almatrafi, E.; Wang, Y.; Zhao, B.; Gong, J.; Zhou, C.; Zhang, C.; Zeng, G.; et al. Degradation of Ciprofloxacin Using Heterogeneous Fenton Catalysts Derived from Natural Pyrite and Rice Straw Biochar. J. Clean. Prod. 2022, 378, 134459. [Google Scholar] [CrossRef]
- Onsree, T.; Tippayawong, N.; Phithakkitnukoon, S.; Lauterbach, J. Interpretable Machine-Learning Model with a Collaborative Game Approach to Predict Yields and Higher Heating Value of Torrefied Biomass. Energy 2022, 249, 123676. [Google Scholar] [CrossRef]
- Ni, Z.; Bi, H.; Jiang, C.; Wang, C.; Tian, J.; Zhou, W.; Sun, H.; Lin, Q. Investigation of the Co-Pyrolysis of Coal Slime and Coffee Industry Residue Based on Machine Learning Methods and TG-FTIR: Synergistic Effect, Kinetics and Thermodynamic. Fuel 2021, 305, 121527. [Google Scholar] [CrossRef]
- Wang, X.; Deng, S.; Tan, H.; Adeosun, A.; Vujanović, M.; Yang, F.; Duić, N. Synergetic Effect of Sewage Sludge and Biomass Co-Pyrolysis: A Combined Study in Thermogravimetric Analyzer and a Fixed Bed Reactor. Energy Convers Manag. 2016, 118, 399–405. [Google Scholar] [CrossRef]
- Wang, L.; Xie, L.; Ma, H.; Zhou, J. Co-Pyrolysis of Pine Sawdust with Nickel Formate for Understanding Interaction Mechanisms and Enhancing Resistance Toward Biochar Deposition. J. Mater. Res. Technol. 2022, 18, 3751–3763. [Google Scholar] [CrossRef]
- Gendek, A.; Aniszewska, M.; Owoc, D.; Tamelová, B.; Malaťák, J.; Velebil, J.; Krilek, J. Physico-Mechanical and Energy Properties of Pellets Made from Ground Walnut Shells, Coniferous Tree Cones and Their Mixtures. Renew Energy 2023, 211, 248–258. [Google Scholar] [CrossRef]
- Singh, E.; Mishra, R.; Kumar, A.; Shukla, S.K.; Lo, S.L.; Kumar, S. Circular Economy-Based Environmental Management Using Biochar: Driving Towards Sustainability. Process Saf. Environ. Prot. 2022, 163, 585–600. [Google Scholar] [CrossRef]
- Meyer, S.; Glaser, B.; Quicker, P. Technical, Economical, and Climate-Related Aspects of Biochar Production Technologies: A Literature Review. Environ. Sci. Technol. 2011, 45, 9473–9483. [Google Scholar] [CrossRef]
- Vuppaladadiyam, A.K.; Vuppaladadiyam, S.S.V.; Sahoo, A.; Murugavelh, S.; Anthony, E.; Bhashkar, T.; Zheng, Y.; Zhao, M.; Duan, H.; Zhao, Y.; et al. Bio-Oil and Biochar from the Pyrolytic Conversion of Biomass: A Current and Future Perspective on the Trade-Off Between Economic, Environmental, and Technical Indicators. Sci. Total Environ. 2023, 857, 159155. [Google Scholar] [CrossRef] [PubMed]
- Majumder, S.; Neogi, S.; Dutta, T.; Powel, M.A.; Banik, P. The Impact of Biochar on Soil Carbon Sequestration: Meta-Analytical Approach to Evaluating Environmental and Economic Advantages. J. Environ. Manag. 2019, 250, 109466. [Google Scholar] [CrossRef]
- Lisowski, A.; Matkowski, P.; Dąbrowska, M.; Piątek, M.; Świętochowski, A.; Klonowski, J.; Mieszkalski, L.; Reshetiuk, V. Particle Size Distribution and Physicochemical Properties of Pellets Made of Straw, Hay, and Their Blends. Waste Biomass Valorization 2020, 11, 63–75. [Google Scholar] [CrossRef]
- Tripathi, M.; Sahu, J.N.; Ganesan, P. Effect of Process Parameters on Production of Biochar from Biomass Waste Through Pyrolysis: A Review. Renew. Sustain. Energy Rev. 2016, 55, 467–481. [Google Scholar]
- Wilk, M.; Magdziarz, A.; Kalemba, I.; Gara, P. Carbonisation of Wood Residue into Charcoal During Low Temperature Process. Renew Energy 2016, 85, 507–513. [Google Scholar] [CrossRef]
- Aniszewska, M.; Gendek, A.; Hýsek, Š.; Malat’ák, J.; Velebil, J.; Tamelová, B. Changes in the Composition and Surface Properties of Torrefied Conifer Cones. Materials 2020, 13, 5660. [Google Scholar] [CrossRef]
- The European Parliament and the Council of the European Union Directive (EU) 2023/2413 of the European Parliament and of the Council of 18 October 2023 Amending Directive (EU) 2018/2001, Regulation (EU) 2018/1999 and Directive 98/70/EC as Regards the Promotion of Energy from Renewable Sources, and Repealing Council Directive (EU) 2015/652; European Parliament: Bruxelles, Belgium, 2023.
- Jeníček, L.; Tunklová, B.; Malat’ák, J.; Neškudla, M.; Velebil, J. Use of Spent Coffee Ground as an Alternative Fuel and Possible Soil Amendment. Materials 2022, 15, 6722. [Google Scholar] [CrossRef]
- Jenicek, L.; Neskudla, M.; Malatak, J.; Velebil, J.; Passian, L. Spruce and Barley Elemental and Stochiometric Analysis Affected by the Impact of Pellet Production and Torrefaction. Acta Technol. Agric. 2021, 24, 166–172. [Google Scholar] [CrossRef]
- Tunklová, B.; Jeníček, L.; Malaťák, J.; Neškudla, M.; Velebil, J.; Hnilička, F. Properties of Biochar Derived from Tea Waste as an Alternative Fuel and Its Effect on Phytotoxicity of Seed Germination for Soil Applications. Materials 2022, 15, 8709. [Google Scholar] [CrossRef]
- Jeníček, L.; Tunklová, B.; Malaťák, J.; Velebil, J.; Malaťáková, J.; Neškudla, M.; Hnilička, F. The Impact of Nutshell Biochar on the Environment as an Alternative Fuel or as a Soil Amendment. Materials 2023, 16, 2074. [Google Scholar] [CrossRef]
- Chen, W.H.; Kuo, P.C. Torrefaction and Co-Torrefaction Characterization of Hemicellulose, Cellulose and Lignin as Well as Torrefaction of Some Basic Constituents in Biomass. Energy 2011, 36, 803–811. [Google Scholar] [CrossRef]
- Chen, W.H.; Lin, B.J.; Lin, Y.Y.; Chu, Y.S.; Ubando, A.T.; Show, P.L.; Ong, H.C.; Chang, J.S.; Ho, S.H.; Culaba, A.B.; et al. Progress in Biomass Torrefaction: Principles, Applications and Challenges. Prog. Energy Combust. Sci. 2021, 82. [Google Scholar] [CrossRef]
- Lesy ČR O Dřevě|Lesy České Republiky, s. p. Available online: https://lesycr.cz/drevo/ (accessed on 30 September 2022).
- International Coffee Organization—What’s New. Available online: https://www.ico.org/ (accessed on 26 August 2022).
- Rajesh Banu, J.; Yukesh Kannah, R.; Dinesh Kumar, M.; Preethi; Kavitha, S.; Gunasekaran, M.; Zhen, G.; Awasthi, M.K.; Kumar, G. Spent Coffee Grounds Based Circular Bioeconomy: Technoeconomic and Commercialization Aspects. Renew. Sustain. Energy Rev. 2021, 152, 111721. [Google Scholar] [CrossRef]
- ICO International Coffee Organization—Trade Statistics Tables. Available online: https://www.icocoffee.org/documents/cy2024-25/coffee-development-report-2022-23.pdf (accessed on 26 August 2022).
- ČSÚ Spotřeba Potravin—2020|ČSÚ. Available online: https://www.czso.cz/csu/czso/spotreba-potravin (accessed on 1 October 2022).
- Campos-Vega, R.; Loarca-Piña, G.; Vergara-Castañeda, H.A.; Oomah, B.D. Spent Coffee Grounds: A Review on Current Research and Future Prospects. Trends Food Sci. Technol. 2015, 45, 24–36. [Google Scholar] [CrossRef]
- Tokimoto, T.; Kawasaki, N.; Nakamura, T.; Akutagawa, J.; Tanada, S. Removal of Lead Ions in Drinking Water by Coffee Grounds as Vegetable Biomass. J. Colloid. Interface Sci. 2005, 281, 56–61. [Google Scholar] [CrossRef] [PubMed]
- Mussatto, S.I.; Machado, E.M.S.; Martins, S.; Teixeira, J.A. Production, Composition, and Application of Coffee and Its Industrial Residues. Food Bioprocess Technol. 2011, 4, 661–672. [Google Scholar] [CrossRef]
- Vivek, V. Global Market Report: Tea|International Institute for Sustainable Development. Available online: https://www.iisd.org/publications/report/global-market-report-tea (accessed on 1 October 2022).
- Doublet, G.; Jungbluth, N. Life Cycle Assessement of Drinking Darjeeling Tea. In Conventional and Organic Darjeeling Tea; ESU-services Ltd.: Uster, Switzerland, 2010. [Google Scholar]
- Cabrera, C.; Artacho, R.; Giménez, R. Beneficial Effects of Green Tea—A Review. J. Am. Coll. Nutr. 2006, 25, 79–99. [Google Scholar] [CrossRef]
- Akbayrak, S.; Özçifçi, Z.; Tabak, A. Activated Carbon Derived from Tea Waste: A Promising Supporting Material for Metal Nanoparticles Used as Catalysts in Hydrolysis of Ammonia Borane. Biomass Bioenergy 2020, 138, 105589. [Google Scholar] [CrossRef]
- Taşar, Ş. Thermal Conversion Behavior of Cellulose and Hemicellulose Fractions Isolated from Tea Leaf Brewing Waste: Kinetic and Thermodynamic Evaluation. Biomass Convers Biorefin. 2022, 12, 2935–2947. [Google Scholar] [CrossRef]
- Xu, J.; Wang, M.; Zhao, J.; Wang, Y.H.; Tang, Q.; Khan, I.A. Yellow Tea (Camellia Sinensis L.), a Promising Chinese Tea: Processing, Chemical Constituents and Health Benefits. Food Res. Int. 2018, 107, 567–577. [Google Scholar] [CrossRef]
- Mizuno, S.; Ida, T.; Fuchihata, M.; Namba, K. Effect of Specimen Size on Ultimate Compressive Strength of Bio-Coke Produced from Green Tea Grounds. Mech. Eng. J. 2016, 3, 15–00441. [Google Scholar] [CrossRef]
- Pua, F.L.; Subari, M.S.; Ean, L.W.; Krishnan, S.G. Characterization of Biomass Fuel Pellets Made from Malaysia Tea Waste and Oil Palm Empty Fruit Bunch. Mater. Today Proc. 2020, 31, 187–190. [Google Scholar] [CrossRef]
- Intagun, W.; Kanoksilapatham, W.; Maden, A.; Nobaew, B. Effect of Natural Additive on Pellets Physical Properties and Energy Cost. In Proceedings of the 2019 IEEE 2nd International Conference on Renewable Energy and Power Engineering, REPE 2019, Toronto, ON, Canada, 2–4 November 2019; pp. 130–134. [Google Scholar] [CrossRef]
- Zhang, J.; Guo, Y. Physical Properties of Solid Fuel Briquettes Made from Caragana korshinskii Kom. Powder Technol. 2014, 256, 293–299. [Google Scholar] [CrossRef]
- Zhang, L.; Xu, C.C.; Lei, H.; Wang, H.L.; Ning, T.T.; Hao, W.; Hu, X.D. Effects of Addition of Various Ingredients During Pelletizing on Physical Characteristics of Green Tea Residue Pellets. Appl. Eng. Agric. 2014, 30, 49–53. [Google Scholar] [CrossRef]
- McCaffrey, Z.; Torres, L.; Sen Chiou, B.; Ferreira, S.R.; Silva, L.E.; Wood, D.F.; Orts, W.J. Torrefaction of Almond and Walnut Byproducts. Front. Energy Res. 2021, 9, 91. [Google Scholar] [CrossRef]
- Almond Board of California Crop Reports|Almond Almanac Report. Available online: https://www.almonds.com/tools-and-resources/crop-reports/almond-almanac (accessed on 1 September 2022).
- 2021 California Agricultural Statistics Review. Available Online|California Avocado Commission. Available online: https://www.californiaavocadogrowers.com/articles/2021-california-agricultural-statistics-review-available-online (accessed on 1 September 2022).
- Espina, R.U.; Barroca, R.B.; Abundo, M.L.S. Proximate Analysis of the Torrefied Coconut Shells. Int. J. Renew. Energy Res. IJRER 2022, 12, 489–494. [Google Scholar] [CrossRef]
- Silva, M.P.; Nieva Lobos, M.L.; Piloni, R.V.; Dusso, D.; González Quijón, M.E.; Scopel, A.L.; Moyano, E.L. Pyrolytic Biochars from Sunflower Seed Shells, Peanut Shells and Spirulina Algae: Their Potential as Soil Amendment and Natural Growth Regulators. SN Appl. Sci. 2020, 2, 1926. [Google Scholar] [CrossRef]
- Ahmad, M.; Lee, S.S.; Dou, X.; Mohan, D.; Sung, J.K.; Yang, J.E.; Ok, Y.S. Effects of Pyrolysis Temperature on Soybean Stover-and Peanut Shell-Derived Biochar Properties and TCE Adsorption in Water. Bioresour. Technol. 2012, 118, 36–54. [Google Scholar] [CrossRef]
- Apaydin-Varol, E.; Pütün, E.; Pütün, A.E. Slow Pyrolysis of Pistachio Shell. Fuel 2007, 86, 1892–1899. [Google Scholar] [CrossRef]
- Yuan, H.R.; Liu, R.H. Study on Pyrolysis Kinetics of Walnut Shell. J. Therm. Anal. Calorim. 2007, 89, 983–986. [Google Scholar] [CrossRef]
- Açıkalın, K. Thermogravimetric Analysis of Walnut Shell as Pyrolysis Feedstock. J. Therm. Anal. Calorim. 2011, 105, 145–150. [Google Scholar] [CrossRef]
- Wang, Q.; Sarkar, J. Pyrolysis Behaviors of Waste Coconut Shell and Husk Biomasses. Int. J. Energy Prod. Manag. 2018, 3, 34–43. [Google Scholar] [CrossRef]
- Putri, R.W.; Rahmatullah; Haryati, S.; Santoso, B.; Hadi, A.A. The Residence Time and Slow Pyrolysis Temperature Effect on Chemical Composition Pyrolysis Gas Product of Durian (Durio zibethinus Murr) Skin. Chem. Eng. Trans. 2022, 97, 247–252. [Google Scholar] [CrossRef]
- Trubetskaya, A.; Grams, J.; Leahy, J.J.; Johnson, R.; Gallagher, P.; Monaghan, R.F.D.; Kwapinska, M. The Effect of Particle Size, Temperature and Residence Time on the Yields and Reactivity of Olive Stones from Torrefaction. Renew Energy 2020, 160, 998–1011. [Google Scholar] [CrossRef]
- ISO 18125:2017; Solid Biofuels—Determination of Calorific Value. BSI: London, UK, 2017. Available online: https://www.iso.org/standard/61517.html (accessed on 16 January 2025).
- ISO 18122:2022; Solid Biofuels—Determination of Ash Content. ISO: Geneva, Switzerland, 2022. Available online: https://www.iso.org/standard/83190.html (accessed on 16 January 2025).
- ISO 18134-2:2024; Solid Biofuels—Determination of Moisture Content—Part 2: Simplified Method. ISO: Geneva, Switzerland, 2024. Available online: https://www.iso.org/standard/86024.html (accessed on 16 January 2025).
- Recent Developments in Biomass Pelletization—A Review: BioResources. Available online: https://bioresources.cnr.ncsu.edu/resources/recent-developments-in-biomass-pelletization-a-review/ (accessed on 8 June 2024).
- Malaťák, J.; Jankovský, M.; Malaťáková, J.; Velebil, J.; Gendek, A.; Aniszewska, M. Substituting Solid Fossil Fuels with Torrefied Timber Products. Materials 2023, 16, 7569. [Google Scholar] [CrossRef]
- Arias, B.; Pevida, C.; Fermoso, J.; Plaza, M.G.; Rubiera, F.; Pis, J.J. Influence of Torrefaction on the Grindability and Reactivity of Woody Biomass. Fuel Process. Technol. 2008, 89, 169–175. [Google Scholar] [CrossRef]
- Fermoso, J.; Mašek, O. Thermochemical Decomposition of Coffee Ground Residues by TG-MS: A Kinetic Study. J. Anal. Appl. Pyrolysis. 2018, 130, 249–255. [Google Scholar] [CrossRef]
- Mašek, O.; Brownsort, P.; Cross, A.; Sohi, S. Influence of Production Conditions on the Yield and Environmental Stability of Biochar. Fuel 2013, 103, 151–155. [Google Scholar] [CrossRef]
- Mayson, S.; Williams, I.D. Applying a Circular Economy Approach to Valorize Spent Coffee Grounds. Resour. Conserv. Recycl. 2021, 172, 105659. [Google Scholar] [CrossRef]
- Silva, M.A.; Nebra, S.A.; Machado Silva, M.J.; Sanchez, C.G. The Use of Biomass Residues in the Brazilian Soluble Coffee Industry. Biomass Bioenergy 1998, 14, 457–467. [Google Scholar] [CrossRef]
- Colantoni, A.; Paris, E.; Bianchini, L.; Ferri, S.; Marcantonio, V.; Carnevale, M.; Palma, A.; Civitarese, V.; Gallucci, F. Spent Coffee Ground Characterization, Pelletization Test and Emissions Assessment in the Combustion Process. Sci. Rep. 2021, 11, 5119. [Google Scholar] [CrossRef]
- Sermyagina, E.; Saari, J.; Kaikko, J.; Vakkilainen, E. Integration of Torrefaction and CHP Plant: Operational and Economic Analysis. Appl. Energy 2016, 183, 88–99. [Google Scholar] [CrossRef]
- Vassilev, S.V.; Baxter, D.; Andersen, L.K.; Vassileva, C.G. An Overview of the Chemical Composition of Biomass. Fuel 2010, 89, 913–933. [Google Scholar] [CrossRef]
- Gendek, A.; Piętka, J.; Aniszewska, M.; Malaťák, J.; Velebil, J.; Tamelová, B.; Krilek, J.; Moskalik, T. Energy Value of Silver Fir (Abies alba) and Norway Spruce (Picea abies) Wood Depending on the Degree of Its Decomposition by Selected Fungal Species. Renew Energy 2023, 215, 118948. [Google Scholar] [CrossRef]
- Kovalcik, A.; Obruca, S.; Marova, I. Valorization of Spent Coffee Grounds: A Review. Food Bioprod. Process. 2018, 110, 104–119. [Google Scholar]
- McNutt, J.; He, Q. (Sophia) Spent Coffee Grounds: A Review on Current Utilization. J. Ind. Eng. Chem. 2019, 71, 78–88. [Google Scholar]
- Nepal, R.; Kim, H.J.; Poudel, J.; Oh, S.C. A Study on Torrefaction of Spent Coffee Ground to Improve Its Fuel Properties. Fuel 2022, 318, 123643. [Google Scholar] [CrossRef]
- Bejenari, V.; Marcu, A.; Ipate, A.M.; Rusu, D.; Tudorachi, N.; Anghel, I.; Şofran, I.E.; Lisa, G. Physicochemical Characterization and Energy Recovery of Spent Coffee Grounds. J. Mater. Res. Technol. 2021, 15, 4437–4451. [Google Scholar] [CrossRef]
- Ballesteros, L.F.; Teixeira, J.A.; Mussatto, S.I. Chemical, Functional, and Structural Properties of Spent Coffee Grounds and Coffee Silverskin. Food Bioproc. Technol. 2014, 7, 3493–3503. [Google Scholar] [CrossRef]
- Sermyagina, E.; Mendoza Martinez, C.L.; Nikku, M.; Vakkilainen, E. Spent Coffee Grounds and Tea Leaf Residues: Characterization, Evaluation of Thermal Reactivity and Recovery of High-Value Compounds. Biomass Bioenergy 2021, 150, 106141. [Google Scholar] [CrossRef]
- Liu, Z.; Jiang, Z.; Cai, Z.; Fei, B.; Yu, Y.; Liu, X. Effects of Carbonization Conditions on Properties of Bamboo Pellets. Renew Energy 2013, 51, 1–6. [Google Scholar] [CrossRef]
- Skanderová, K.; Malaťák, J.; Bradna, J. Energy Use of Compost Pellets for Small Combustion Plants. Agron. Res. 2015, 13, 413–419. [Google Scholar]
- Weber, K.; Quicker, P. Properties of Biochar. Fuel 2018, 217, 240–261. [Google Scholar] [CrossRef]
- van Loo, S.; Koppejan, J. The Handbook of Biomass Combustion and Co-Firing. In The Handbook of Biomass Combustion and Co-Firing; Routledge: London, UK, 2012; pp. 1–442. [Google Scholar] [CrossRef]
- Biomasa pro Výrobu Energie—Jan Malaťák, Petr Vaculík, Brožovaná Vazba, Český Jazyk|Knihy Na Martinus.Cz. Available online: https://www.martinus.cz/?uItem=73504 (accessed on 30 September 2022).
- Zhang, W.; Jiang, S.; Wang, K.; Wang, L.; Xu, Y.; Wu, Z.; Shao, H.; Wang, Y.; Miao, M. Thermogravimetric Dynamics and FTIR Analysis on Oxidation Properties of Low-Rank Coal at Low and Moderate Temperatures. Int. J. Coal Prep. Util. 2015, 35, 39–50. [Google Scholar] [CrossRef]
- Haykiri-Acma, H.; Yaman, S. Synergy in Devolatilization Characteristics of Lignite and Hazelnut Shell During Co-Pyrolysis. Fuel 2007, 86, 373–380. [Google Scholar] [CrossRef]
Disclaimer/Publisher’s Note: The statements, opinions and data contained in all publications are solely those of the individual author(s) and contributor(s) and not of MDPI and/or the editor(s). MDPI and/or the editor(s) disclaim responsibility for any injury to people or property resulting from any ideas, methods, instructions or products referred to in the content. |
© 2025 by the authors. Licensee MDPI, Basel, Switzerland. This article is an open access article distributed under the terms and conditions of the Creative Commons Attribution (CC BY) license (https://creativecommons.org/licenses/by/4.0/).