Figure 1.
3D CAD model of gear wheel.
Figure 1.
3D CAD model of gear wheel.
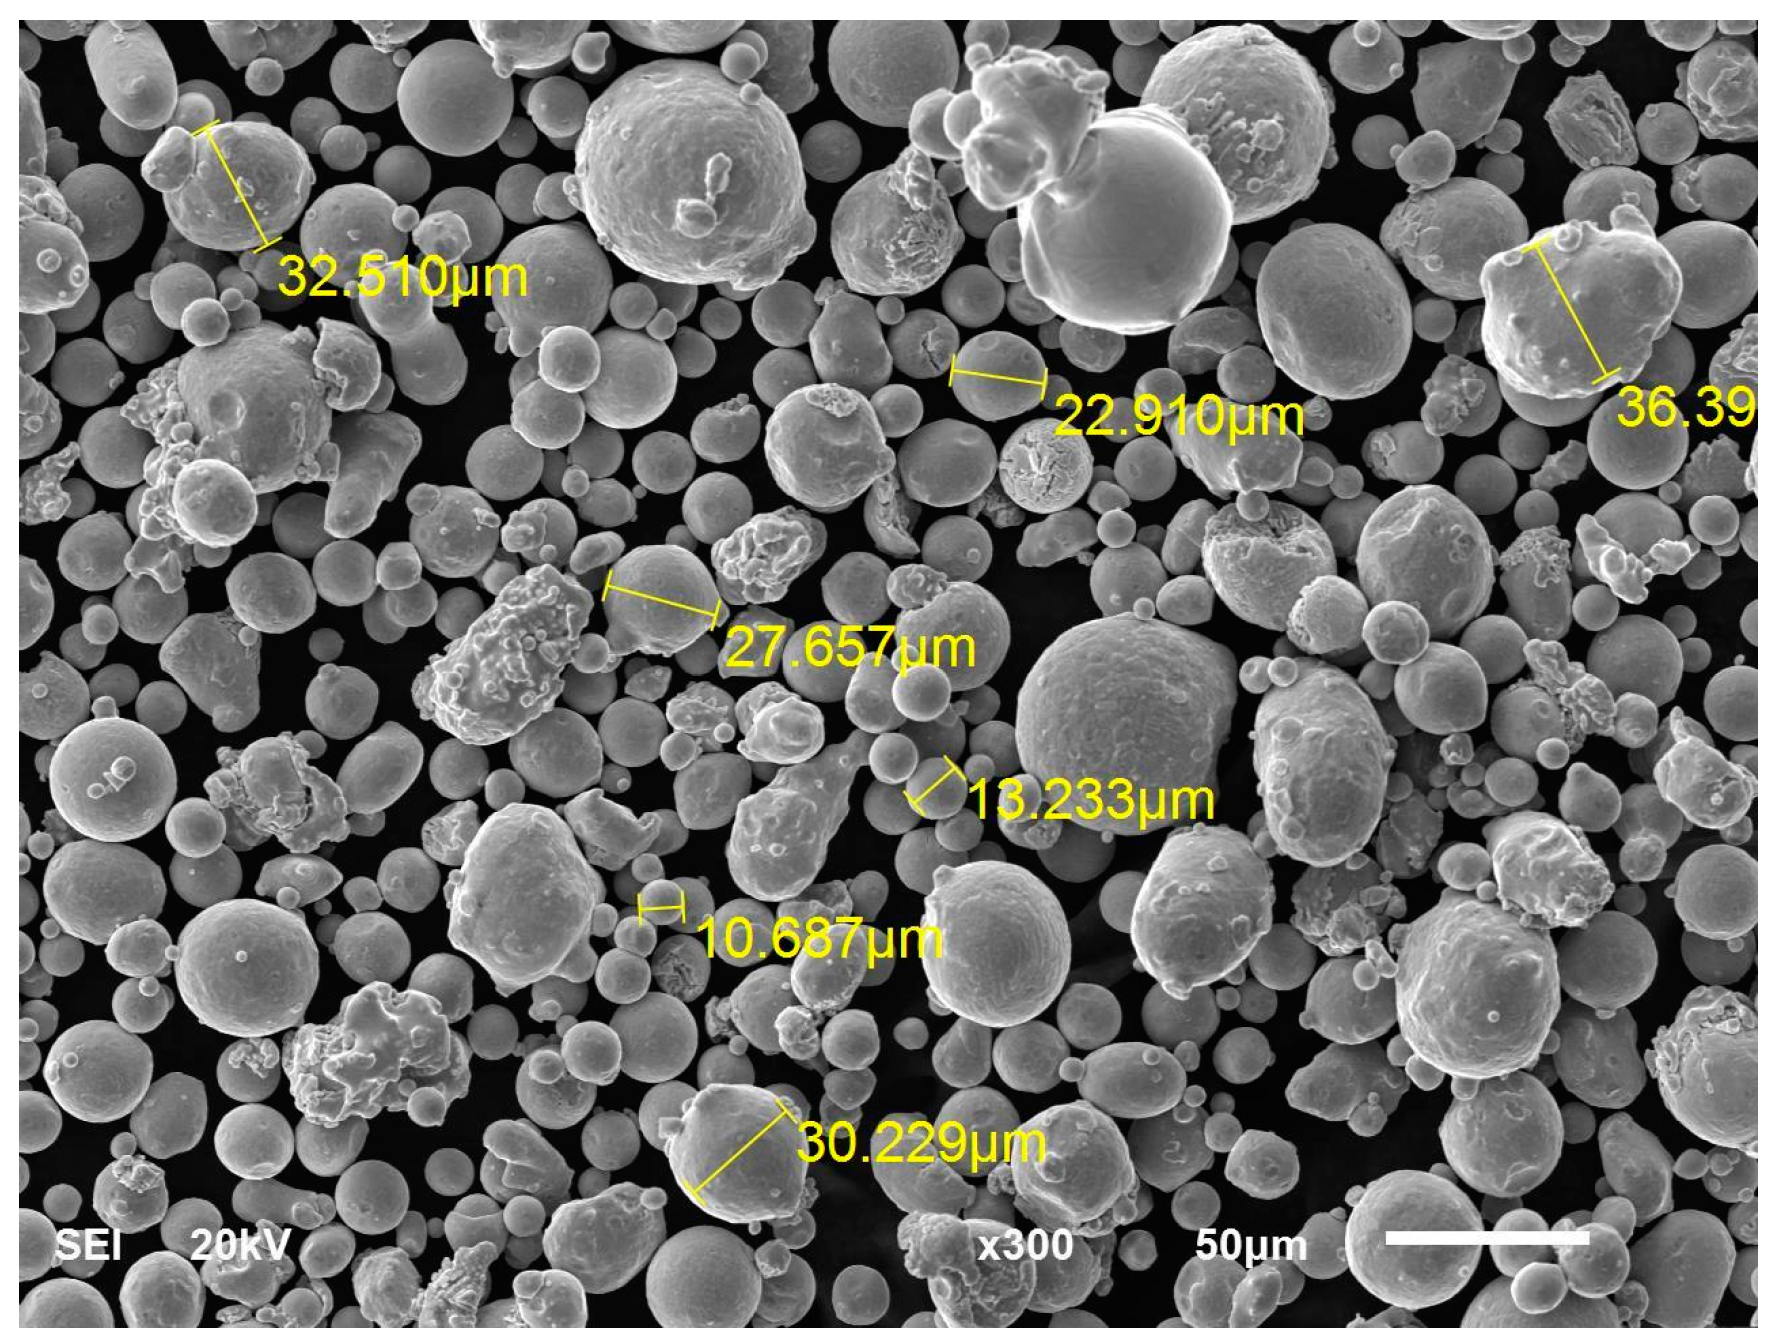
Figure 2.
Powder grains used during the implementation of the study SEM.
Figure 2.
Powder grains used during the implementation of the study SEM.
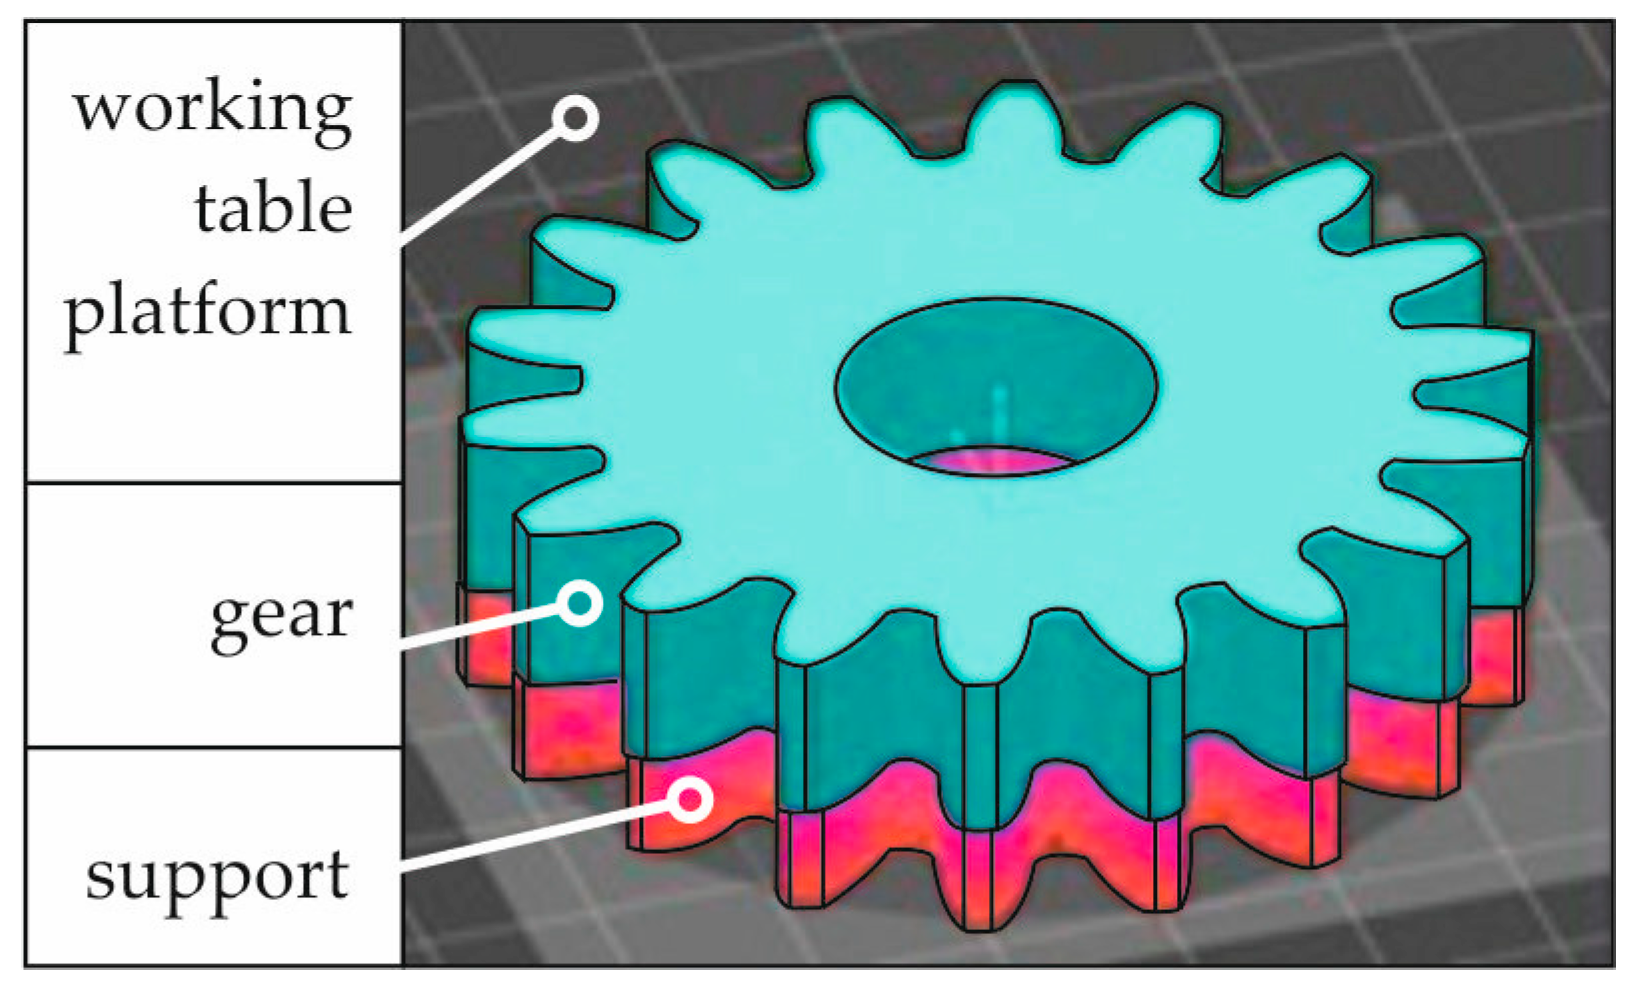
Figure 3.
The positioning of the gear on the working table platform during 3D printing.
Figure 3.
The positioning of the gear on the working table platform during 3D printing.
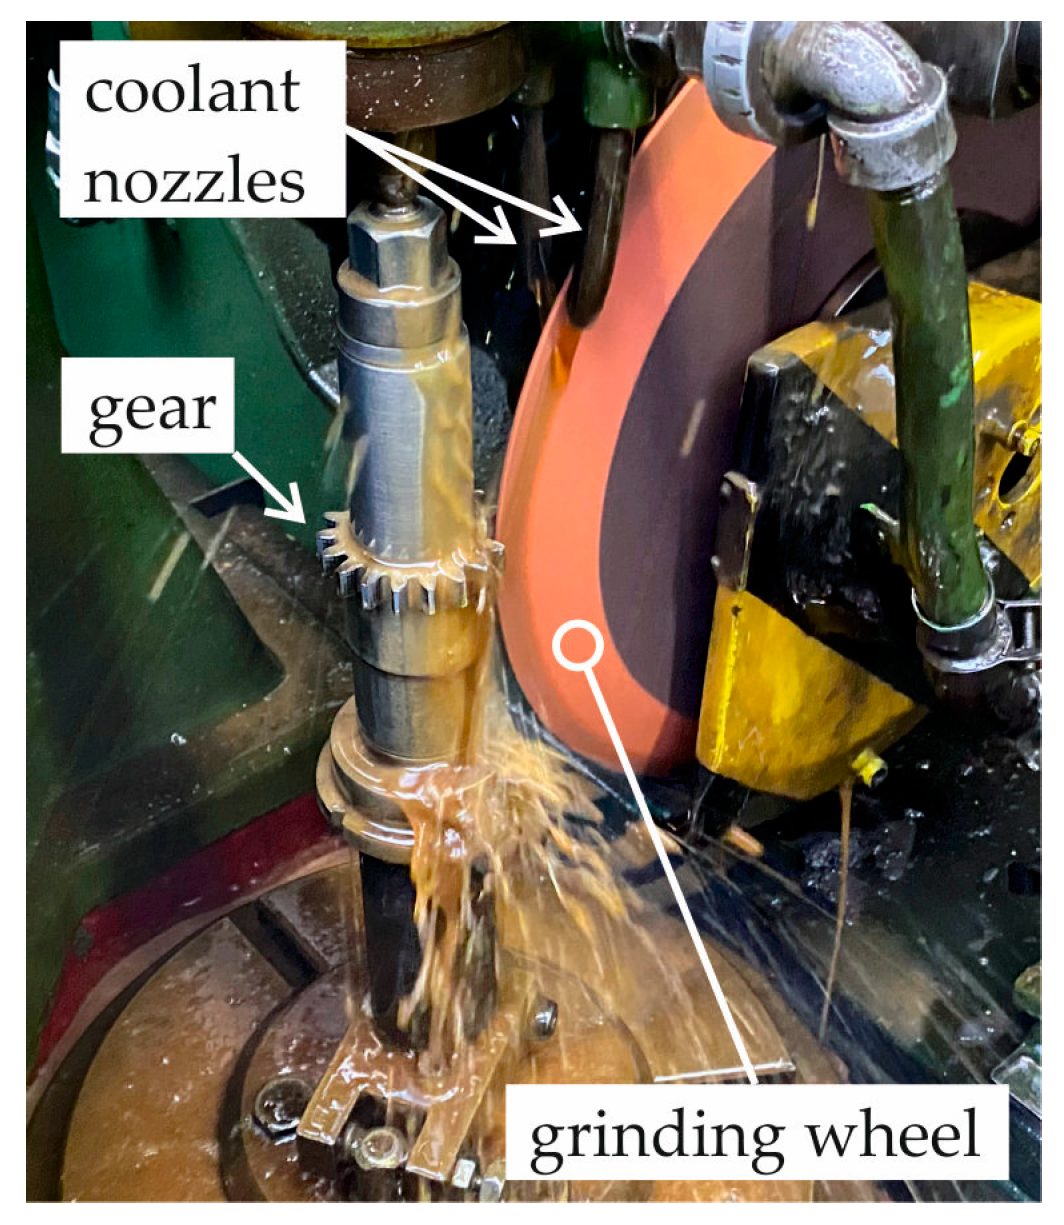
Figure 4.
View of workspace during grinding of gear teeth.
Figure 4.
View of workspace during grinding of gear teeth.
Figure 5.
Diagram of the arrangement of the elements of the gear wheel subjected to surface roughness measurements.
Figure 5.
Diagram of the arrangement of the elements of the gear wheel subjected to surface roughness measurements.
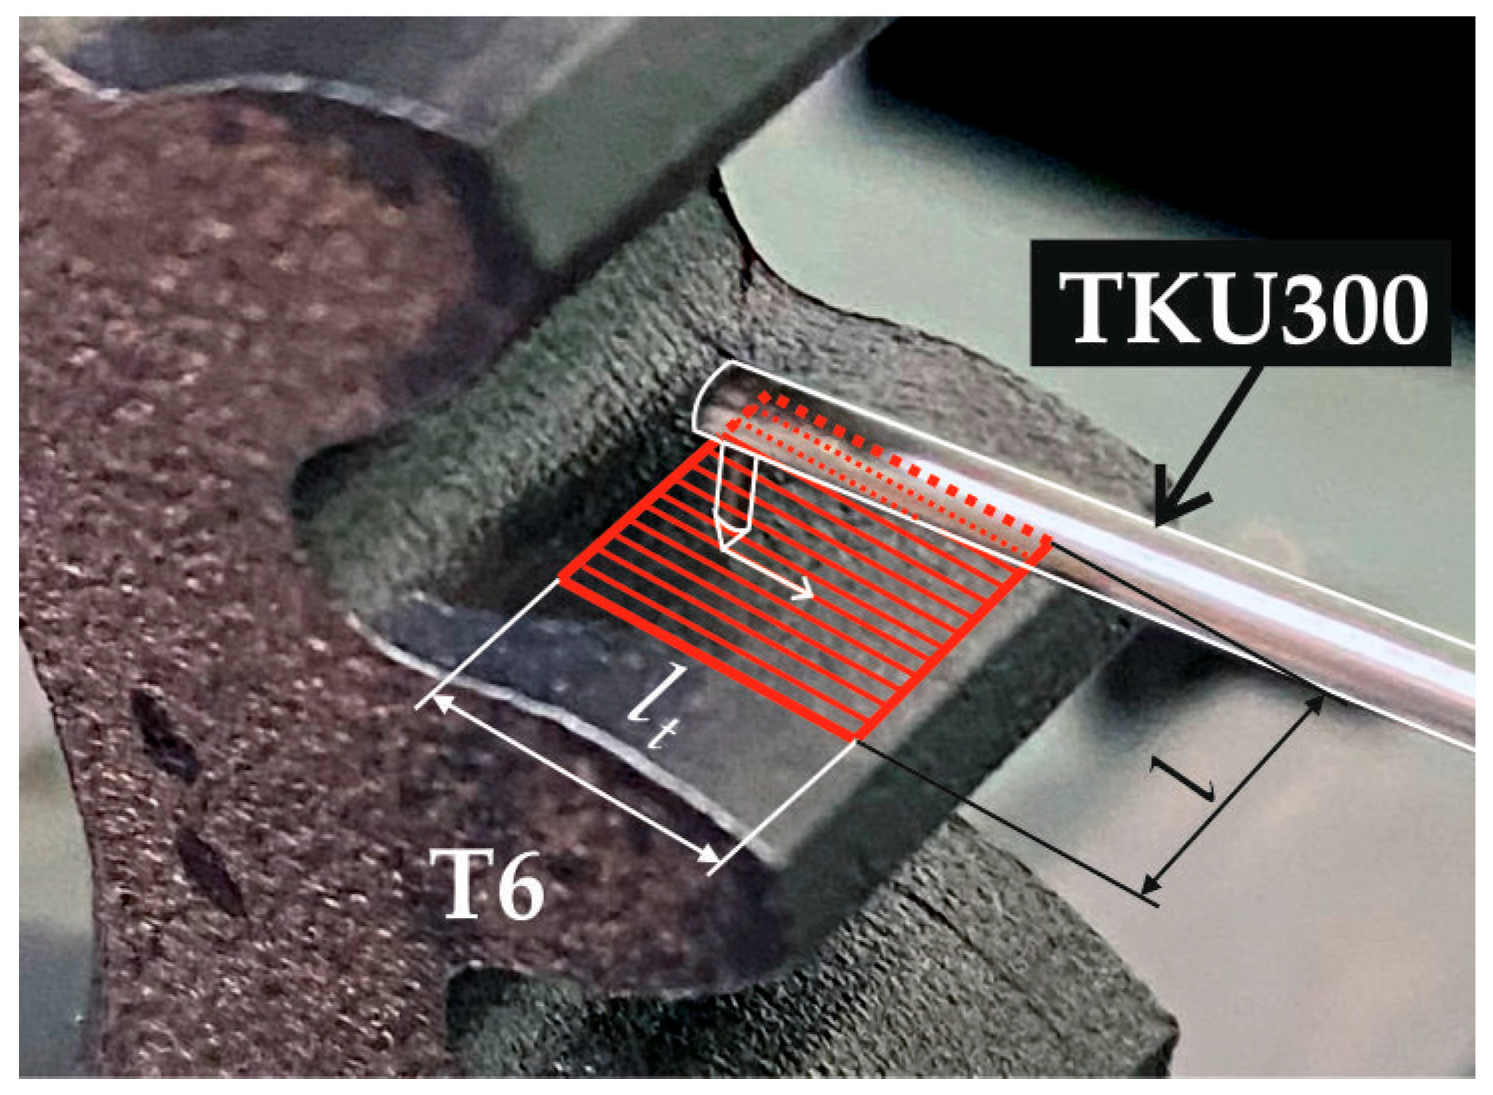
Figure 6.
Diagram of the measurement of the topography of the working surface of the tooth of a gear wheel.
Figure 6.
Diagram of the measurement of the topography of the working surface of the tooth of a gear wheel.
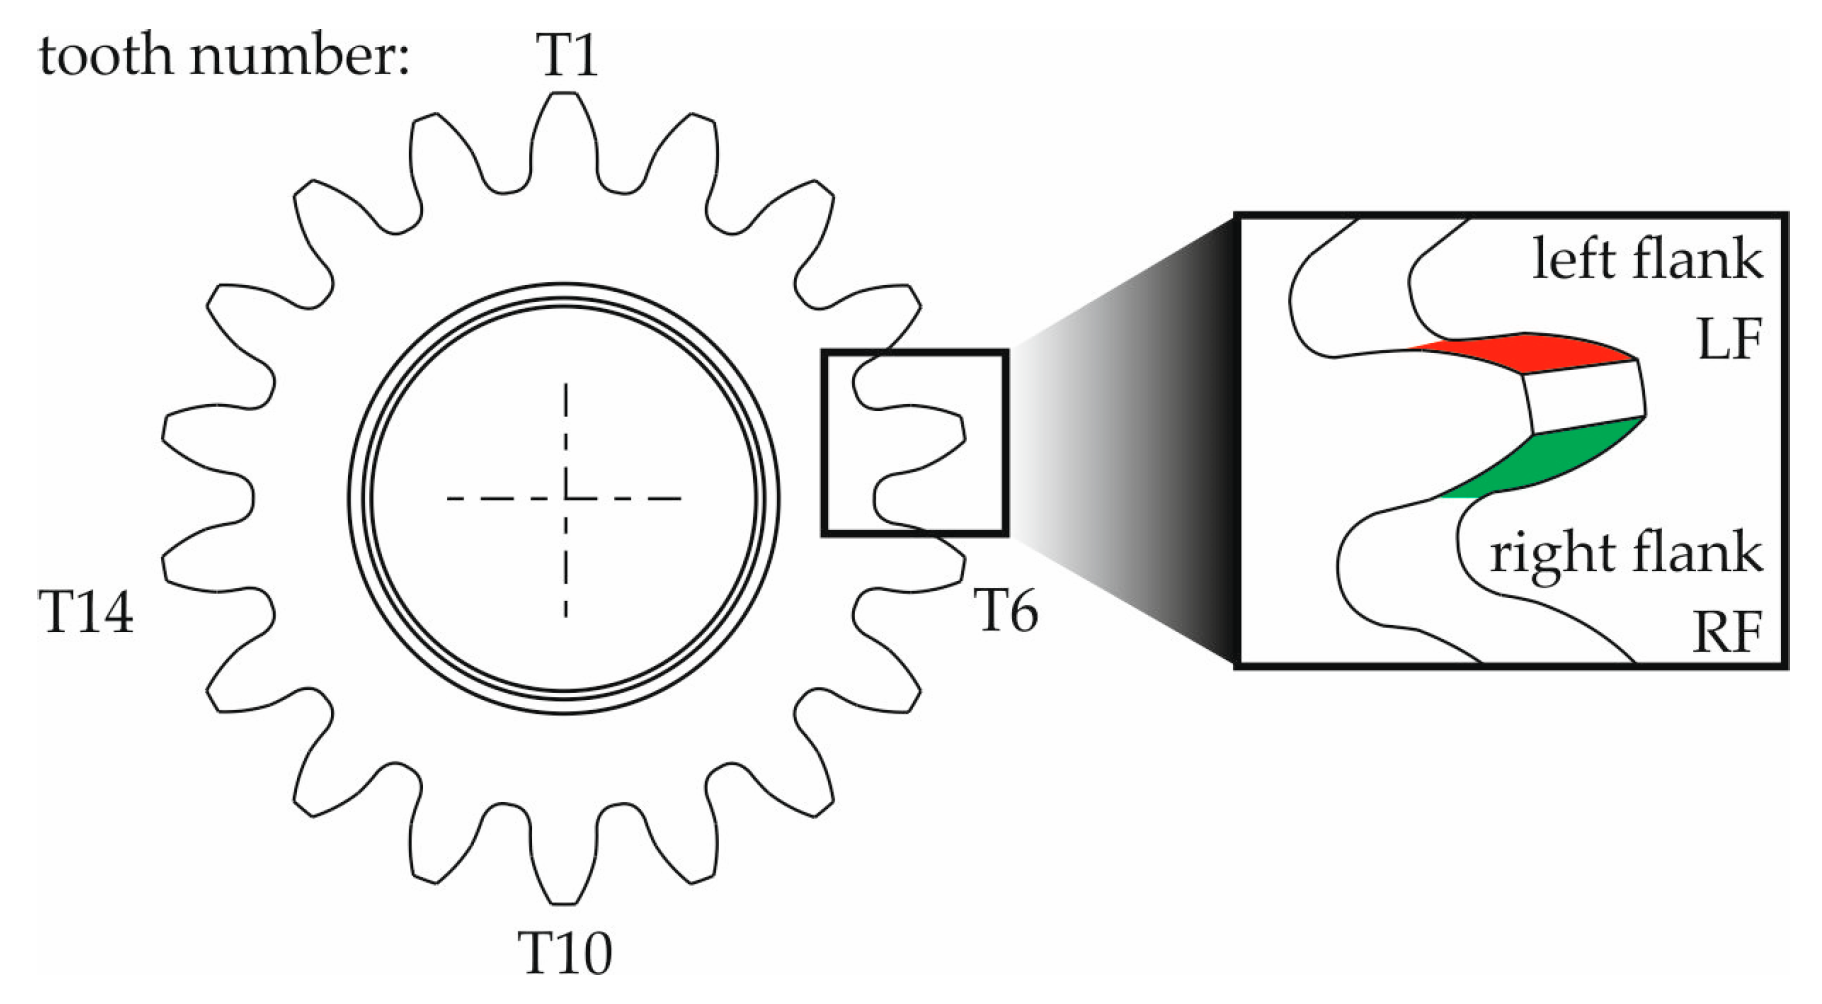
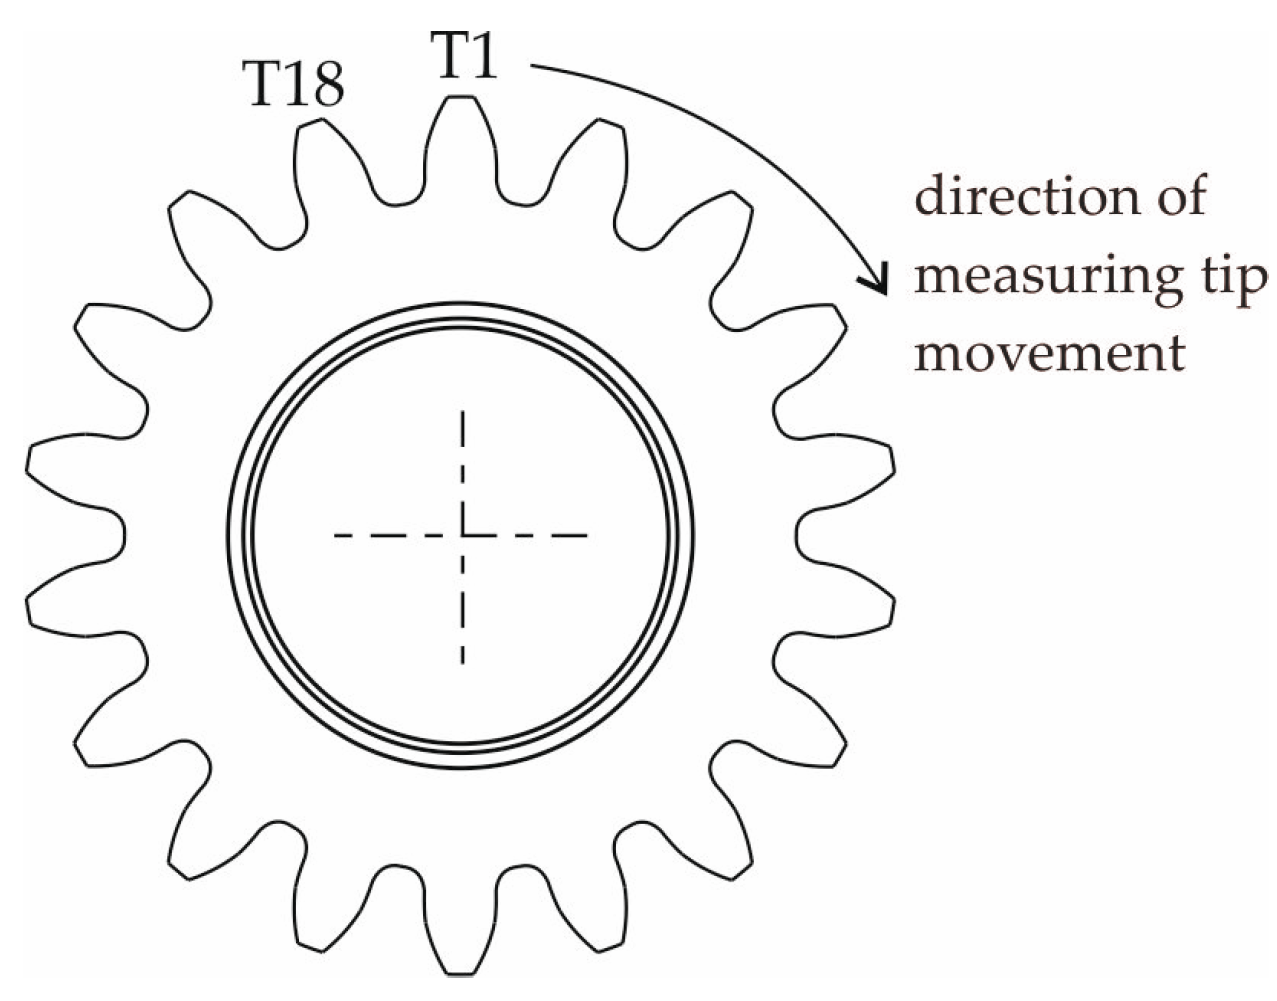
Figure 7.
Diagram of the arrangement of the teeth of the gear wheel subjected to measurements.
Figure 7.
Diagram of the arrangement of the teeth of the gear wheel subjected to measurements.
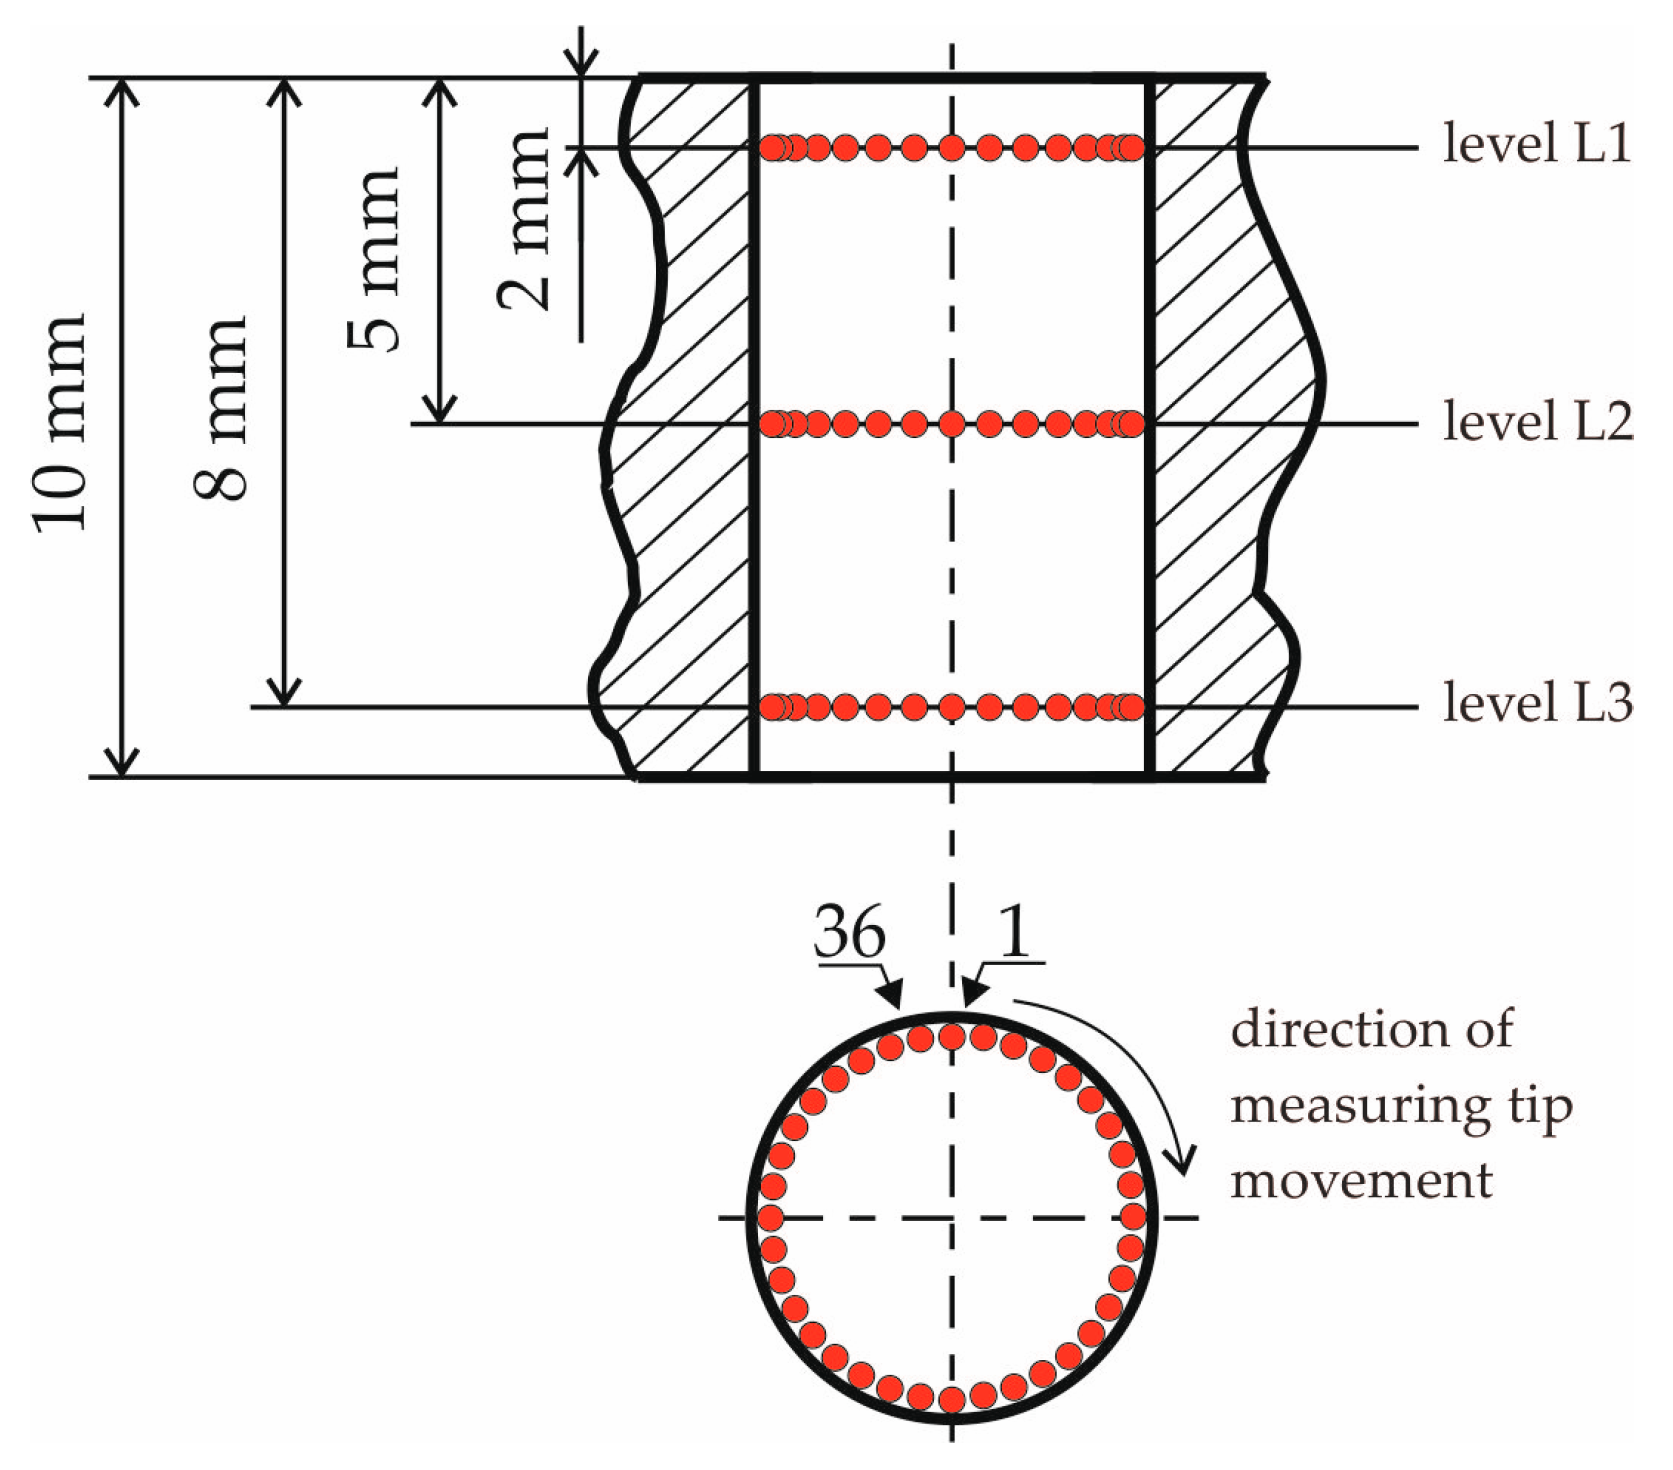
Figure 8.
How to arrange the measuring points inside the measured hole.
Figure 8.
How to arrange the measuring points inside the measured hole.
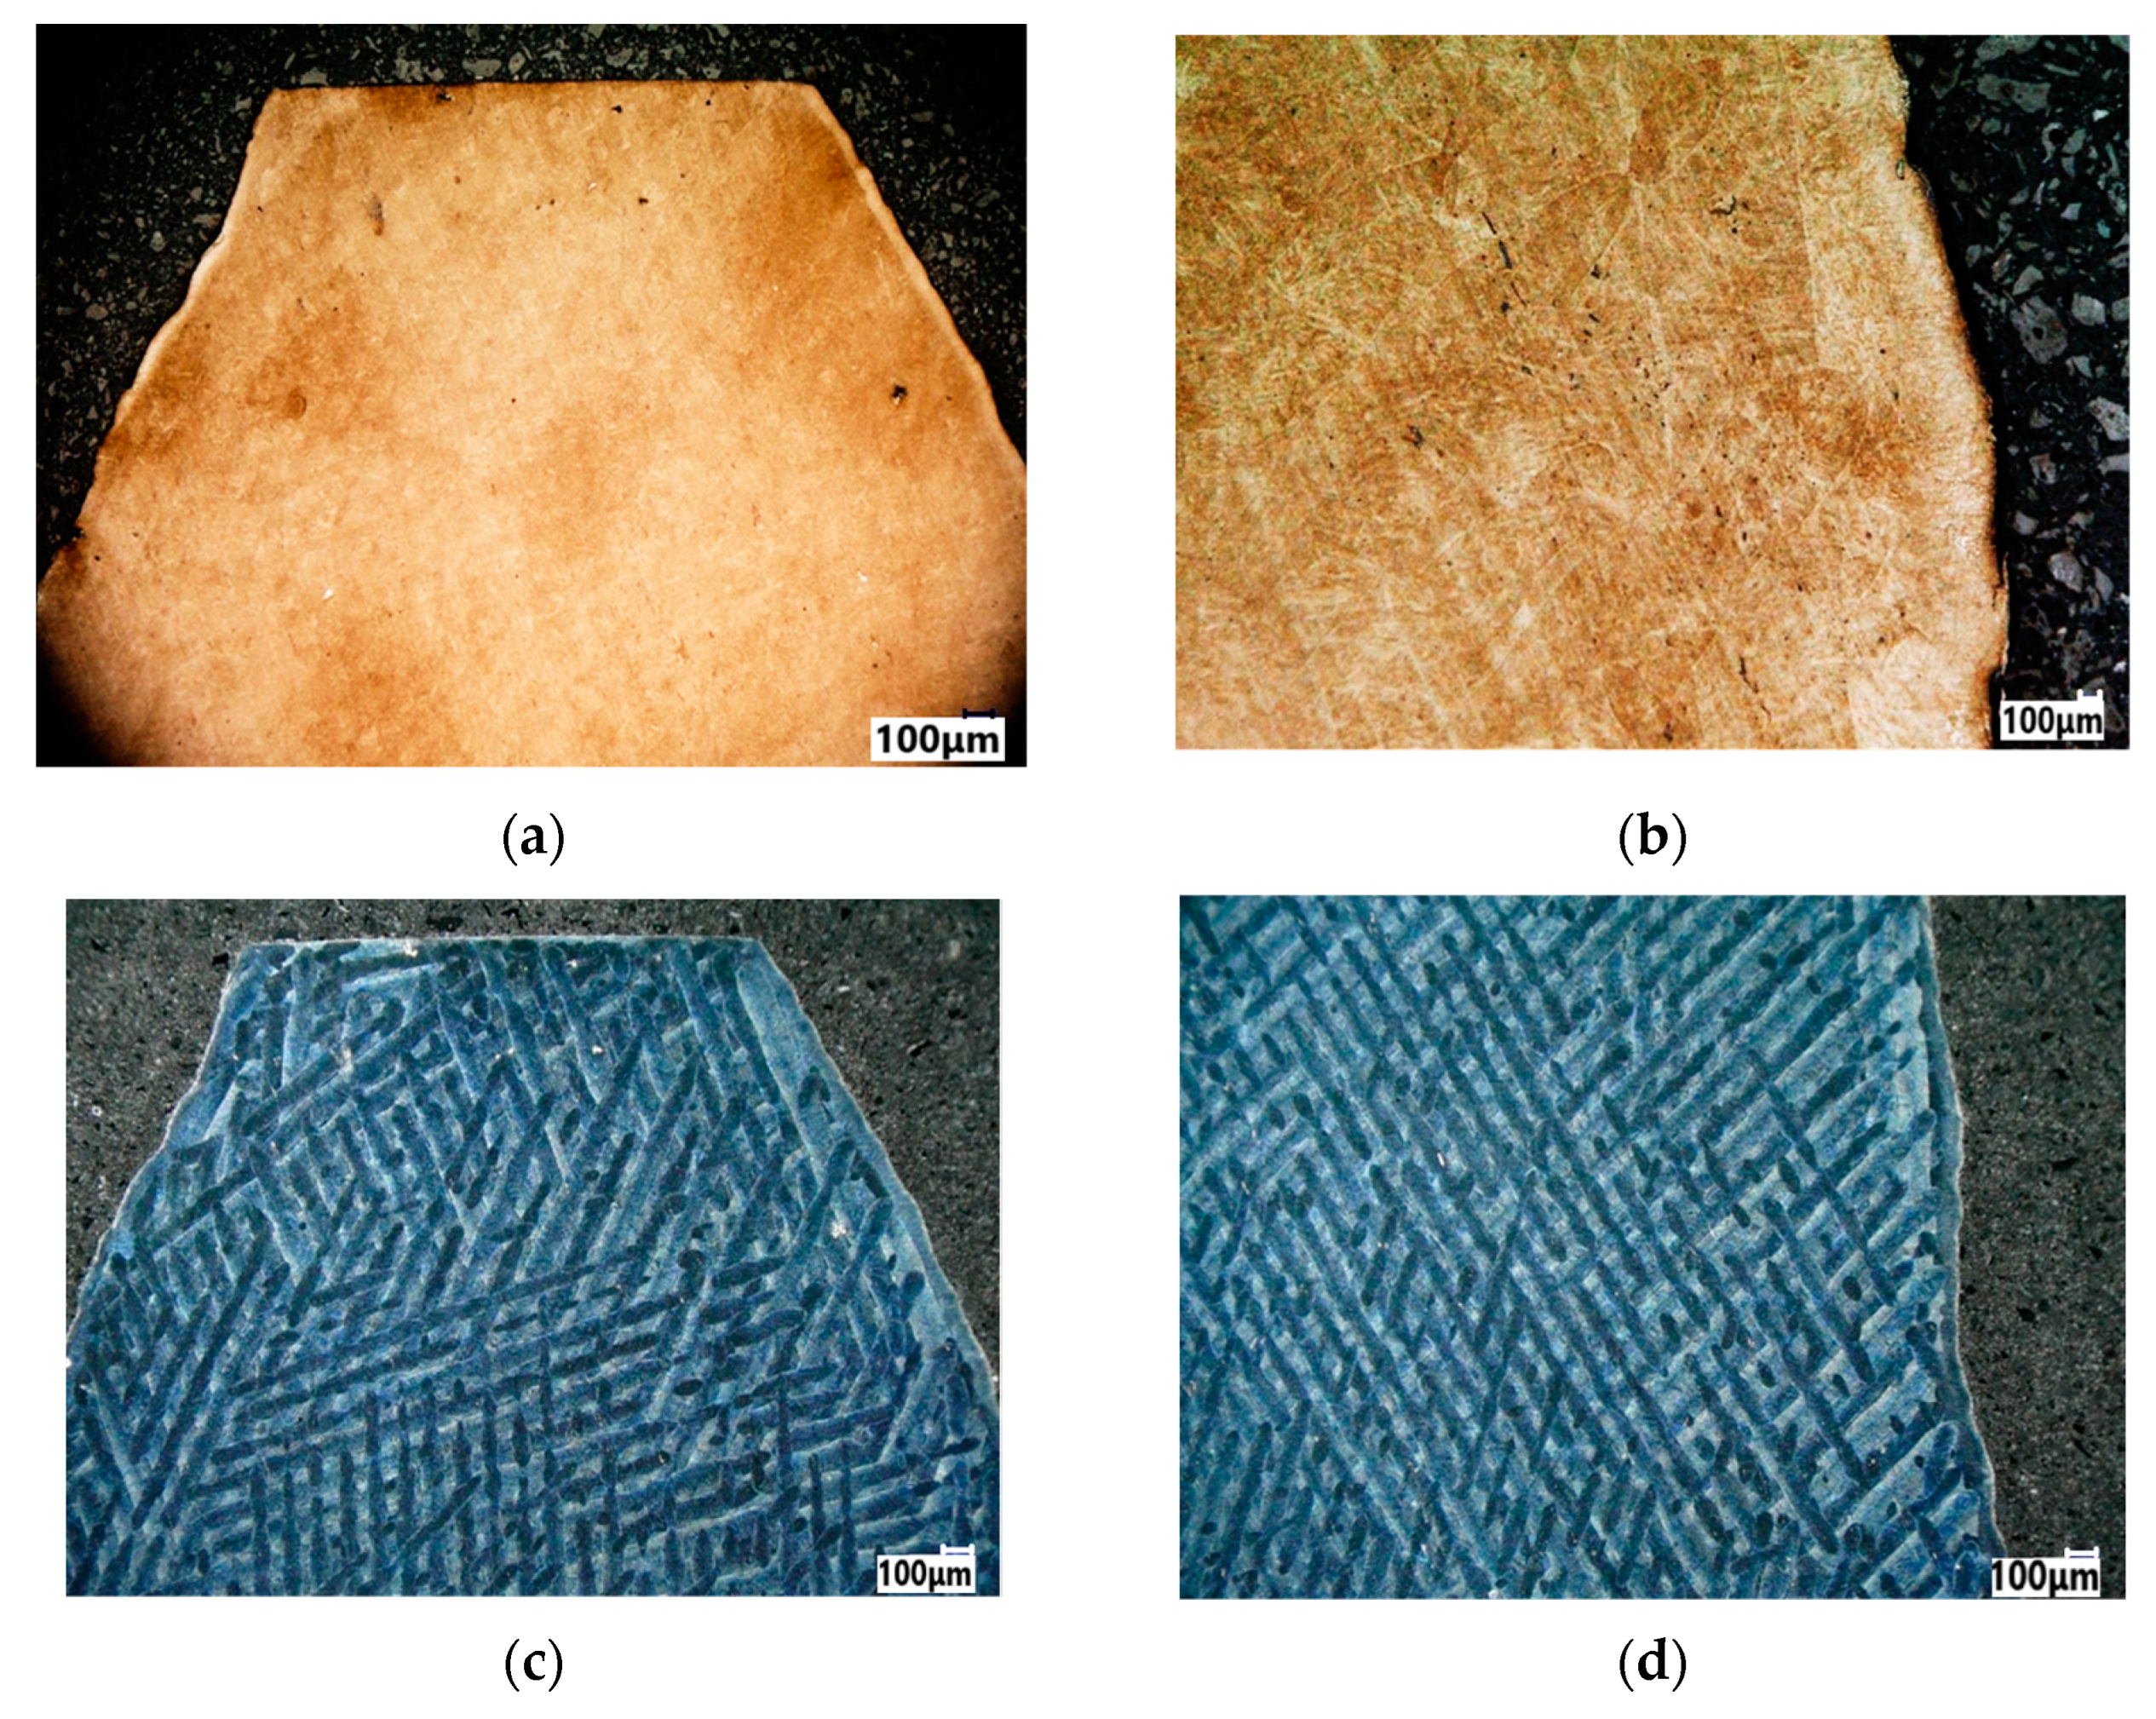
Figure 9.
Microstructure of 1.2709 steel: (a,b) after heat treatment and post-printing structure alignment; (c,d) the stripes of laser scanning.
Figure 9.
Microstructure of 1.2709 steel: (a,b) after heat treatment and post-printing structure alignment; (c,d) the stripes of laser scanning.
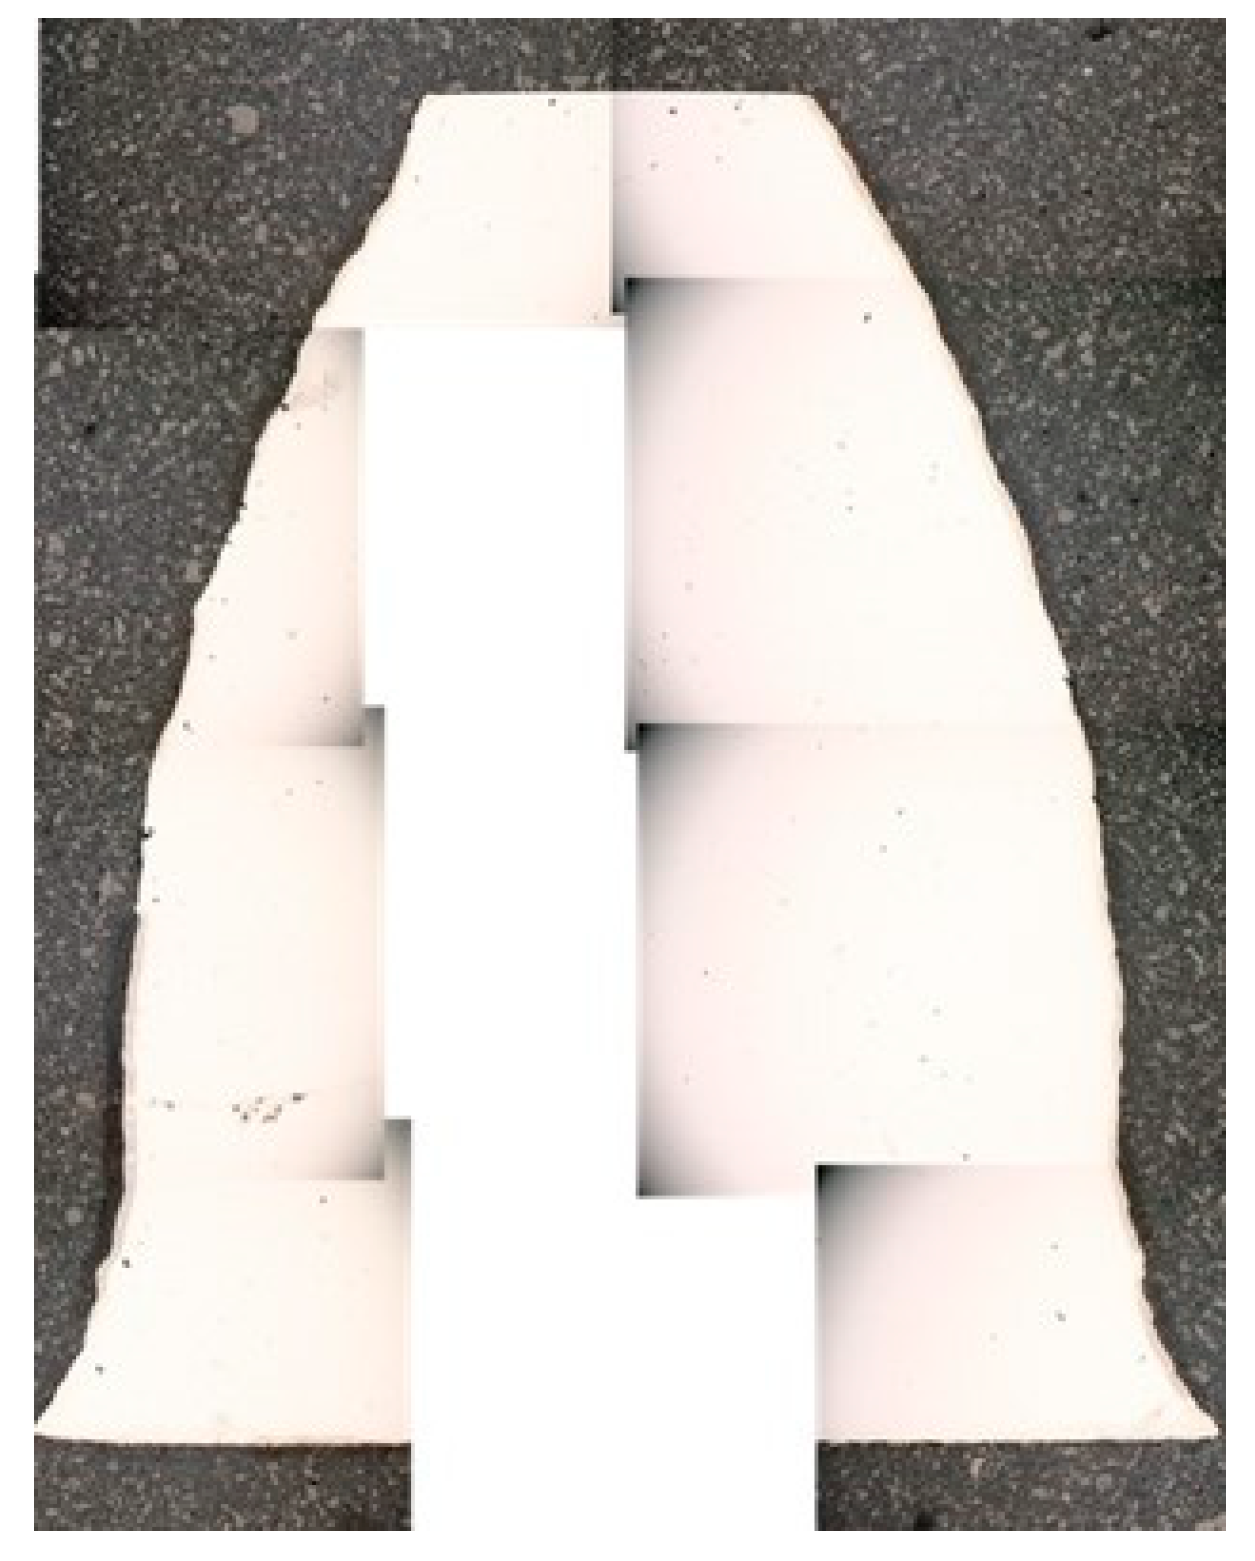
Figure 10.
The macroscopic assemblage of a DMLS-printed tooth shape.
Figure 10.
The macroscopic assemblage of a DMLS-printed tooth shape.
Figure 11.
EBSD map of the sample after laser processing: (a) IPF X mapping; (b) inverse pole figures.
Figure 11.
EBSD map of the sample after laser processing: (a) IPF X mapping; (b) inverse pole figures.
Figure 12.
Residual stress measurement results.
Figure 12.
Residual stress measurement results.
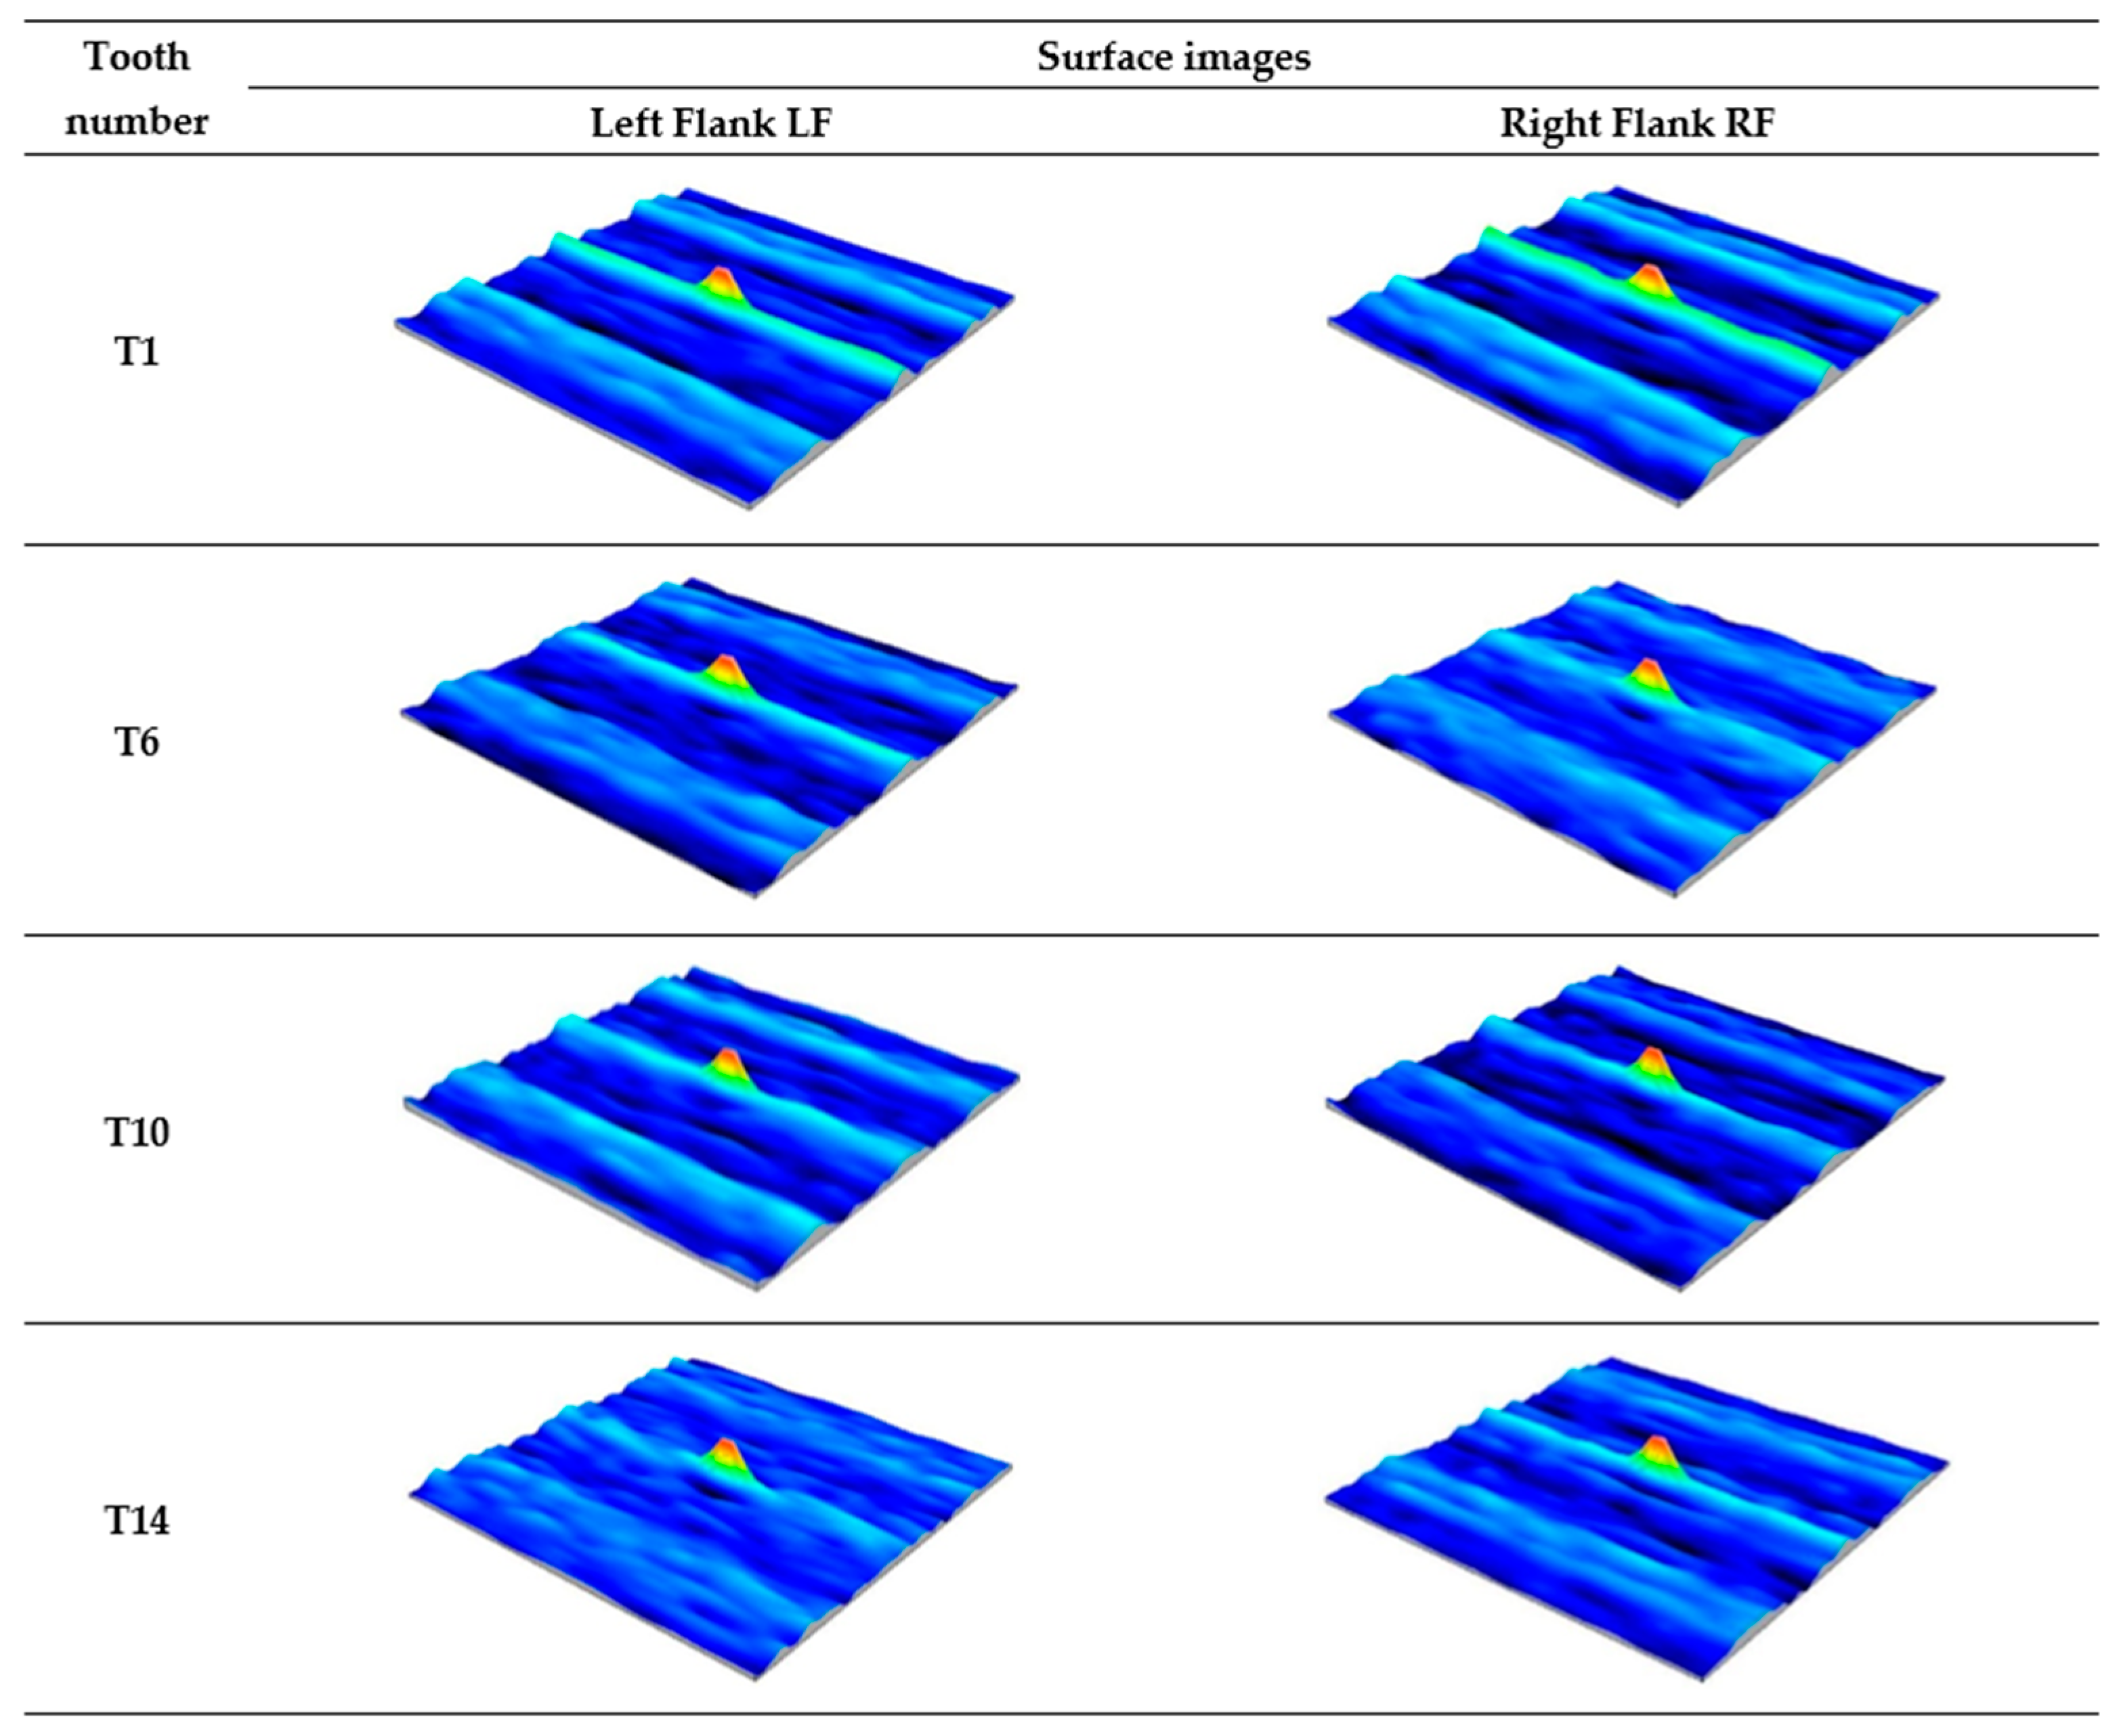
Figure 13.
Images of the working surface of the measured teeth—after printing, before grinding.
Figure 13.
Images of the working surface of the measured teeth—after printing, before grinding.
Figure 14.
Autocorrelation functions of the working surface of the measured teeth—after printing, before grinding.
Figure 14.
Autocorrelation functions of the working surface of the measured teeth—after printing, before grinding.
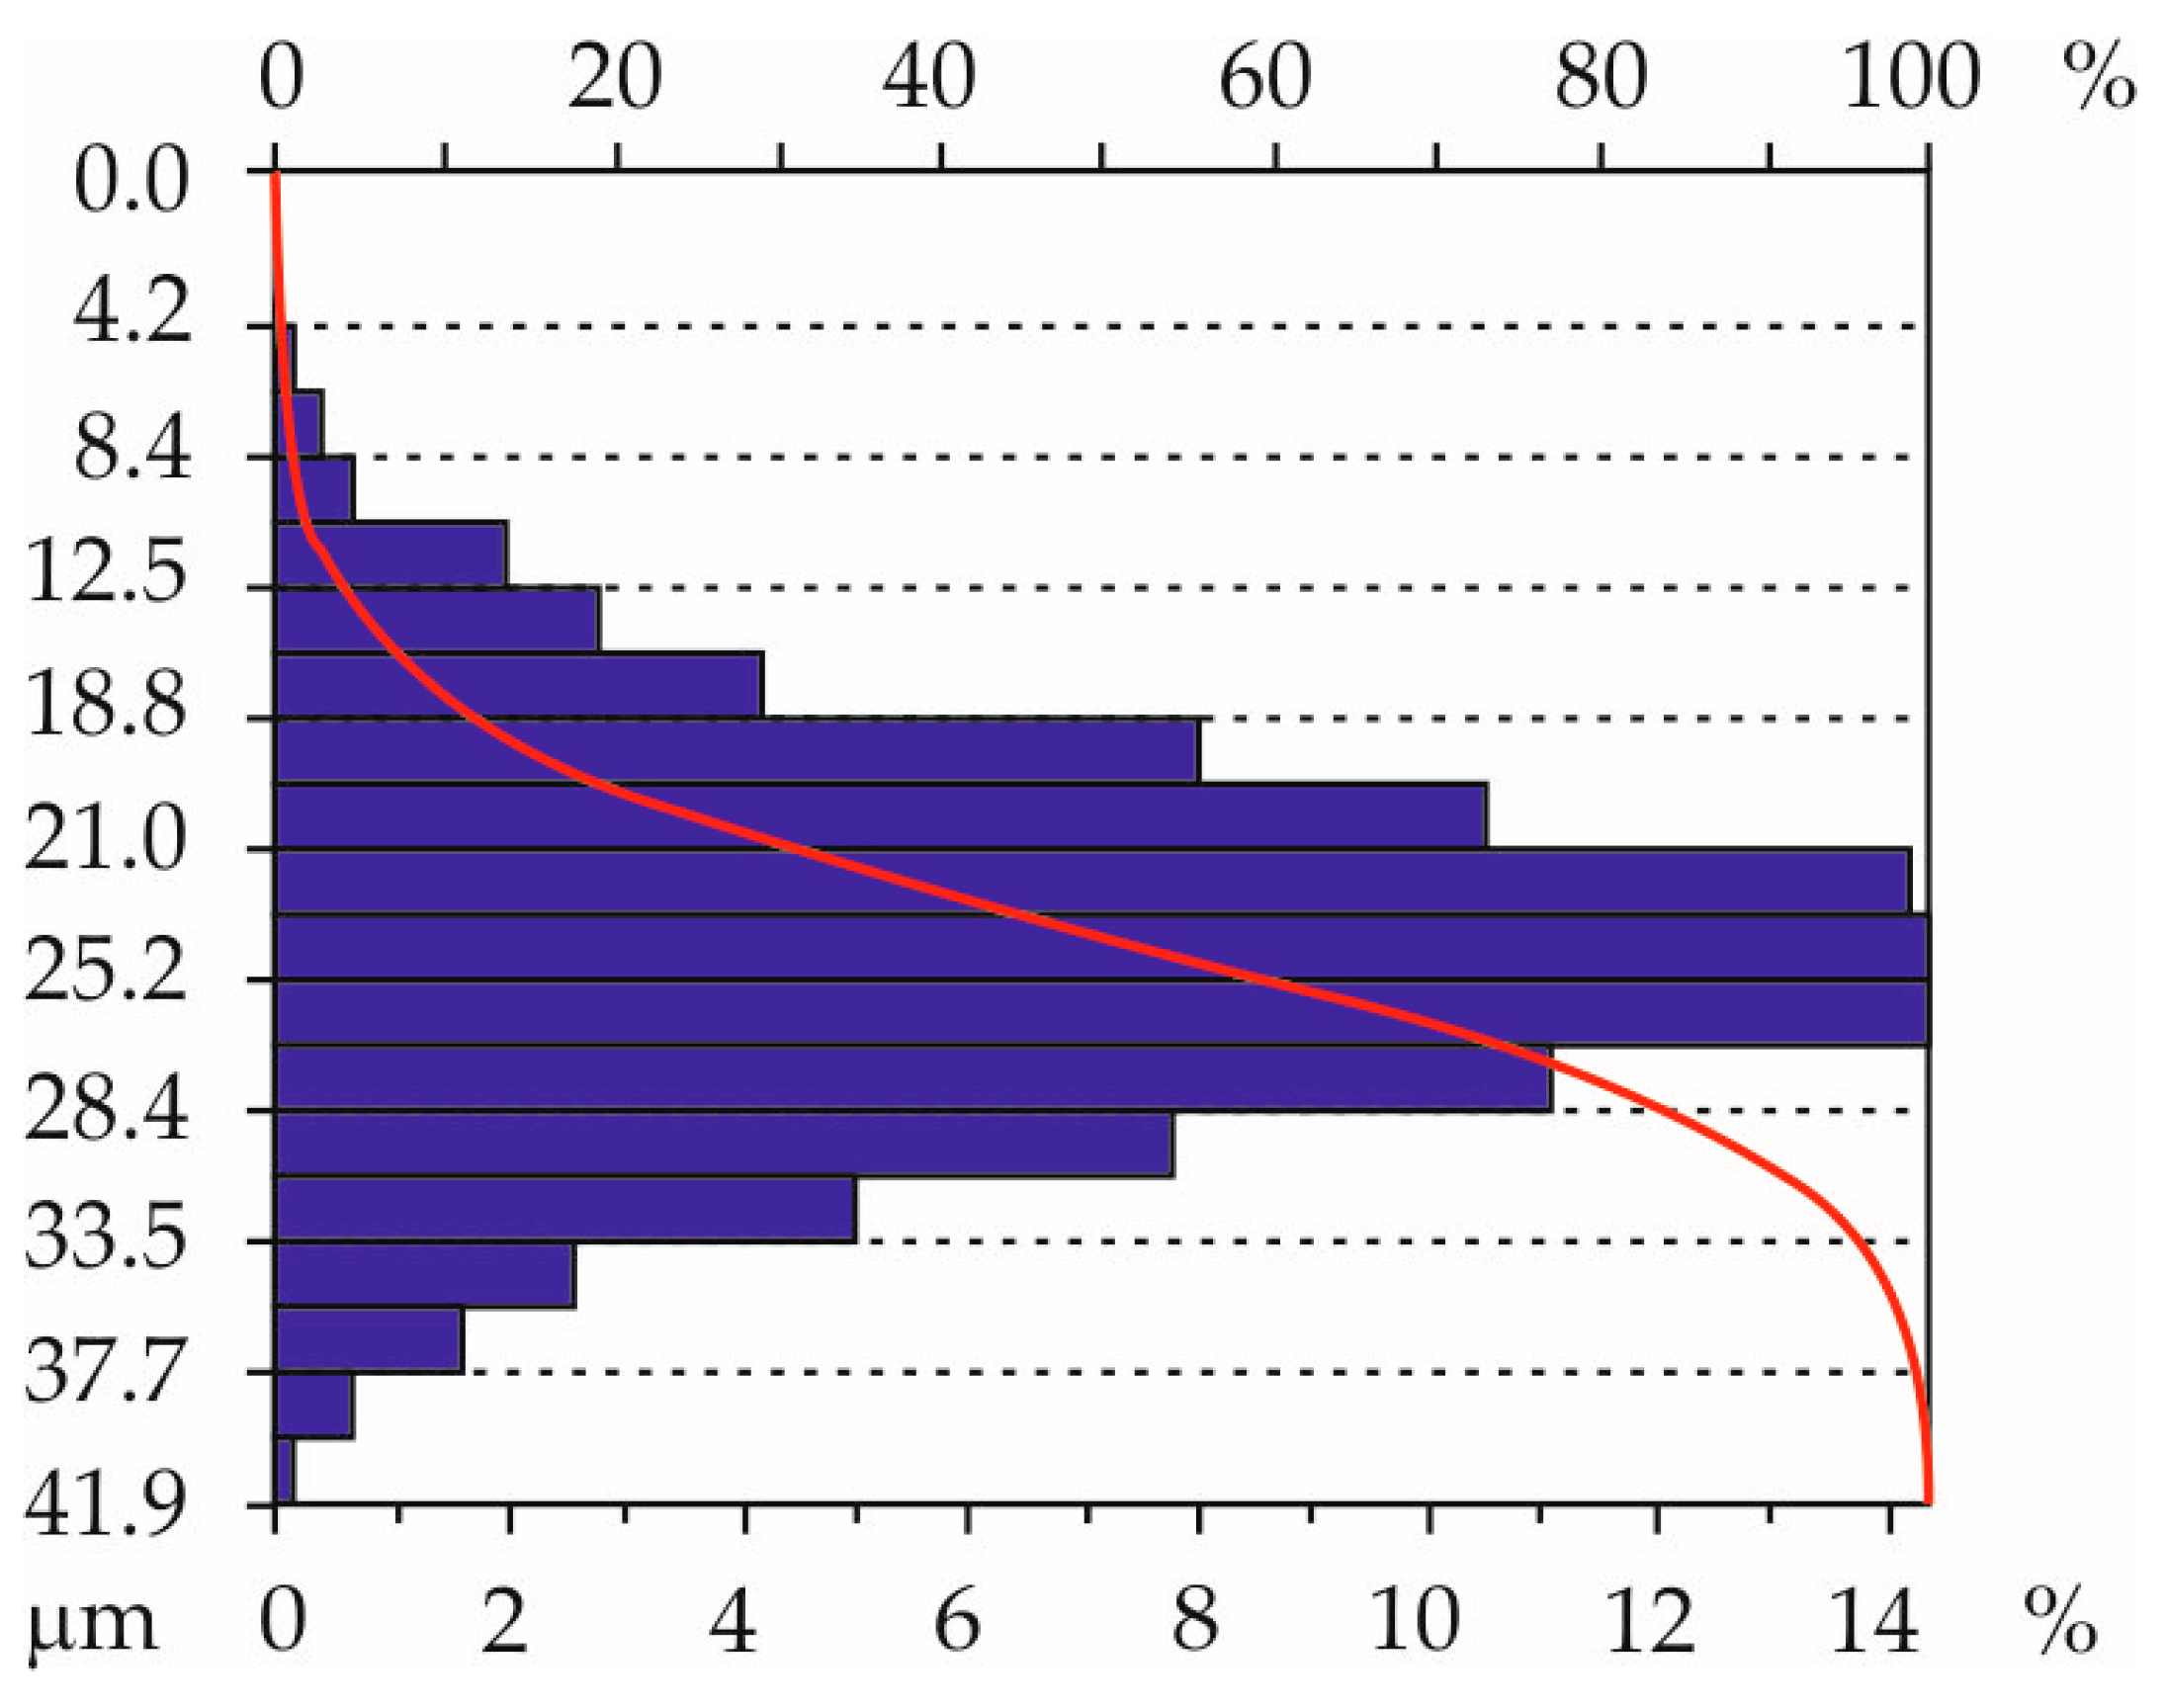
Figure 15.
Example distribution of ordinates of the characteristic geometric structure of the surface after printing: tooth T6, right flank RF.
Figure 15.
Example distribution of ordinates of the characteristic geometric structure of the surface after printing: tooth T6, right flank RF.
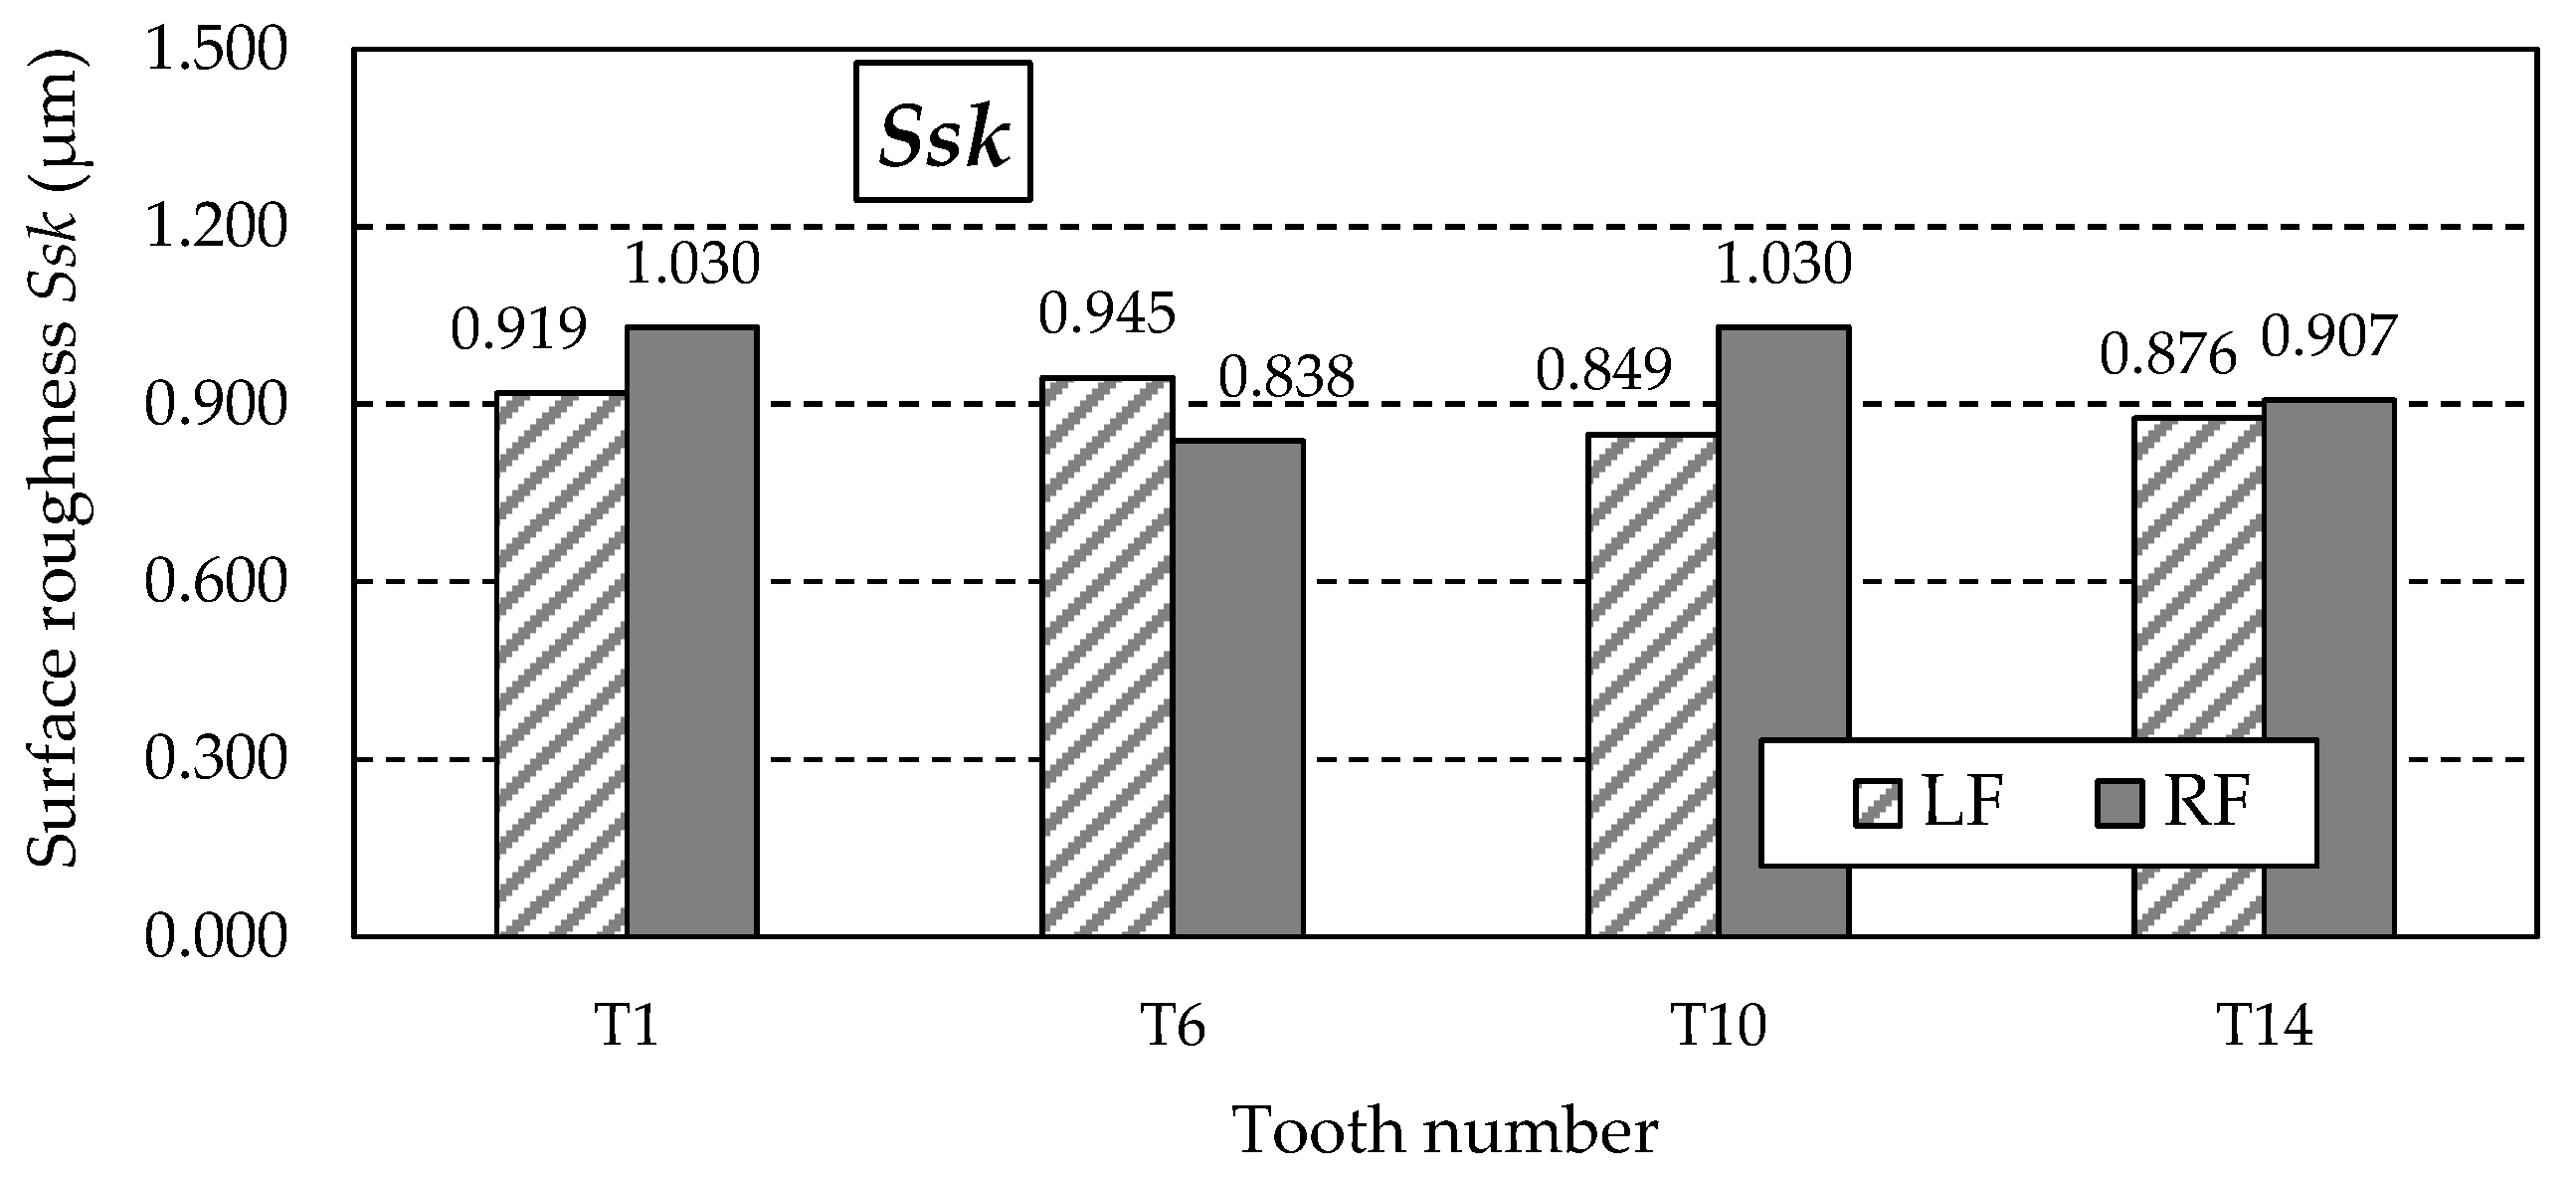
Figure 16.
Skewness coefficient Ssk for the left flank (LF) and right flank (RF) of the measured teeth.
Figure 16.
Skewness coefficient Ssk for the left flank (LF) and right flank (RF) of the measured teeth.
Figure 17.
Values of the Sz parameter for the left flank (LF) and right flank (RF) of the measured teeth—after printing, before grinding.
Figure 17.
Values of the Sz parameter for the left flank (LF) and right flank (RF) of the measured teeth—after printing, before grinding.
Figure 18.
Values of the Sp parameter for the left flank (LF) and right flank (RF) of the measured teeth—after printing, before grinding.
Figure 18.
Values of the Sp parameter for the left flank (LF) and right flank (RF) of the measured teeth—after printing, before grinding.
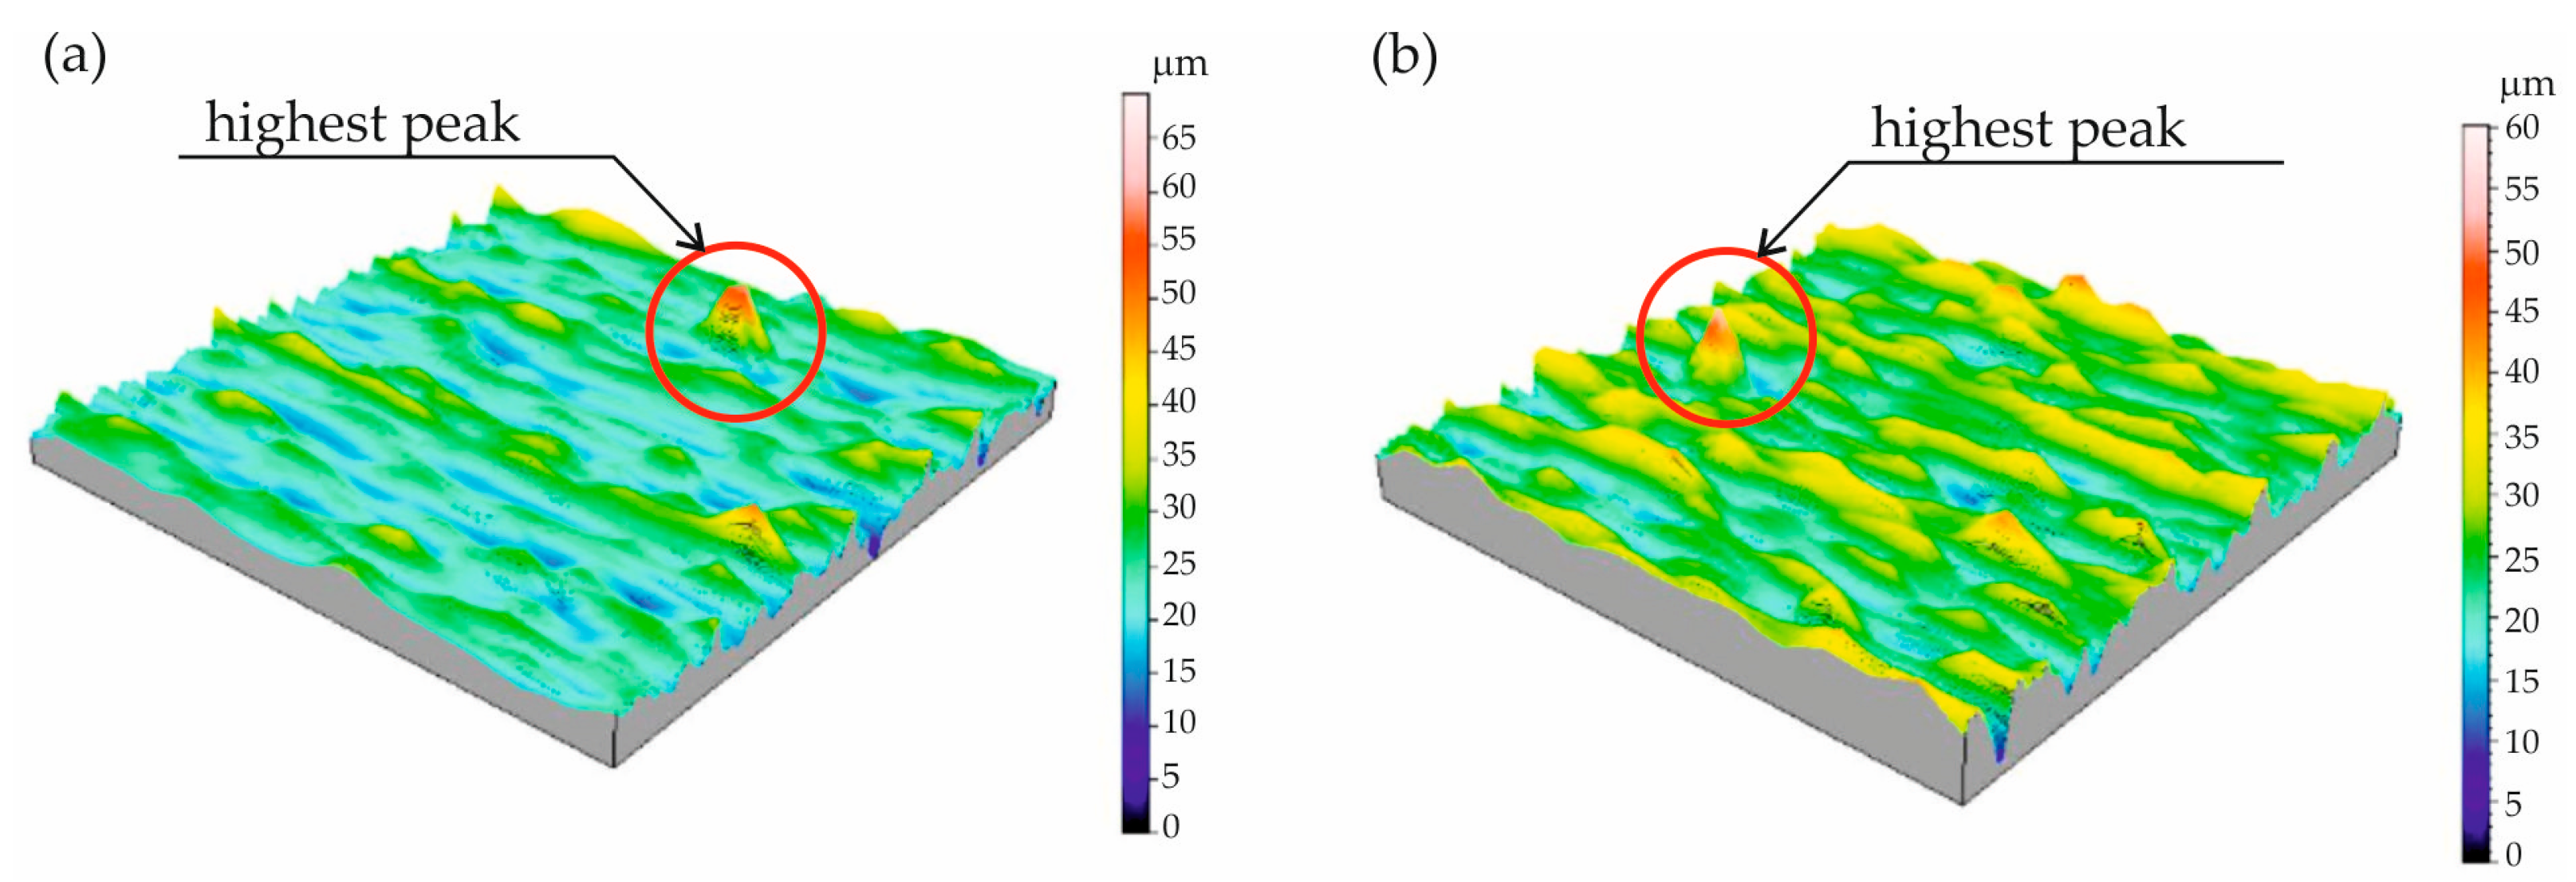
Figure 19.
Single abnormal peak on: (a) right flank of T10 tooth; (b) left flank of T14 tooth.
Figure 19.
Single abnormal peak on: (a) right flank of T10 tooth; (b) left flank of T14 tooth.
Figure 20.
Values of the Sa parameter for the left flank (LF) and right flank (RF) of the measured teeth—after printing, before grinding.
Figure 20.
Values of the Sa parameter for the left flank (LF) and right flank (RF) of the measured teeth—after printing, before grinding.
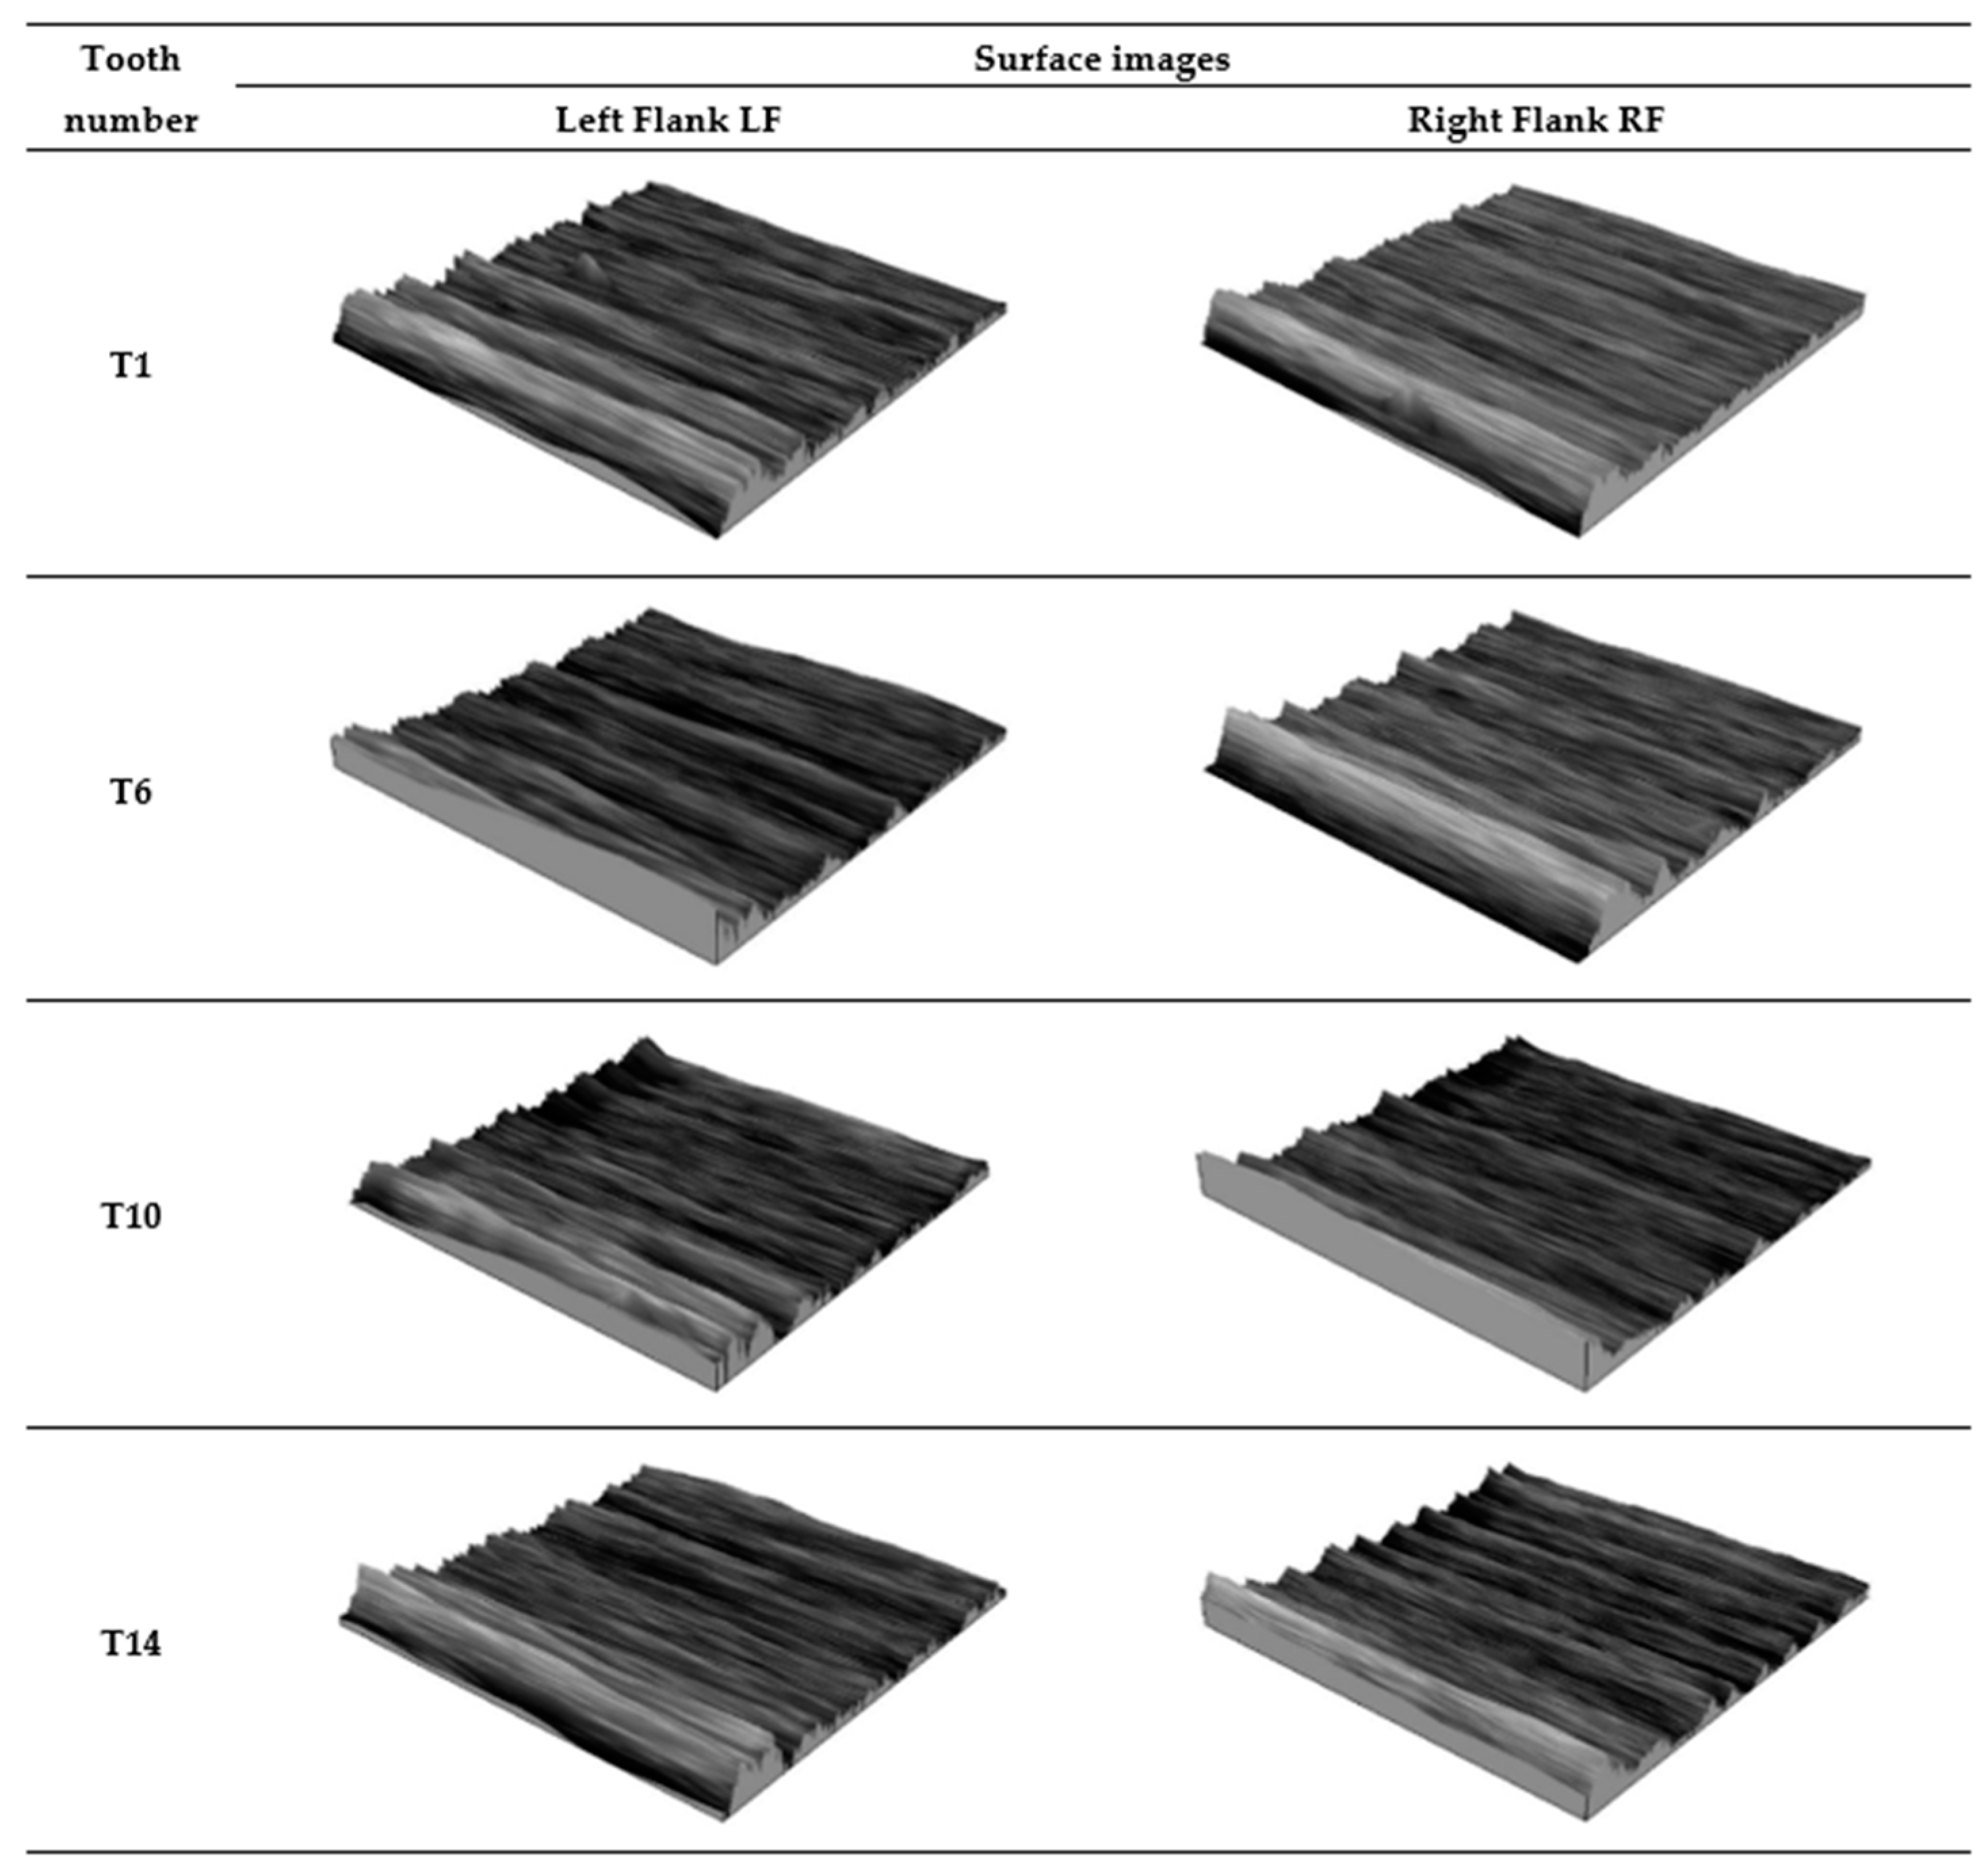
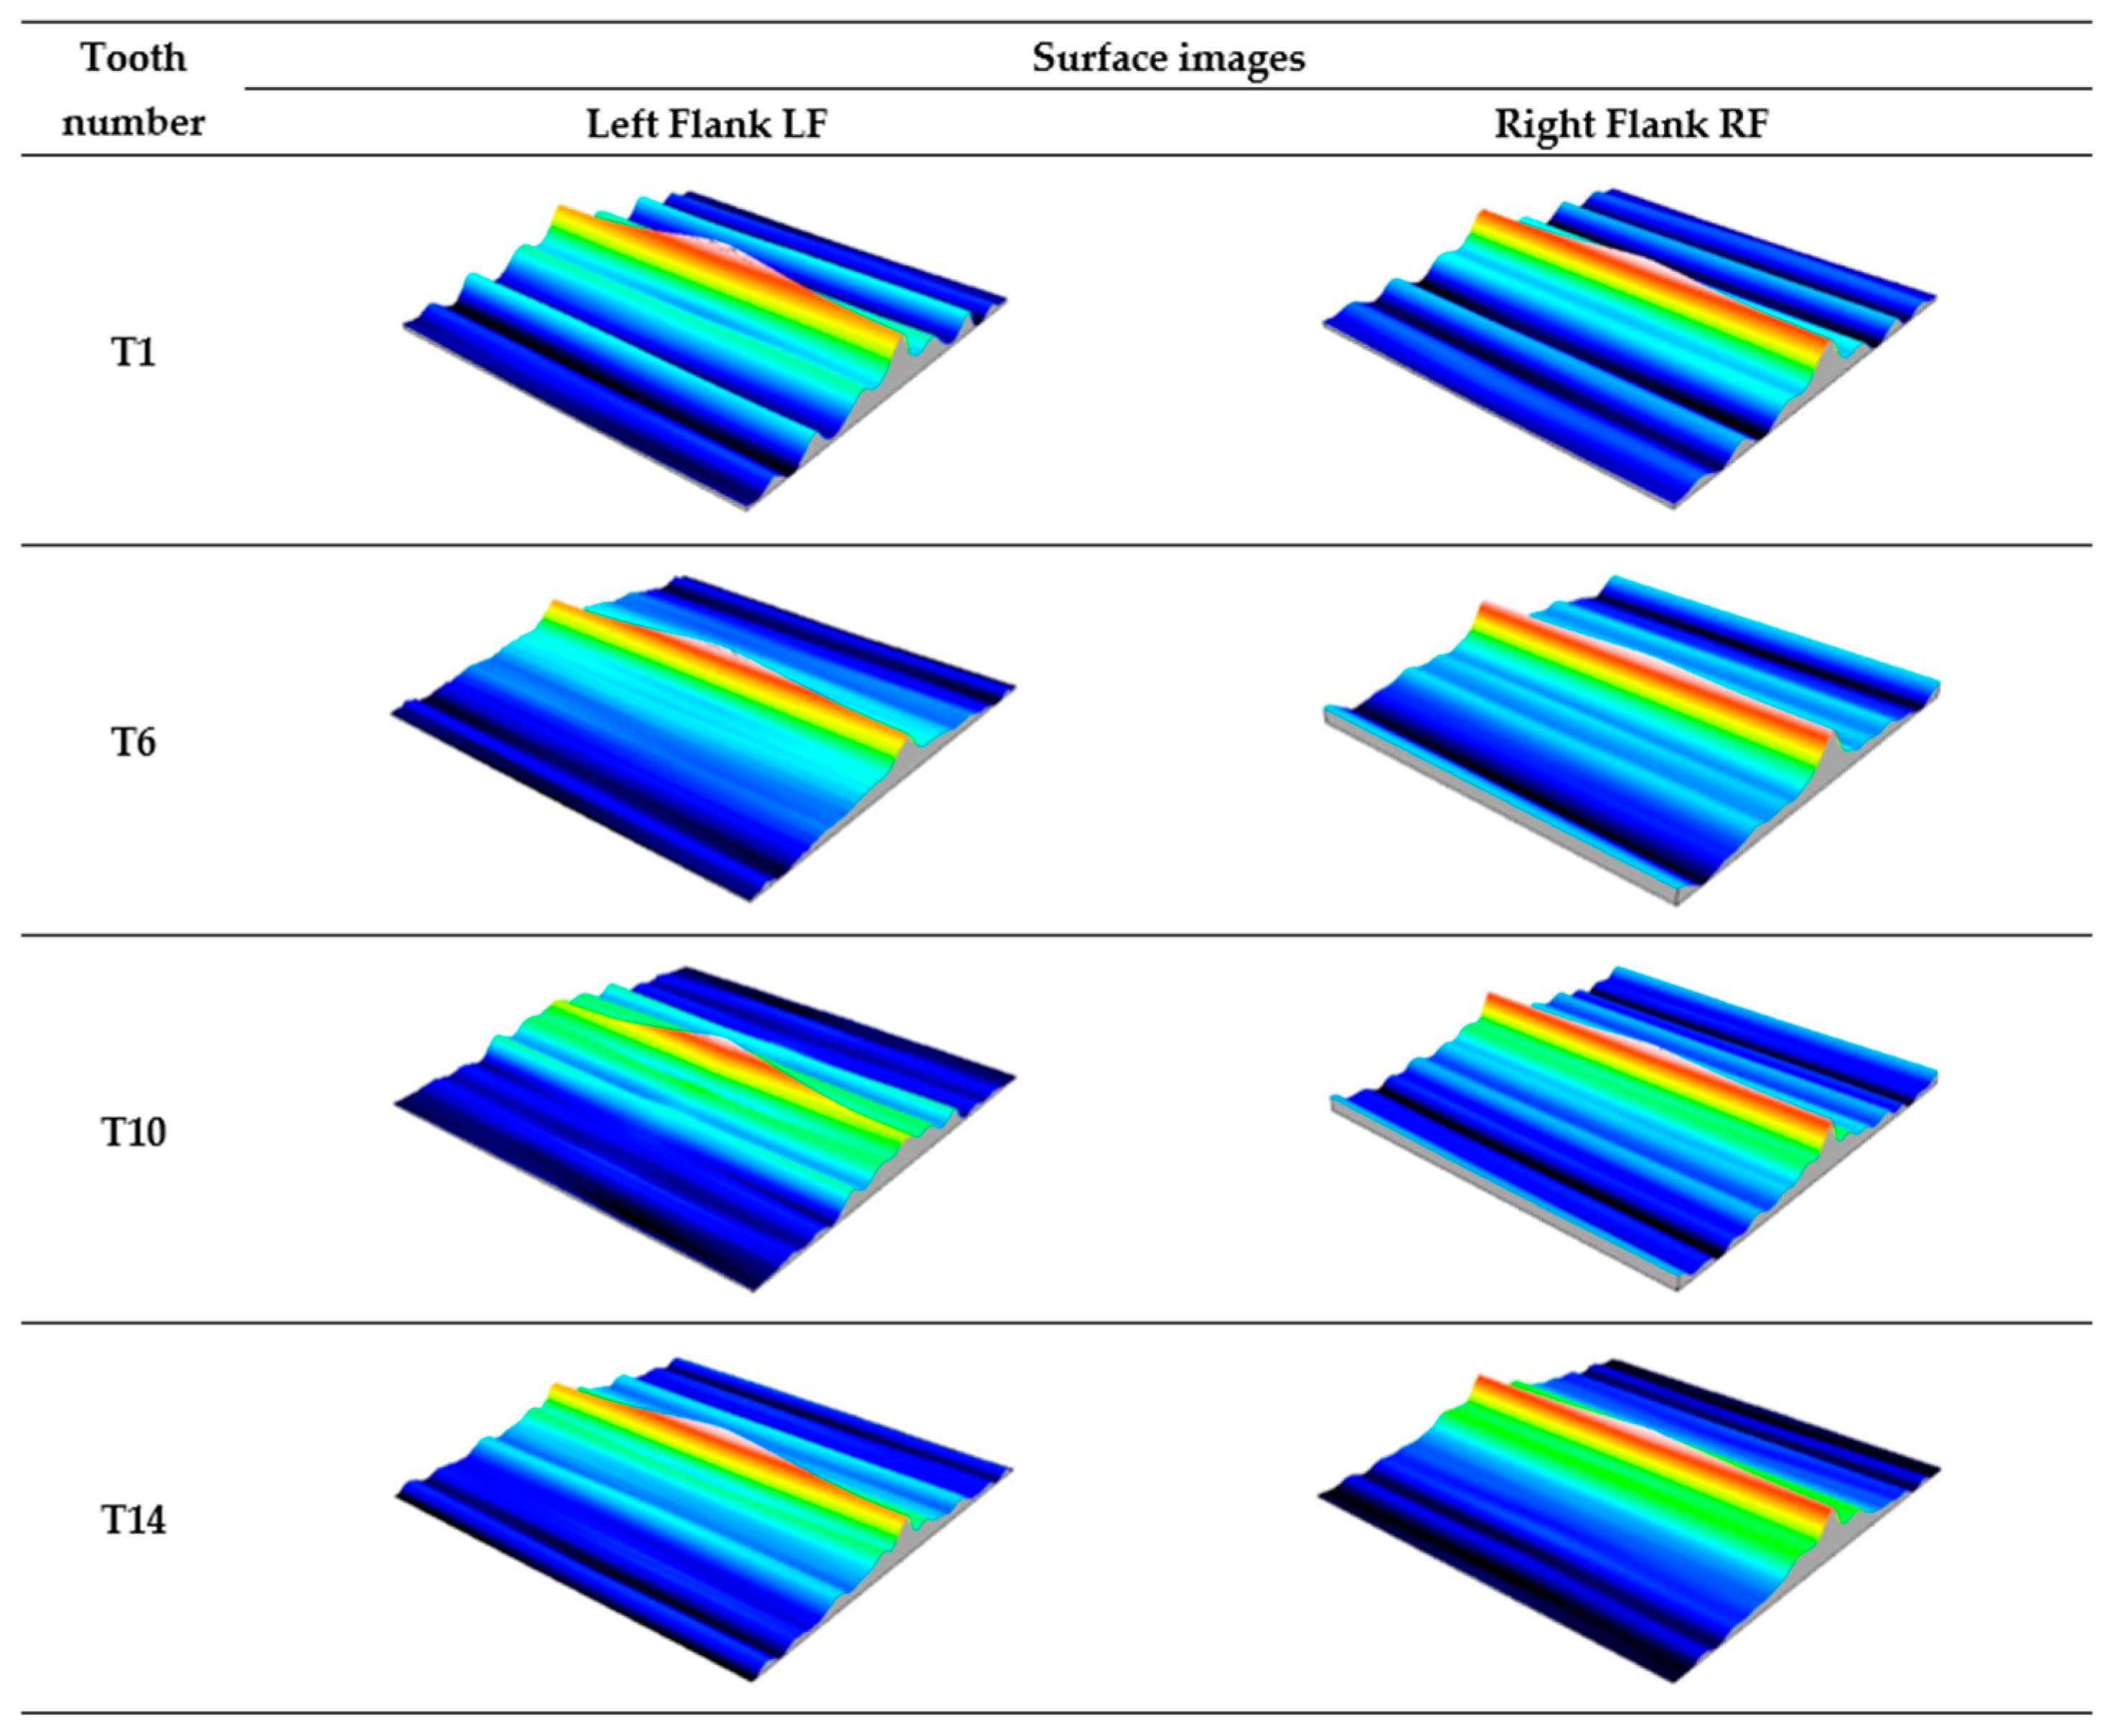
Figure 21.
Images of the working surface of the measured teeth—after grinding.
Figure 21.
Images of the working surface of the measured teeth—after grinding.
Figure 22.
Autocorrelation functions of the working surface of the measured teeth—after grinding.
Figure 22.
Autocorrelation functions of the working surface of the measured teeth—after grinding.
Figure 23.
Example distribution of ordinates of the characteristic geometric structure of the surface after grinding; T6 tooth, right flank.
Figure 23.
Example distribution of ordinates of the characteristic geometric structure of the surface after grinding; T6 tooth, right flank.
Figure 24.
Skewness coefficient Ssk for the left flank (LF) and right flank (RF) of the measured teeth—after grinding.
Figure 24.
Skewness coefficient Ssk for the left flank (LF) and right flank (RF) of the measured teeth—after grinding.
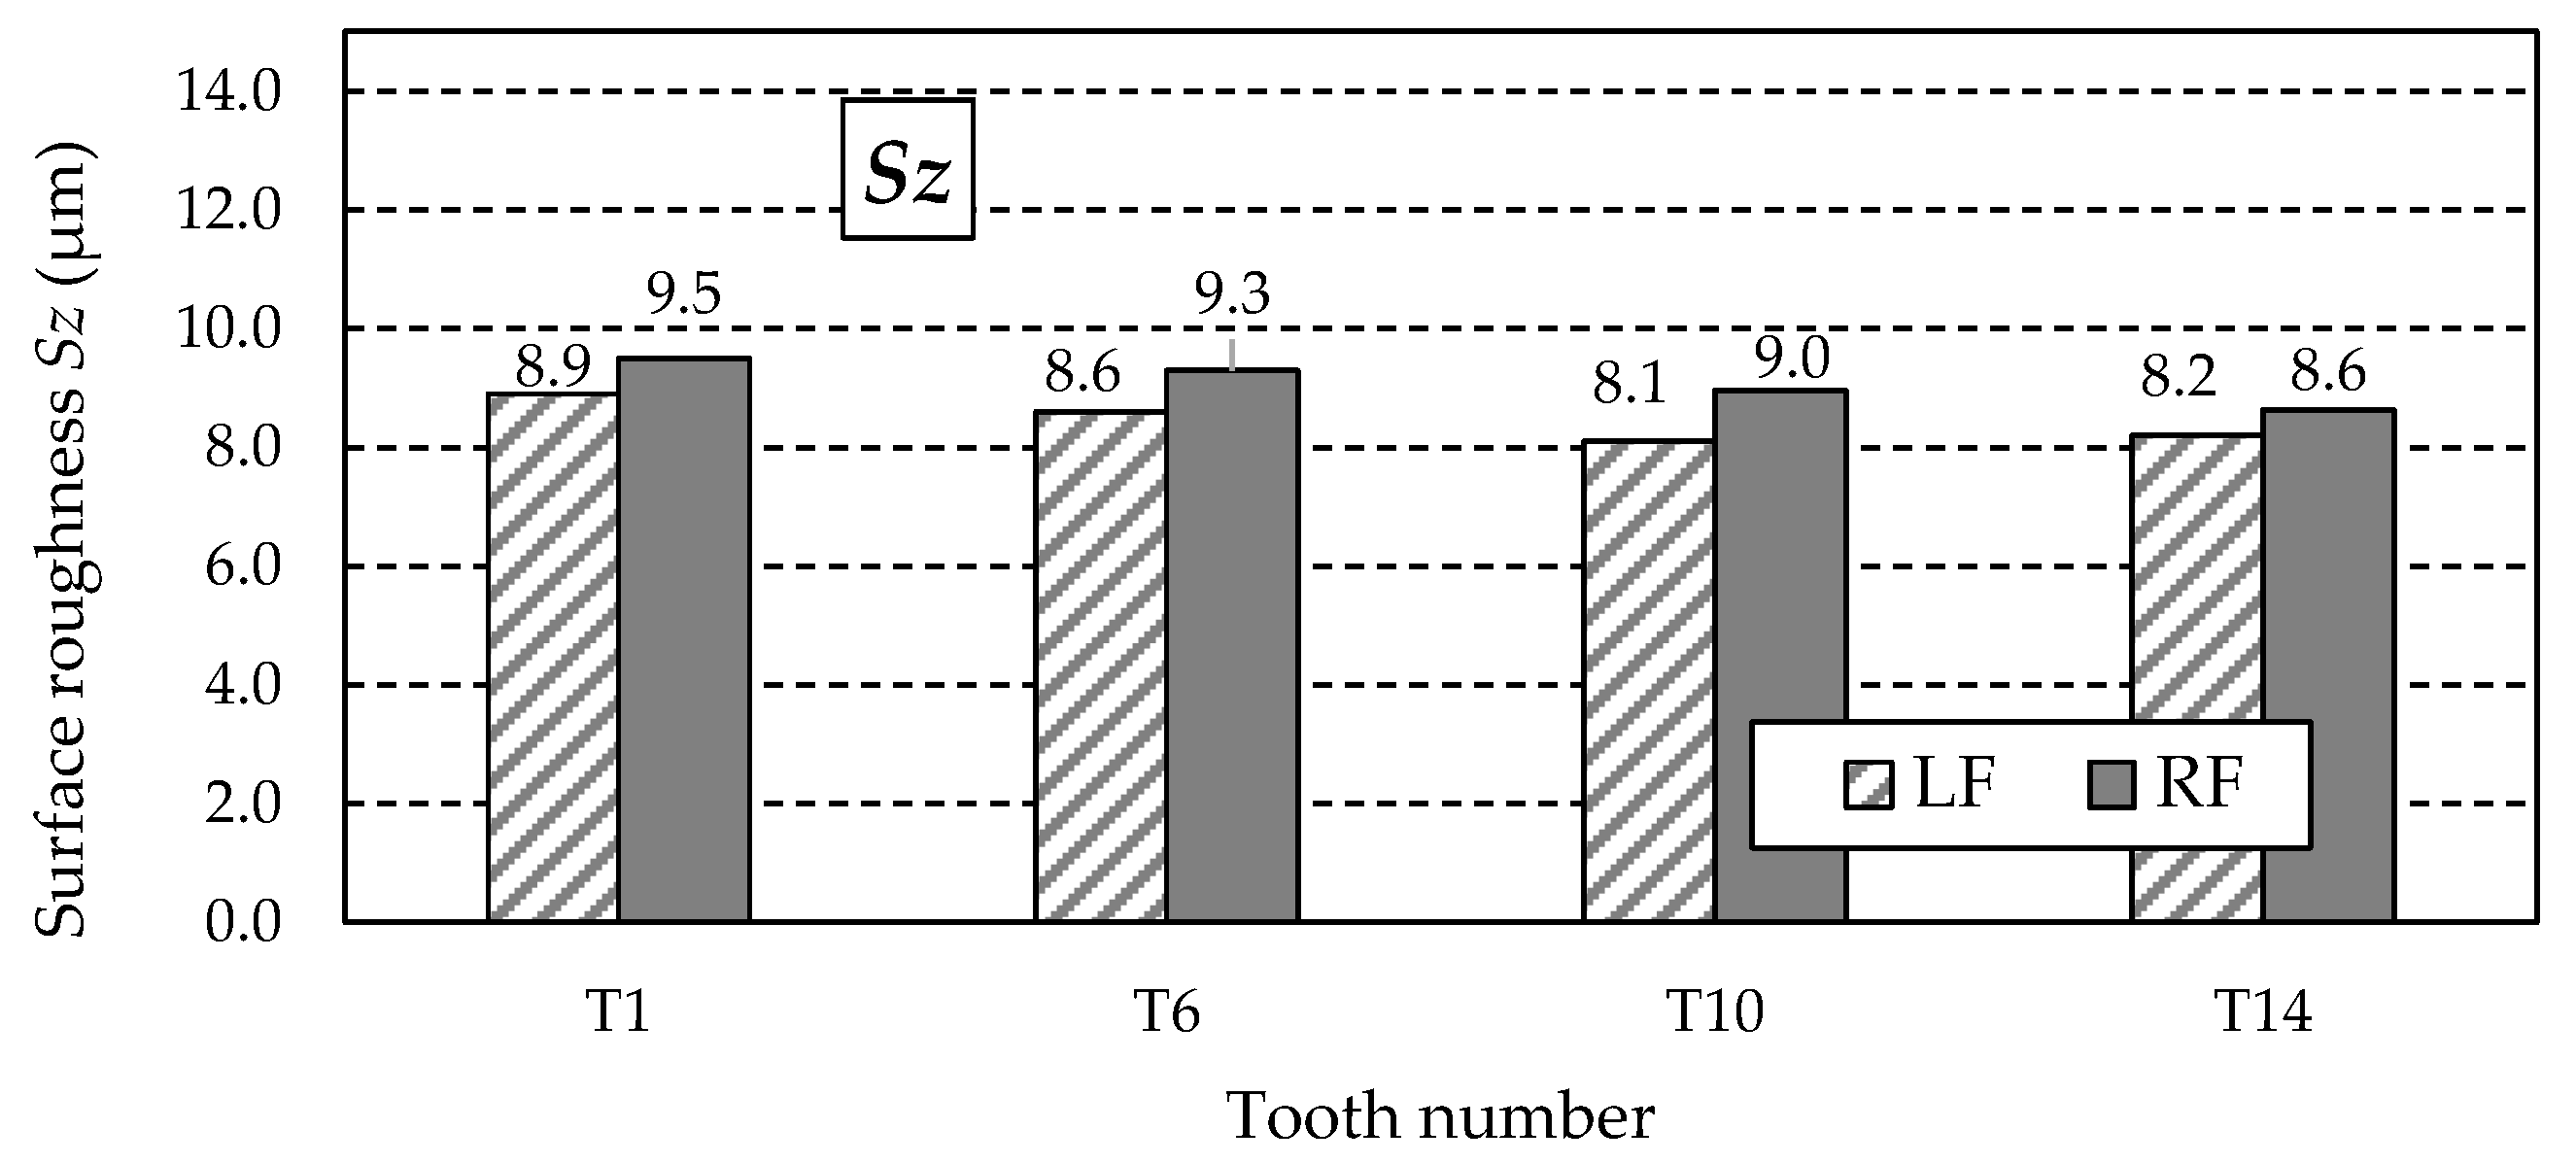
Figure 25.
Values of the Sz parameter for the left flank (LF) and right flank (RF) of the measured teeth—after grinding.
Figure 25.
Values of the Sz parameter for the left flank (LF) and right flank (RF) of the measured teeth—after grinding.
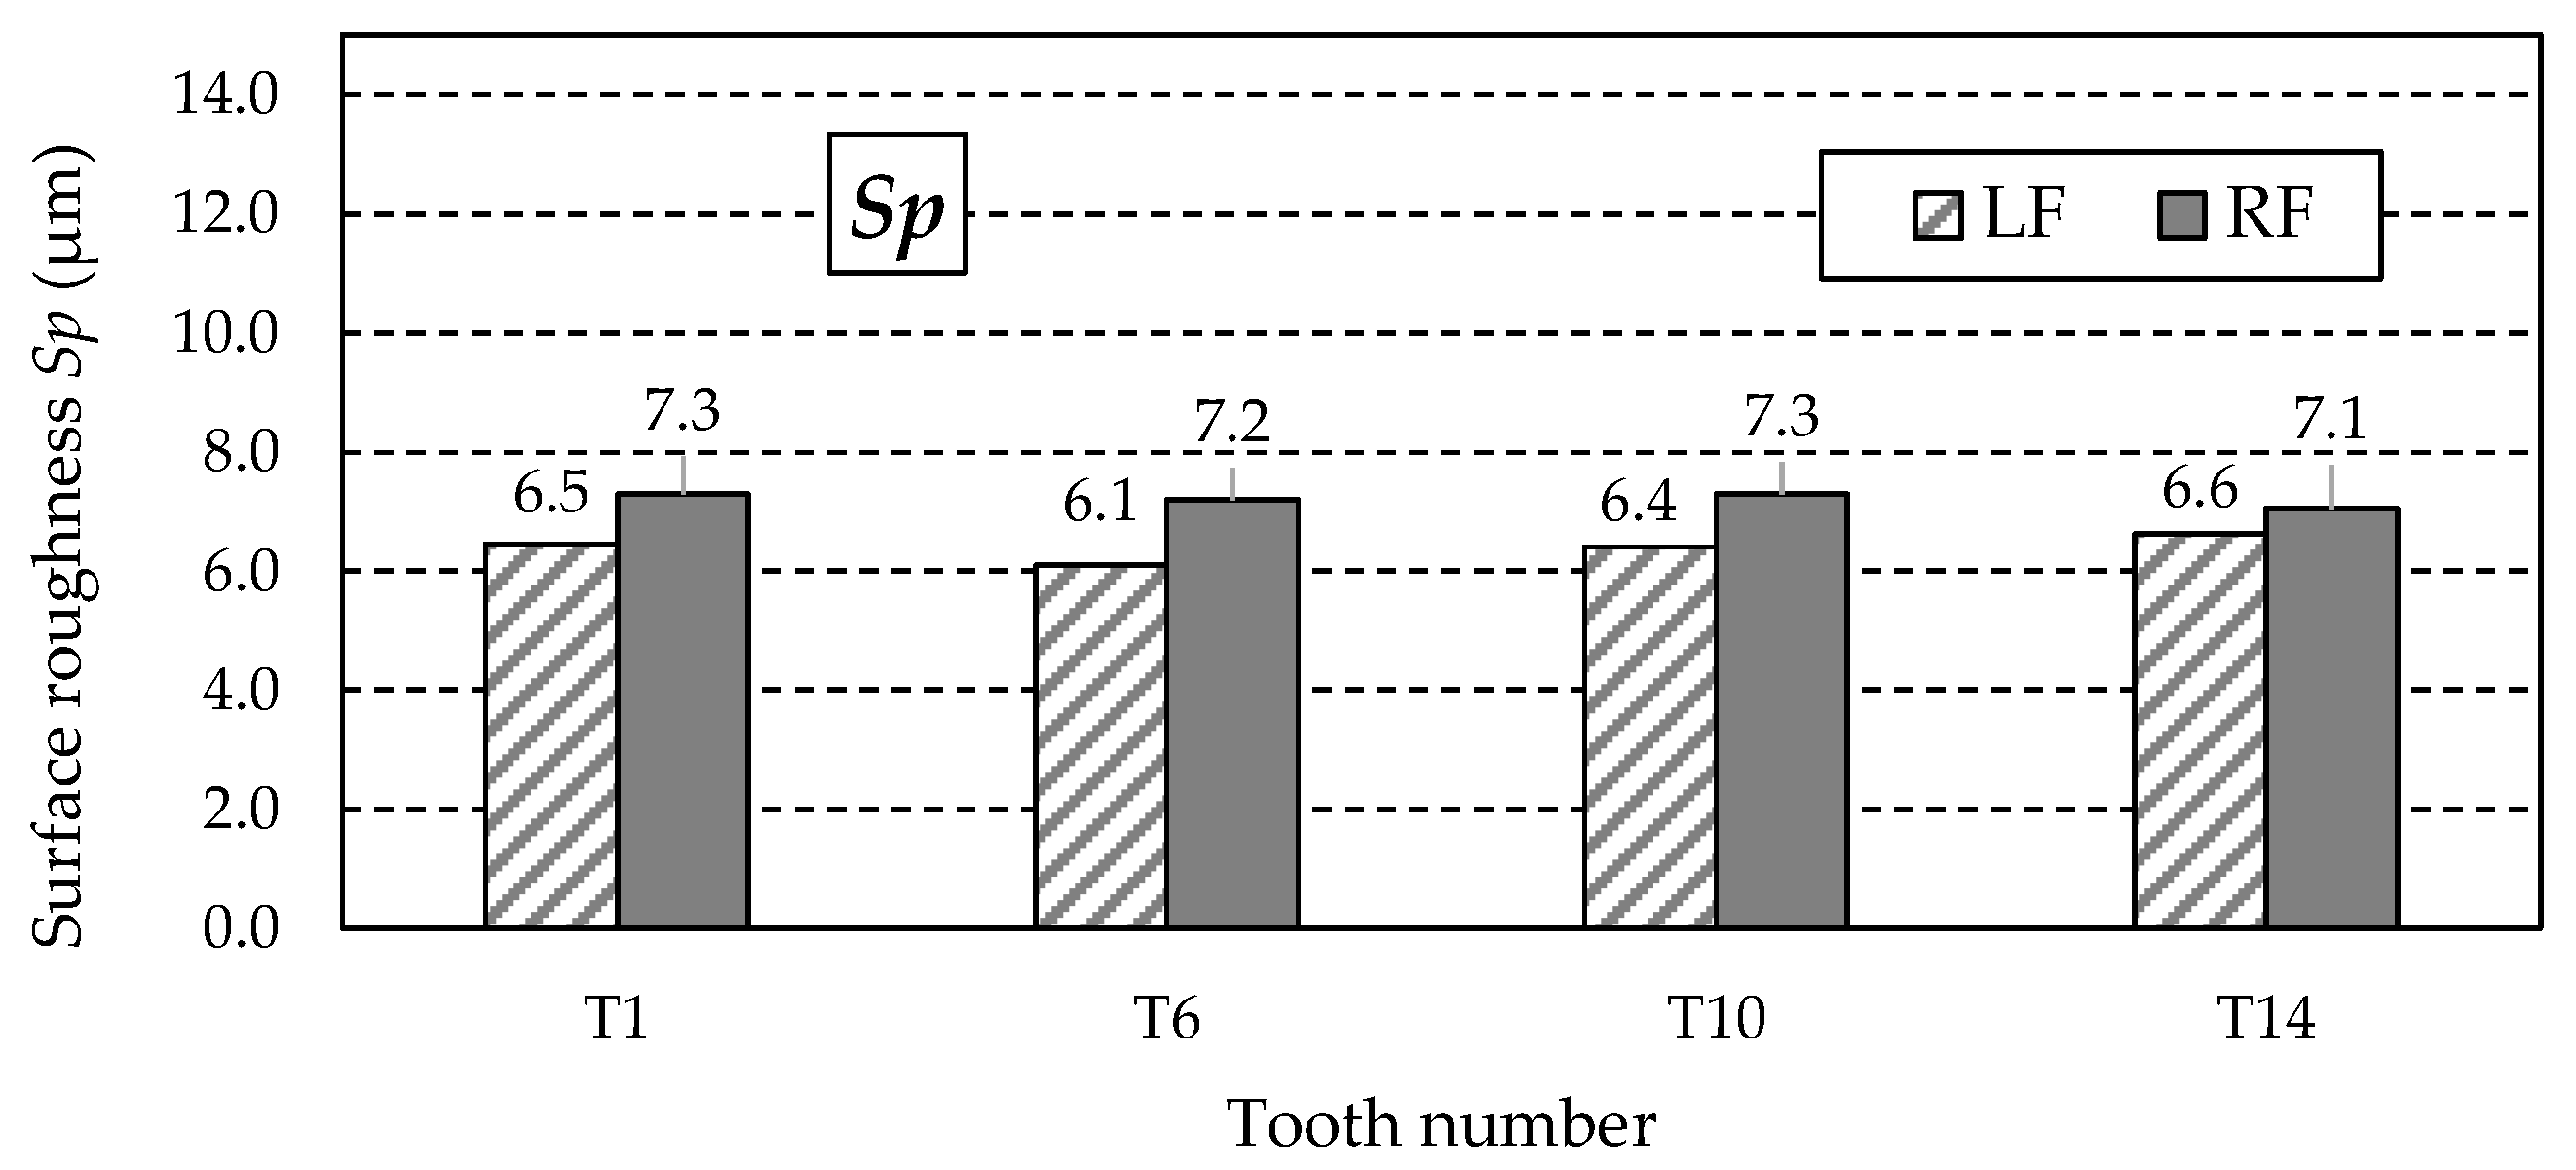
Figure 26.
Values of the Sp parameter for the left flank (LF) and right flank (RF) of the measured teeth—after grinding.
Figure 26.
Values of the Sp parameter for the left flank (LF) and right flank (RF) of the measured teeth—after grinding.
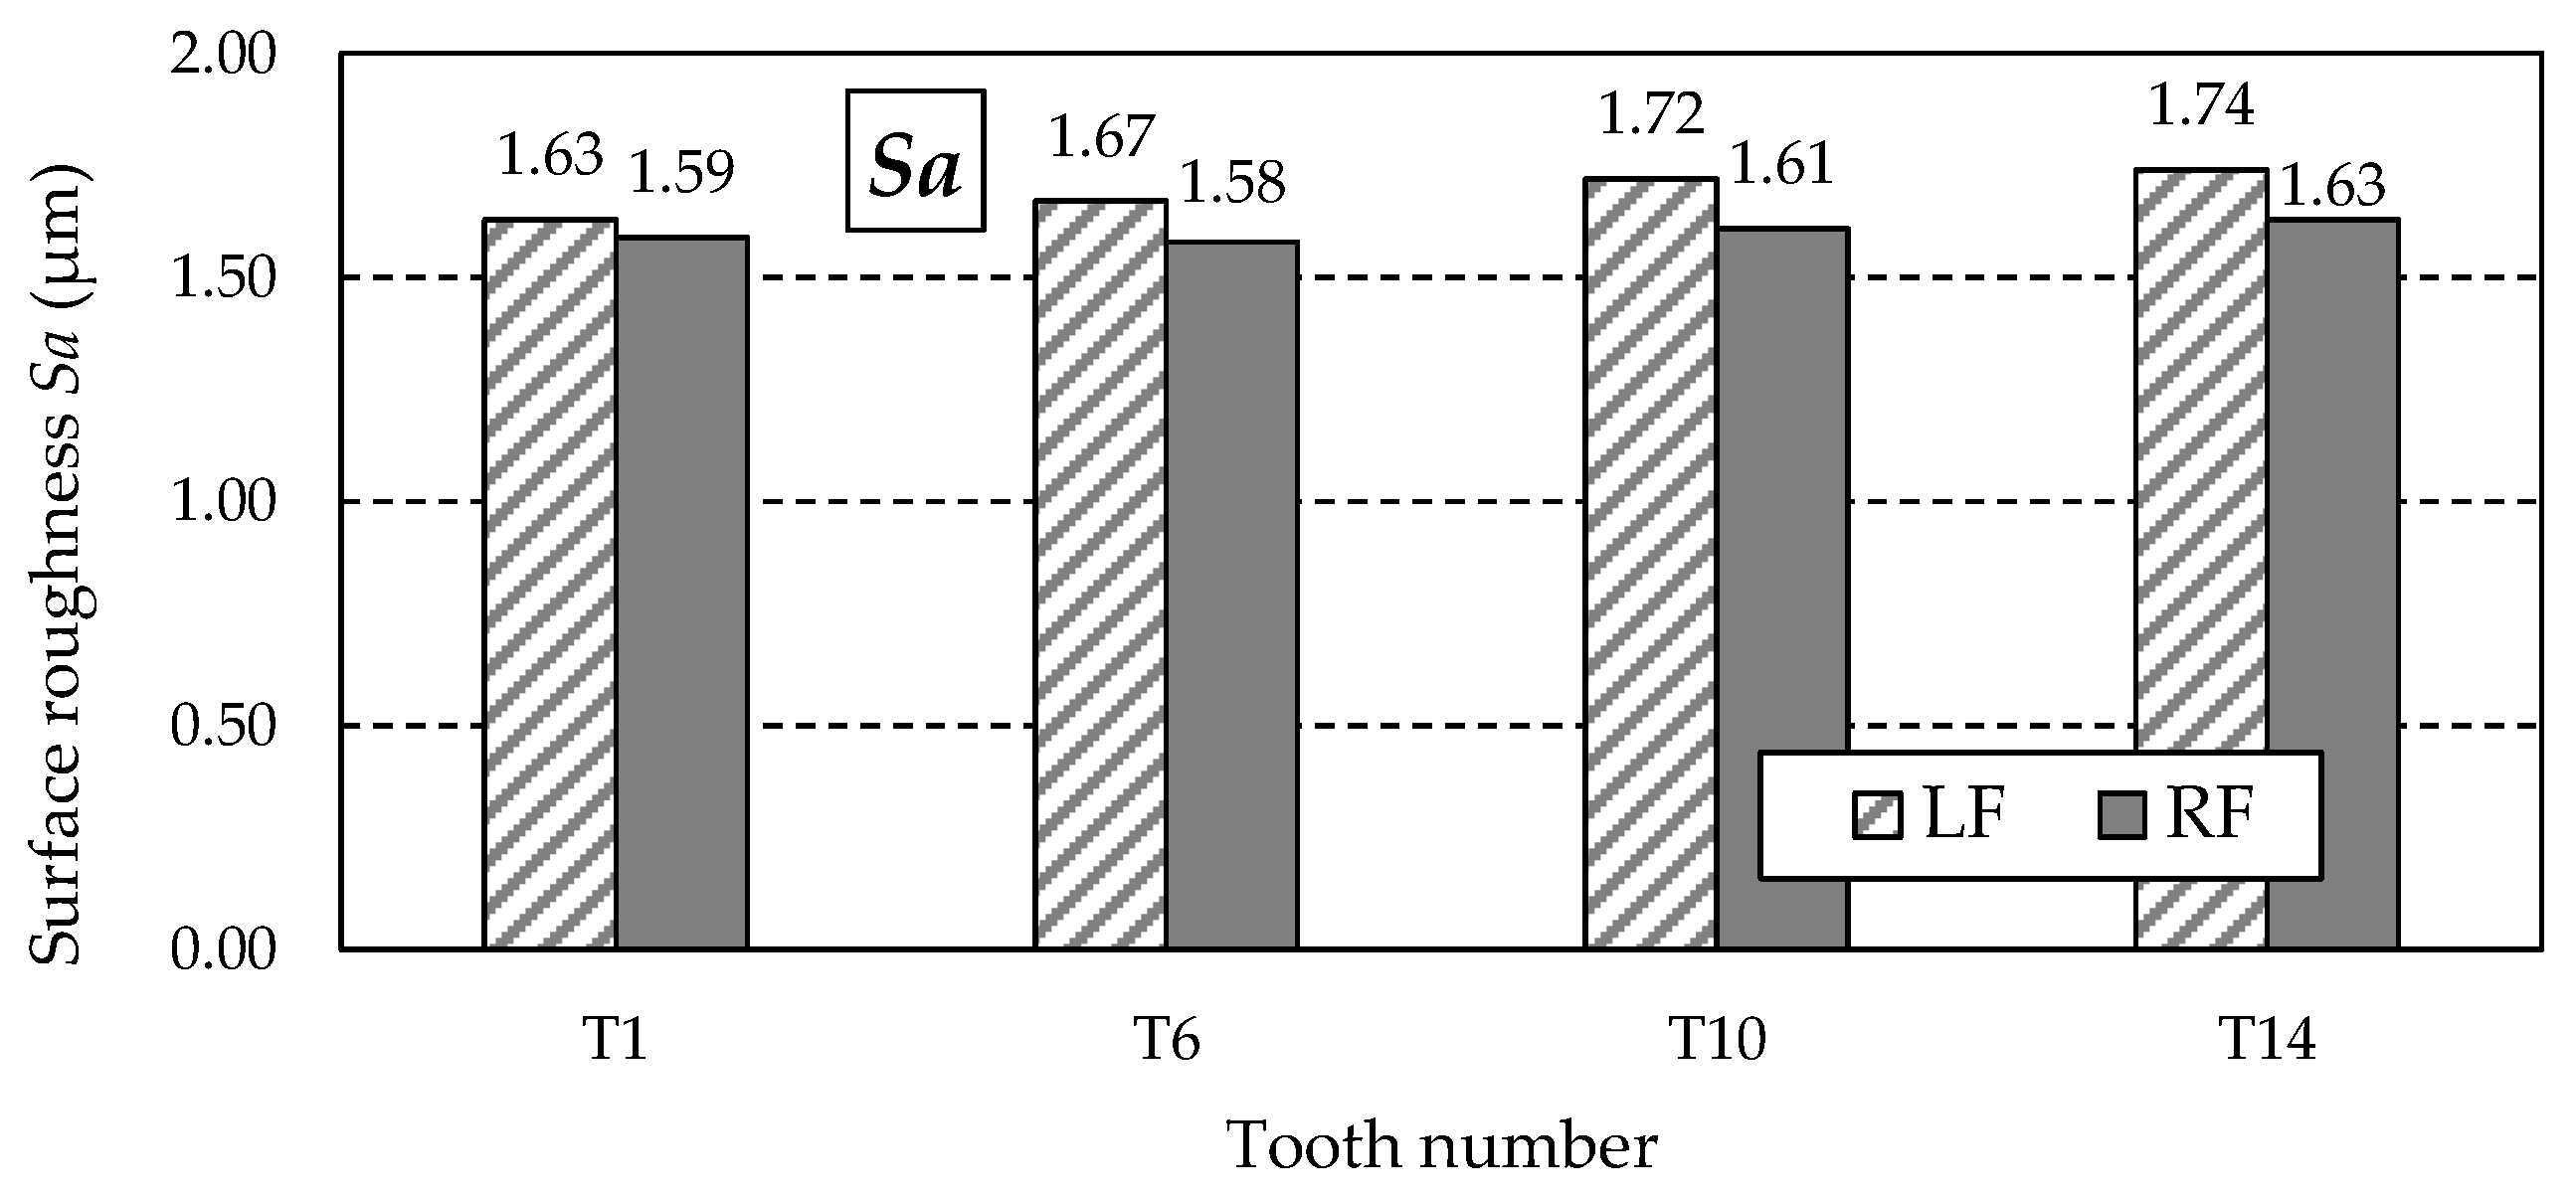
Figure 27.
Values of the Sa parameter for the left flank (LF) and right flank (RF) of the measured teeth—after grinding.
Figure 27.
Values of the Sa parameter for the left flank (LF) and right flank (RF) of the measured teeth—after grinding.
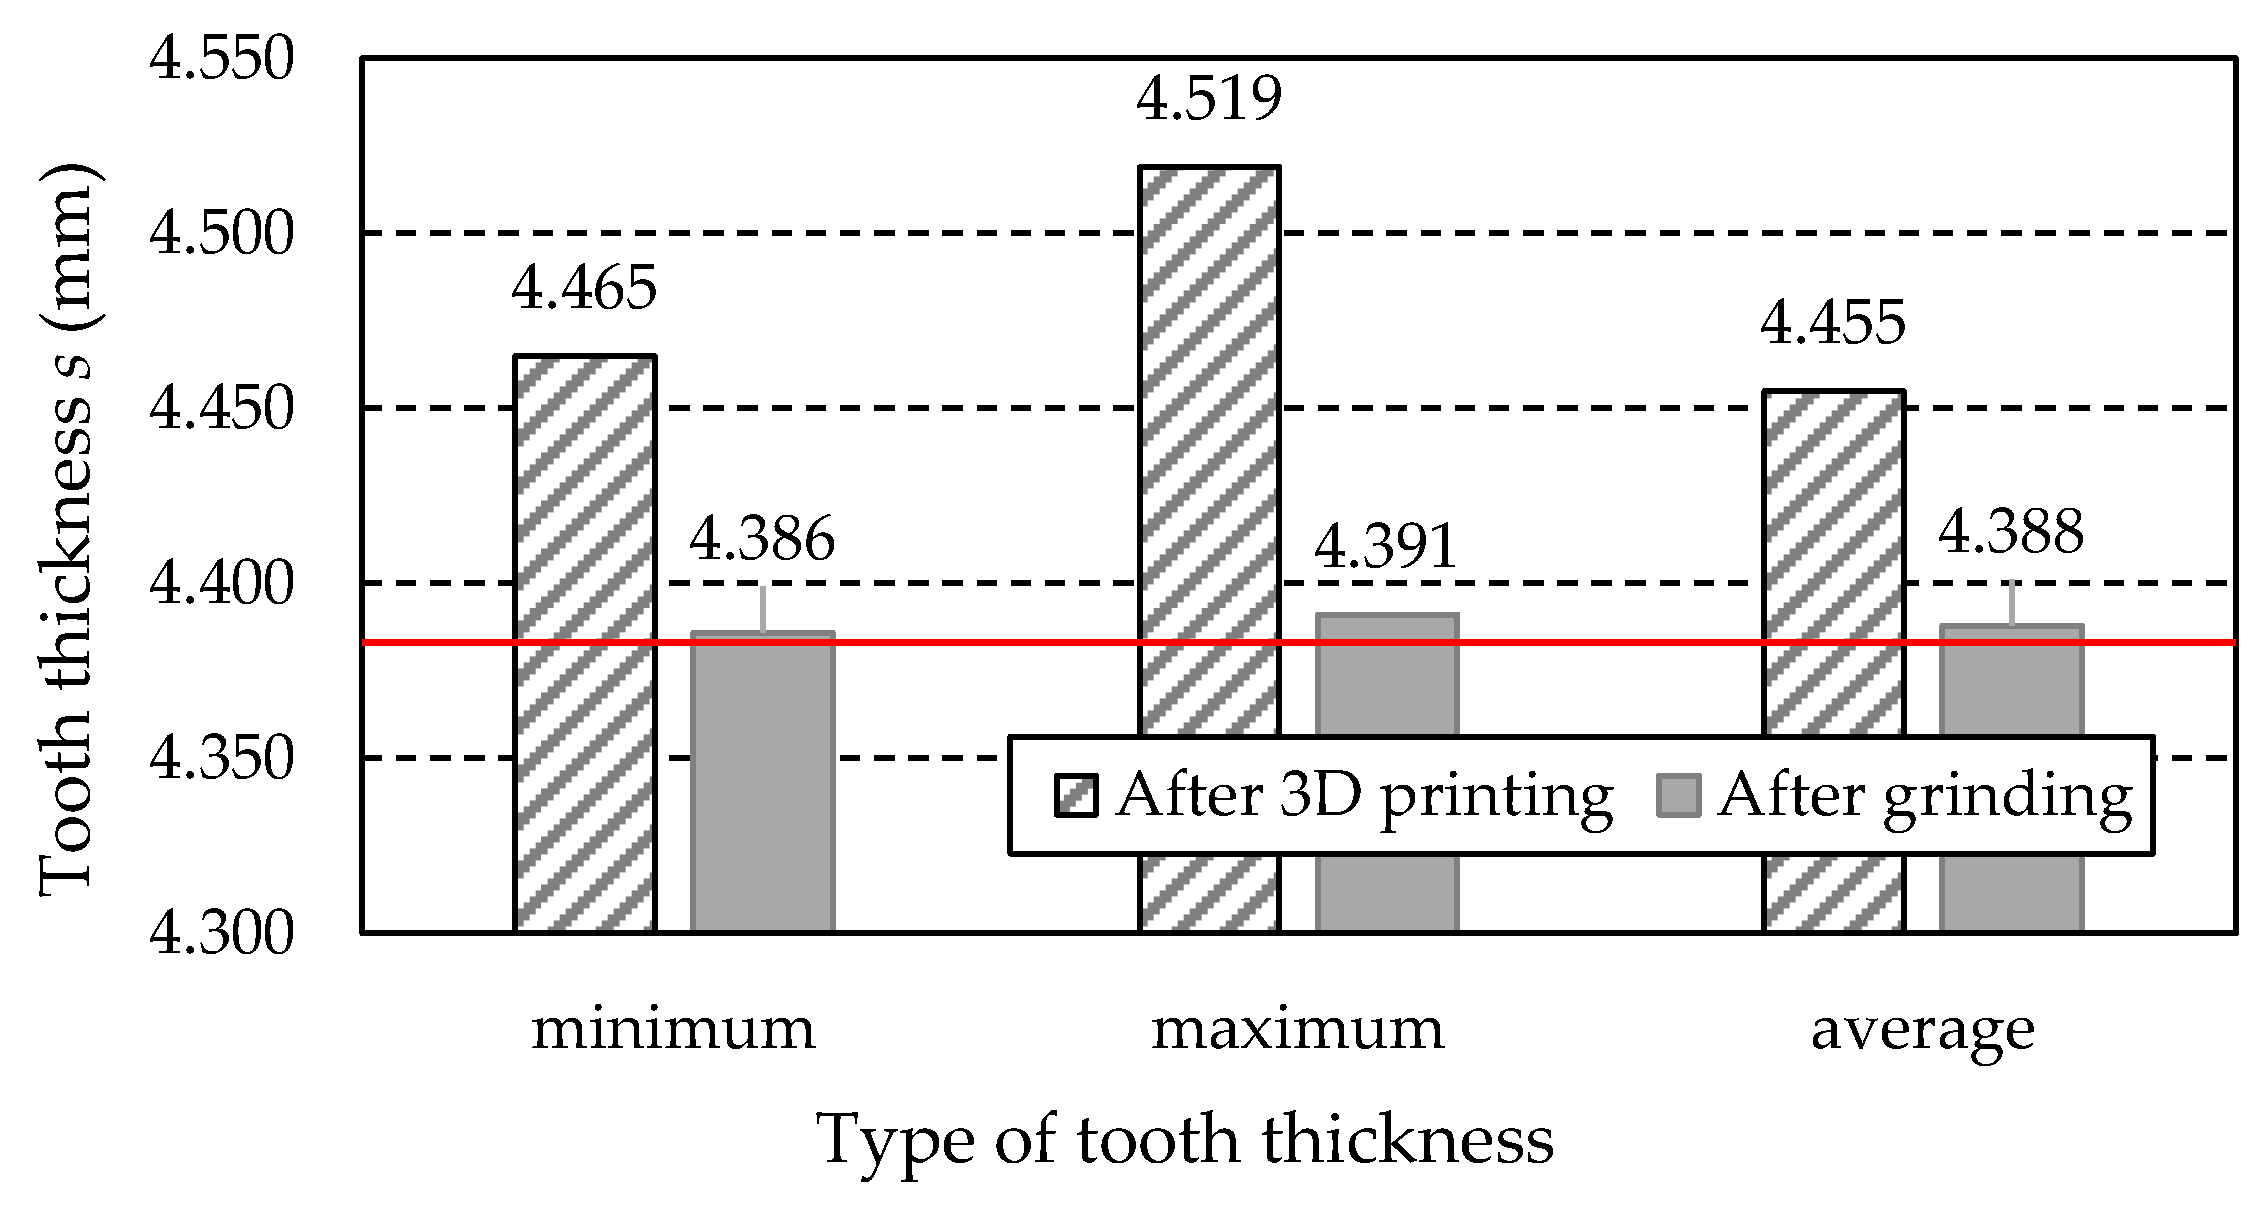
Figure 28.
The measured values of tooth thickness s.
Figure 28.
The measured values of tooth thickness s.
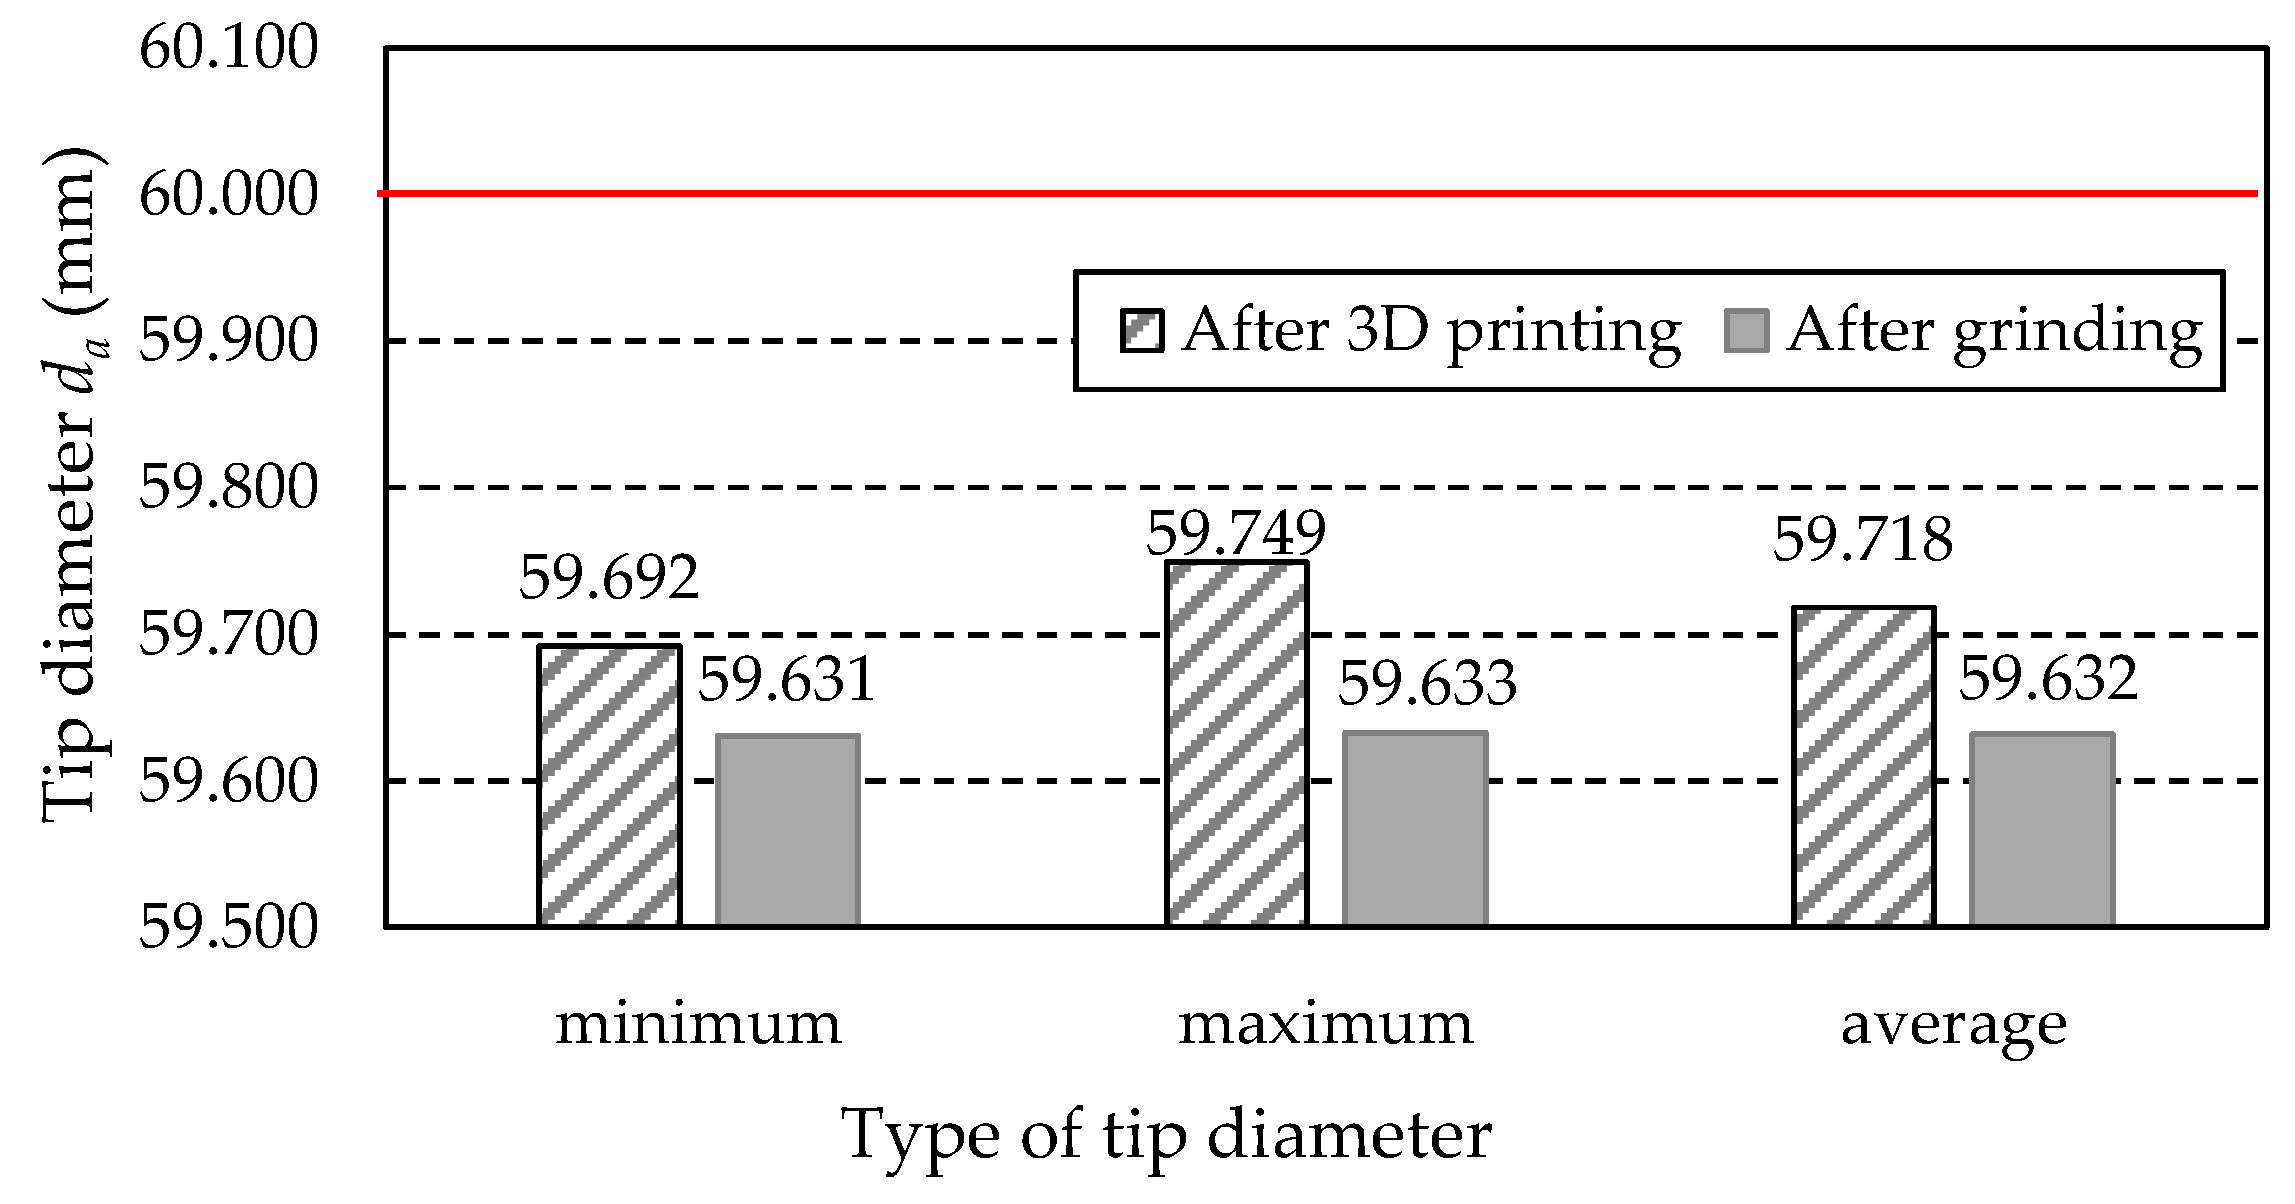
Figure 29.
Measured values of the tip diameter da.
Figure 29.
Measured values of the tip diameter da.
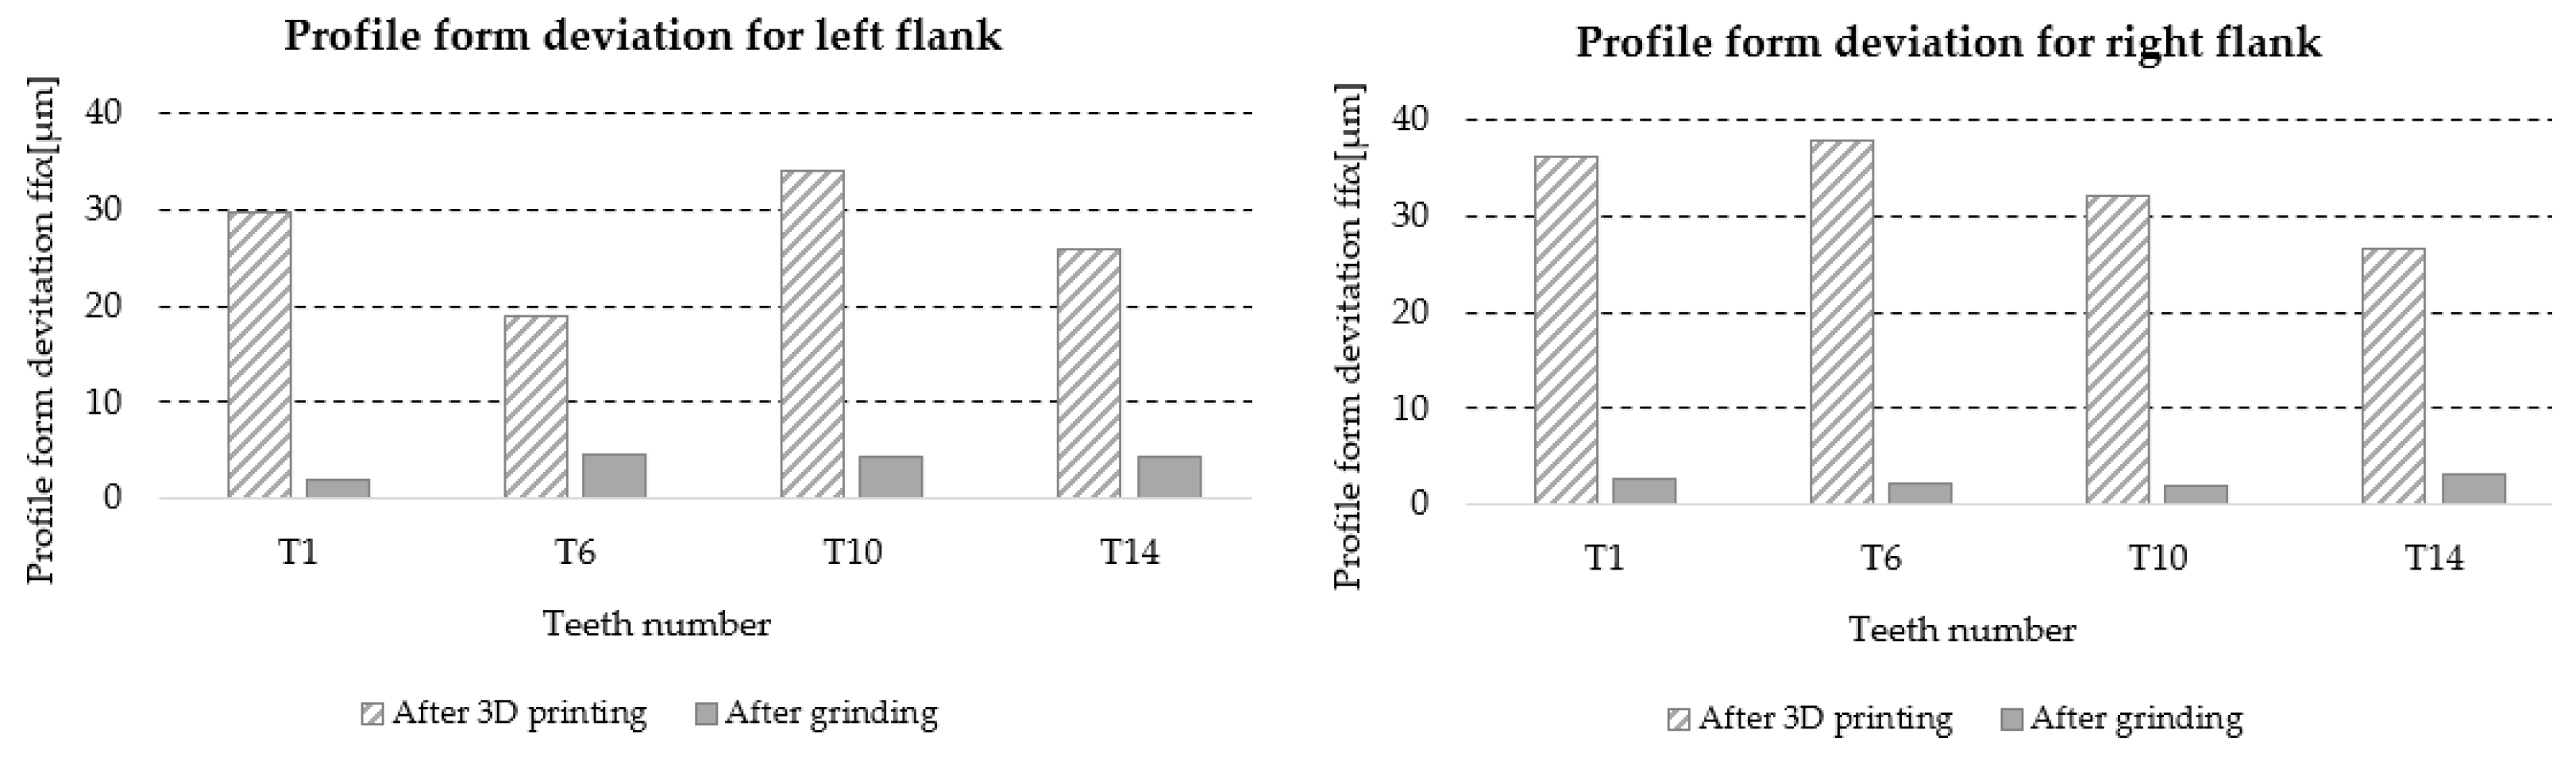
Figure 30.
Graphic illustration of profile form deviation ffα.
Figure 30.
Graphic illustration of profile form deviation ffα.
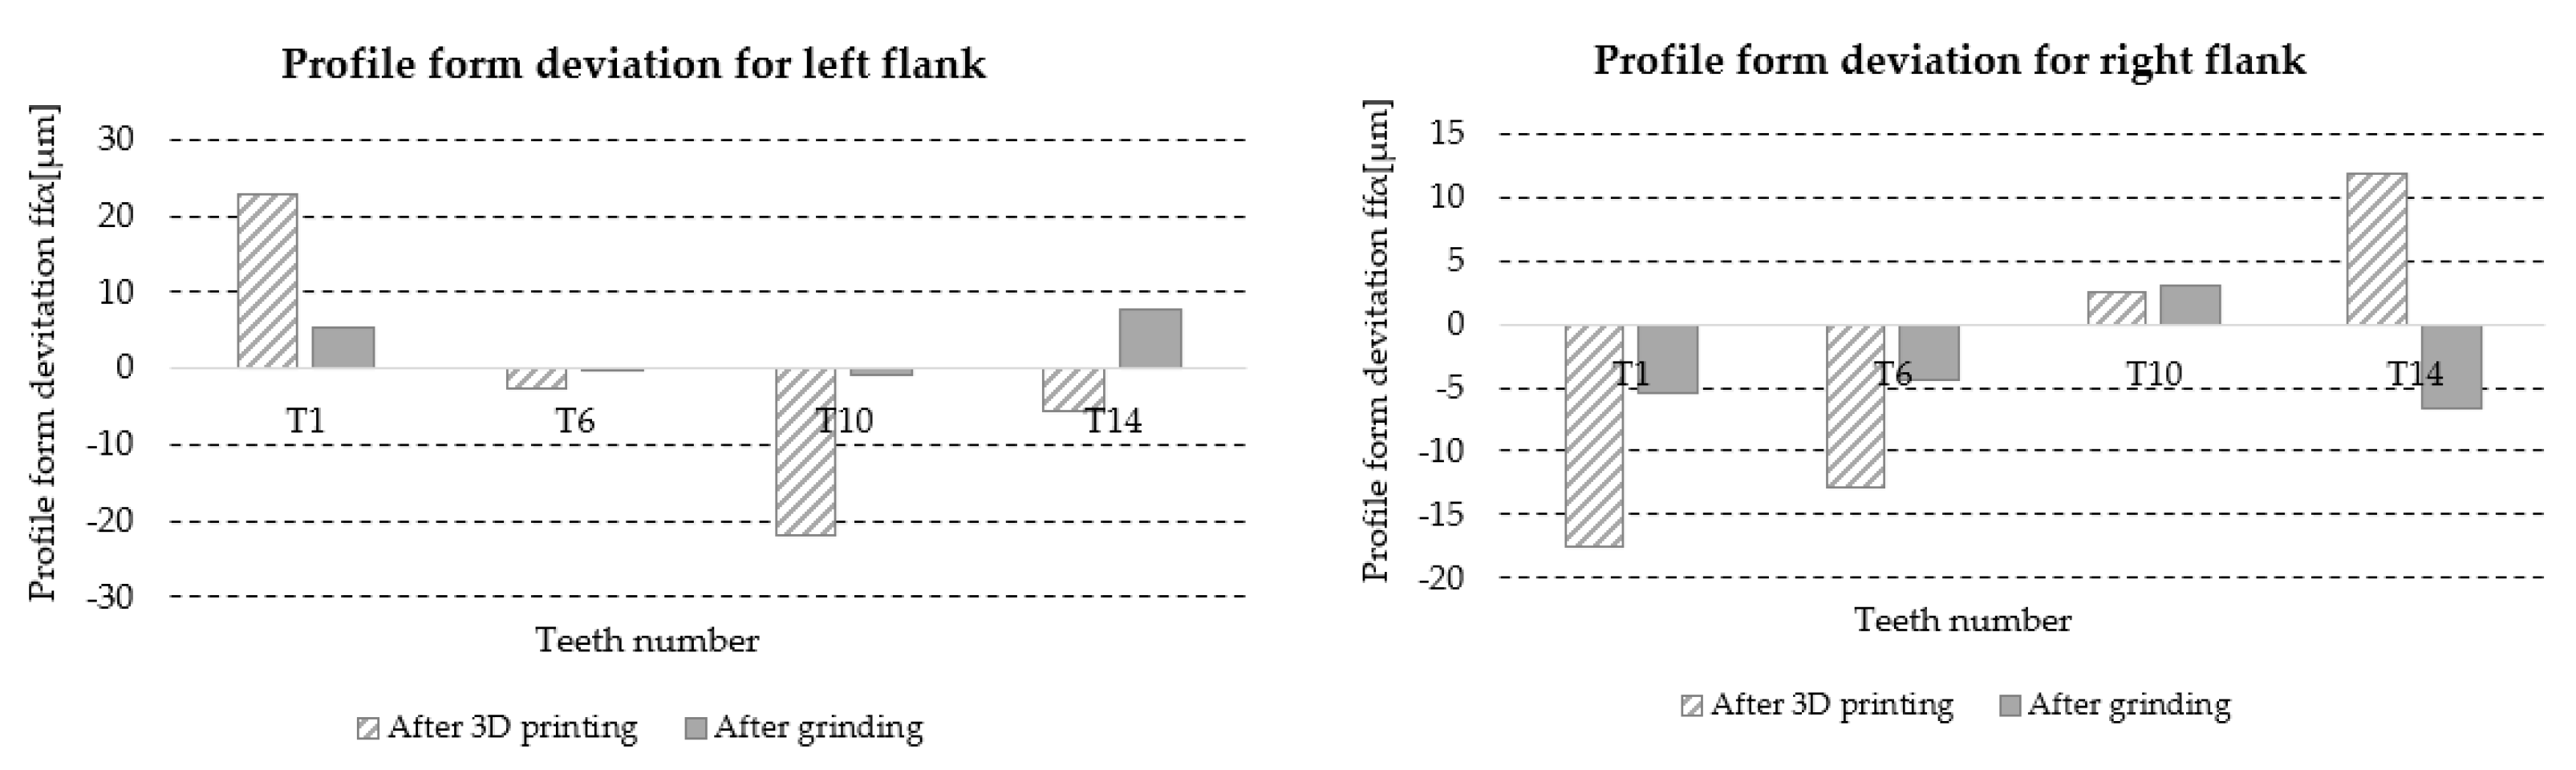
Figure 31.
Graphic illustration profile form deviation fHα.
Figure 31.
Graphic illustration profile form deviation fHα.
Figure 32.
Graphic illustration of profile form deviation ffβ.
Figure 32.
Graphic illustration of profile form deviation ffβ.
Figure 33.
Graphic illustration of profile form deviation fHβ.
Figure 33.
Graphic illustration of profile form deviation fHβ.
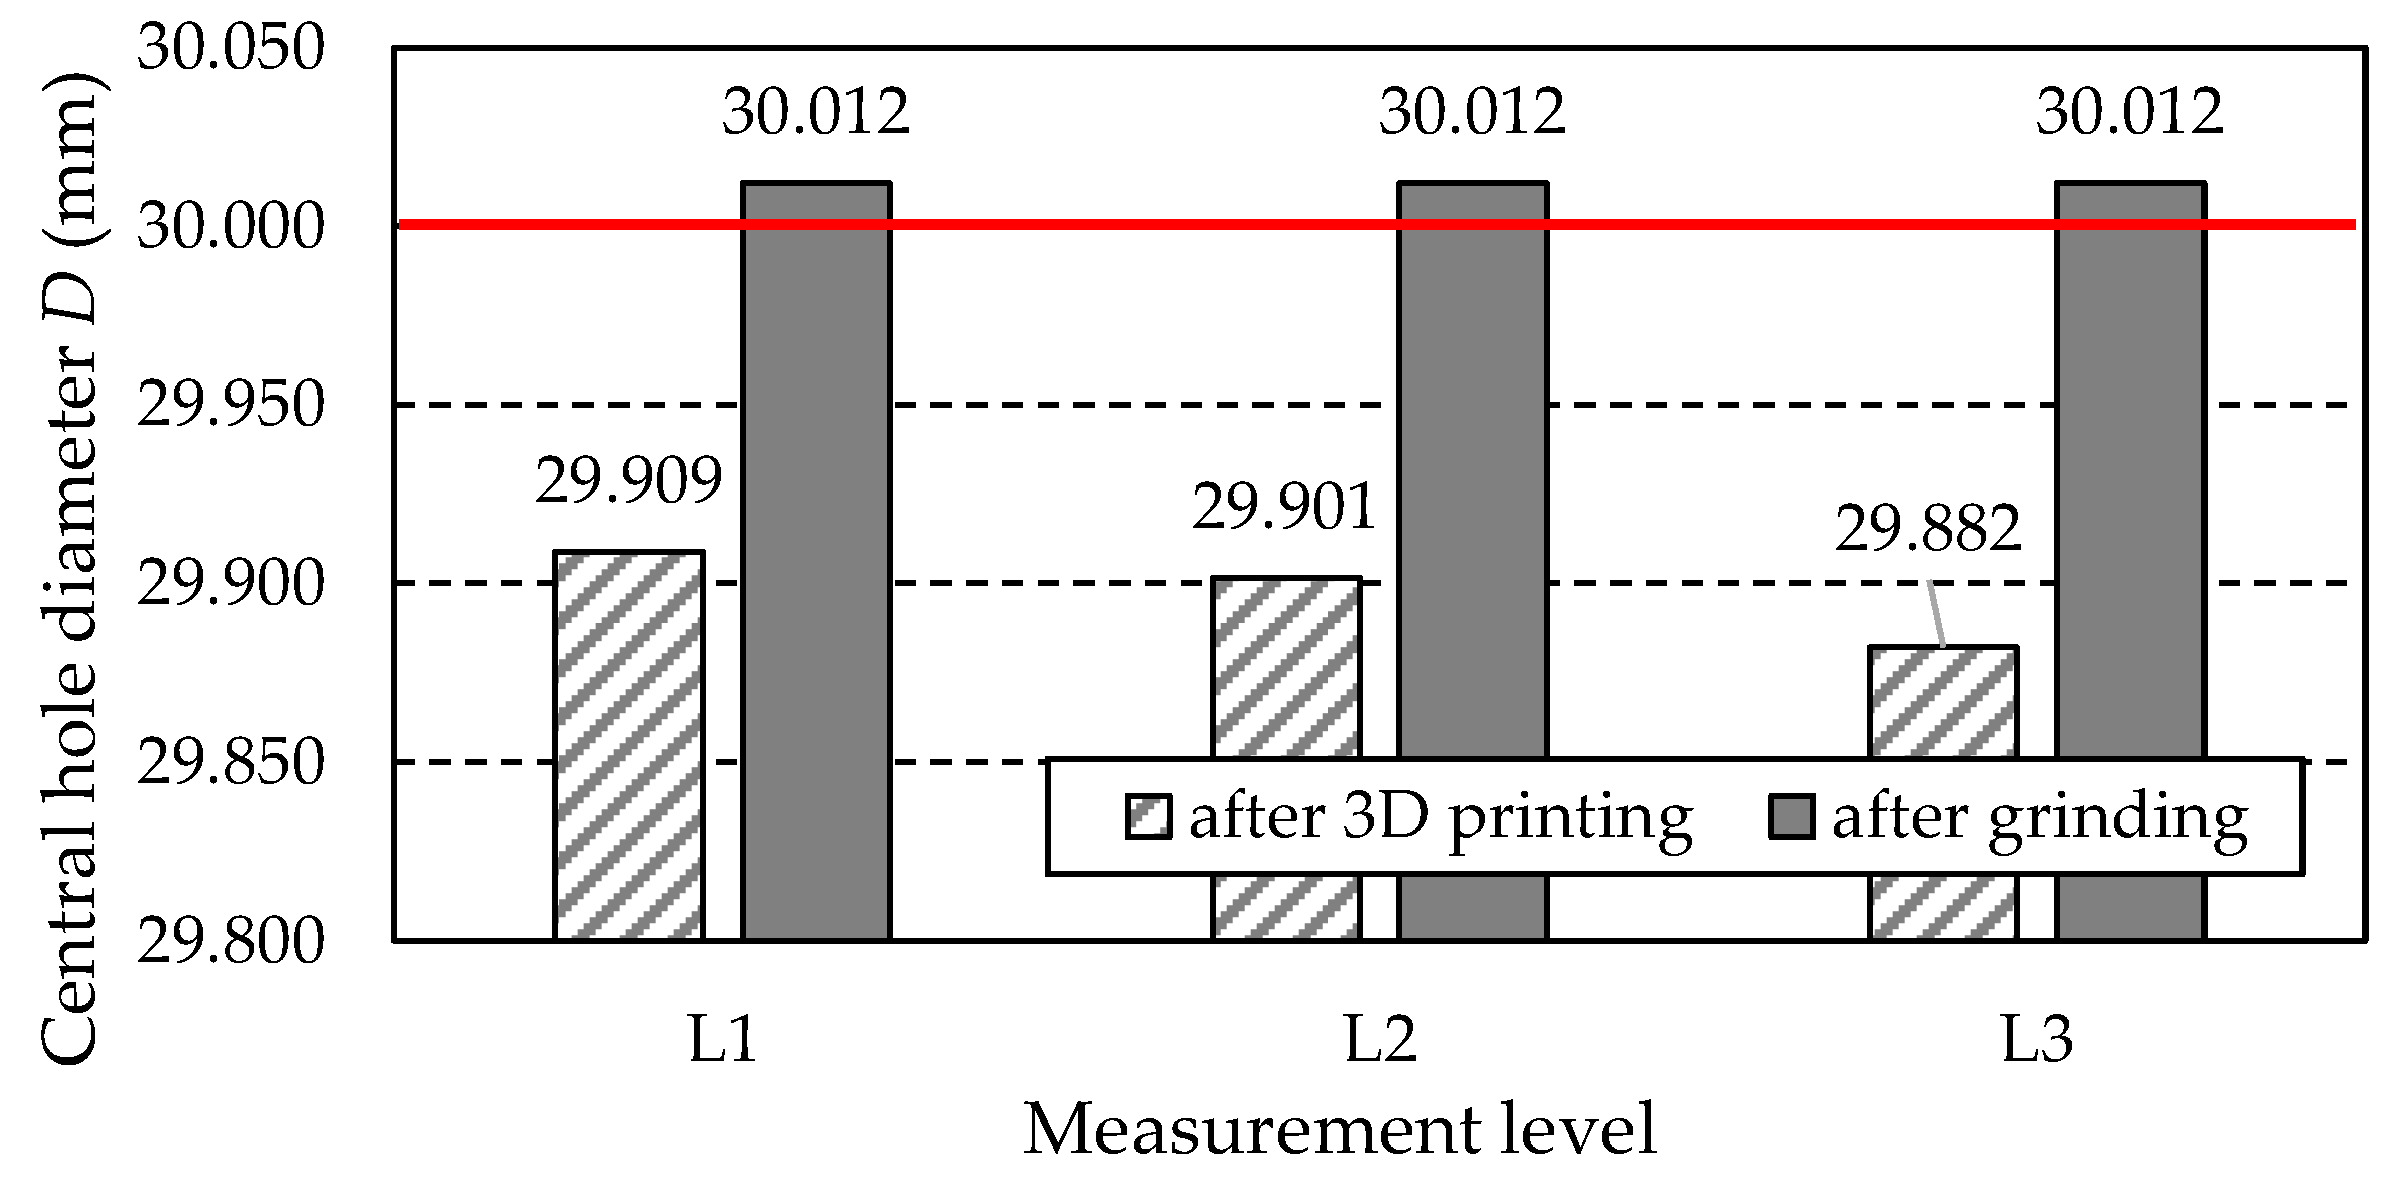
Figure 34.
Measured values of central hole diameter D.
Figure 34.
Measured values of central hole diameter D.
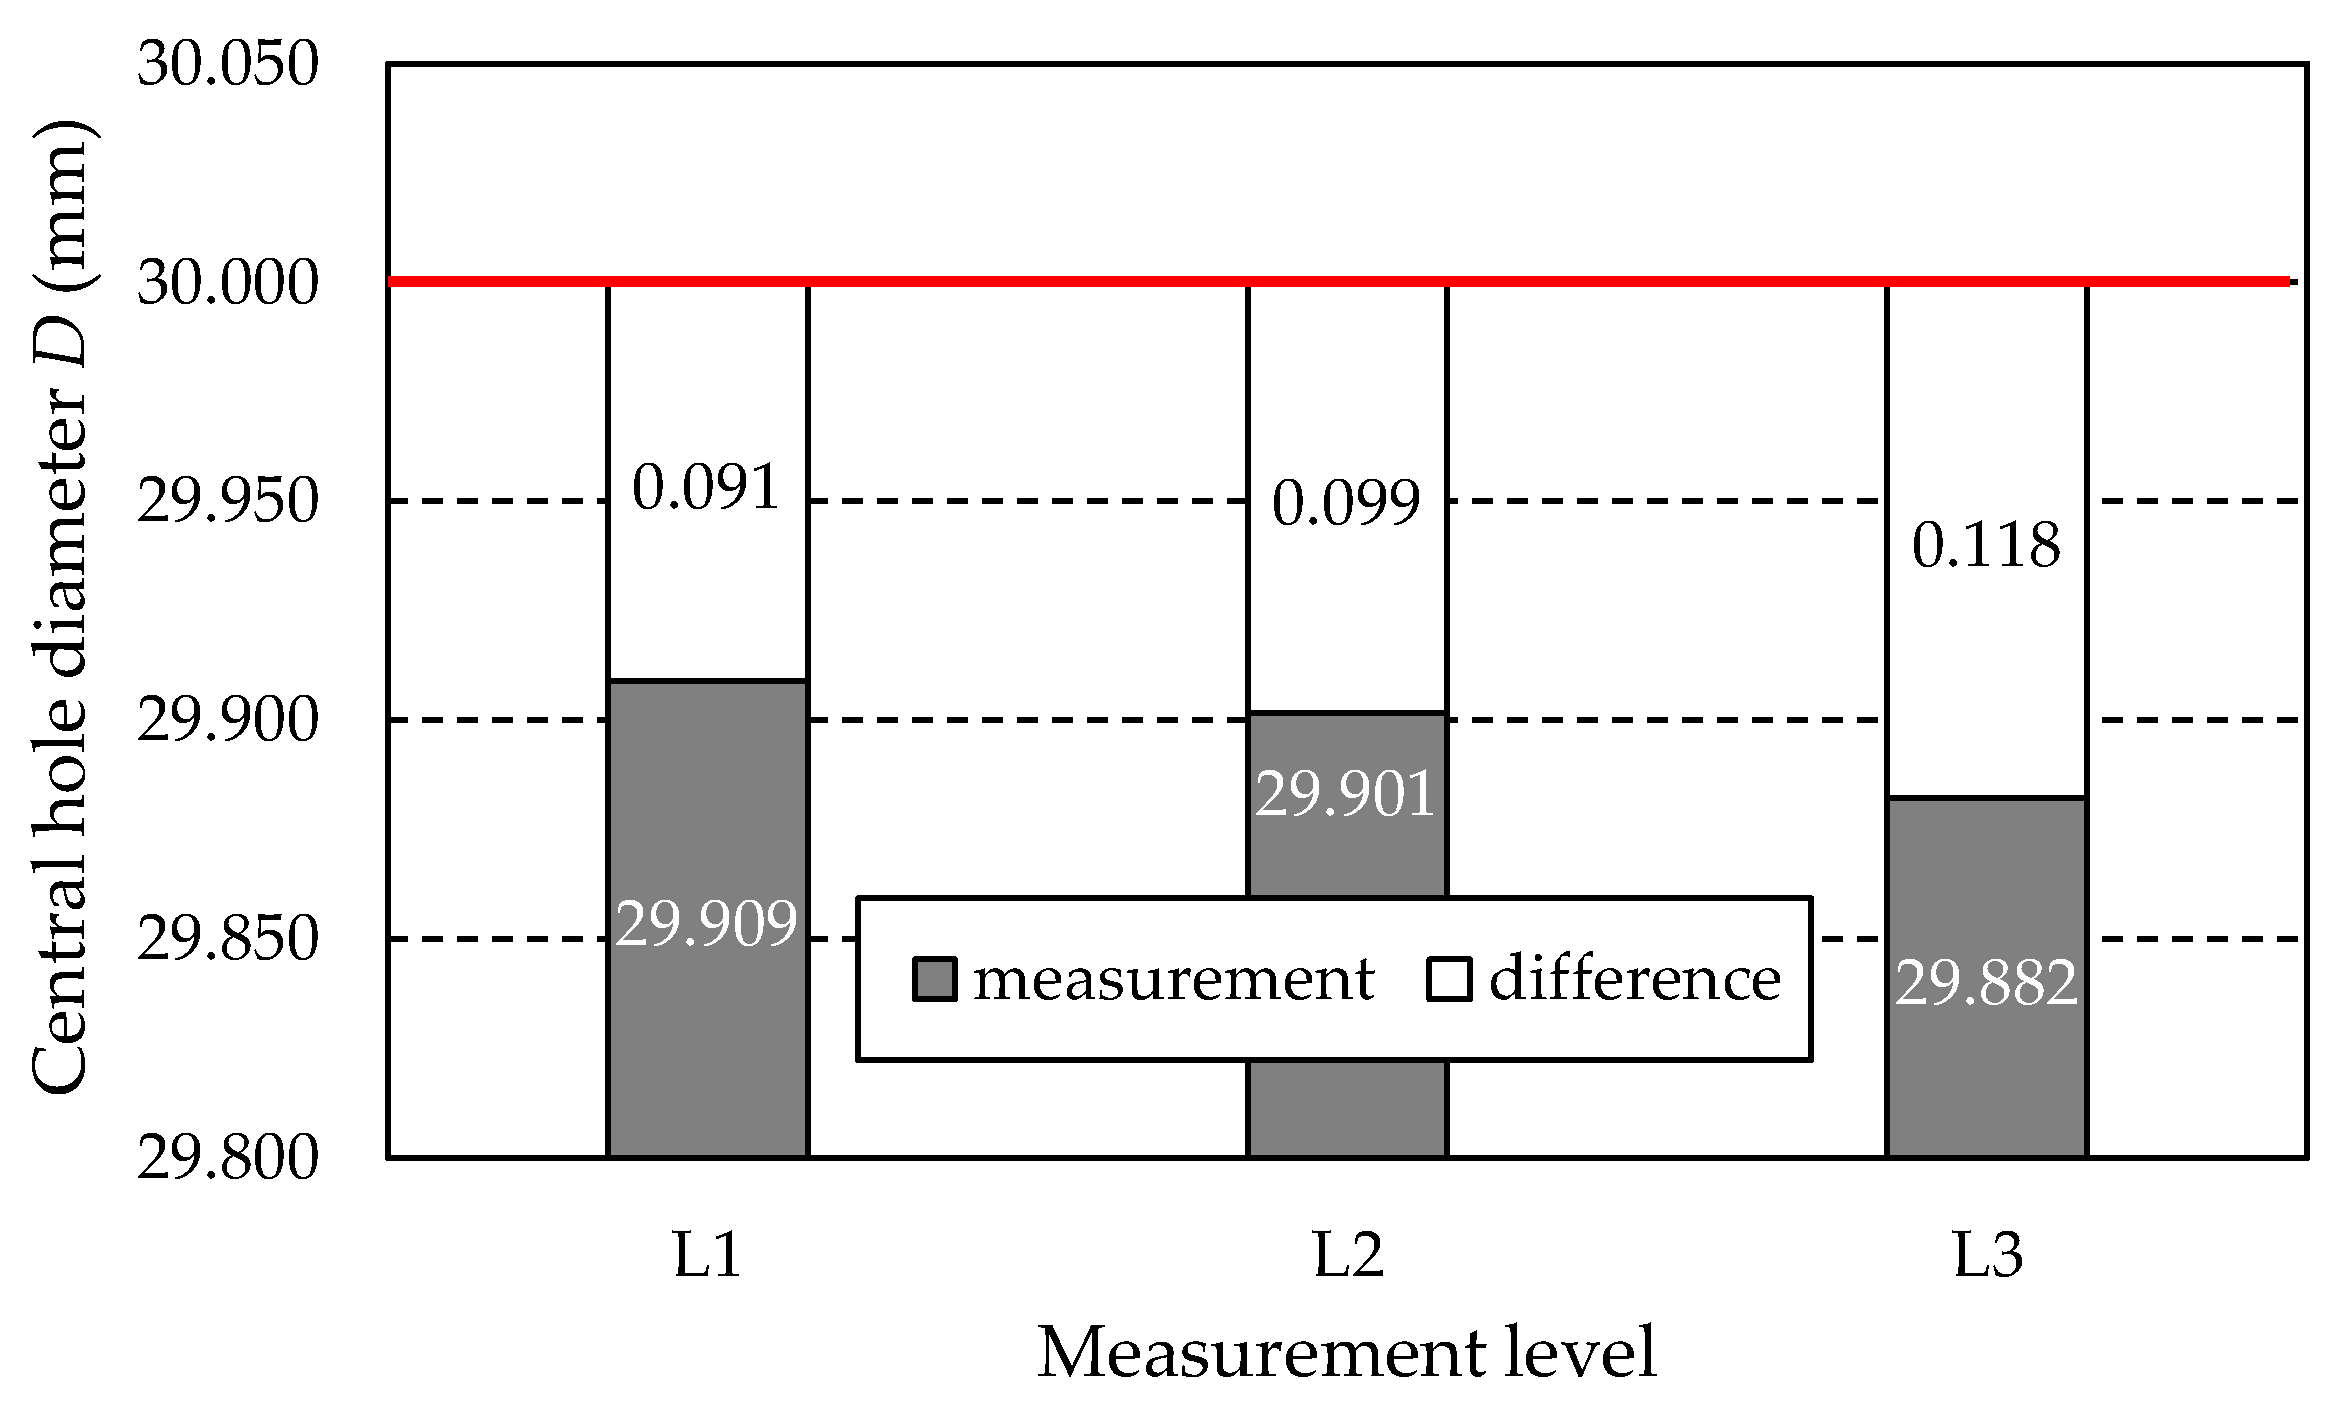
Figure 35.
Measured values of central hole diameter D including allowances to be removed.
Figure 35.
Measured values of central hole diameter D including allowances to be removed.
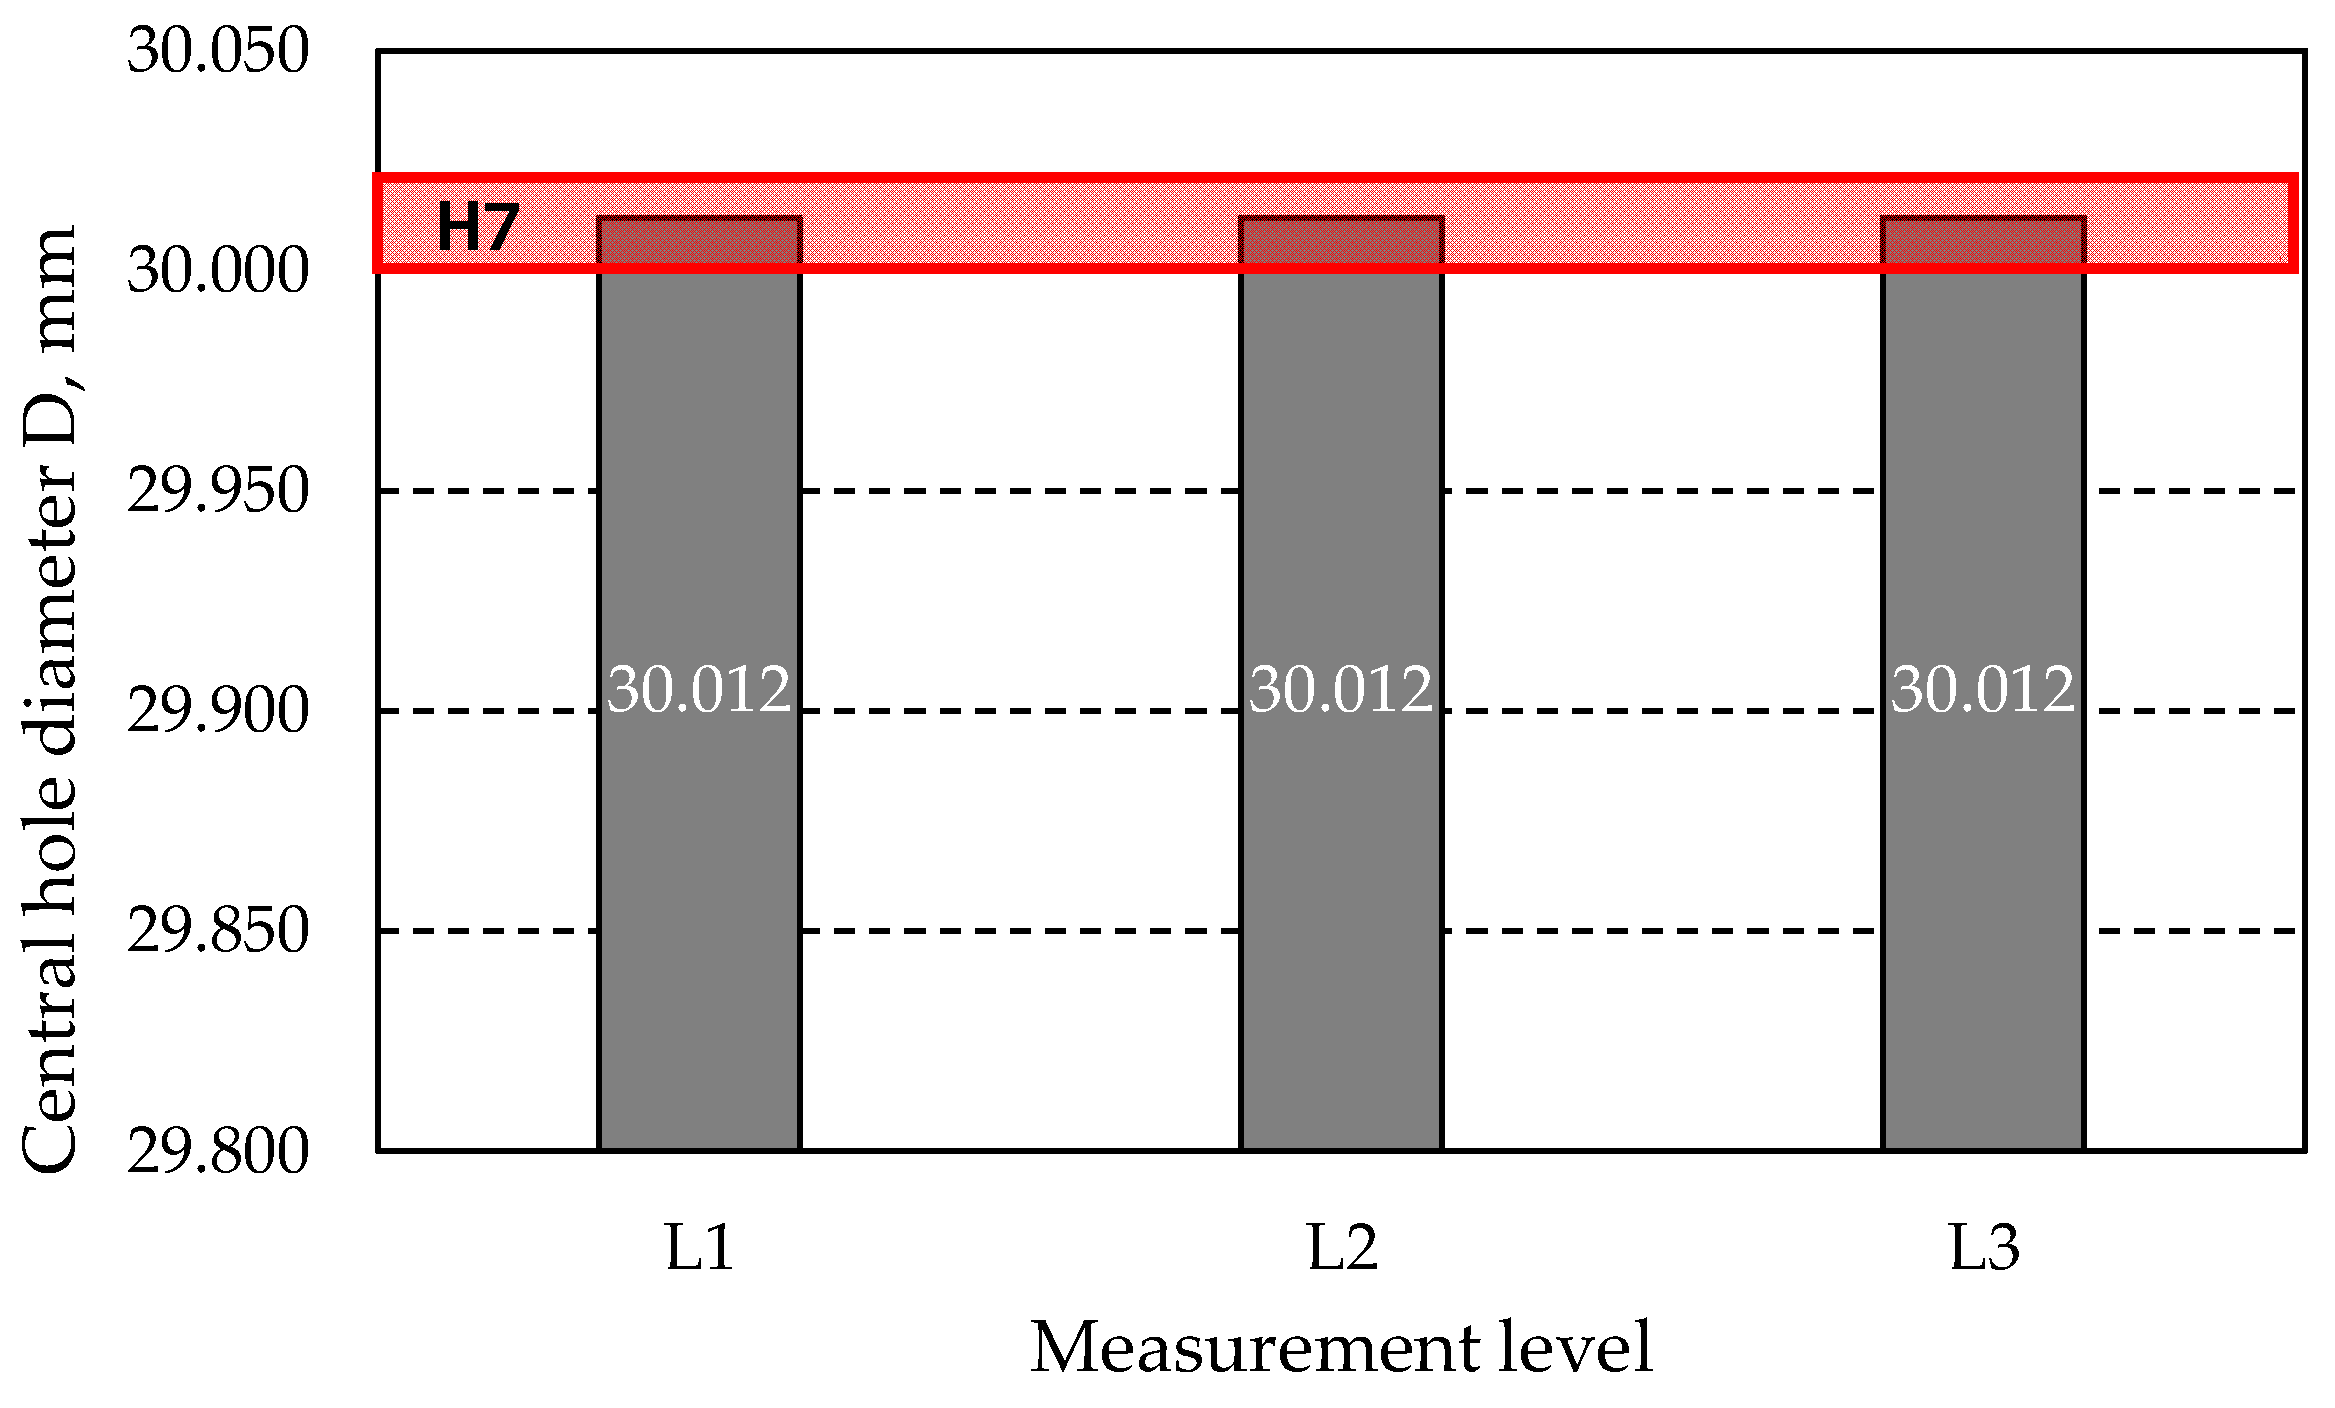
Figure 36.
Values of central hole diameter D measured after grinding.
Figure 36.
Values of central hole diameter D measured after grinding.
Figure 37.
Central hole roundness obtained by measurement at levels L1, L2, and L3.
Figure 37.
Central hole roundness obtained by measurement at levels L1, L2, and L3.
Figure 38.
Measured values of central hole cylindricity.
Figure 38.
Measured values of central hole cylindricity.
Table 1.
Nominal gear wheel dimensions.
Table 1.
Nominal gear wheel dimensions.
| Parameter | Value |
|---|
| Module | m = 3 mm |
| Number of teeth | z = 18 |
| Reference diameter | d = 54 mm |
| Tip diameter | da = 60 mm |
| Facewidth | b = 10 mm |
| Pressure angle | α = 20° |
| Helix angle | β = 0° |
| Profile shift coefficient | x = 0 |
| Central hole diameter | D = 30 mm |
| Tooth profile | Involute |
Table 2.
The chemical composition of 1.2709.
Table 2.
The chemical composition of 1.2709.
| Content of Elements (wt.%) |
|---|
| | Ni | Co | Mo | Ti | Al | Cr | Cu | C | Mn | Si | P | S |
|---|
| Min. | 17 | 8.5 | 4.5 | 0.6 | 0.05 | - | - | - | - | - | - | - |
| Max. | 19 | 9.5 | 5.2 | 0.8 | 0.15 | 0.5 | 0.5 | 0.03 | 0.1 | 0.1 | 0.01 | 0.01 |
Table 3.
The process parameters considered to prepare 3D-printed gears.
Table 3.
The process parameters considered to prepare 3D-printed gears.
| Parameter | Value |
|---|
| Layer thickness | 40 μm |
| Scanning method | Stripe/Zigzag |
| Stripe width | 10 mm |
| Overlap stripes | 0.08 mm |
| Hatch distance | 0.11 mm |
| Adjacent layers angle | 67° |
| Building direction | the main gear axe |
| Laser powder | 285 W |
| Laser speed | 960 mm/s |
Table 4.
Cutting conditions used during flat surface grinding.
Table 4.
Cutting conditions used during flat surface grinding.
| Grinding mode | Longitudinal circumferential flat surface grinding |
| Grinding machine | Flat-surface grinder SPD-30B made by Jotes Co., Ltd. (Łódź, Poland) |
| Grinding wheel | Vortex type—IPA60EH20VTX made by Norton Saint-Gobein Ltd. (Koło, Poland) |
| Grinding parameters | Grinding wheel peripheral speed vs. = 30.2 m/s |
| Workpiece speed vw = 18 m/min |
| Working engagement (depth of cut) ae = 0.01 mm |
| Machining allowance a = 0.3 mm |
| Dressing parameters | Dresser type: single diamond dresser type M1020 |
| Dresser weight Qd = 2.0 kt (0.4 g) |
| Axial table feed speed while dressing vfd = 5.0 m/s |
| Grinding wheel peripheral speed while dressing vsd = 10 m/s |
| Dressing allowance ad = 0.01 mm |
| Dressing passes id = 4 |
| Coolant | Coolant mode: conventional flood method |
| Coolant type: water–oil emulsion with Emulgol ES-12 oil (5%) |
| Flow rate Q = 4 L/min |
Table 5.
Cutting conditions used during internal cylindrical grinding.
Table 5.
Cutting conditions used during internal cylindrical grinding.
| Grinding mode | Internal cylindrical grinding |
| Grinding machine | Internal cylindrical grinder SOH 10 from Jotes Co., Ltd. (Łódź, Poland) |
| Grinding wheel | 99AF60K5VBE |
| Grinding parameters | Grinding wheel peripheral speed vs = 22.3 m/s |
| Workpiece speed vw = 17 m/min |
| Working engagement (depth of cut) ae = 0.02 mm |
| Machining allowance a = 0.2 mm |
| | Axial table feed speed vfa = 0.2 m/s |
| Dressing parameters | Dresser type: single diamond dresser type M1020 |
| Dresser weight Qd = 2.0 kt (0.4 g) |
| Axial table feed speed while dressing vfd = 5.0 mm/min |
| Grinding wheel peripheral speed while dressing vsd = 10 m/s |
| Dressing allowance ad = 0.01 mm |
| Dressing passes id = 4 |
| Coolant | Coolant mode: conventional flood method |
| Coolant type: water–oil emulsion with Emulgol ES-12 oil (5%) |
| Flow rate Q = 3.5 L/min |
Table 6.
Heat treatment parameters.
Table 6.
Heat treatment parameters.
| Ageing Heat Treatment Parameters | Temperature [°C] | Time [h] |
|---|
| Heating | 22–490 | 1.5 |
| Age-hardening | 490 | 6 |
| Cooling | with furnace |
Table 7.
Parameters of the grinding wheel used during the tests.
Table 7.
Parameters of the grinding wheel used during the tests.
| Parameter | Value |
|---|
| Grinding wheel type (shape) | Type 4, both sides with a tapered wheel (according to ISO 525) |
| Angle (face point to side) | 20° |
| Symbol | 99A80M8V |
| Abrasive grain | 99A—white aluminium oxide |
| Bond type | V—vitrified bond |
| Hardness grade | M |
| Grain size | 80 |
| Structure | 8—open |
| Grinding wheel dimensions D × T × H | 340 × 20 × 127 mm |
Table 8.
Grinding parameters used during testing.
Table 8.
Grinding parameters used during testing.
| Parameter | Value |
|---|
| Grinding mode | Generating gear grinding using the Niles method |
| Grinding wheel rotational speed | ns = 1590 rev/min |
| Grinding wheel peripheral speed | vs = 28.3 m/s |
| Axial table speed | vst = 165 mm/min |
| Working engagement (machining allowance) | ae = 0.03 mm |
| Grinding wheel stroke length | lsk = 35 mm |
| Workpiece speed | vw = 10 m/min |
| Grinding wheel stroke frequency | DH = 100 double-stroke/min |
Table 9.
Surface roughness measuring conditions.
Table 9.
Surface roughness measuring conditions.
| Parameter | Value |
|---|
| Type of profilometer | Hommel Tester T8000 made by Hommelwerke company (Schwenningen, Germany) |
| Stylus type | TKU 300 |
| Tracing length | lt = 4.8 mm |
| Evaluation length | ln = 4.0 mm |
| Sampling length | lr = 0.8 mm |
| Evaluation width | l = 5 mm |
| Number of stylus passes | 20 |
| Distance between stylus tracks | 0.25 mm |
| Stylus tip radius | rtip = 2 µm |
| Tracing speed | vt = 0.05 mm/s |
| Measuring range | ±400 µm |
Table 10.
Texture aspect ratio and isotropy of measured surfaces.
Table 10.
Texture aspect ratio and isotropy of measured surfaces.
| Tooth Number | Tooth Flank | Texture Aspect Ratio Str (−) | Isotropy (%) |
|---|
| T1 | LF | 0.375 | 33.8 |
| RF | 0.355 | 35.1 |
| T2 | LF | 0.361 | 33.5 |
| RF | 0.345 | 34.5 |
| T3 | LF | 0.337 | 32.7 |
| RF | 0.374 | 37.4 |
| T4 | LF | 0.325 | 32.5 |
| RF | 0.326 | 32.6 |
Table 11.
Surface roughness 3D parameters—after printing, before grinding.
Table 11.
Surface roughness 3D parameters—after printing, before grinding.
| Tooth Number | Tooth Flank | Sa (μm) | Sz (μm) | Sp (μm) | Sv (μm) | Ssk (μm) |
|---|
| T1 | LF | 4.37 | 42.8 | 24.4 | 18.4 | 0.919 |
| RF | 3.98 | 32.4 | 16.6 | 15.8 | 1.03 |
| T6 | LF | 4.01 | 39.9 | 21.9 | 18 | 0.945 |
| RF | 4.72 | 41.9 | 25.5 | 16.4 | 0.838 |
| T10 | LF | 4.17 | 52.6 | 25.1 | 27.5 | 0.849 |
| RF | 4.92 | 69.1 | 46.4 | 22.7 | 1.03 |
| T14 | LF | 5.21 | 60.2 | 36.2 | 24 | 0.876 |
| RF | 4.6 | 47.6 | 29.2 | 18.4 | 0.907 |
Table 12.
Texture aspect ratio and isotropy of measured surfaces—after grinding.
Table 12.
Texture aspect ratio and isotropy of measured surfaces—after grinding.
| Tooth Number | Tooth Flank | Texture Aspect Ratio Str (−) | Isotropy (%) |
|---|
| T1 | LF | 0.090 | 9.0 |
| RF | 0.095 | 9.5 |
| T6 | LF | 0.092 | 9.2 |
| RF | 0.098 | 9.8 |
| T10 | LF | 0.087 | 8.7 |
| RF | 0.093 | 9.3 |
| T14 | LF | 0.090 | 9.0 |
| RF | 0.096 | 9.6 |
Table 13.
Surface roughness 3D parameters—after grinding.
Table 13.
Surface roughness 3D parameters—after grinding.
| Tooth Number | Tooth Flank | Sa (μm) | Sz (μm) | Sp (μm) | Sv (μm) | Ssk (μm) |
|---|
| T1 | LF | 1.63 | 8.9 | 6.5 | 1.8 | 1.53 |
| RF | 1.59 | 9.5 | 7.3 | 1.9 | 1.66 |
| T6 | LF | 1.67 | 8.6 | 6.1 | 1.4 | 1.51 |
| RF | 1.58 | 9.3 | 7.2 | 1.4 | 1.58 |
| T10 | LF | 1.72 | 8.1 | 6.4 | 1.4 | 1.44 |
| RF | 1.61 | 9.0 | 7.3 | 1.1 | 1.55 |
| T14 | LF | 1.74 | 8.2 | 6.6 | 1.6 | 1.50 |
| RF | 1.63 | 8.6 | 7.1 | 1.6 | 1.54 |
Table 14.
Measured values of radial runout of teeth.
Table 14.
Measured values of radial runout of teeth.
| Gear Type | Radial Runout Fr (μm) | Gear Tooth Quality |
|---|
| After 3D printing | 74 | 7 |
| After grinding | 10 | 3 |
Table 15.
Measured tooth thickness values.
Table 15.
Measured tooth thickness values.
| Gear after 3D printing | Tooth thickness s (mm) |
| Minimum smin | Maximum smax | Average save |
| 4.465 | 4.519 | 4.455 |
| Difference between measured and nominal (sCAD) value |
| 0.139 | 0.085 | 0.075 |
| Gear after grinding | Tooth thickness s (mm) |
| Minimum smin | Maximum smax | Average save |
| 4.386 | 4.395 | 4.390 |
| Difference between measured and nominal (sCAD) value |
| 0.110 | 0.006 | 0.008 |
Table 16.
Measured values of the tip diameter.
Table 16.
Measured values of the tip diameter.
| Gear after 3D printing | Tip diameter da (mm) |
| Minimum da min | Maximum da max | Average da ave |
| 59.692 | 59.749 | 59.718 |
| Difference between measured and nominal (da CAD) value |
| −0.308 | −0.251 | −0.282 |
| Gear after grinding | Tip diameter da (mm) |
| Minimum da min | Maximum da max | Average da ave |
| 59.631 | 59.633 | 59.632 |
| Difference between measured and nominal (da CAD) value |
| −0.369 | −0.367 | −0.368 |
Table 17.
Measured values of profile form deviation ffα for the left and right flanks of the wheel teeth.
Table 17.
Measured values of profile form deviation ffα for the left and right flanks of the wheel teeth.
| Gear Type | Teeth Number | Profile Form Deviation ffα (μm) |
|---|
| Left Flank LF | Gear Tooth Quality | Right Flank RF | Gear Tooth Quality |
|---|
| After 3D printing | T1 | 20.3 | 10 | 46.8 | 11 |
| T6 | 23.0 | 27.0 |
| T10 | 29.3 | 30.4 |
| T14 | 26.7 | 29.2 |
| After grinding | T1 | 5.0 | 6 | 4.7 | 6 |
| T6 | 6.5 | 7.3 |
| T10 | 5.8 | 5.9 |
| T14 | 4.8 | 6.0 |
Table 18.
Measured values of the profile slope deviation fHα for the left and right flanks of the wheel teeth.
Table 18.
Measured values of the profile slope deviation fHα for the left and right flanks of the wheel teeth.
| Gear Type | Teeth Number | Profile Slope Deviation fHα (μm) |
|---|
| Left Flank LF | Gear Tooth Quality | Right Flank RF | Gear Tooth Quality |
|---|
| After 3D printing | T1 | −85.0 | 13 | −34.2 | 12 |
| T6 | −36.4 | −10.8 |
| T10 | −46.4 | −63.8 |
| T14 | −53.3 | −59.2 |
| After grinding | T1 | −0.1 | 7 | 36.7 | 11 |
| T6 | −8.1 | 35.8 |
| T10 | −8.2 | 22.5 |
| T14 | −4.5 | 25.9 |
Table 19.
Measured values of helix form deviation ffβ for the left and right flanks of the wheel teeth.
Table 19.
Measured values of helix form deviation ffβ for the left and right flanks of the wheel teeth.
| Gear Type | Teeth Number | Helixform Deviation ffβ (μm) |
|---|
| Left Flank LF | Gear Tooth Quality | Right flank RF | Gear Tooth Quality |
|---|
| After 3D printing | T1 | 29.6 | 10 | 36.1 | 10 |
| T6 | 18.9 | 37.8 |
| T10 | 34.0 | 32.2 |
| T14 | 25.9 | 26.5 |
| After grinding | T1 | 1.9 | 3 | 2.7 | 2 |
| T6 | 4.5 | 2.1 |
| T10 | 4.2 | 2.0 |
| T14 | 4.3 | 3.1 |
Table 20.
Measured values of the helix slope deviation fHβ for the left and right flanks of the wheel teeth.
Table 20.
Measured values of the helix slope deviation fHβ for the left and right flanks of the wheel teeth.
| Gear Type | Teeth Number | Helixslope Deviation fHβ (μm) |
|---|
| Left Flank LF | Gear Tooth Quality | Right Flank RF | Gear Tooth Quality |
|---|
| After 3D printing | T1 | 22.9 | 9 | −17.5 | 8 |
| T6 | −2.5 | −12.8 |
| T10 | −21.9 | 2.5 |
| T14 | −5.7 | 11.9 |
| After grinding | T1 | 5.4 | 6 | −5.4 | 5 |
| T6 | −0.1 | −4.3 |
| T10 | −0.9 | 3.1 |
| T14 | 7.6 | −6.7 |
Table 21.
Measured values of the diameter of the central hole.
Table 21.
Measured values of the diameter of the central hole.
| Gear Type | Level Number | Central Hole Diameter D (mm) | Difference Between Nominal and Measured Value (mm) |
|---|
| After 3D printing | L1 | 29.909 | −0.091 |
| L2 | 29.901 | −0.099 |
| L3 | 29.882 | −0.118 |
| After grinding | L1 | 30.012 | 0.012 |
| L2 | 30.012 | 0.012 |
| L3 | 30.012 | 0.012 |
Table 22.
Central hole roundness obtained by measurement at levels L1, L2, and L3.
Table 22.
Central hole roundness obtained by measurement at levels L1, L2, and L3.
| Gear Type | Level Number | Roundness (mm) |
|---|
| After 3D printing | L1 | 0.068 |
| L2 | 0.093 |
| L3 | 0.075 |
| After grinding | L1 | 0.013 |
| L2 | 0.013 |
| L3 | 0.011 |
Table 23.
Cylindricity.
| Gear Type | Cylindricity (mm) |
|---|
| After 3D printing | 0.046 |
| After grinding | 0.004 |


 ,
, 


