
Insights into the Corrosion Behavior of Pure Magnesium and Magnesium–Calcium Alloy (Mg-1.8 at.% Ca) in Thin-Film and Bulk Forms

 , , , ,
  ,
,  and
and
Abstract

1. Introduction
2. Materials and Methods
3. Results
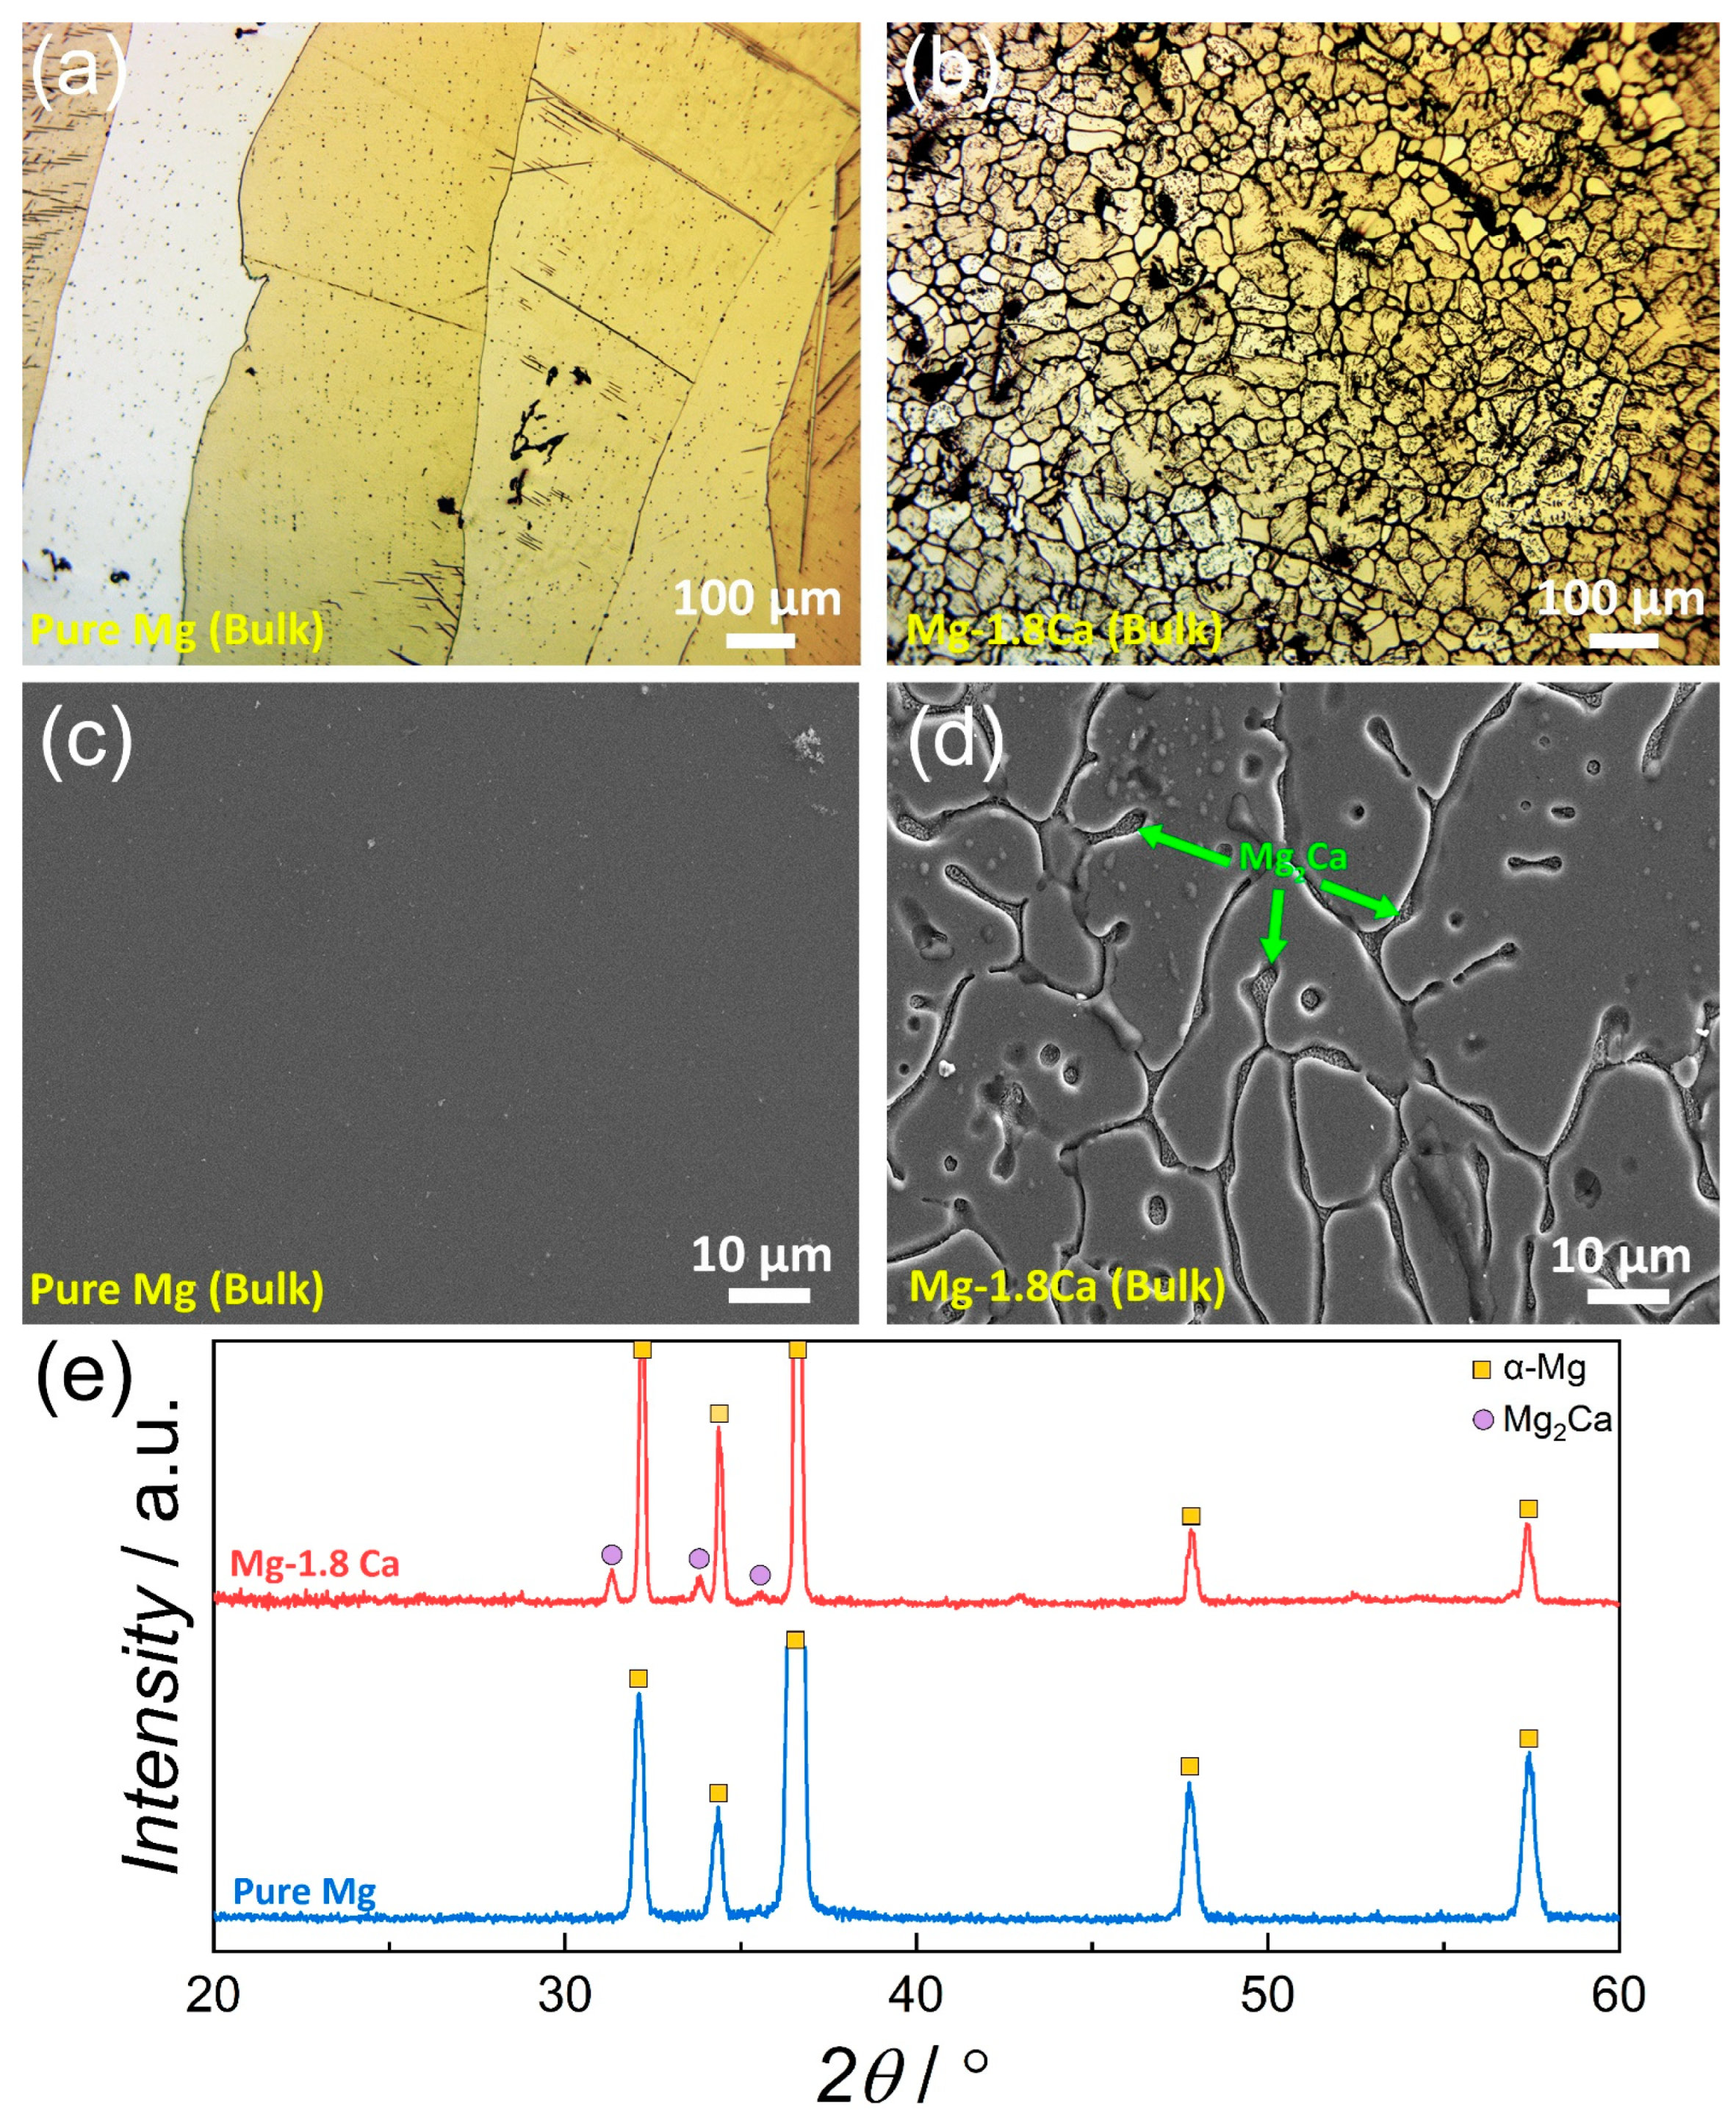
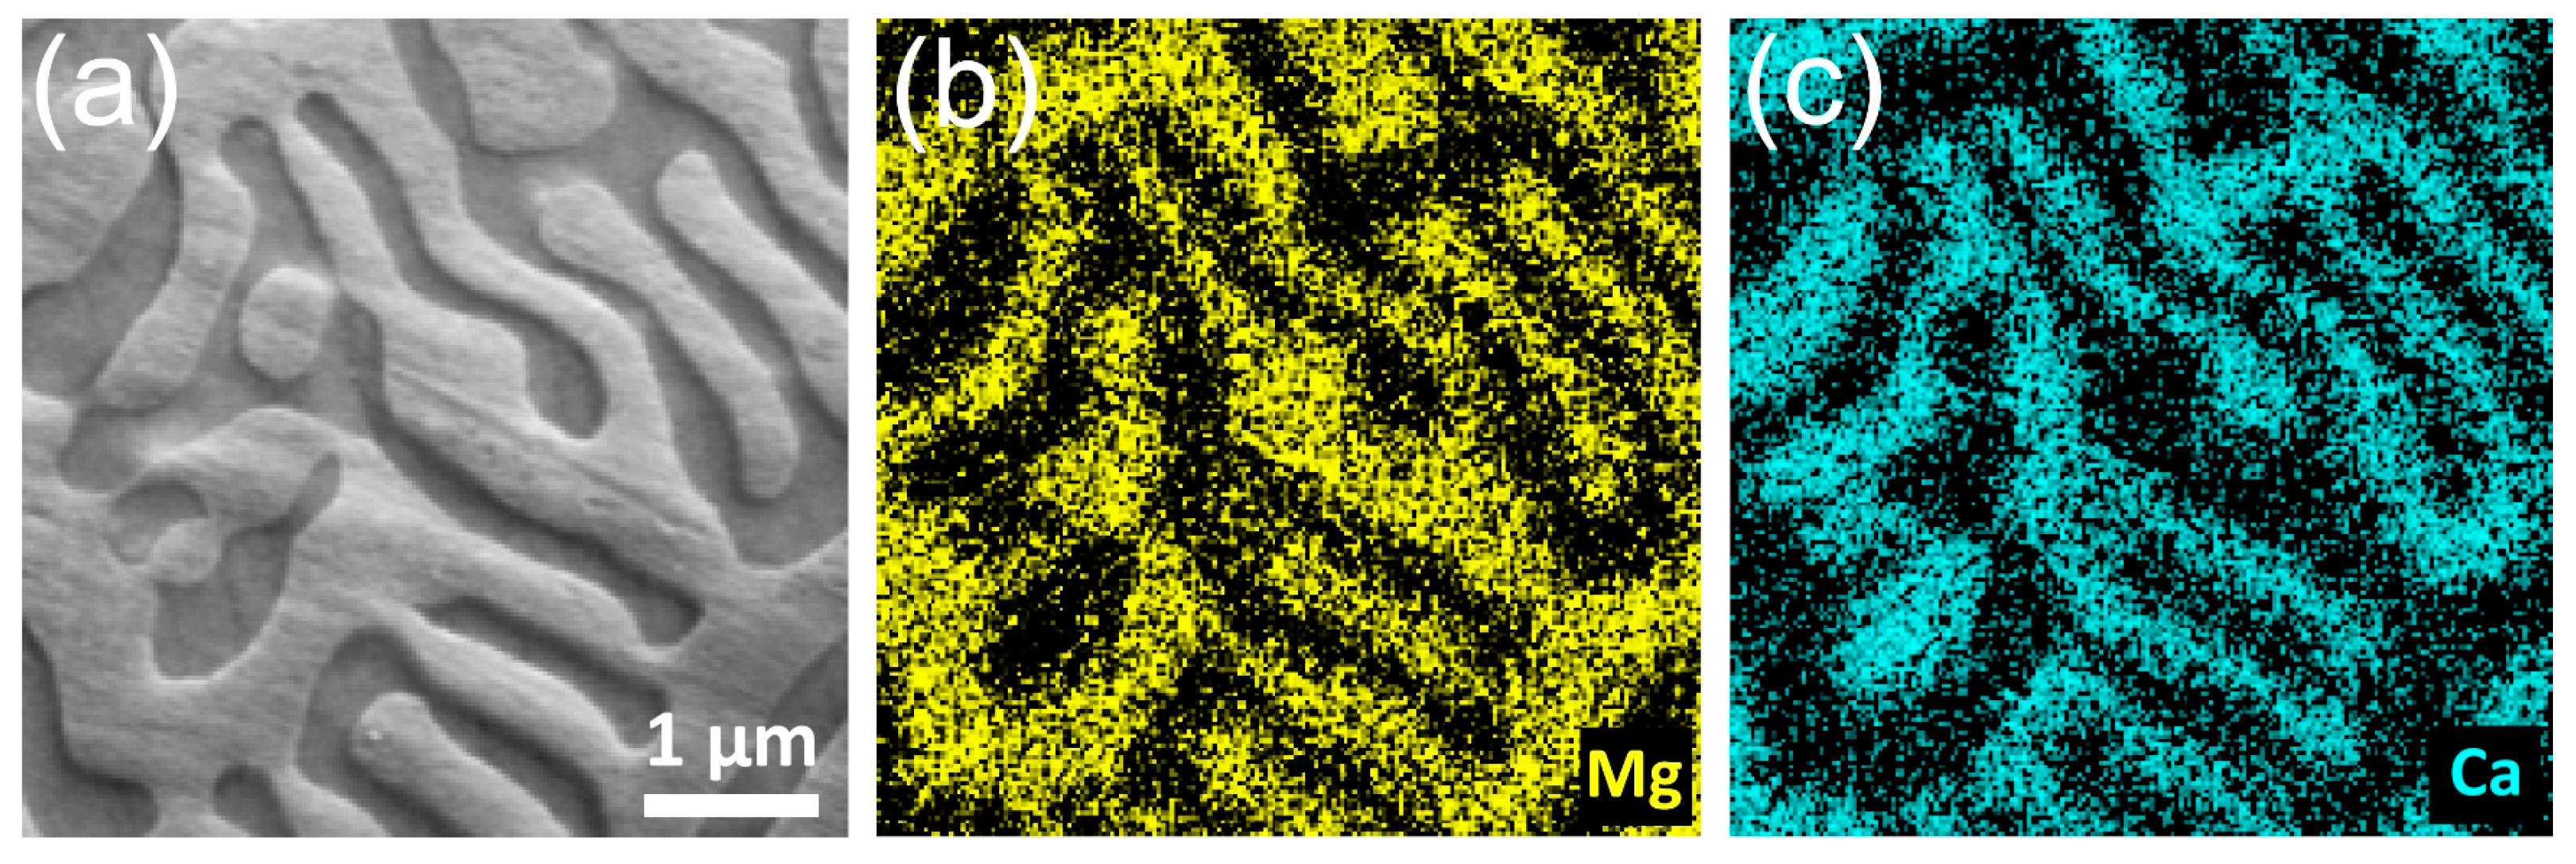
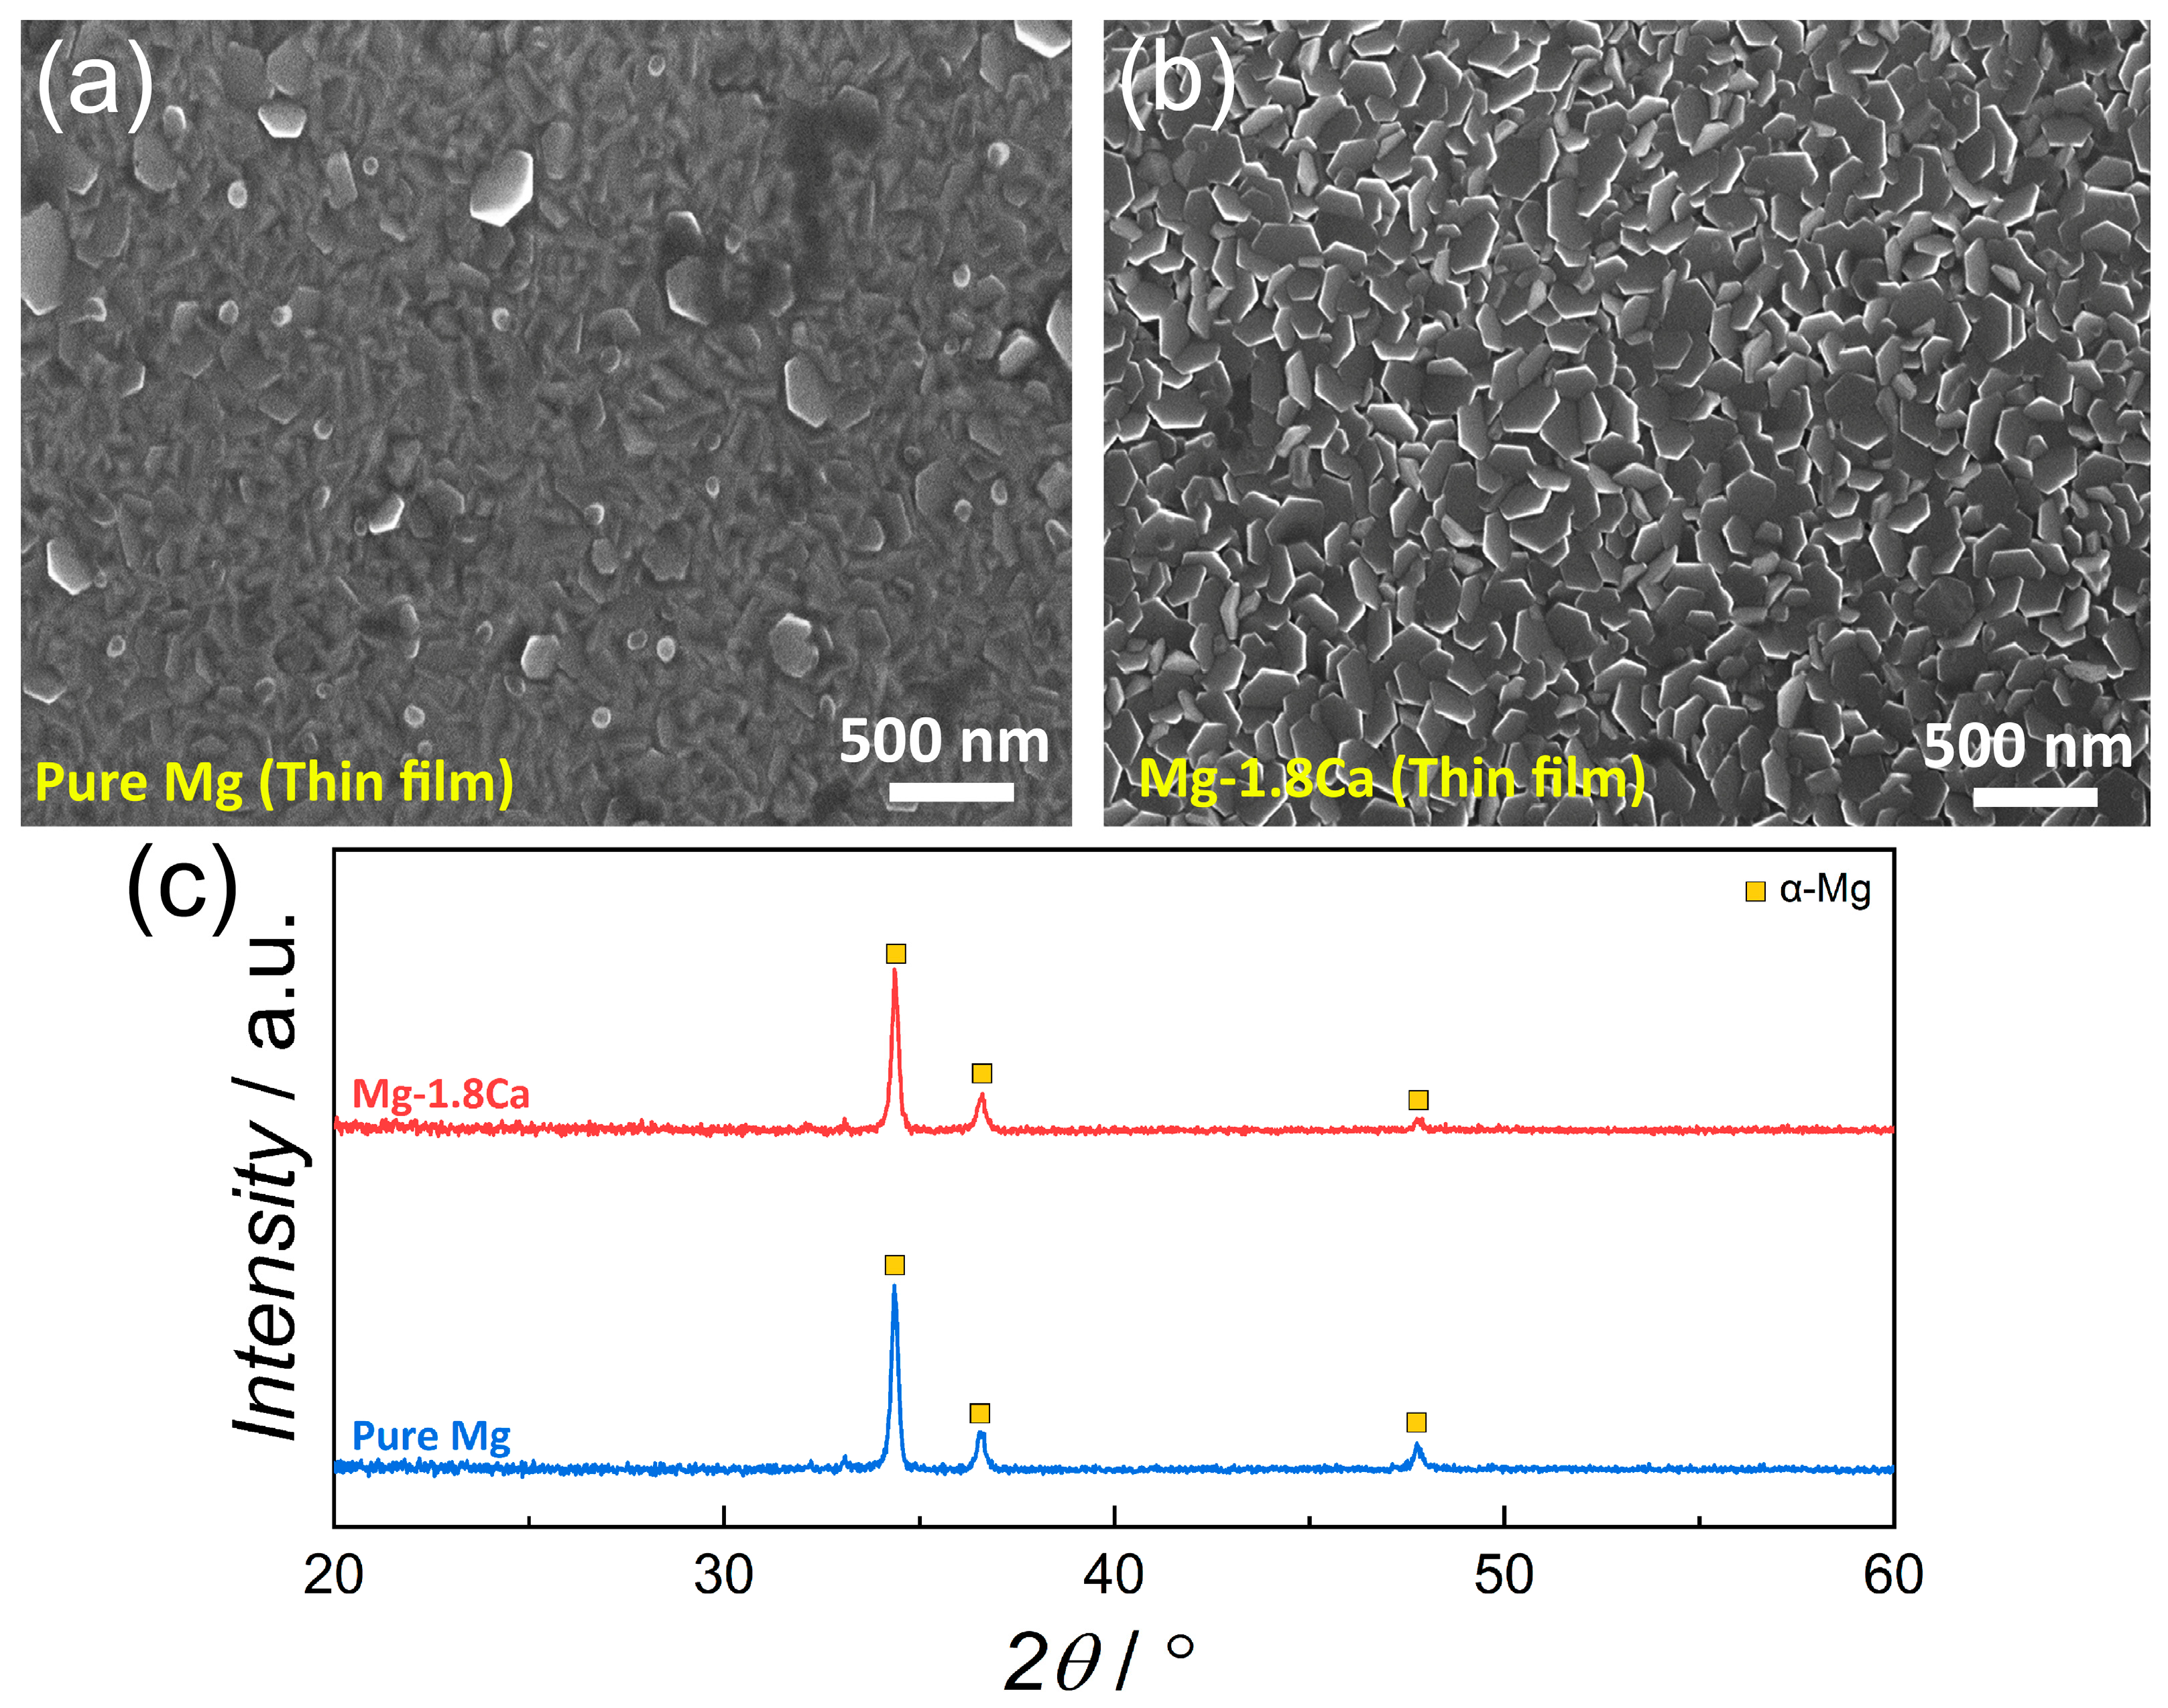
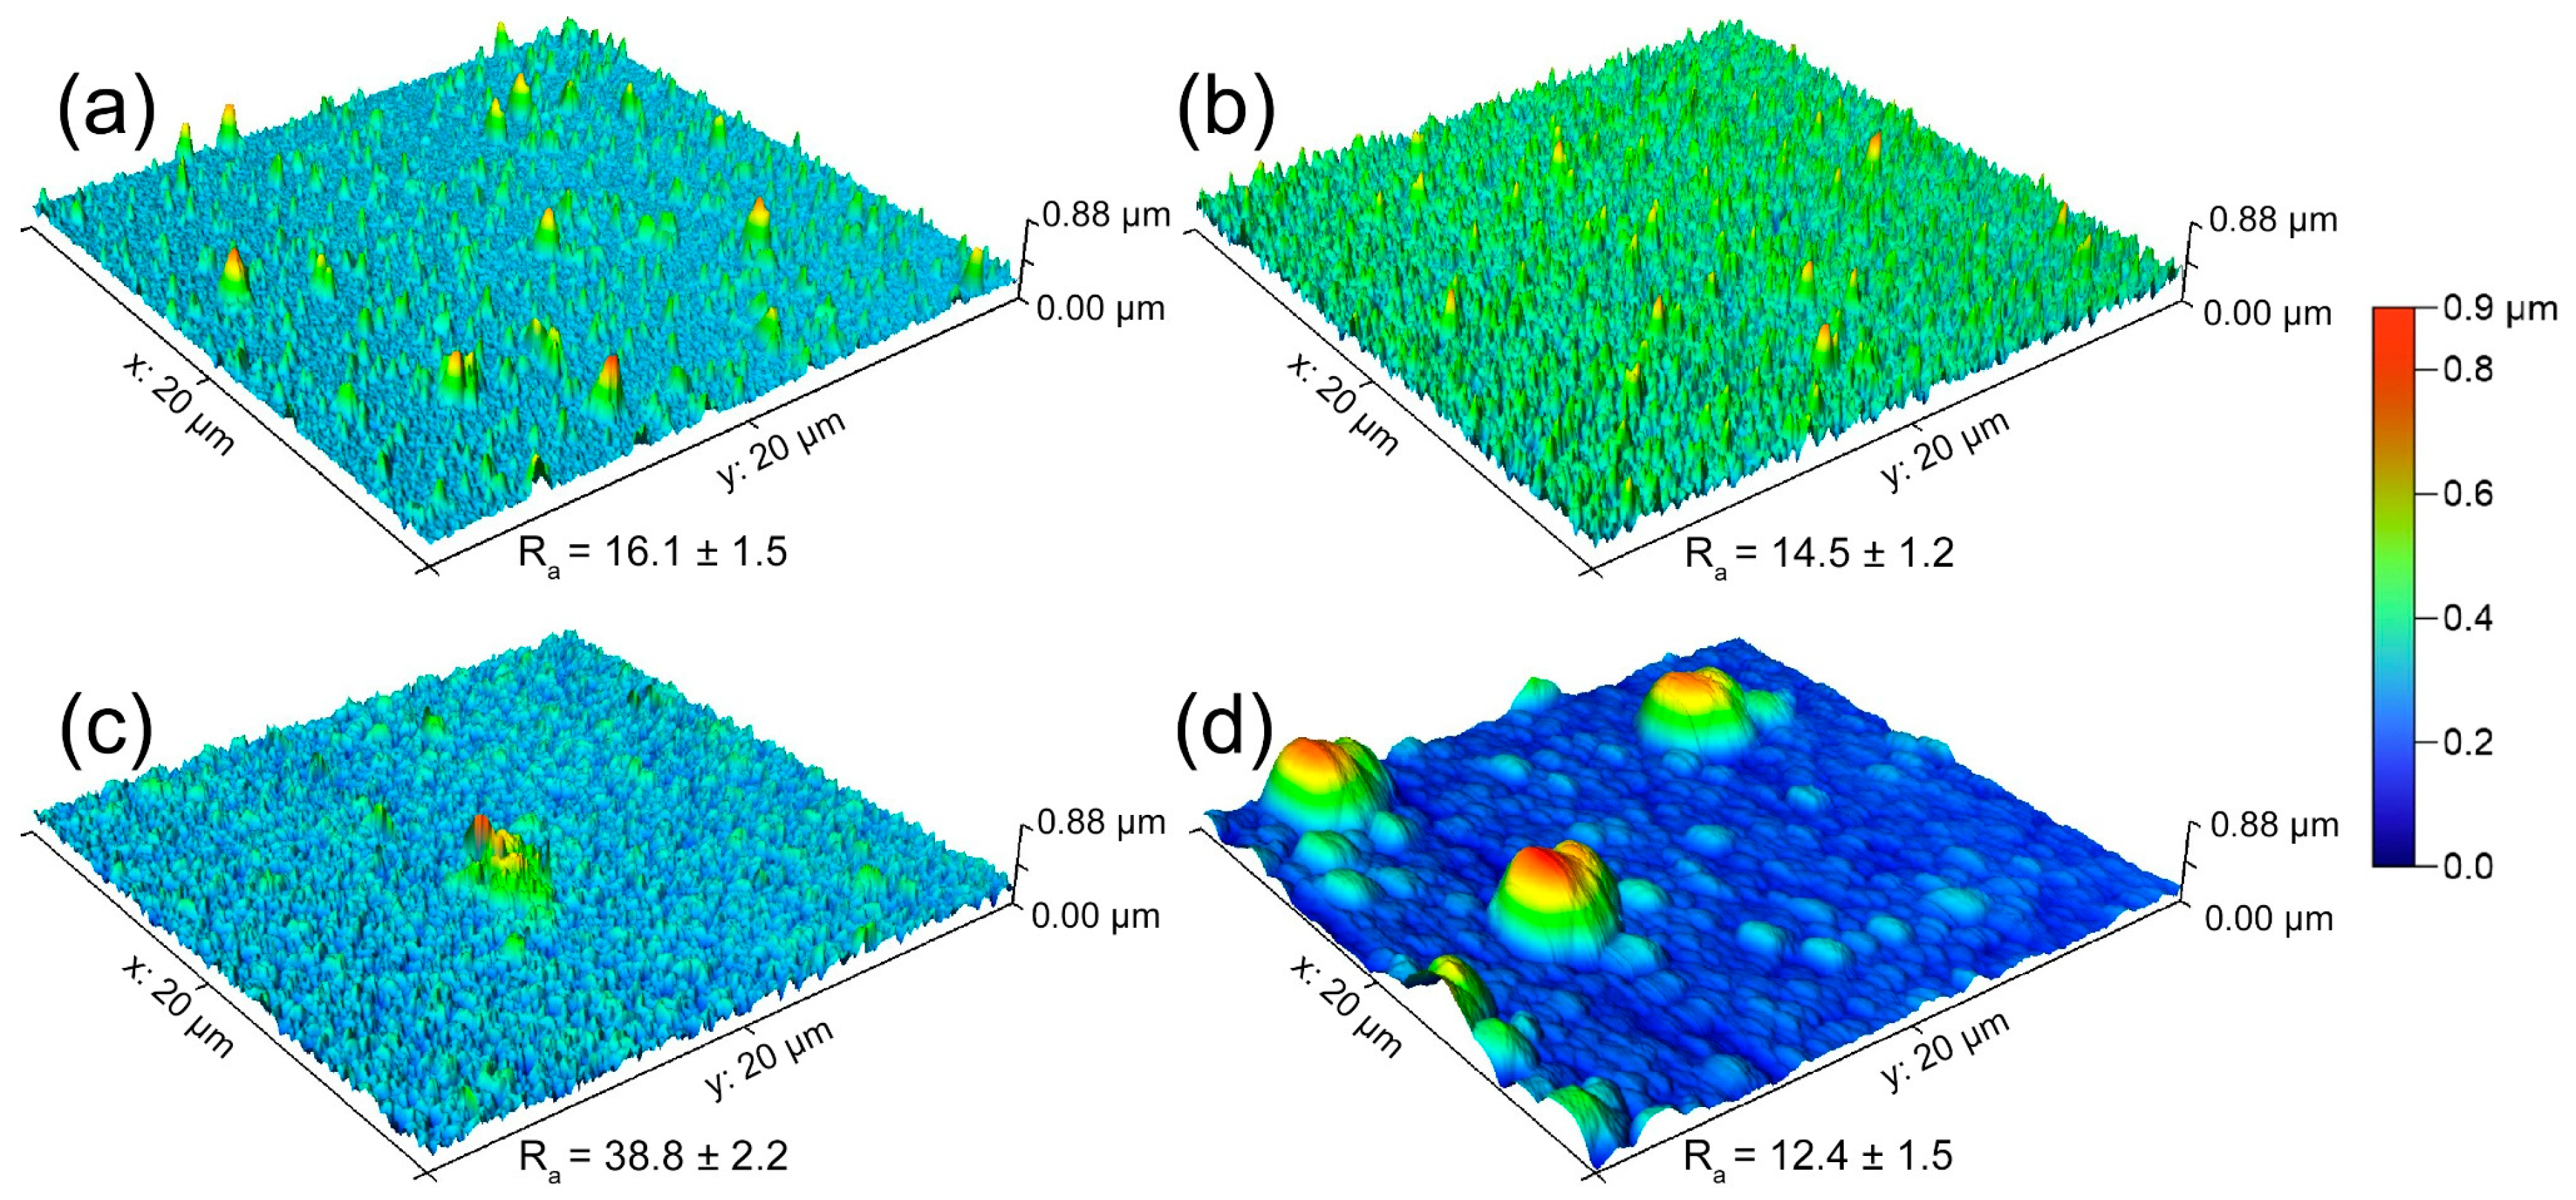
3.1. Microstructure
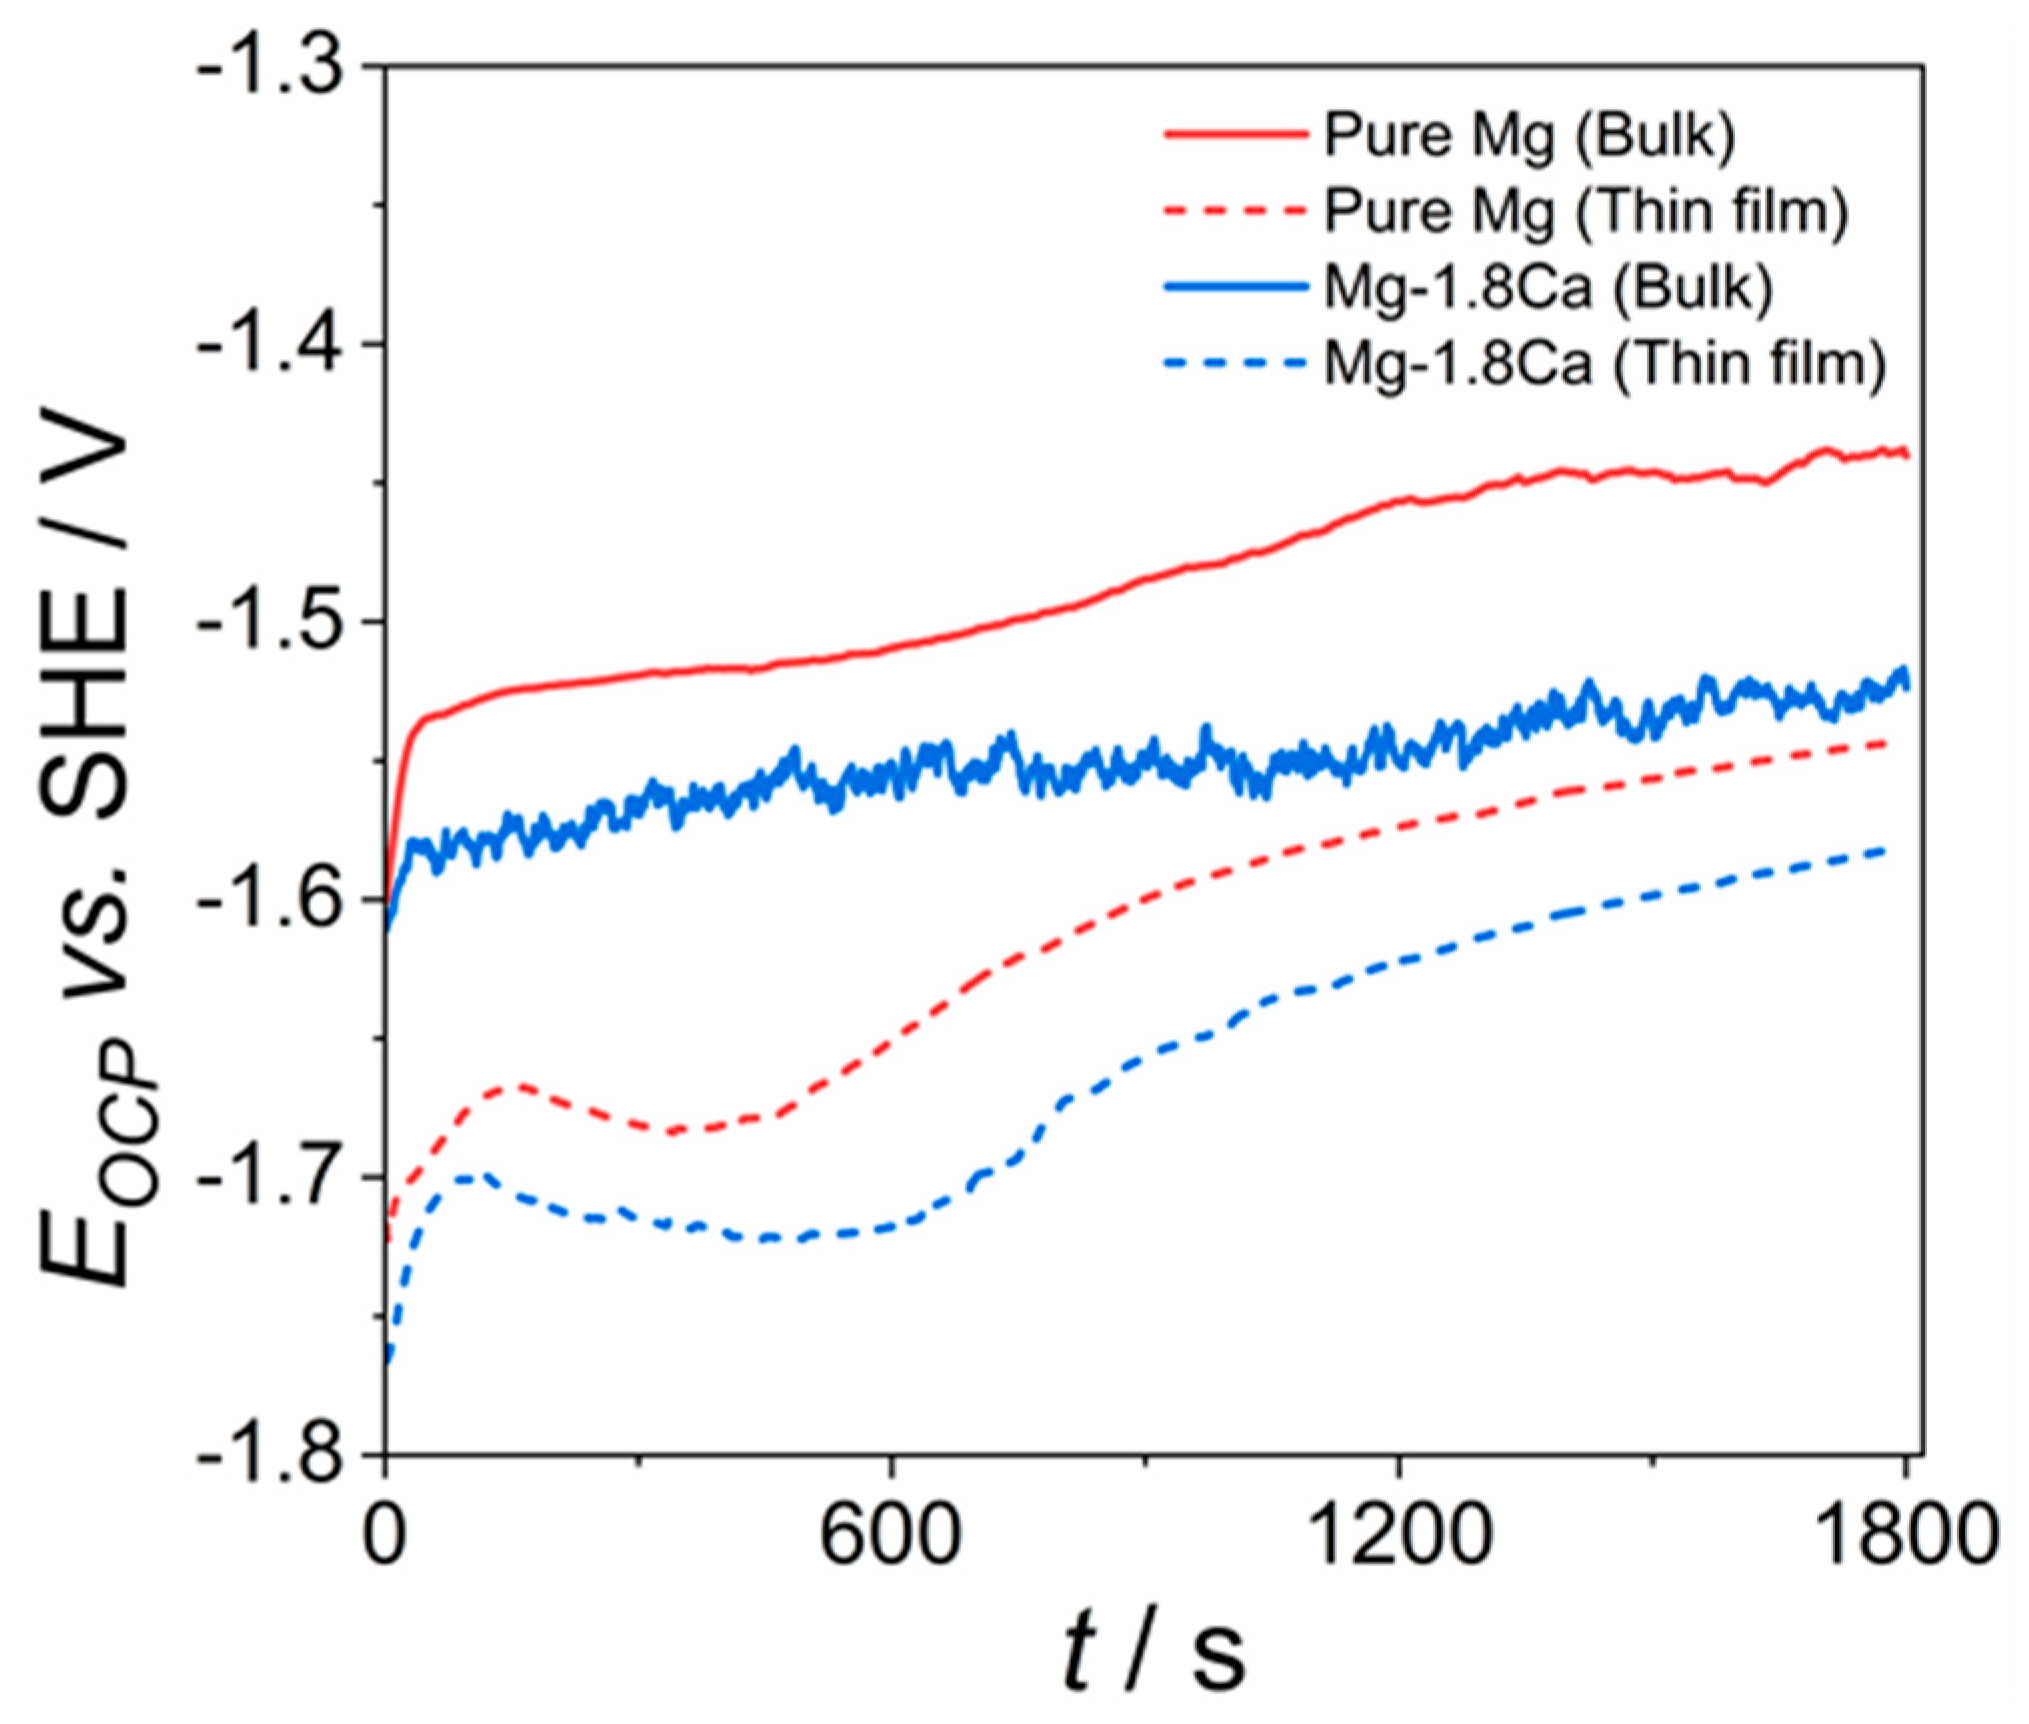
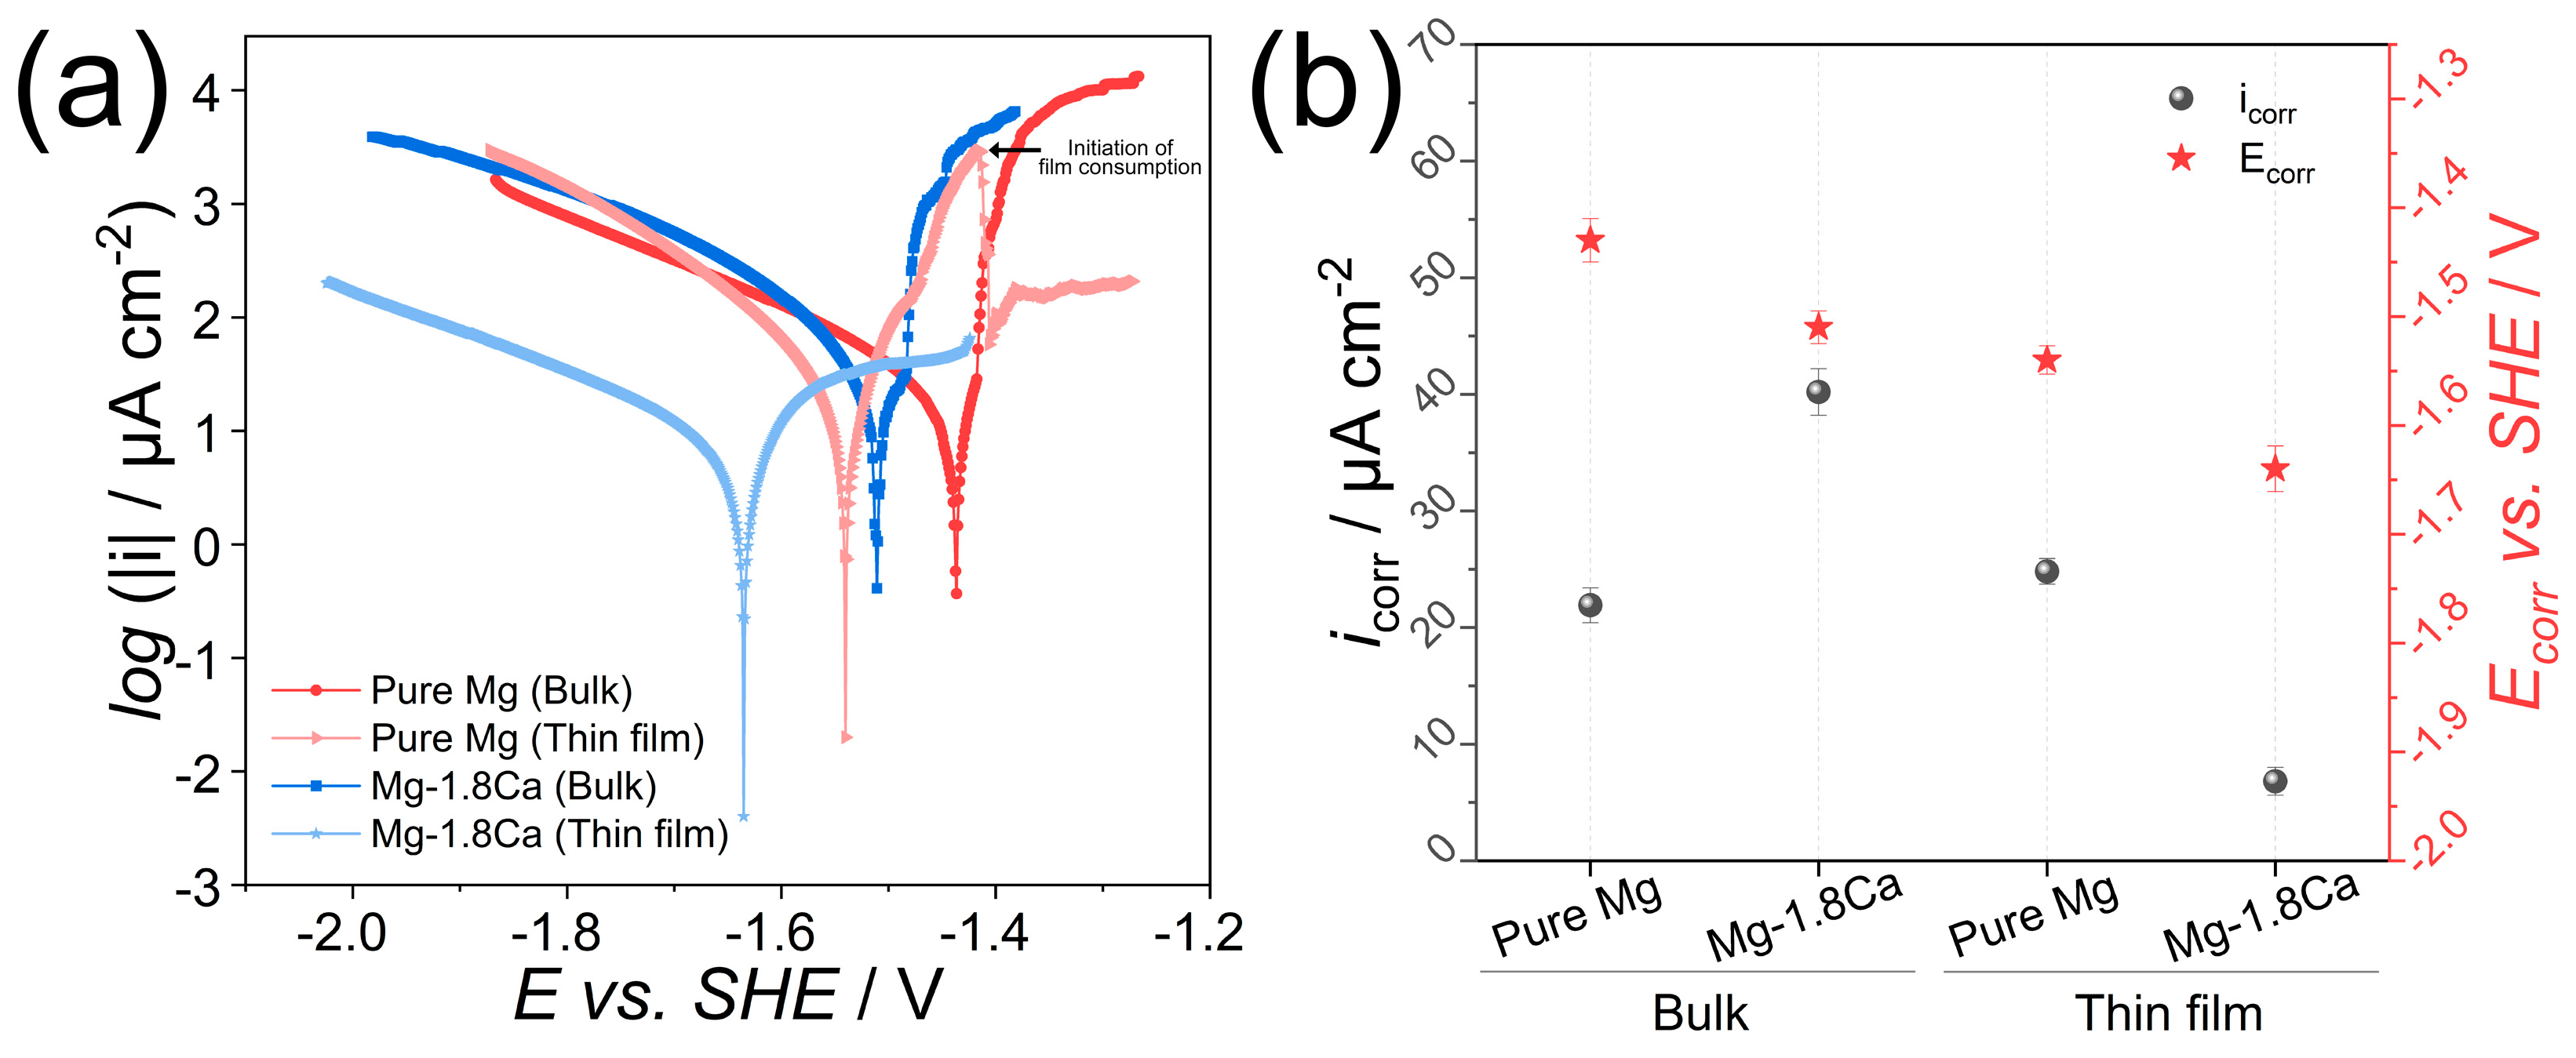
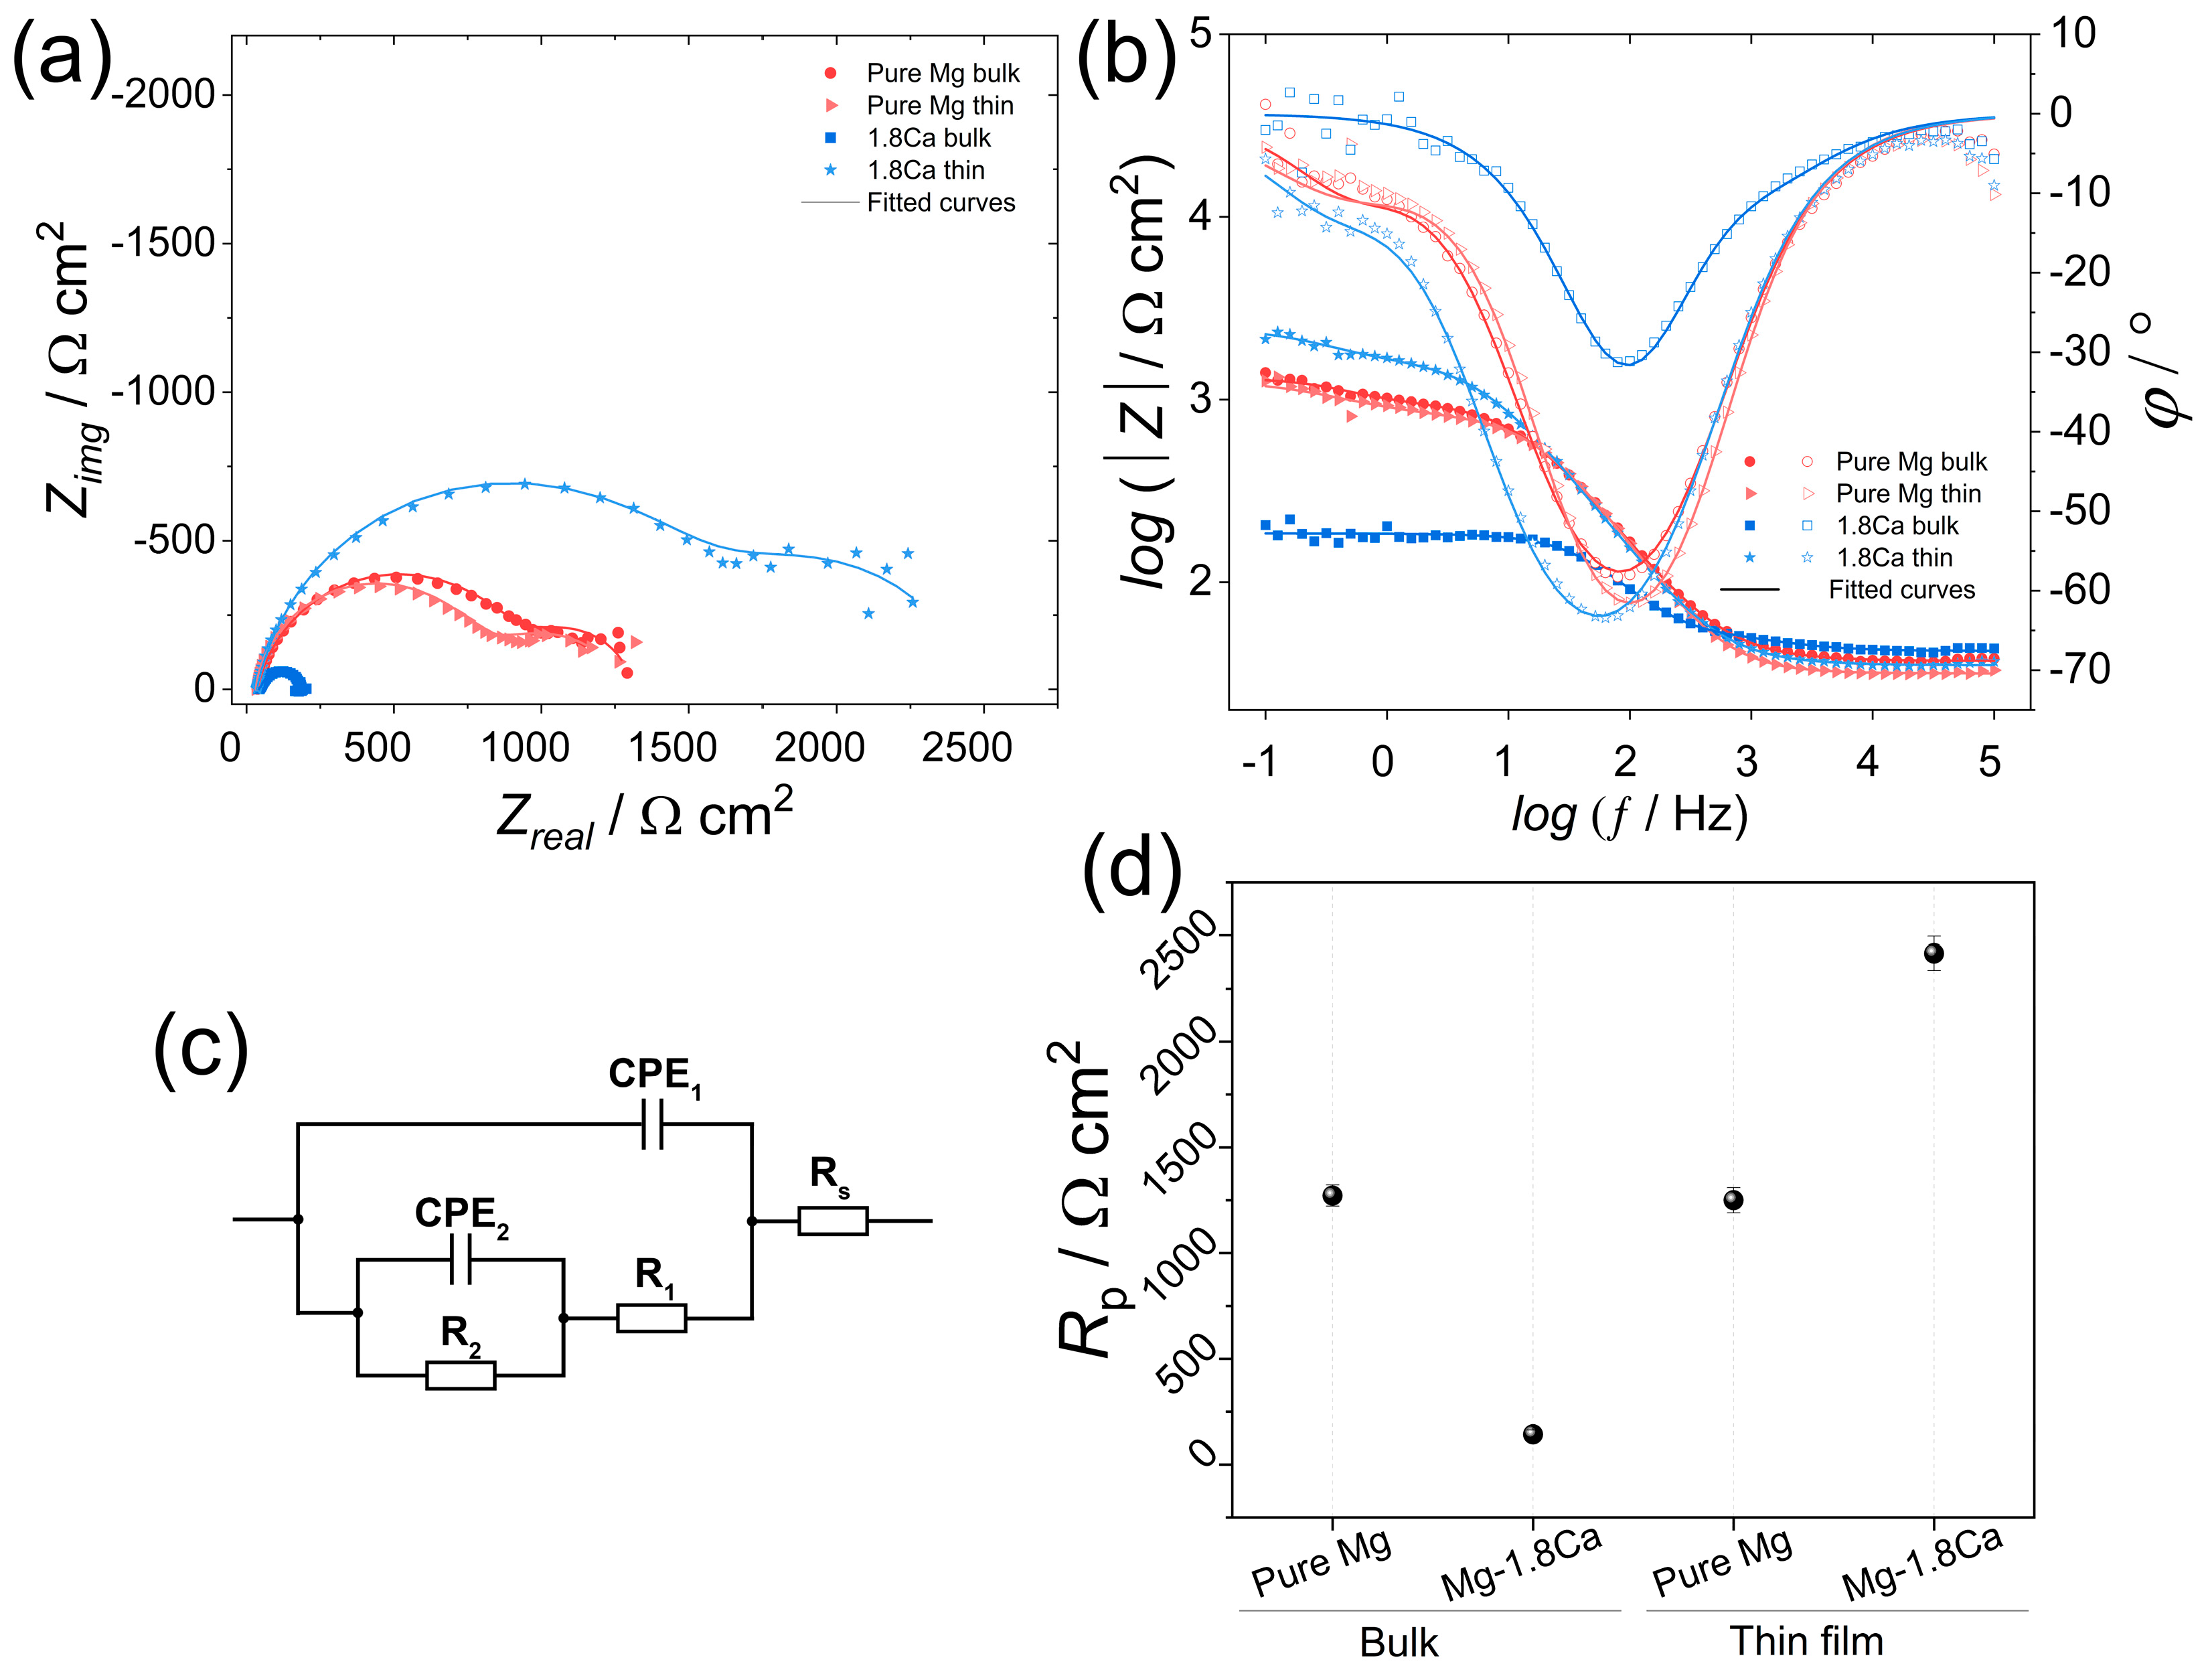
3.2. Corrosion
4. Conclusions
- The addition of 1.8 at.% Ca to pure Mg resulted in a refinement in the microstructure in both bulk and thin-film forms.
- A significant amount of Mg2Ca intermetallic phase was formed in the bulk Mg-1.8Ca (at.%) alloy, whereas only a single-phase (α-Mg phase) was formed in the bulk pure Mg and thin films.
- The bulk and thin-film pure Mg samples exhibited comparable corrosion rates due to the single-phase microstructure.
- The corrosion behaviors of bulk and thin-film Mg-1.8Ca (at.%) alloy significantly differed from each other; the bulk version showed the poorest corrosion performance among the studied samples due to the presence of less noble Mg2Ca intermetallic.
- The thin-film Mg-1.8Ca (at.%) alloy displayed a superior corrosion resistance, attributed to its single-phase microstructure and the formation of a robust protective surface film.
- Based on the findings in this study, several future research directions on the Mg-Ca thin films, such as mechanical properties under dynamic loading conditions, long-term corrosion performance for biomedical applications and/or combinatorial alloy developments, can be proposed.
Author Contributions
Funding
Institutional Review Board Statement
Informed Consent Statement
Data Availability Statement
Acknowledgments
Conflicts of Interest
References
- Zeng, Z.; Stanford, N.; Davies, C.H.J.; Nie, J.-F.; Birbilis, N. Magnesium Extrusion Alloys: A Review of Developments and Prospects. Int. Mater. Rev. 2018, 64, 27–62. [Google Scholar] [CrossRef]
- Rout, P.K.; Roy, S.; Ganguly, S.; Rathore, D.K. A Review on Properties of Magnesium-Based Alloys for Biomedical Applications. Biomed. Phys. Eng. Express 2022, 8, 042002. [Google Scholar] [CrossRef] [PubMed]
- Bairagi, D.; Mandal, S. A Comprehensive Review on Biocompatible Mg-Based Alloys as Temporary Orthopaedic Implants: Current Status, Challenges, and Future Prospects. J. Magnes. Alloys 2022, 10, 627–669. [Google Scholar] [CrossRef]
- Zengin, H.; Hassel, A.W. Magnesium Alloys with Rare Earth Elements—A Review of the Recent Progress on the Corrosion Properties. Corros. Sci. 2025, 249, 112827. [Google Scholar] [CrossRef]
- Liu, R.L.; Scully, J.R.; Williams, G.; Birbilis, N. Reducing the Corrosion Rate of Magnesium via Microalloying Additions of Group 14 and 15 Elements. Electrochim. Acta 2018, 260, 184–195. [Google Scholar] [CrossRef]
- Recktenwald, D.; Mardare, C.C.; Mardare, A.I.; Jinga, L.-I.; Socol, G.; Hassel, A.W. Combinatorial Screening of Dysprosium-Magnesium-Zinc Alloys for Bioresorptive Implants. Electrochim. Acta 2020, 363, 137106. [Google Scholar] [CrossRef]
- Ludwig, A. Discovery of New Materials Using Combinatorial Synthesis and High-Throughput Characterization of Thin-Film Materials Libraries Combined with Computational Methods. Npj Comput. Mater. 2019, 5, 70. [Google Scholar] [CrossRef]
- Mao, S.S. High Throughput Growth and Characterization of Thin Film Materials. J. Cryst. Growth 2013, 379, 123–130. [Google Scholar] [CrossRef]
- Klemm, S.O.; Schauer, J.-C.; Schuhmacher, B.; Hassel, A.W. High Throughput Electrochemical Screening and Dissolution Monitoring of Mg–Zn Material Libraries. Electrochim. Acta 2011, 56, 9627–9636. [Google Scholar] [CrossRef]
- Zengin, H.; Mardare, A.I.; Popescu-Pelin, G.; Socol, G.; Hassel, A.W. Magnesium-Calcium Thin Films at Low Calcium Concentrations for Anode Materials in Biodegradable Implantable Primary Batteries. Mater. Lett. 2024, 362, 136246. [Google Scholar] [CrossRef]
- Hans, M.; Keuter, P.; Saksena, A.; Sälker, J.A.; Momma, M.; Springer, H.; Nowak, J.; Zander, D.; Primetzhofer, D.; Schneider, J.M. Opportunities of Combinatorial Thin Film Materials Design for the Sustainable Development of Magnesium-Based Alloys. Sci. Rep. 2021, 11, 17454. [Google Scholar] [CrossRef]
- Keuter, P.; to Baben, M.; Aliramaji, S.; Schneider, J.M. CALPHAD-Based Modelling of the Temperature–Composition–Structure Relationship during Physical Vapor Deposition of Mg-Ca Thin Films. Materials 2023, 16, 2417. [Google Scholar] [CrossRef] [PubMed]
- Zuo, Y.B.; Fu, X.; Mou, D.; Zhu, Q.F.; Li, L.; Cui, J.Z. Study on the Role of Ca in the Grain Refinement of Mg–Ca Binary Alloys. Mater. Res. Innov. 2015, 19, S1-94–S1-97. [Google Scholar] [CrossRef]
- Ali, Y.; Qiu, D.; Jiang, B.; Pan, F.; Zhang, M.-X. Current Research Progress in Grain Refinement of Cast Magnesium Alloys: A Review Article. J. Alloys Compd. 2015, 619, 639–651. [Google Scholar] [CrossRef]
- Kulyasova, O.B.; Khudododova, G.D.; Dyakonov, G.S.; Zheng, Y.; Valiev, R.Z. Effect of Microstructure Refinement on the Corrosion Behavior of the Bioresorbable Mg-1Zn-0.2Ca and Mg-1Ca Alloys. Materials 2022, 15, 6749. [Google Scholar] [CrossRef]
- Xie, Z.-R.; Zhang, C.; Pan, H.-C.; Wang, Y.-X.; Ren, Y.-P.; Qin, G.-W. Microstructures and Bio-Corrosion Resistances of as-Extruded Mg–Ca Alloys with Ultra-Fine Grain Size. Rare Met. 2023, 42, 680–687. [Google Scholar] [CrossRef]
- Nayeb-Hashemi, A.A.; Clark, J.B. Phase Diagrams of Binary Magnesium Alloys; ASM International: Metals Park, OH, USA, 1988; ISBN 978-0-87170-328-6. [Google Scholar]
- Seong, J.W.; Kim, W.J. Development of Biodegradable Mg–Ca Alloy Sheets with Enhanced Strength and Corrosion Properties through the Refinement and Uniform Dispersion of the Mg2Ca Phase by High-Ratio Differential Speed Rolling. Acta Biomater. 2015, 11, 531–542. [Google Scholar] [CrossRef]
- Zhang, Y.; Feng, X.; Huang, Q.; Li, Y.; Yang, Y. Enhancing Mechanical Properties and Degradation Performance of Mg−0.8wt.%Ca Alloy by Directional Solidification. Trans. Nonferrous Met. Soc. China 2023, 33, 409–421. [Google Scholar] [CrossRef]
- Kirkland, N.T.; Birbilis, N.; Walker, J.; Woodfield, T.; Dias, G.J.; Staiger, M.P. In-Vitro Dissolution of Magnesium–Calcium Binary Alloys: Clarifying the Unique Role of Calcium Additions in Bioresorbable Magnesium Implant Alloys. J. Biomed. Mater. Res. B Appl. Biomater. 2010, 95B, 91–100. [Google Scholar] [CrossRef]
- Wang, D.; Jiang, W.; Li, S.; Yan, X.; Wu, S.; Qiu, H.; Guo, S.; Zhu, B. A Comprehensive Review on Combinatorial Film via High-Throughput Techniques. Materials 2023, 16, 6696. [Google Scholar] [CrossRef]
- Su, W.B.; Chang, C.S.; Tsong, T.T. Quantum Size Effect on Ultra-Thin Metallic Films. J. Phys. Appl. Phys. 2009, 43, 013001. [Google Scholar] [CrossRef]
- Chason, E.; Sheldon, B.W.; Freund, L.B.; Floro, J.A.; Hearne, S.J. Origin of Compressive Residual Stress in Polycrystalline Thin Films. Phys. Rev. Lett. 2002, 88, 156103. [Google Scholar] [CrossRef]
- Ding, H.-Y.; Li, H.; Wang, G.-Q.; Liu, T.; Zhou, G.-H. Bio-Corrosion Behavior of Ceramic Coatings Containing Hydroxyapatite on Mg-Zn-Ca Magnesium Alloy. Appl. Sci. 2018, 8, 569. [Google Scholar] [CrossRef]
- Gnedenkov, A.S.; Sinebryukhov, S.L.; Filonina, V.S.; Egorkin, V.S.; Ustinov, A.Y.; Sergienko, V.I.; Gnedenkov, S.V. The Detailed Corrosion Performance of Bioresorbable Mg-0.8Ca Alloy in Physiological Solutions. J. Magnes. Alloys 2022, 10, 1326–1350. [Google Scholar] [CrossRef]
- Bahmani, A.; Arthanari, S.; Shin, K.S. Corrosion Behavior of Mg–Mn–Ca Alloy: Influences of Al, Sn and Zn. J. Magnes. Alloys 2019, 7, 38–46. [Google Scholar] [CrossRef]
- Song, G.; Atrens, A.; Dargusch, M. Influence of Microstructure on the Corrosion of Diecast AZ91D. Corros. Sci. 1998, 41, 249–273. [Google Scholar] [CrossRef]
- Haynes, W.M. CRC Handbook of Chemistry and Physics, 96th ed.; CRC Press: Boca Raton, FL, USA, 2015; ISBN 978-1-4822-6097-7. [Google Scholar]
- Zengin, H.; Hofinger, M.; Silva Campos, M.D.R.; Blawert, C.; Polat, S.; Nienaber, M.; Bohlen, J.; Zheludkevich, M.; Hassel, A.W. Corrosion Behaviour of Biodegradable Mg-Zn-Mn-Ce, Mg-Zn-Ca-Ce, and Mg-Zn-Ca-Mn Quaternary Magnesium Alloys in Phosphate-Buffered Saline. J. Alloys Compd. 2025, 1013, 178582. [Google Scholar] [CrossRef]
- Khan, M.M.; Rahman, Z.U.; Deen, K.M.; Shabib, I.; Haider, W. Sputtered Mg100-xZnx (0 ≤ x ≤ 100) Systems as Anode Materials for a Biodegradable Battery Aimed for Transient Bioelectronics. Electrochim. Acta 2020, 329, 135129. [Google Scholar] [CrossRef]
- Wang, L.; Snihirova, D.; Deng, M.; Wang, C.; Vaghefinazari, B.; Wiese, G.; Langridge, M.; Höche, D.; Lamaka, S.V.; Zheludkevich, M.L. Insight into Physical Interpretation of High Frequency Time Constant in Electrochemical Impedance Spectra of Mg. Corros. Sci. 2021, 187, 109501. [Google Scholar] [CrossRef]
- Zengin, H.; Ari, S.; Turan, M.E.; Hassel, A.W. Evolution of Microstructure, Mechanical Properties, and Corrosion Resistance of Mg–2.2Gd–2.2Zn–0.2Ca (Wt%) Alloy by Extrusion at Various Temperatures. Materials 2023, 16, 3075. [Google Scholar] [CrossRef]
- Stern, M.; Geary, A.L. Electrochemical Polarization: I. A Theoretical Analysis of the Shape of Polarization Curves. J. Electrochem. Soc. 1957, 104, 56. [Google Scholar] [CrossRef]
- Gusieva, K.; Davies, C.H.J.; Scully, J.R.; Birbilis, N. Corrosion of Magnesium Alloys: The Role of Alloying. Int. Mater. Rev. 2015, 60, 169–194. [Google Scholar] [CrossRef]
- Cao, F.; Song, G.-L.; Atrens, A. Corrosion and Passivation of Magnesium Alloys. Corros. Sci. 2016, 111, 835–845. [Google Scholar] [CrossRef]
- Hort, N.; Huang, Y.; Kainer, K.U. Intermetallics in Magnesium Alloys. Adv. Eng. Mater. 2006, 8, 235–240. [Google Scholar] [CrossRef]
- Xu, C.; Wang, J.; Chen, C.; Wang, C.; Sun, Y.; Zhu, S.; Guan, S. Initial Micro-Galvanic Corrosion Behavior between Mg2Ca and α-Mg via Quasi-in Situ SEM Approach and First-Principles Calculation. J. Magnes. Alloys 2023, 11, 958–965. [Google Scholar] [CrossRef]
- Jeong, Y.S.; Kim, W.J. Enhancement of Mechanical Properties and Corrosion Resistance of Mg–Ca Alloys through Microstructural Refinement by Indirect Extrusion. Corros. Sci. 2014, 82, 392–403. [Google Scholar] [CrossRef]
- Duchoslav, J.; Truglas, T.; Groiß, H.; Riener, C.K.; Arndt, M.; Stellnberger, K.H.; Luckeneder, G.; Angeli, G.; Stifter, D. Structure and Chemistry of Surface Oxides on ZnMgAl Corrosion Protection Coatings with Varying Alloy Composition. Surf. Coat. Technol. 2019, 368, 51–58. [Google Scholar] [CrossRef]
- Duchoslav, J.; Steinberger, R.; Arndt, M.; Keppert, T.; Luckeneder, G.; Stellnberger, K.H.; Hagler, J.; Angeli, G.; Riener, C.K.; Stifter, D. Evolution of the Surface Chemistry of Hot Dip Galvanized Zn–Mg–Al and Zn Coatings on Steel during Short Term Exposure to Sodium Chloride Containing Environments. Corros. Sci. 2015, 91, 311–320. [Google Scholar] [CrossRef]

| Condition | Sample | a/nm | c/nm | c/a |
|---|---|---|---|---|
| - | Pure Mg * | 0.32094 | 0.52112 | 1.62373 |
| Bulk | Pure Mg | 0.32823 | 0.53214 | 1.62123 |
| Mg-1.8Ca | 0.32714 | 0.53199 | 1.62618 | |
| Thin film | Pure Mg | 0.30714 | 0.50098 | 1.62373 |
| Mg-1.8Ca | 0.30714 | 0.50045 | 1.62938 |
| Condition | Sample | Rs /Ω cm2 | R1 /Ω cm2 | R2 /Ω cm2 | CPE1 /Ω−1 sn cm−2 10−5 | n1 | CPE2 /Ω−1 sn cm−2 10−3 | n2 |
|---|---|---|---|---|---|---|---|---|
| Bulk | Pure Mg | 37.1 | 947 | 325 | 2.35 | 0.87 | 1.26 | 0.92 |
| Mg-1.8Ca | 42.1 | 22 | 121 | 2.85 | 0.86 | 0.02 | 0.96 | |
| Thin film | Pure Mg | 31.7 | 795 | 455 | 1.68 | 0.92 | 1.31 | 0.76 |
| Mg-1.8Ca | 35.1 | 1664 | 752 | 2.47 | 0.88 | 0.88 | 0.86 |
Disclaimer/Publisher’s Note: The statements, opinions and data contained in all publications are solely those of the individual author(s) and contributor(s) and not of MDPI and/or the editor(s). MDPI and/or the editor(s) disclaim responsibility for any injury to people or property resulting from any ideas, methods, instructions or products referred to in the content. |
© 2025 by the authors. Licensee MDPI, Basel, Switzerland. This article is an open access article distributed under the terms and conditions of the Creative Commons Attribution (CC BY) license (https://creativecommons.org/licenses/by/4.0/).
Share and Cite
Zengin, H.; Mardare, A.I.; Greul, A.; Hofinger, M.; Popescu-Pelin, G.; Socol, G.; Hassel, A.W. Insights into the Corrosion Behavior of Pure Magnesium and Magnesium–Calcium Alloy (Mg-1.8 at.% Ca) in Thin-Film and Bulk Forms. Materials 2025, 18, 1416. https://doi.org/10.3390/ma18071416
Zengin H, Mardare AI, Greul A, Hofinger M, Popescu-Pelin G, Socol G, Hassel AW. Insights into the Corrosion Behavior of Pure Magnesium and Magnesium–Calcium Alloy (Mg-1.8 at.% Ca) in Thin-Film and Bulk Forms. Materials. 2025; 18(7):1416. https://doi.org/10.3390/ma18071416
Chicago/Turabian StyleZengin, Hüseyin, Andrei Ionut Mardare, Andreas Greul, Manuel Hofinger, Gianina Popescu-Pelin, Gabriel Socol, and Achim Walter Hassel. 2025. "Insights into the Corrosion Behavior of Pure Magnesium and Magnesium–Calcium Alloy (Mg-1.8 at.% Ca) in Thin-Film and Bulk Forms" Materials 18, no. 7: 1416. https://doi.org/10.3390/ma18071416
APA StyleZengin, H., Mardare, A. I., Greul, A., Hofinger, M., Popescu-Pelin, G., Socol, G., & Hassel, A. W. (2025). Insights into the Corrosion Behavior of Pure Magnesium and Magnesium–Calcium Alloy (Mg-1.8 at.% Ca) in Thin-Film and Bulk Forms. Materials, 18(7), 1416. https://doi.org/10.3390/ma18071416