Article

Prediction Models for Radiological Characterization of Natural Aggregates Based on Chemical Composition and Mineralogy

by
Andrés Caño
1,
María del Mar Alonso
1,*,
Alicia Pachón-Montaño
1,
Queralt Marzal
1,
Guillermo Hernáiz
2,
Luís Sousa
3 and
José Antonio Suárez-Navarro
2
1
Eduardo Torroja Institute for Construction Sciences (IETcc-CSIC), 28033 Madrid, Spain
2
Environmental Radioactivity and Radiological Monitoring Unit (URAyVR), CIEMAT, Avda Complutense, 40, 28040 Madrid, Spain
3
Department of Geology and Pole of Geosciences Center, University of Trás-os-Montes e Alto Douro, 5000-801 Vila Real, Portugal
*
Author to whom correspondence should be addressed.
Materials 2025, 18(6), 1369; https://doi.org/10.3390/ma18061369
Submission received: 18 February 2025 / Revised: 8 March 2025 / Accepted: 12 March 2025 / Published: 20 March 2025
(This article belongs to the Special Issue Characterization and Optimization of Cement-Based Materials)

Abstract

:
The radiological characterization of aggregates used in construction materials is essential to determine their suitability from a radiological protection perspective and to ensure their safety for health and the environment. While the activity concentrations of radionuclides present in construction materials are typically determined using gamma spectrometry, an alternative approach involves the development of statistical methods and predictive models derived from the chemical composition of the material. A total of 39 aggregates used in construction of various types (siliceous, carbonatic, volcanic, and granitic) have been analyzed, correlating their chemical compositions obtained through X-ray fluorescence (XRF) with the activity concentrations of natural radionuclides measured via gamma spectrometry using principal component analysis (PCA). The results obtained allowed for the observation of an inversely proportional relationship between the chemical composition of the grouping of siliceous and carbonatic aggregates and the content of radionuclides. However, the set of granitic aggregates showed a strong correlation with the natural radioactive series of uranium, thorium, and 40K. Conversely, the radionuclide content of volcanic aggregates was independent of their chemical composition. The results obtained from the PCA facilitated the development of different models using multiple regression analysis. The chemical parameters obtained in the proposed models were related to the typical mineralogy in each grouping, ranging from primary minerals such as feldspars to accessory minerals such as anatase, apatite, and pyrolusite. Finally, the models were validated using independent samples from those used to determine the models, achieving RSD (%) values ≤ 30% in 50% of the activity concentrations of 226Ra, 232Th(212Pb), and 40K, as well as the estimated ACI.

1. Introduction

The aggregates used in concrete production can have different morphologies (rounded or crushed) and varied chemical compositions depending on their nature or origin, which is often determined by their geographical availability. Additionally, they can originate from the recycling of construction materials [1,2,3] or have a natural source. Natural aggregates can be classified based on their chemical and mineralogical composition as siliceous, carbonaceous, volcanic, and granitic. The choice of one type of aggregate or another (or their combination) as a construction material has a significant influence on the physical–mechanical properties, rheology, and durability of concrete [4,5,6,7,8]. However, a generally overlooked issue is the content of natural radionuclides, whose excess above the environmental radiological background can pose risks to human health and the environment. The content of natural radionuclides in aggregates is related to their geological origin and mineralogy. In this regard, granites often contain high activity concentrations of natural radionuclides, primarily due to the presence of accessory mineral phases such as allanite, monazite, zircon, apatite, chevkinite, and riebeckite, which are usually enriched in U and Th [9]. However, these rocks can exhibit variable activity concentrations in different radionuclides depending on their origins and petrography [9,10,11]. In fact, the high presence of radionuclides from the 238U series in granites is the cause of elevated emissions of 222Rn, with harmful health effects in constructions using this type of rock [12,13,14].
In the case of volcanic rocks, they can also exhibit high content of radioactive elements. The concentration of radioactive elements in volcanic rocks often depends on the geological context and the volcanic processes that generate them [15]. Similarly to granitic rocks, their use as construction materials can pose risks to health and the environment [16,17,18].
The presence of higher radioactive content in construction materials led to the introduction of the Activity Concentration Index (ACI) in the European Directive EURATOM 2013/59. The ACI is used as a screening tool to assess the suitability of a construction material from a radiological protection perspective [19]. The ACI is calculated based on the activity concentrations of the following radionuclides: 226Ra, 232Th, and 40K. These radionuclides are typically measured using gamma spectrometry, a non-destructive analysis method that also allows for the simultaneous measurement of several natural radionuclides [20,21]. However, gamma spectrometry is not a routine analysis method and requires expensive detectors, as well as qualified personnel, to perform these determinations. Therefore, there is a need to explore alternative methodologies capable of simplifying the characterization of the radionuclide content in construction materials.
Currently, the existing literature includes research that examines the relationship between the activity concentrations of natural radionuclides and mineralogy in soils, sediments, and rocks, with potential applications as construction materials. These studies have determined that the radiological risk is influenced not only by the possible presence of clays but also by certain minerals enriched in radionuclides, such as zircon, monazite, and other accessory minerals [22,23,24].
Previous studies have employed methodologies based on principal component analysis (PCA) to correlate physicochemical parameters with the content of natural radionuclides in various construction materials. Some researchers have used this statistical tool to determine the chemical factors affecting radon emanation in ceramic materials [25], to correlate the activity concentration with the particle size of Fe2SiO4 used as a substitute for aggregates in concretes and mortars [26], or even to evaluate the suitability of certain granitic rocks by correlating the activity concentrations of their natural radionuclides with different radiological protection indices [27].
In a recent study, the correlation between the chemical composition and the activity concentration of natural radionuclides in cements and supplementary cementitious materials (SCMs), such as fly ash and slags from the metallurgical industry, was investigated [28], enabling the development of predictive models for 226Ra, 232Th(212Pb), and 40K.
However, there is a lack of research proposing estimation models based on the chemical composition of natural aggregates that could be used to estimate the activity concentrations of natural radionuclides. For this reason, the purpose of this work was to investigate whether there is a possible correlation between the chemical composition, obtained through X-ray fluorescence (XRF), and the content of radionuclides, obtained through gamma spectrometry, in different types of natural aggregates using principal component analysis (PCA). The types of aggregates included in this study were those commonly used in concrete production, namely siliceous, carbonate, volcanic, and granitic aggregates [9,22,29,30,31,32,33]. On the other hand, although the use of mixed aggregates is common in concrete preparation, this work studied the aggregates independently to obtain correlations that could subsequently be scaled. The new models to be investigated are intended to continue this type of research across different types of aggregates so that, in combination with those developed for cementitious materials, a tool is available to design concretes that do not pose a risk to health and the environment.

2. Materials and Methods

2.1. Materials

In this study, 39 aggregates of different geological origins and chemical compositions, widely used in concrete preparation, were analyzed. The aggregates were classified into four types: siliceous aggregates (S), carbonate aggregates (C), volcanic aggregates (V), and granitic aggregates (G). Figure 1 shows an image of each type of aggregate studied. The designations of the different aggregates were as follows.
  • S: 8 siliceous gravels and sands of quartzitic composition (S1, S3, S5, S6, S7, S10, S11, and S12) and 4 feldspathic ones (S2, S4, S8, and S9).
  • C: 5 carbonates, with a calcitic composition (C3 and C5) and dolomitic composition (C1, C2, and C4).
  • V: 7 rocks of volcanic origin (V1–V7).
  • G: 15 gravels and sands of granitic origin (G1–G15).

2.2. Methods

Figure 2 shows a flowchart summarizing the main aspects of the research conducted. The four types of aggregates selected in this study—siliceous, carbonaceous, volcanic, and granitic—were ground and sieved to a particle size of 20 μm. Subsequently, the chemical composition (XRF), the mineralogical composition (XRD), and the natural radionuclides present were determined using gamma spectrometry. The results obtained through XRF and gamma spectrometry were employed to conduct a principal component analysis (PCA). The criterion for the application of PCA was to have a number of samples greater than the number of variables involved in the analysis (percentage of oxides and activity concentrations of natural radionuclides) and to obtain a Kaiser–Meyer–Olkin (KMO) value greater than 0.7 to ensure adequate correlation. The PCA was represented using an HJ-Biplot graph. Subsequently, a multiple regression analysis (MRA) was applied, considering the clusters obtained through PCA. The variables used in the fitting were initially filtered by applying a collinearity test, eliminating those that showed a variance inflation factor (VIF) greater than 10. The resulting variables were adjusted using the forward and backward elimination methods. The mathematical models obtained through MRA were used to determine the activity concentration index (ACI) using a number of samples corresponding to 10% of the total samples for each aggregate. The validity criterion used was an RSD (%) lower than 30%. Additionally, the means and variances were compared using Student’s t-test and Fisher’s F-test.

2.2.1. Chemical and Mineralogical Compositions of the Aggregates

The chemical compositions of the 39 aggregates analyzed were determined using X-ray fluorescence (XRF) on a Bruker S8 Tiger analyzer (Bruker, Billerica, MA, USA). The loss on ignition (LoI) was obtained according to the EN 196-2:2014 standard [34]. The chemical compositions of six aggregates included in this study (S1, V1, V2, and G1–G3) were extracted from a previous work [35].
The mineralogical compositions of the aggregates were determined using X-ray diffraction (XRD) with a Bruker-AXS D8 Advance diffractometer (Bruker, Billerica, MA, USA) employing Cu-Kα1 radiation over a 2θ range of 5–70°. Two samples of each type of aggregate were selected and ground in an XRD-Mill McCrone (Retsch, Haan, Germany) to achieve a particle size of less than 20 µm. The identification of the crystalline phases present was performed using the Diffrac.EVA V4.2 software (Bruker, Billerica, MA, USA) and the Crystallography Open Database (COD). The quantitative analysis of the mineral phases in the samples was conducted using the Rietveld method with the TOPAS V5 software (Bruker AXS). To quantify the percentage of amorphous phases present in the granitic-origin aggregates, the internal standard method was used. Here, 20% corundum addition was introduced, which was obtained from the synthetic compound α-Al2O3 99.9% (Thermo Scientific, Waltham, MA, USA), previously calcined at 1600 °C for 1 h, and subsequently milled to below 20 microns, with the particle size of the sample with which it was mixed. The structural and crystallographic parameters of the identified phases were refined to generate a theoretical diffraction pattern. The quality of the fit between the theoretical pattern and the experimental data was evaluated using the Rwp index.

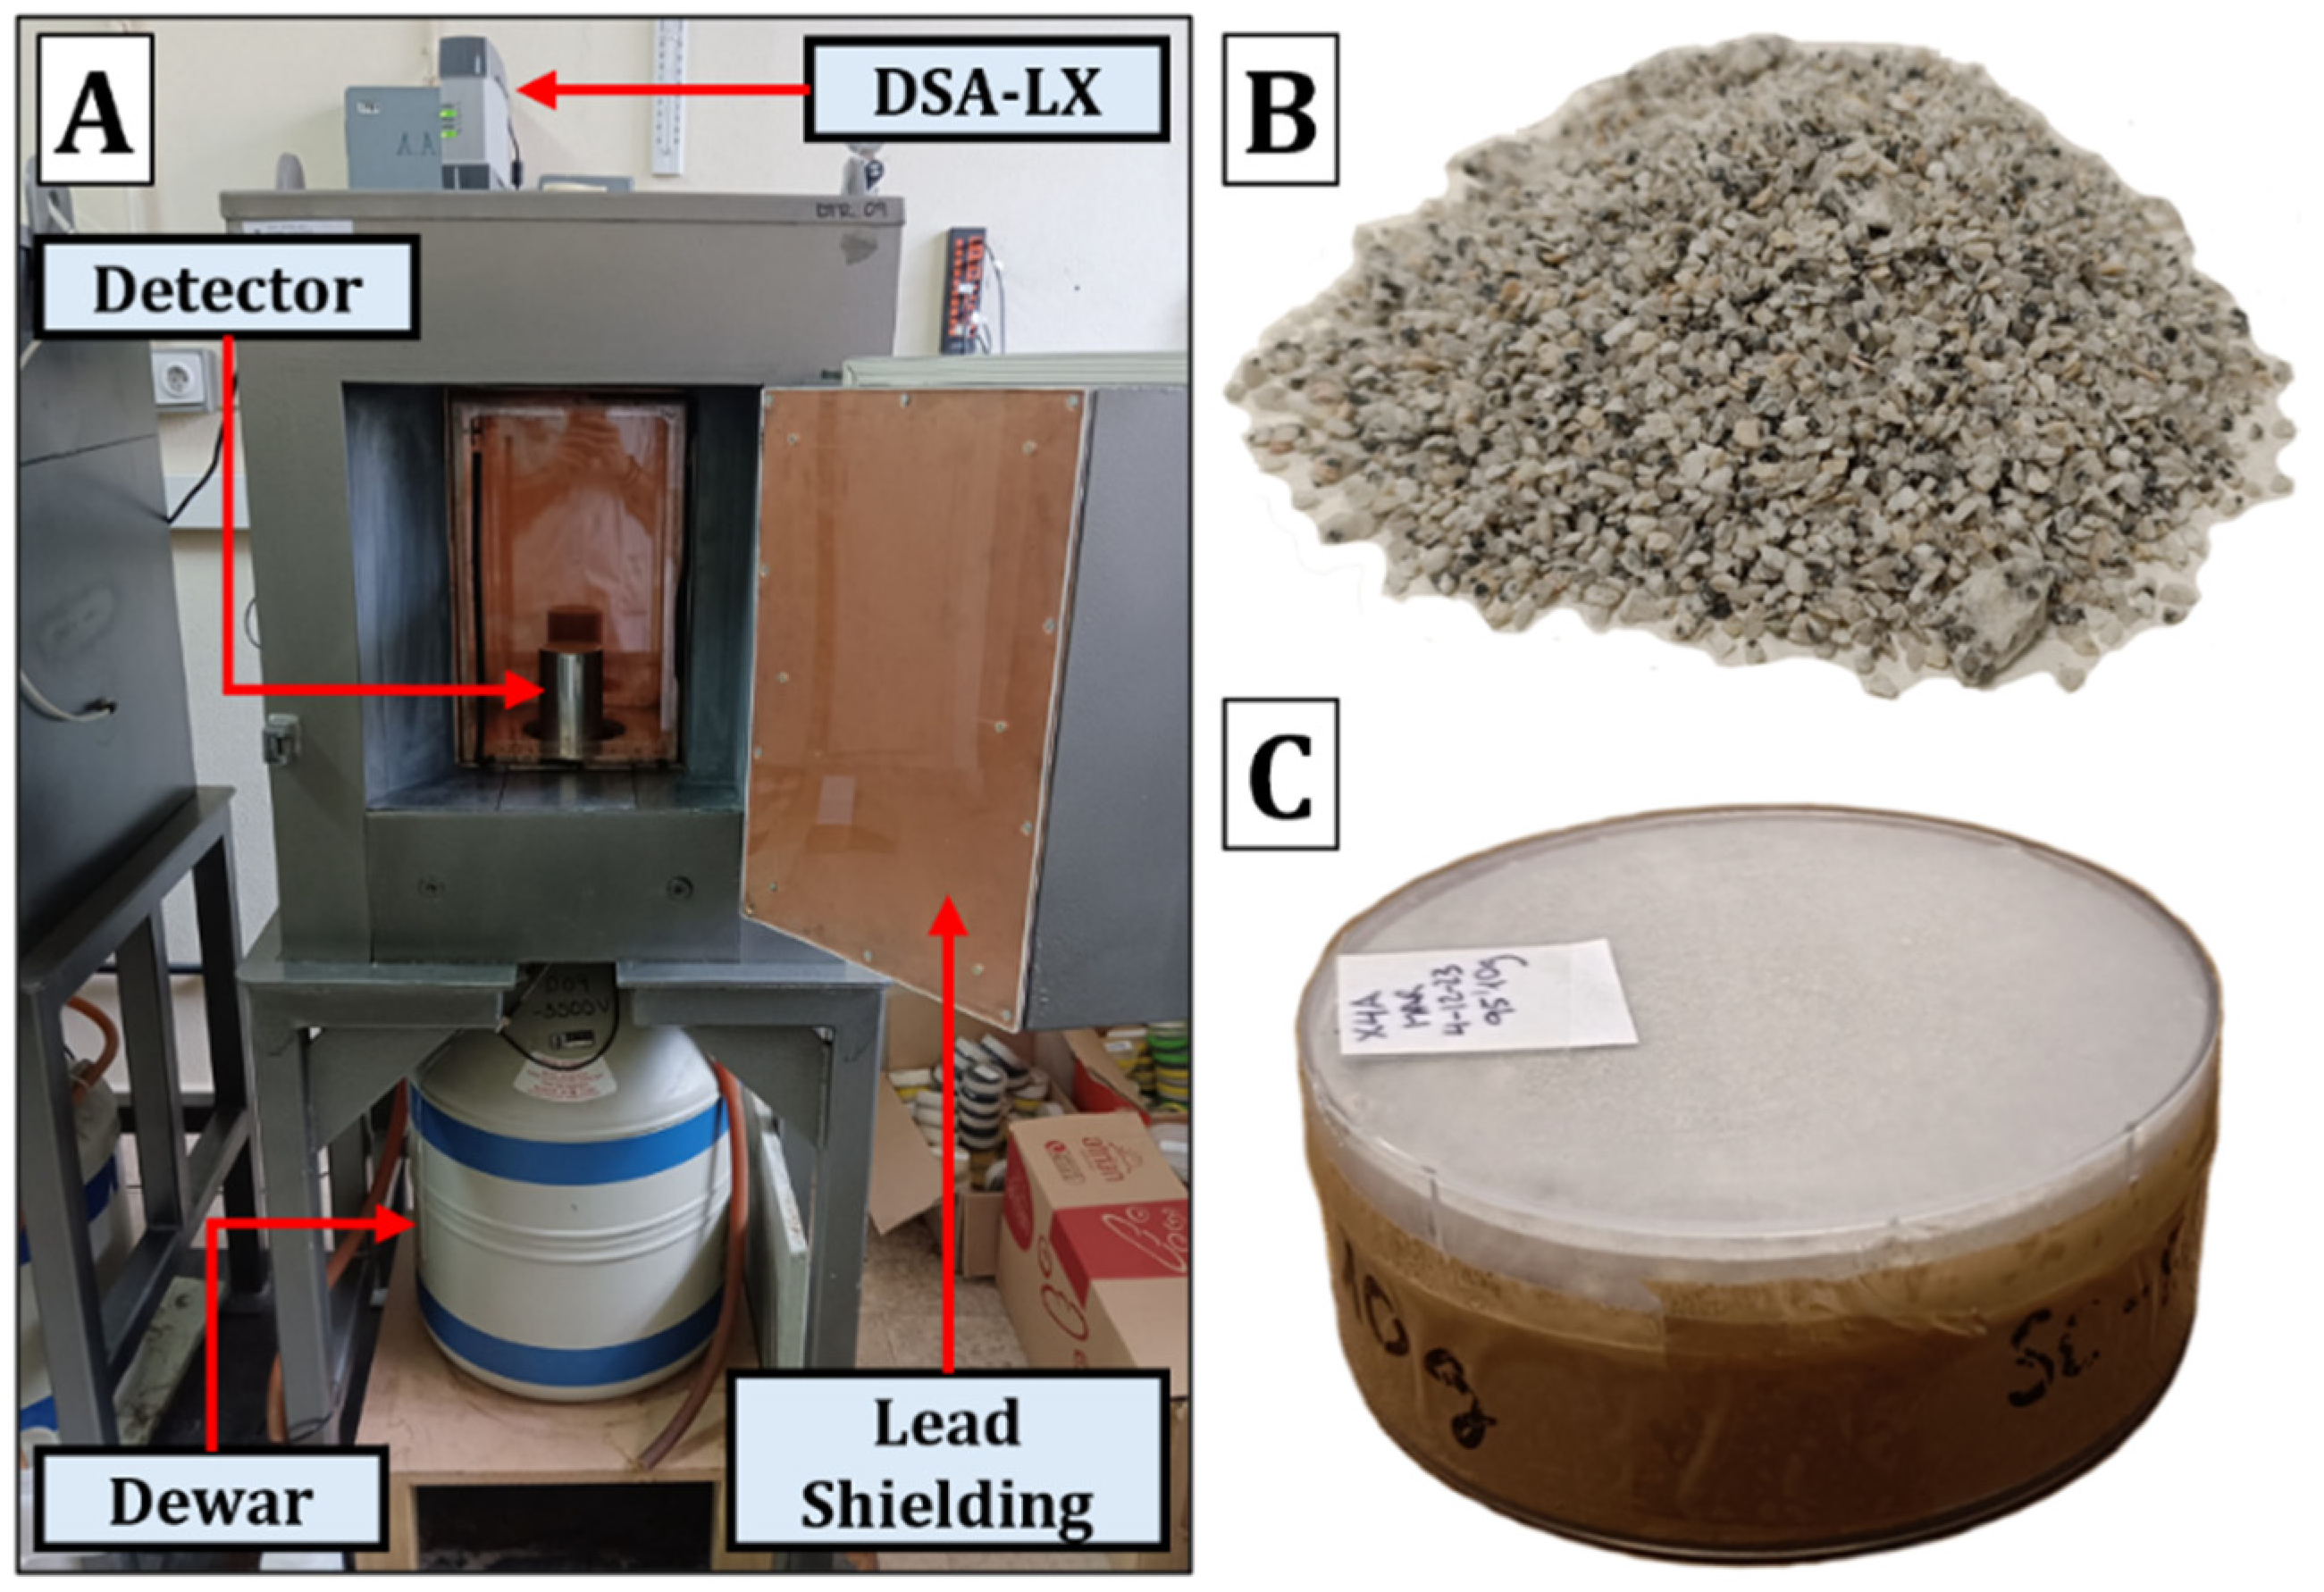
2.2.2. Gamma Spectrometry

The activity concentrations of radionuclides present in the various analyzed aggregates were determined using gamma spectrometry at the URAyVR laboratory of CIEMAT, accredited by ENAC, in accordance with the ISO/IEC 17025:2017 standard [36].
Measurements were conducted using four coaxial HPGe detectors from Canberra Industries: 2 extended-range (XtRa), 1 broad-energy (BeGE), and 1 reverse-electrode type (ReGE). Figure 3 shows a diagram of the high-purity germanium (HPGe) detector used in this research. The detector was cooled using a dewar container filled with liquid nitrogen. It was housed within passive shielding composed of Fe and Pb, which was 15 cm thick. The shielding included two layers of Cu and Zn, each 1.5 mm thick, to absorb the X-rays emitted by the Pb. The detectors were connected to a DSA-LX module (Mirion Canberra, Atlanta, GA, USA) that integrated all necessary electronics: a high-voltage power supply, amplifier, analog-to-digital converter, and communication module with a computer. The spectra were acquired and analyzed using the Genie 2000 software (version 3.4.1) [37]. Efficiency curves as a function of energy were calculated using the LabSOCS software (version 4.4.1), as the four detectors used were characterized by Canberra [20]. The samples were measured for 80,000 s, while the backgrounds were measured for 600,000 s. Quality control of the equipment was performed monthly. Additionally, the laboratory participated in at least two national and international intercomparison exercises.
The samples were prepared using the following procedure: (i) drying at 105 °C for 24 h until a constant weight was achieved, (ii) grinding using a disc mill (Retsch RS200, Retsch, Haan, Germany), (iii) sieving to obtain a particle size of 63 μm, (iv) placing the sample in a cylindrical polypropylene box with a diameter of 76 mm and a height of 30 mm, and (v) sealing the box with parafilm to prevent losses of 222Rn. The samples were allowed to stand for 21 days to reach a secular equilibrium between 226Ra and its short-lived gamma-emitting descendants (214Pb and 214Bi). The activity concentration of 226Ra was determined directly from the 186 keV peak, suppressing interference from 235U using the method described in [38].
Table 1 summarizes the energies and photon yields per 100 disintegrations (%) of the radionuclides included in this study, which belonged to the natural radioactive decay series of uranium (234Th, 226Ra, 214Pb, 214Bi, and 210Pb) and thorium (228Ac, 212Pb, and 208Tl), in addition to 40K [39].

2.2.3. Data Analysis

The percentages of the oxides determined by X-ray fluorescence (XRF) were correlated with the activity concentrations of the natural radionuclides using principal component analysis (PCA). The PCA was conducted with the RStudio statistical software (version 2004.09.0 Build 375) using the Factoextra and FactoMineR libraries [40]. PCA allowed for the grouping of different aggregates and the correlation of various variables (oxide percentages and activity concentrations) based on their variances. The correlations between the variables and the sample scores were represented using an HJ-Biplot [28]. The correlations among the different variables were determined by the cosine of the angle that they formed with each other. Furthermore, the relationship among all of the variables collectively within the PCA was quantified using the Kaiser–Meyer–Olkin (KMO) suitability index [41]. The different variables were adjusted using multiple regression analysis, taking into account the groupings obtained in the PCA, using the RStudio statistical software. The selection of variables was based on the following criteria:
  • Variables with a percentage of values above the limit of detection (LoD) of less than 25% were removed to prevent zero-inflated data, which could potentially introduce biases that distort the model [42];
  • Variables with a variance inflation factor (VIF) value above 10 were iteratively removed to avoid collinearity among the variables [43,44];
  • Variables whose variance exceeded the significance level of 0.05 were eliminated when applying backward stepwise regression, as they were not statistically significant.
On the other hand, the influence of the final variables of the models was assessed by standardizing the coefficients obtained in the multiple regression analysis. The standardization of the coefficients was carried out using the standard deviation of the explanatory variables. The variables with the greatest weight in the adjusted models were those with the highest absolute standardized coefficient values.
Finally, the accuracy of the models was assessed using the root mean square error (RMSE), considering the experimentally obtained activity concentrations as observed values, compared to those obtained through the application of the proposed models as estimated values. RMSE values close to 0 indicated greater accuracy of the obtained model.

2.2.4. Validation of the Models for the Estimation of the Activity Concentrations of 226Ra, 232Th (212Pb), and 40K

The accuracy of the obtained models was assessed using external samples of aggregates with typologies equivalent to those used to construct the models. The numbers of samples used for validation were as follows: 1 siliceous aggregate, 1 carbonated aggregate, and 2 granitic aggregates, corresponding to 12.5%, 20.0%, and 13.3%, respectively. These numbers were considered adequate for the set of samples used and are the standard values employed in the quality control of samples of radiological origin [45]. The models were validated based on the activity concentration index (ACI), which is determined using the expression in Equation (1) [19]:
A C I =   C 226 R a 300 +   C 232 T h 200 +   C 40 K 3000
where C 226 R a is the activity concentration of 226Ra, C 232 T h is the activity concentration of 232Th (indirectly obtained using the activity concentration of 212Pb), and C 40 K is the activity concentration of 40K.
The results obtained through the application of the models to the validation samples were compared with experimental results obtained via gamma spectrometry using the relative standard deviation (RSD (%)). The acceptance criterion for the models was based on previous studies [28]—specifically, RSD (%) ≤ 30%.

3. Results and Discussion

3.1. Chemical Composition and Activity Concentrations of Natural Radionuclides in Aggregates

The results obtained through XRF and the activity concentration values of the natural radionuclides in the analyzed aggregates are presented in Tables S1 and S2 of the Supplementary Materials, respectively.
Figure 4 shows the ranges of the oxide percentages obtained through XRF and the activity concentrations of the radionuclides determined via gamma spectrometry for the set of aggregates considered in this study. Siliceous aggregates are shown in a gray color, carbonates in green, volcanic aggregates in red, and granitic ones in blue. The percentages of oxides determined were represented in two ranges: 0–100% and 0–7%.
The chemical composition of the silica aggregates reflects a SiO2 percentage between 78.9 and 99.2%, which explains the predominance of quartz as the mineral phase in this group of aggregates. Additionally, a lower percentage of Al2O3 (0.8–7.1%), CaO (0.0–5.8%), K2O (0.0–3.6%), and Na2O (0.0–2.5%) is observed. The loss on ignition (0.1–5%) may indicate the possible presence of carbonate impurities. On the other hand, the Fe2O3 content (0.0–2.7%) suggests the presence of oxides, which are likely present in an accessory manner.
The chemical composition of the analyzed carbonate aggregates was predominantly constituted by CaO (28.3–56.0%) and CO2 (34.7–45.9%), which constitute calcite (CaCO3) or dolomite (CaMg(CO3)2), given that MgO is present in proportions of up to 20% in this group. The presence of SiO2 (0.0–19.4%) and, to a lesser extent, Al2O3 (0.0–3.8%) suggests the presence of possible impurities in these samples.
On the other hand, the volcanic aggregates showed a SiO2 percentage range of 42.0–61.1%, with other elements present, such as Al2O3 (12.5–17.3%), Fe2O3 (4.5–14.3%), CaO (3.8–11.6%), MgO (2.3–10.6%), Na2O (1.9–5.4%), K2O (1.5–2.4%), and TiO2 (0.7–4.0%).
Finally, the set of granite aggregates exhibited a different composition range. SiO2 (59.8–74.6%) was the most abundant element, with the other oxides present being Al2O3 (12.6–16.2%), CaO (0.6–3.9%), K2O (3.6–6.2%), and Na2O (2.7–5.0%). Fe2O3 (1.2–4.7%), MgO (0.0–3.0%), and TiO2 (0.2–0.8%) were also present. All these results are in agreement with previous studies [6,9,46,47,48].
The ranges of the activity concentrations of the natural radionuclides evidenced the influence of the geological origin of the aggregates. The radionuclides from the uranium and thorium series were found in higher concentrations in granite-origin aggregates, followed by volcanic, carbonate, and silica aggregates. Conversely, 40K was present in higher concentrations in the set of granite aggregates (785–1272 Bq kg−1), followed by the set of silica aggregates (2–676 Bq kg−1), volcanic aggregates (79–548 Bq kg−1), and finally those of a carbonate composition (3–153 Bq kg−1). The obtained ranges showed less dispersion in granite aggregates compared to the other aggregates.

3.2. Mineralogy of Aggregates

Figure 5 shows the diffractograms of the selected samples from each type of aggregate included in this study, along with the identification of their corresponding mineral phases. The peaks associated with the internal pattern of corundum (Al2O3) are marked as (*). Table 2 presents the results of the quantification of the mineral phases present in the analyzed samples, obtained via Rietveld refinement.
The silica aggregates are predominantly composed of quartz, given the high percentage of SiO2 present in this set of samples. Additionally, variable amounts of potassium feldspars such as orthoclase and sodium feldspars such as albite were found (13.77% and 9.71% in S9 and S12, respectively), which is consistent with the presence of variable amounts of Al2O3, K2O, and Na2O. In sample S12, calcite was identified at 4.24%, which explains the elevated loss on ignition (LoI) (up to 5%) present in some samples of this set (see Table S1).
The carbonate aggregates predominantly presented calcite (C5) or dolomite (C2), with the minor presence of quartz in C2 and illite in C5.
On the other hand, the volcanic aggregates exhibited variable content of Al2O3, Fe2O3, CaO, MgO, Na2O, and K2O, which, in combination with SiO2, form a wide variety of silicate mineral phases, such as feldspars (plagioclase, sanidine), feldspathoids (nepheline), pyroxenes, and olivine. Additionally, it is common to find other accessory minerals, such as hematite and minerals rich in TiO2 (rutile, ilmenite, titanomagnetite, etc.).
Finally, the granite aggregates had a heterogeneous mineralogical composition, predominantly rich in quartz due to the high SiO2 content. Moreover, the SiO2 in combination with the Al2O3, CaO, Na2O, and K2O present in these rocks justifies the presence of potassium feldspars and plagioclases. The content of Fe2O3 and MgO also accounts for the presence of various phyllosilicates, such as biotite and chlorite. Lastly, accessory minerals such as anatase and apatite were found, associated with the variable TiO2 and P2O5 content, as well as zircon; although the diffractograms do not show intense peaks, this justifies its presence in trace amounts due to the content of ZrO2 (Table S1).
The mineralogical composition found in these samples is consistent with the scientific literature [49,50] and aligns with the results obtained through XRF (Table S1).

3.3. Correlation Between Chemical Composition and Activity Concentration

The results regarding the chemical composition and activity concentrations were analyzed using principal component analysis (PCA) and represented in an HJ-Biplot graph (Figure 6). The figure illustrates the two factors identified for the four types of aggregates and the clusters derived from the sample scores. The samples selected for the subsequent validation of the method are highlighted with a red box.
The variables excluded from the PCA were MnO, SO3, CO2, and ZrO2, achieving a KMO suitability index of 0.72, which indicates a satisfactory degree of correlation [51]. The two main factors identified in the PCA explain 72% of the variance. Factor 1 accounts for 20.4% of the total variance and is associated with the chemical composition variables SiO2, Fe2O3, TiO2, and P2O5. In contrast, Factor 2 explains 51.6% of the variance and is directly related to the activity concentration variables of the radionuclides included in the study (234Th, 226Ra, 214Pb, 214Bi, 210Pb, 228Ac, 212Pb, 208Tl, and 40K), as well as the content of K2O.
The obtained HJ-Biplot, which is shown in Figure 6, reveals a strong correlation between the activity concentration variables of radionuclides from the uranium series (234Th, 226Ra, 214Pb, 214Bi, 210Pb) and the thorium series (228Ac, 212Pb, 208Tl), as well as 40K and K2O content. This set of variables is less correlated with Al2O3 and Na2O, whose proximity to the K2O vector could be explained by the involvement of these elements in the formation of alkaline feldspars. However, an inverse correlation was observed in the case of CaO, indicating that, as the percentage of CaO increases, the activity concentrations of the determined radionuclides decrease. On the other hand, the vectors corresponding to the chemical variables Fe2O3, TiO2, and P2O5 formed angles of 90° with those variables related to the radionuclide content, indicating the absence of a correlation between them. The samples represented in the HJ-Biplot were grouped coherently according to their chemical compositions and nature, constituting the four groupings observed in Figure 6, i.e., siliceous, carbonate, volcanic, and granitic aggregates, which were positioned away from the coordinate center, thus making the groupings statistically representative.
The cluster of siliceous aggregates (quartz–feldspathic) exhibited low dispersion and presented an inverse correlation with Al2O3, Na2O, K2O, and 40K, as well as with the radionuclides from the uranium and thorium series. The carbonate aggregates were located close to the siliceous ones, suggesting that they would display similar behavior regarding the radionuclide content. However, this grouping showed a greater affinity for CaO, a fundamental element in this set of samples.
The grouping obtained from volcanic aggregates demonstrated greater dispersion in the sample scores, reflecting an affinity for the percentages of MgO, TiO2, Fe2O3, and P2O5. The projection of this group of samples in the HJ-Biplot forms an angle of approximately 90° with respect to the vectors representing the radionuclides from the uranium and thorium radioactive series, as well as 40K. Therefore, the radionuclide content of this group would show a low or no correlation with the chemical composition.
Finally, the grouping formed by granitic aggregates showed significant weight in Factor 1, indicating a strong correlation with the radionuclides from the uranium and thorium series, as well as with the content of K2O and 40K. The correlation found between granites and the radionuclide content is consistent with other studies that have associated the high radioactivity of granitic rocks with the presence of potassium-rich minerals (orthoclase) and accessory minerals rich in radionuclides (zircon, apatite) [52].

3.4. Predictive Models of Activity Concentrations of 226Ra, 232Th (212Pb), and 40K Based on Chemical Composition Parameters

Figure 7 shows the linear fits representing the activity concentrations obtained through gamma spectrometry as a function of the predicted values from the different models. Additionally, each fit includes the confidence intervals of the linear adjustments, which highlight the results that overlap with the linear fit. The predicted values fall significantly within these confidence intervals, indicating that the information provided by the fits aligns with the experimental measurements conducted. The figure also includes the values of the root mean square error (RMSE), which are used to evaluate the dispersion of the obtained models. On the other hand, the figure illustrates the models derived through multiple regression analysis, which estimate the activity concentrations of the radionuclides necessary to calculate the activity concentration indices (ACIs) of siliceous, carbonate, and granitic aggregates based on their chemical compositions. Additionally, Figure 7 shows the expressions of the proposed models, along with their chemical variables ordered by their influence from highest to lowest. Conversely, predictive models were not developed for the volcanic aggregate set due to the lack of correlation between the activity concentrations of radionuclides and the chemical composition (Figure 6).
Siliceous and carbonate aggregates were analyzed as a single dataset due to the similarity identified in the principal component analysis (PCA), while the second dataset analyzed consisted of granitic aggregates.
Table 3 shows the results obtained from the Student’s t-tests and Fisher’s F-tests, which were used to verify whether the means and variances were statistically significant between the experimental values and those estimated by the models. The F- and t-values exceeded the chosen significance level (α = 0.05), indicating that there were no significant differences between the means and variances of both sets of results.
The proposed model for 226Ra from the siliceous and carbonate aggregate set achieved a coefficient of determination (R2) of 0.4542, with an RMSE of 5.13, indicating dispersion of 41.30% based on an average value of 226Ra of 12.42 Bq kg−1 for these samples. On the other hand, the model obtained for 232Th (212Pb) yielded a coefficient of determination of 0.725 and an RMSE of 3.83, indicating dispersion of 45.29% based on an average value for 212Pb of 8.45 Bq kg−1. The chemical variable with the greatest weight in the models for 226Ra and 232Th was the percentage of TiO2, which is related to the presence of accessory minerals such as ilmenite and rutile. This mineralogy, along with other heavy minerals, is associated with the presence of natural radionuclides from the natural radioactive series of uranium and thorium [53,54,55]. Furthermore, due to their high resistance to abrasion, these minerals tend to be part of the accessory mineralogy in soils, sediments, and detrital rocks through accumulation [54,56].
The predictive model for the activity concentration of 40K determined for the siliceous and carbonate aggregate set achieved an R2 of 0.920, showing the correctness of the trend in the experimental points relative to the obtained model. The RMSE value obtained in this model was 58.64, corresponding to 33.52% dispersion regarding the average experimental value of 40K of 174.98 Bq kg−1. The most influential chemical factors in this model were ranked from highest to lowest weight, with the percentages of TiO2 (even at low concentrations), Na2O, and K2O. Na2O and K2O are fundamental compounds in feldspars, so the positive contribution to the model would be related to the mineralogical proportion of their solid solution. However, the content of TiO2 penalized the estimation of 40K in the model. In other words, the presence of feldspar impurities, micas, oxides, and other accessory minerals would be related to a higher activity concentration of radionuclides from the 238U and 234Th.
The model determined for 226Ra in granite aggregates achieved a coefficient of determination (R2) and RMSE of 0.5402 and 38.48, respectively, corresponding to dispersion of 27.94% relative to the average experimental value of 226Ra, which is 137.72 Bq kg−1. On the other hand, the models determined for 232Th (212Pb) yielded R2 and RMSE values of 0.6786 and 28.62, corresponding to dispersion of 34.71% relative to the average experimental value of 232Th (212Pb), which is 82.46 Bq kg−1. Both models showed that the factor with the greatest weight was the percentage of MnO, followed by TiO2 and P2O5. These results reflect that the estimation of both 226Ra and 212Pb does not depend on the percentage of major elements but rather on those that are part of the accessory mineralogy of the granites.
The accessory minerals that imply the presence of natural radionuclides in granitic igneous rocks are those whose composition includes the phosphate group (monazite and apatite), titanium oxides (rutile, ilmenite, and titanite), and iron oxides (hematite) [57]. Additionally, pyrolusite (MnO2) is indirectly related to the content of radionuclides from the uranium series due to its high oxidative capacity, oxidizing U4+ to UO22+ in alteration environments and absorbing them on its surface [58]. For this reason, pyrolusite is sometimes associated with uranium deposits in granitic regions [59]. However, the presence of this mineral could not be confirmed by X-ray diffraction (XRD) due to the weak intensity of its diffraction peaks, which may have been masked by the presence of other more abundant minerals (quartz and feldspars). Nevertheless, the MnO content found through X-ray fluorescence (FRX) in these aggregates (Table S1) justifies the accessory presence of Mn oxides, which positively influence the estimation of 226Ra (uranium series) and negatively affect the predictive model of 232Th (212Pb).
Finally, the estimation model for 40K achieved an R2 of 0.818 and an RMSE of 49.62, corresponding to dispersion of 4.74%, determined from the average activity concentration value of 1046.49 Bq kg−1 for the experimental 40K, confirming the low dispersion of the results estimated by this model. The chemical compounds that influenced this model, in order of weight, were TiO2, Na2O, and K2O, with TiO2 showing a negative influence on the estimation, while K2O had a positive impact. This inverse relationship is consistent with the processes of magmatic differentiation in granites, where, as minerals rich in TiO2 (ilmenite, rutile) precipitate, the magma evolves and becomes enriched in K2O, which ultimately forms feldspars [60].

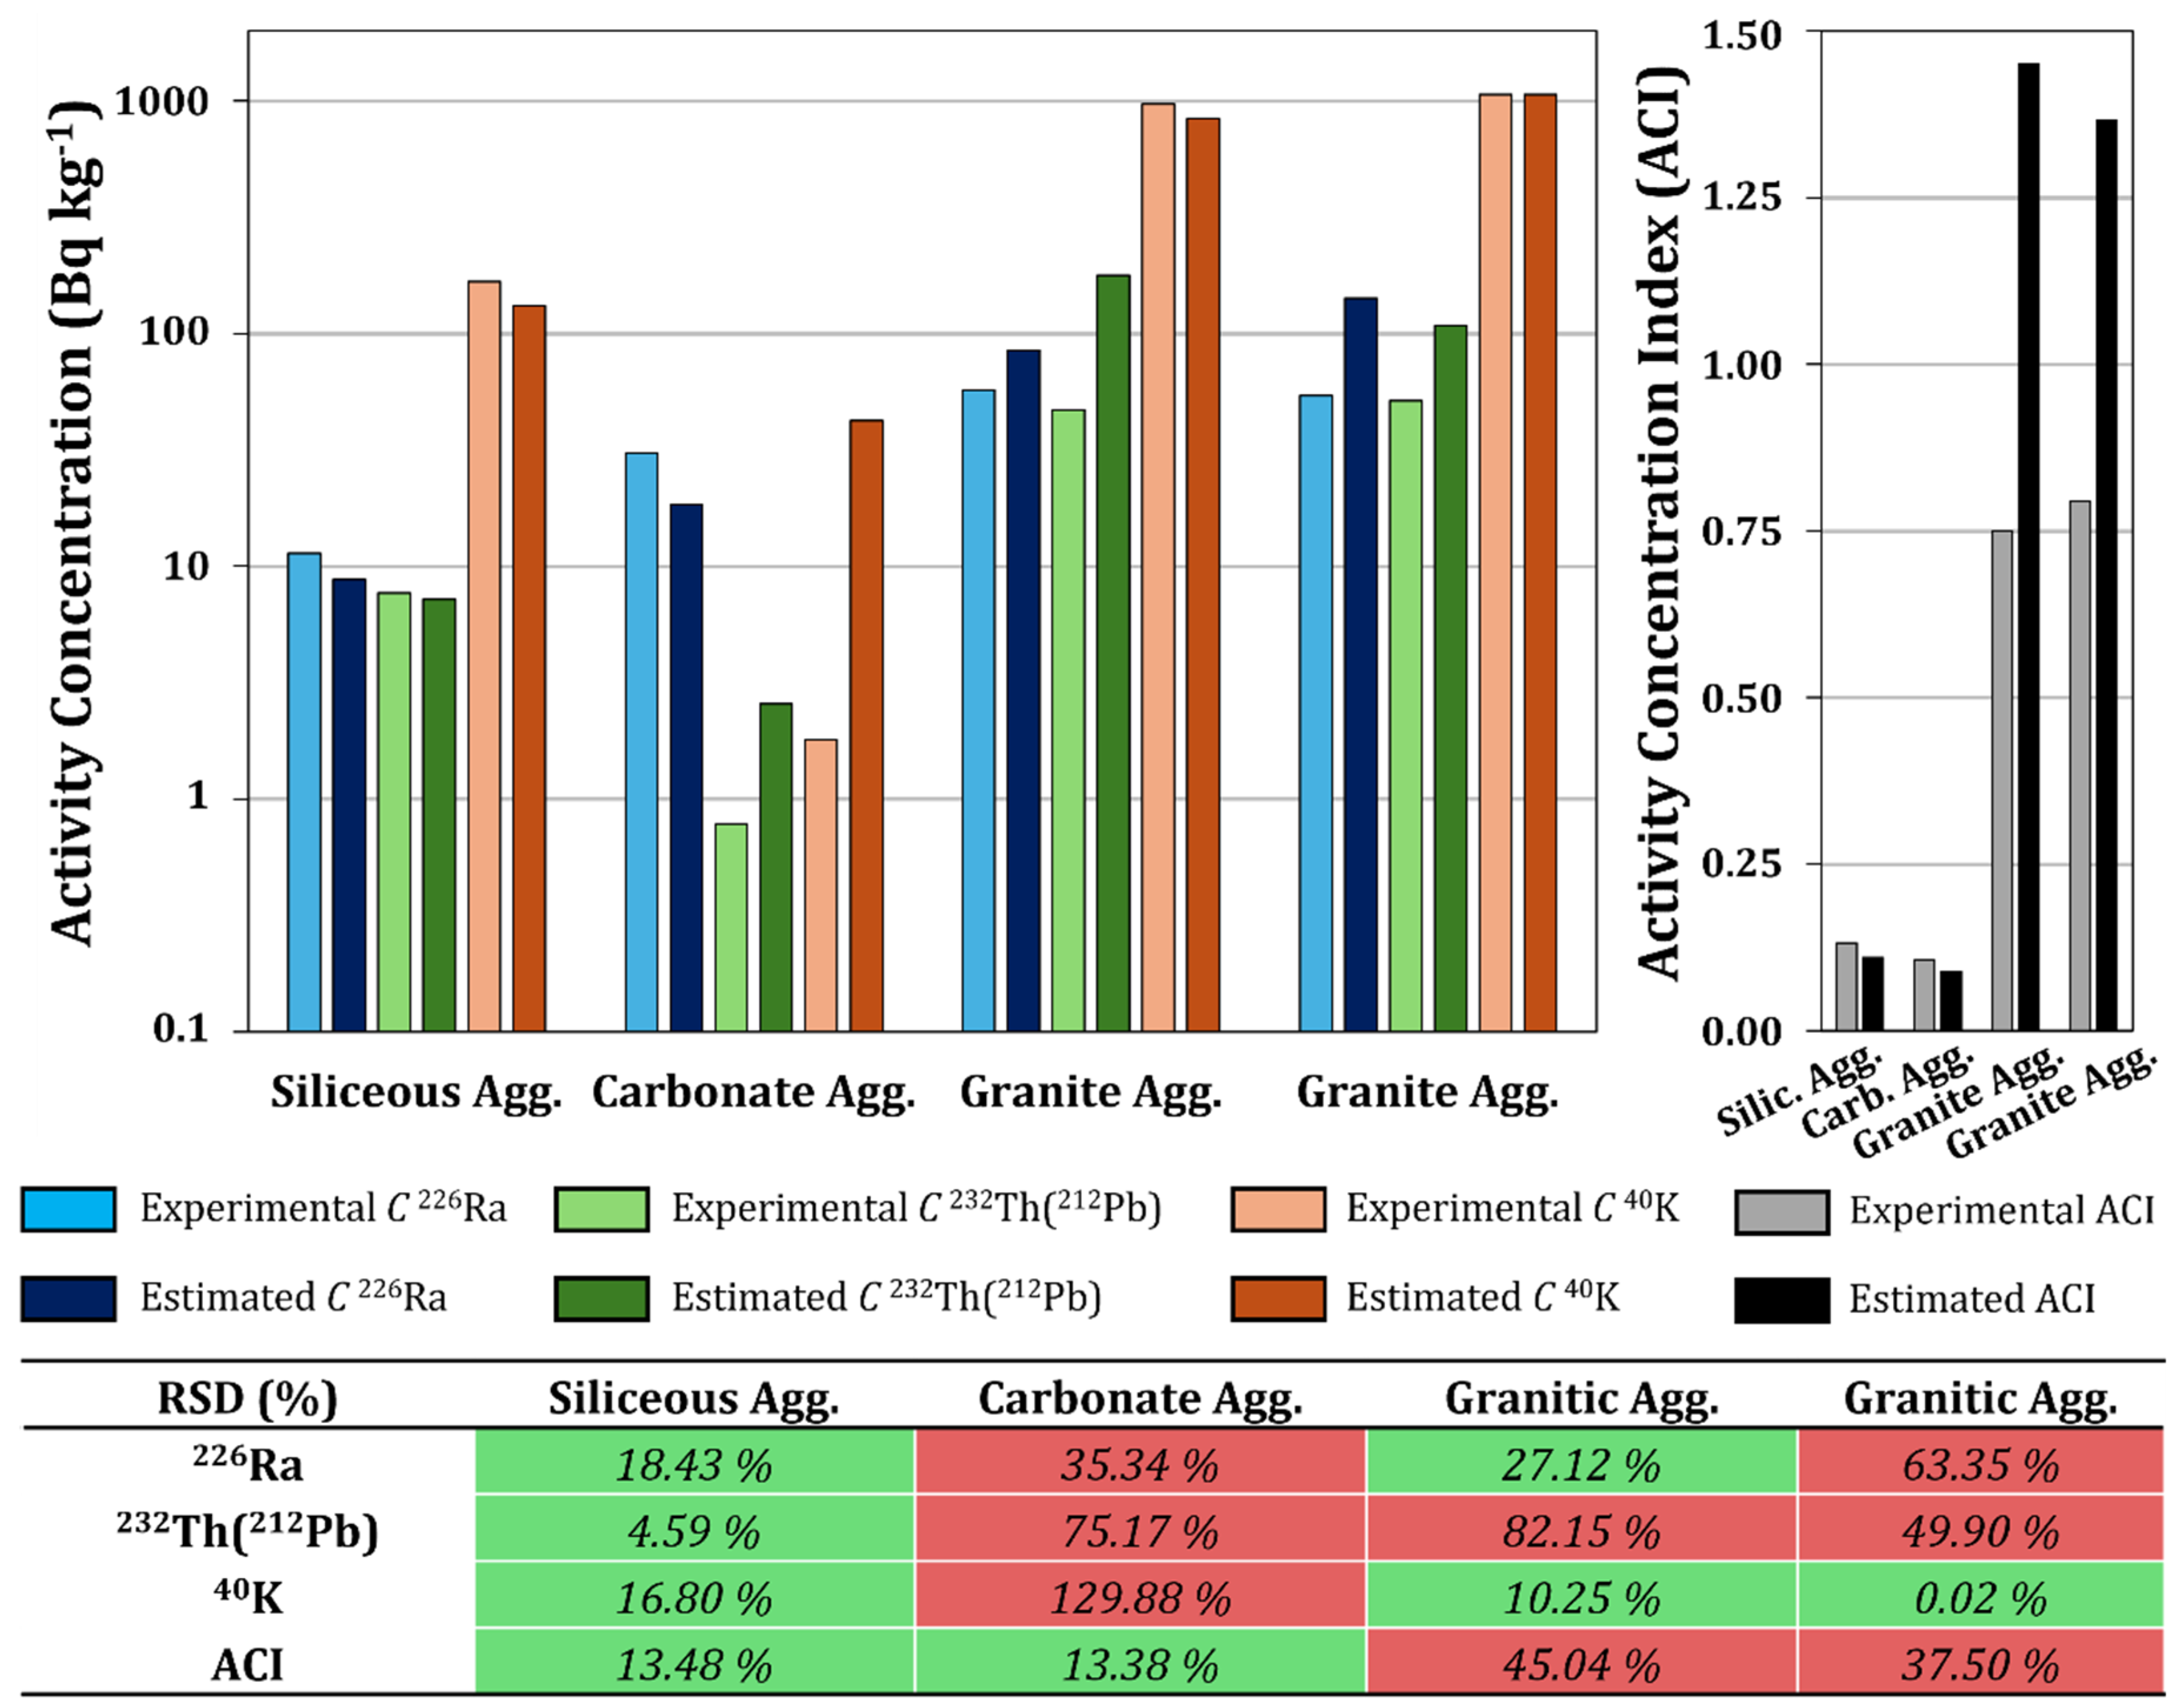
3.5. Validation of the Achieved Models

The validation of the developed models was performed by analyzing aggregate samples that were not included in the statistical analysis, following the methodology described in Section 2.2.4. These samples included one sample of siliceous origin, one sample of carbonate origin, and two samples of granitic origin. Figure 8 shows the activity concentrations of 226Ra, 232Th (212Pb), and 40K obtained for the siliceous, carbonaceous, and granitic aggregates, as well as the values of the activity concentration index (ACI) derived from these values. Additionally, the figure contains the relative standard deviation (RSD%) values obtained for each of the estimated activity concentrations and ACIs, which indicate the relative percentage differences between the experimental values and those obtained from the proposed models.
Fifty percent of the RSD (%) values were below 30%, meeting the acceptance criterion established for the models. The RSD (%) obtained for the models determined for the siliceous aggregate set was satisfactory for both the ACI and the activity concentrations of 226Ra, 212Pb, and 40K in all validation samples. On the other hand, the models determined for the carbonate aggregate set were not satisfactory, as all estimated activity concentration values for 226Ra, 212Pb, and 40K were overestimated by the models. The discordant results may be attributed to the low proportions of TiO2, Na2O, and K2O in this type of rock, whose presence is associated with the content of natural radionuclides, leading to the low predictive capacity of the model for this type of aggregate. However, the RSD (%) criterion for the calculation of the ACI in this set was met. Therefore, although the models do not accurately estimate the activity concentrations of 226Ra, 212Pb, and 40K, they do so for the ACI, which could provide valuable information for the selection of critical samples.
Regarding the granitic aggregate set, the RSD (%) values obtained for 40K achieved a 100% satisfactory rate. However, the models related to the activity concentration of 226Ra and especially to 232Th (212Pb) did not meet the acceptance criterion, with satisfactory rates of 50% and 0%, respectively. In all cases, the estimated values were higher than the experimental values. This overestimation may have been due to the relationship between the activity concentration and the percentage of minor elements such as MnO, P2O5, and TiO2. On the other hand, the models achieved a 50% satisfactory rate for the RSD (%) concerning the ACI, allowing for the accurate estimation of the set of radionuclides considered in this index.
Finally, the ACI values obtained through the proposed models for siliceous and carbonate aggregates were lower than those determined from the experimental activity concentrations. Nevertheless, they provide a reasonably accurate estimate to assess their suitability concerning the current legislation. In the case of granitic aggregates, the ACIs obtained through the proposed models were higher than those obtained from the experimental activity concentrations, with the differences reaching up to 45%. This significant difference is attributed to the high heterogeneity in the chemical and mineralogical compositions of granites, which complicates the estimation of the activity concentrations of 226Ra, 232Th, and 40K. Furthermore, as previously indicated, the activity concentrations of these radionuclides are fundamentally associated with the accessory mineralogy of the granites and, therefore, are not related to the chemical composition regarding the major elements in this case.

4. Conclusions

This study examined the relationship between the chemical composition and the activity concentrations of natural radionuclides present in four types of aggregates commonly used in mortars and concretes: eight of the siliceous type, five of the carbonate type, seven of volcanic origin, and fifteen of the granitic type. In addition, the different mineralogical phases obtained by X-ray diffraction (XRD) have been correlated with the chemical composition and radioactive content to explain and understand the various relationships observed.
The chemical composition obtained through X-ray fluorescence (XRF) revealed high values of SiO2 for the siliceous aggregates, reaching up to 99.2%. Additionally, the Al2O3 values ranged between 0.2% and 12.1% due to the presence of feldspars. The carbonatic aggregates exhibited high content of CaO, which reached up to 55.4%, and a CO2 percentage of 43.5%; this is associated with carbonates, linked to the presence of calcite and dolomite. The chemical composition of the volcanic aggregates was more complex, with the main characteristic being a range of SiO2 between 42.0% and 61.1%, along with Al2O3 at 15.8% and Fe2O3 at 10.2%. The composition of the granitic aggregates was more homogeneous than that of the other aggregates, with a SiO2 range between 59.8% and 74.6% and percentages of Al2O3 and Na2O reaching up to 15.0% and 5.9%, respectively. Regarding the mineral phases obtained through X-ray diffraction (XRD), it was observed that, in the siliceous aggregates, there was a predominant quartz phase with a SiO2 range varying between 78.9% and 99.2%, as well as the presence of potassium and sodium feldspars. The carbonatic aggregates contained calcite and dolomite as the main phases, along with a small percentage of quartz and illite. The volcanic aggregates displayed greater variability in the determined mineral phases, with a SiO2 percentage ranging from 42.0% to 61.1%, along with smaller proportions of feldspars, pyroxenes, and olivine. The granitic aggregates showed the presence of mineral phases that indicated a greater contribution of natural radionuclides, such as zircon and monazite. The content of natural radionuclides was as expected, with the aggregates containing the highest levels of natural radionuclides being the granitic aggregates in both the uranium and thorium series. However, in the remaining aggregates, the concentrations of these radionuclides were lower, with only significant concentrations of 40K found, ranging from 2 to 676 Bq kg−1 for the siliceous aggregates, from 79 to 548 Bq kg−1 for the volcanic aggregates, and between 3 and 153 Bq kg−1 for the carbonatic aggregates.
The correlations between the chemical compositions of the aggregates and the activity concentrations were determined using an HJ-Biplot graph, which compiled the results from the principal component analysis (PCA). The graph accurately grouped the aggregates into the four investigated categories. The variables excluded from the analysis were MnO, SO3, CO2, and ZrO2, resulting in a KMO adequacy index of 0.72, confirming the satisfactory correlation. The two factors obtained explained 72% of the variance, with Factor 1 associated with SiO2, Fe2O3, TiO2, and P2O5, while Factor 2 was related to the natural radionuclides and K2O. Additionally, a strong correlation was observed between the concentrations of radionuclides from the uranium and thorium series, as well as with 40K and K2O. On the other hand, an inverse correlation was found between C a O and the natural radionuclides present.
The multiple regression analysis enabled the development of predictive models to estimate the activity concentrations of radionuclides in siliceous, carbonatic, and granitic aggregates based on their chemical compositions. The models developed for siliceous and carbonatic aggregates demonstrated a significant correlation with natural radionuclides. However, a weak correlation was observed for volcanic aggregates, preventing the development of a model. The models for siliceous and carbonatic aggregates achieved satisfactory coefficients of determination (R2) of 0.920 and 0.454 for 226Ra in siliceous and carbonatic aggregates, respectively. Conversely, the models for granitic aggregates exhibited overestimations in the activity concentrations of natural radionuclides due to the complex relationship between the radionuclides and the accessory mineralogy, yielding R2 values of 0.5402 for 226Ra and 0.6786 for 212Pb. Model validation revealed that, while some models met the acceptance criteria (50% of the results), others failed to accurately estimate the experimental activity concentrations, with this issue being more pronounced for carbonatic and granitic aggregates. Despite these limitations, the calculated activity concentration indices (ACIs) provide valuable estimates for the evaluation of the suitability of these aggregates in accordance with the current regulations.
The future of forthcoming research aimed at expanding this investigation must necessarily involve correlating the activity concentrations of natural radionuclides with the chemical composition regarding minor and trace elements, obtained through methods with greater analytical sensitivity, as well as with the mineralogical compositions of the aggregates.

Supplementary Materials

The following supporting information can be downloaded at: https://www.mdpi.com/article/10.3390/ma18061369/s1, Table S1. Chemical compositions (wt.%) of the analyzed aggregates obtained by XRF; Table S2. Activity concentrations (Bq kg−1) of the radionuclides from the natural radioactive series of uranium and thorium and 40K from the analyzed aggregate samples; Table S3. Chemical compositions (wt.%) of the aggregate samples used in the validation of the models; Table S4. Activity concentrations (Bq kg−1) of the aggregate samples used in the validation of the models.

Author Contributions

Conceptualization, A.C., J.A.S.-N. and M.d.M.A.; methodology, A.C., J.A.S.-N., A.P.-M., Q.M., G.H., L.S. and M.d.M.A.; validation, A.C., J.A.S.-N. and M.d.M.A.; formal analysis, A.C., A.P.-M. and J.A.S.-N.; investigation, A.C., J.A.S.-N., A.P.-M., L.S. and M.d.M.A.; resources, A.C., J.A.S.-N., A.P.-M., Q.M., G.H., L.S. and M.d.M.A.; data curation, A.C. and J.A.S.-N.; writing—original draft preparation, A.C., J.A.S.-N. and M.d.M.A.; writing—review and editing, A.C., J.A.S.-N. and M.d.M.A.; supervision, J.A.S.-N.; project administration, M.d.M.A. and J.A.S.-N.; funding acquisition, M.d.M.A. All authors have read and agreed to the published version of the manuscript.

Funding

This research has been conducted with the support of Project PID2020-116002RB-100/AEI/10.13039/501100011033 (HORRADIONEX). The authors would also like to thank the MICIM for the pre-doctoral contract (PRE2021-098535) of Andrés Caño Blanes.

Institutional Review Board Statement

Not applicable.

Informed Consent Statement

Not applicable.

Data Availability Statement

The original contributions presented in this study are included in the article/Supplementary Material. Further inquiries can be directed to the corresponding author.

Conflicts of Interest

The authors declare that they have no known competing financial interests or personal relationships that could have appeared to influence the work reported in this paper.

References

  1. Cardoso, R.; Silva, R.V.; de Brito, J.; Dhir, R. Use of recycled aggregates from construction and demolition waste in geotechnical applications: A literature review. Waste Manag. 2016, 49, 131–145. [Google Scholar] [CrossRef] [PubMed]
  2. de Andrade Salgado, F.; de Andrade Silva, F. Recycled aggregates from construction and demolition waste towards an application on structural concrete: A review. J. Build. Eng. 2022, 52, 104452. [Google Scholar] [CrossRef]
  3. Brioschi, N.; Cordero, E.G.; Ng, S.; Paglia, C. Low-cement eco-concrete and the role of recycled concrete aggregates (RCA), supplementary cementitious materials (SCMs), and other additives in improving sustainability and durability. Mater. Constr. 2024, 74, e359. [Google Scholar] [CrossRef]
  4. Naderi, M.; Kaboudan, A. Experimental study of the effect of aggregate type on concrete strength and permeability. J. Build. Eng. 2021, 37, 101928. [Google Scholar] [CrossRef]
  5. An, J.; Kim, S.S.; Nam, B.H.; Durham, S.A. Effect of aggregate mineralogy and concrete microstructure on thermal expansion and strength properties of the normal strength concrete. Appl. Sci. 2017, 7, 1307. [Google Scholar] [CrossRef]
  6. Piasta, W.; Góra, J.; Turkiewicz, T. Properties and durability of coarse igneous rock aggregates and concretes. Constr. Build. Mater. 2016, 126, 119–129. [Google Scholar] [CrossRef]
  7. Menadi, B.; Kenai, S.; Khatib, J.; Aït-Mokhtar, A. Strength and durability of concrete incorporating crushed limestone sand. Constr. Build. Mater. 2009, 23, 625–633. [Google Scholar] [CrossRef]
  8. Aquino, C.; Inoue, M.; Miura, H.; Mizuta, M.; Okamoto, T. The effects of limestone aggregate on concrete properties. Constr. Build. Mater. 2010, 24, 2363–2368. [Google Scholar] [CrossRef]
  9. Suárez-Navarro, J.A.; Alonso, M.D.M.; Gascó, C.; Pachón, A.; Carmona-Quiroga, P.M.; Argiz, C.; Sanjuán, M.; Puertas, F. Effect of particle size and composition of granitic sands on the radiological behaviour of mortars. Boletín De La Soc. Española De Cerámica Y Vidr. 2022, 61, 561–573. [Google Scholar] [CrossRef]
  10. Anjos, R.; Veiga, R.; Soares, T.; Santos, A.; Aguiar, J.; Frascá, M.; Brage, J.; Uzêda, D.; Mangia, L.; Facure, A.; et al. Natural radionuclide distribution in Brazilian commercial granites. Radiat. Meas. 2005, 39, 245–253. [Google Scholar] [CrossRef]
  11. Moghazy, N.M.; El-Tohamy, A.M.; Fawzy, M.M.; Awad, H.A.; Zakaly, H.M.H.; Issa, S.A.M.; Ene, A. Natural radioactivity, radiological hazard and petrographical studies on aswan granites used as building materials in Egypt. Appl. Sci. 2021, 11, 6471. [Google Scholar] [CrossRef]
  12. Guillén, J.; Tejado, J.; Baeza, A.; Corbacho, J.; Muñoz, J. Assessment of radiological hazard of commercial granites from Extremadura (Spain). J. Environ. Radioact. 2014, 132, 81–88. [Google Scholar] [CrossRef] [PubMed]
  13. Ju, Y.-J.; Ryu, Y.-H.; Dong, K.-R.; Cho, J.-H.; Lee, H.-K.; Chung, W.-K. Study on measurement and quantitative analysis of Radon-222 emitted from construction materials. Ann. Nucl. Energy 2012, 49, 88–95. [Google Scholar] [CrossRef]
  14. Shabek, F.; Obradović, B.; Čeliković, I.; Đurašević, M.; Samolov, A.; Kolarž, P.; Janićijević, A. The Radon Exhalation Rate and Dose Assessment of Granite Used as a Building Material in Serbia. Atmosphere 2024, 15, 1495. [Google Scholar] [CrossRef]
  15. Martín-Rodríguez, P.; Fernández-Jiménez, A.; Alonso, M.d.M.; Palomo, A.; García-Lodeiro, I. Valorisation of “La Palma” Volcanic Ash for Making Portland-Blended, Alkaline and Hybrid Portland–Alkaline Cements. Materials 2024, 17, 242. [Google Scholar] [CrossRef]
  16. Capaccioni, B.; Cinelli, G.; Mostacci, D.; Tositti, L. Long-term risk in a recently active volcanic system: Evaluation of doses and indoor radiological risk in the quaternary Vulsini Volcanic District (Central Italy). J. Volcanol. Geotherm. Res. 2012, 247, 26–36. [Google Scholar] [CrossRef]
  17. Turhan, Ş.; Atıcı, E.; Varinlioğlu, A. Radiometric analysis of volcanic tuff stones used as ornamental and structural building materials in Turkey and evaluation of radiological risk. Radioprotection 2015, 50, 273–280. [Google Scholar] [CrossRef]
  18. Hanfi, M.Y.; Gawad, A.E.A.; Ali, K.G.; Abu-Donia, A.; Alsafi, K.G.; Khafaji, M.; Albahiti, S.K.; Alqahtani, M.S.; Khalil, M.; Wahed, A.A.A. Environmental risk assessment associated with acidic volcanics in Egypt. Appl. Radiat. Isot. 2022, 188, 110413. [Google Scholar] [CrossRef]
  19. EU. Laying down Basic Safety Standards for Protection against the Dangers Arising from Exposure to Ionising Radiation, and Repealing Directives 89/618/Euratom, 90/641/Euratom, 96/29/Euratom, 97/43/Euratom and 2003/122/Euratom. Council Directive 2013/59/Euratom of 5 Dec; European Commission: Brussels, Belgium, 2013; Volume 57. [Google Scholar]
  20. Suárez-Navarro, J.; Moreno-Reyes, A.; Gascó, C.; Alonso, M.; Puertas, F. Gamma spectrometry and LabSOCS-calculated efficiency in the radiological characterisation of quadrangular and cubic specimens of hardened portland cement paste. Radiat. Phys. Chem. 2020, 171, 108709. [Google Scholar] [CrossRef]
  21. Caño, A.; Suárez-Navarro, J.; García-Calvo, J.; García, Q.M.; Alonso, M. Determination of a standard efficiency using the ISOCS uncertainty estimator for calculating the activity concentration of 226Ra, 232Th, and 40K in concrete. Measurement 2025, 242, 115856. [Google Scholar] [CrossRef]
  22. Suresh, G.; Ramasamy, V.; Meenakshisundaram, V.; Venkatachalapathy, R.; Ponnusamy, V. A relationship between the natural radioactivity and mineralogical composition of the Ponnaiyar river sediments, India. J. Environ. Radioact. 2011, 102, 370–377. [Google Scholar] [CrossRef] [PubMed]
  23. Hanfi, M.Y.; Gawad, A.E.A.; Eliwa, H.; Ali, K.; Taki, M.M.; Sayyed, M.; Khandaker, M.U.; Bradley, D.A. Assessment of radioactivity in Granitoids at Nikeiba, Southeastern Desert, Egypt; radionuclides concentrations and radiological hazard parameters. Radiat. Phys. Chem. 2022, 200, 110113. [Google Scholar] [CrossRef]
  24. Taalab, S.A.; Ismail, A.M.; El Maadawy, W.; Abdelrahman, K.; Khandaker, M.U.; Sakr, A.K.; Hanfi, M.Y. Natural radioactivity, mineralogy and hazard assessment of syenogranites (ornamental stones) using a statistical approach. Nucl. Eng. Technol. 2024, 56, 4141–4148. [Google Scholar] [CrossRef]
  25. Coletti, C.; Brattich, E.; Cinelli, G.; Cultrone, G.; Maritan, L.; Mazzoli, C.; Mostacci, D.; Tositti, L.; Sassi, R. Radionuclide concentration and radon exhalation in new mix design of bricks produced reusing NORM by-products: The influence of mineralogy and texture. Constr. Build. Mater. 2020, 260, 119820. [Google Scholar] [CrossRef]
  26. Suárez-Navarro, J.A.; Sanjuán, M.A.; Argiz, C.; Hernáiz, G.; Barragán, M.; Estévez, E. Radiological assessment of iron silicate as a potential aggregate in concrete and mortars. Cem. Concr. Compos. 2022, 129, 104490. [Google Scholar] [CrossRef]
  27. Gawad, A.E.A.; Hanfi, M.Y.; Alqahtani, M.S.; Ramadan, A.A. Geochemical features and radiological risk assessment of Wadi El-Regeita granites, South Central Sinai, Egypt. Radiat. Phys. Chem. 2025, 226, 112161. [Google Scholar] [CrossRef]
  28. Caño, A.; Suárez-Navarro, J.A.; Puertas, F.; Fernández-Jiménez, A.; Alonso, M.D.M. New Approach to Determine the Activity Concentration Index in Cements, Fly Ashes, and Slags on the Basis of Their Chemical Composition. Materials 2023, 16, 2677. [Google Scholar] [CrossRef]
  29. Mastori, H.; Piluso, P.; Haquet, J.-F.; Denoyel, R.; Antoni, M. Limestone-siliceous and siliceous concretes thermal damaging at high temperature. Constr. Build. Mater. 2019, 228, 116671. [Google Scholar] [CrossRef]
  30. Binici, H.; Shah, T.; Aksogan, O.; Kaplan, H. Durability of concrete made with granite and marble as recycle aggregates. J. Mater. Process. Technol. 2008, 208, 299–308. [Google Scholar] [CrossRef]
  31. Demirdag, S.; Gunduz, L. Strength properties of volcanic slag aggregate lightweight concrete for high performance masonry units. Constr. Build. Mater. 2008, 22, 135–142. [Google Scholar] [CrossRef]
  32. Korkanç, M.; Tuğrul, A. Evaluation of selected basalts from Niğde, Turkey, as source of concrete aggregate. Eng. Geol. 2004, 75, 291–307. [Google Scholar] [CrossRef]
  33. Li, P.; Yu, Q.; Brouwers, H. Effect of coarse basalt aggregates on the properties of Ultra-high Performance Concrete (UHPC). Constr. Build. Mater. 2018, 170, 649–659. [Google Scholar] [CrossRef]
  34. EN 196-2:2014; Method of Testing Cement-Part 2: Chemical Analysis of Cement. AENOR: Madrid, Spain, 2014. (In Spanish)
  35. Alonso, M.; Suárez-Navarro, J.; Pérez-Sanz, R.; Gascó, C.; Reyes, A.M.d.L.; Lanzón, M.; Blanco-Varela, M.; Puertas, F. Data on natural radionuclide’s activity concentration of cement-based materials. Data Brief 2020, 33, 106488. [Google Scholar] [CrossRef]
  36. EN ISO/IEC 17025:2017; General Requirements for the Competence of Testing and Calibration Laboratories. ISO: Geneva, Switzerland, 2017.
  37. CANBERRA. Genie 2000 Operations Manual; Canberra Industries: Meriden, CT, USA, 2012. [Google Scholar]
  38. Suárez-Navarro, J.; Benavente, J.; Expósito-Suárez, V.; Caño, A.; Hernaiz, G.; Alonso, M.M. 226Ra activity concentration determined directly from the 186 keV photopeak using gamma spectrometry and a neural network. Radiat. Phys. Chem. 2024, 217, 111486. [Google Scholar] [CrossRef]
  39. Bé, M.M.; Chisté, V.; Dulieu, C.; Kellett, M.; Mougeot, X.; Arzu, A.; Chechev, V.; Kuzmenko, N.; Kibédi, T.; Luca, A. Table of Radionuclides (Vol. 8-A= 41 to 198), Bureau International Des Poids et Mesures (BIPM), Sevres. 2016. Available online: https://cea.hal.science/cea-02476462/ (accessed on 15 September 2024).
  40. Kassambara, A.; Mundt, F. Factoextra: Extract and Visualize the Results of Multivariate Data Analyses. R package Version 1.0.7. 2020. Available online: https://cran.r-project.org/package=factoextra (accessed on 15 September 2024).
  41. Hill, B.D. Sequential Kaiser-Meyer-Olkin Procedure as an Alternative for Determining the Number of Factors in Common-Factor Analysis: A Monte Carlo Simulation; Oklahoma State University: Stillwater, OK, USA, 2011. [Google Scholar]
  42. Zuur, A.F.; Ieno, E.N.; Walker, N.J.; Saveliev, A.A.; Smith, G.M. Zero-Truncated and Zero-Inflated Models for Count Data. In Mixed Effects Models and Extensions in Ecology with R. Statistics for Biology and Health; Springer: New York, NY, USA, 2009. [Google Scholar] [CrossRef]
  43. Méndez-Ramírez, I.; Moreno-Macías, H.; Gómez-Humarán, I.M.; Murata, C. Conglomerados como solución alternativa al problema de la multicolinealidad en modelos lineales. Cienc. Clínicas 2014, 15, 39–46. [Google Scholar] [CrossRef]
  44. Akinwande, M.O.; Dikko, H.G.; Samson, A. Variance inflation factor: As a condition for the inclusion of suppressor variable (s) in regression analysis. Open J. Stat. 2015, 5, 754. [Google Scholar] [CrossRef]
  45. Expósito-Suárez, V.M.; Suárez-Navarro, J.A.; Caro, A.; Sanz, M.B.; Hernaiz, G.; González-Sanabria, A.; Suárez-Navarro, M.J.; Jordá-Bordehore, L.; Chamorro-Villanueva, H.; Arlandi, M.; et al. Radiological characterization of the tailings of an abandoned copper mine using a neural network and geostatistical analysis through the Co-Kriging method. Environ. Geochem. Health 2024, 46, 297. [Google Scholar] [CrossRef]
  46. Schön, J.H. Chapter 1: Rocks—Their Classification and General Properties. In Handbook of Petroleum Exploration and Production; Elsevier: Amsterdam, The Netherlands, 2011. [Google Scholar]
  47. Sharma, S.; Kumar Vyas, A. A study on use of granite powder and crusher dust as fine aggregate in cement mortar. Mater. Today Proc. 2023, 93, 176–181. [Google Scholar] [CrossRef]
  48. Tanyıldızı, M.; Gokalp, I. Utilization of pumice as aggregate in the concrete: A state of art. Constr. Build. Mater. 2023, 377, 131102. [Google Scholar] [CrossRef]
  49. Blatt, H.; Tracy, R.J.; Owens, B.E. Petrology, Igneous, Sedimentary, and Metamorphic, 3rd ed.; W.H. Freeman & Company: New York, NY, USA, 2006; Volume 10, p. 304. [Google Scholar]
  50. Philpotts, A.R.; Ague, J.J. Principles of Igneous and Metamorphic Petrology; Cambridge University Press: Cambridge, UK, 2009. [Google Scholar] [CrossRef]
  51. Dziuban, C.D.; Shirkey, E.C. When is a correlation matrix appropriate for factor analysis? Some decision rules. Psychol. Bull. 1974, 81, 358. [Google Scholar] [CrossRef]
  52. Sayın, N. Radioactive element contents of some granites used as building materials: Insights into the radiological hazards. Bull. Eng. Geol. Environ. 2013, 72, 579–587. [Google Scholar] [CrossRef]
  53. Khandaker, M.U.; Asaduzzaman, K.; Bin Sulaiman, A.F.; Bradley, D.; Isinkaye, M.O. Elevated concentrations of naturally occurring radionuclides in heavy mineral-rich beach sands of Langkawi Island, Malaysia. Mar. Pollut. Bull. 2018, 127, 654–663. [Google Scholar] [CrossRef]
  54. Habib, A.; Akhi, S.Z.; Khan, R.; Phoungthong, K.; Basir, S.; Anik, A.H.; Islam, A.R.M.T.; Idris, A.M. Elevated levels of environmental radioactivity in fluvial sediment: Origin and health risk assessment. Environ. Sci. Process. Impacts 2024, 26, 555–581. [Google Scholar] [CrossRef]
  55. Khan, R.; Parvez, S.; Jolly, Y.N.; Haydar, A.; Alam, F.; Khatun, M.A.; Sarker, M.R.; Habib, A.; Tamim, U.; Das, S.; et al. Elemental abundances, natural radioactivity and physicochemical records of a southern part of Bangladesh: Implication for assessing the environmental geochemistry. Environ. Nanotechnol. Monit. Manag. 2019, 12, 100225. [Google Scholar] [CrossRef]
  56. Papadopoulos, A.; Koroneos, A.; Christofides, G.; Papadopoulou, L.; Tzifas, I.; Stoulos, S. Assessment of gamma radiation exposure of beach sands in highly touristic areas associated with plutonic rocks of the Atticocycladic zone (Greece). J. Environ. Radioact. 2016, 162, 235–243. [Google Scholar] [CrossRef] [PubMed]
  57. Pavlidou, S.; Koroneos, A.; Papastefanou, C.; Christofides, G.; Stoulos, S.; Vavelides, M. Natural radioactivity of granites used as building materials. J. Environ. Radioact. 2006, 89, 48–60. [Google Scholar] [CrossRef] [PubMed]
  58. Snyder, M.; Hunley, L.; Stanberry, J.; Szlamkowicz, I.; Jones, B.; Anagnostopoulos, V. A Preliminary Sorption Study of Uranium on MnO2 (Pyrolusite) in the Presence of Siderophore Desferrioxamine B—The Mechanism of a Ternary System. Water 2023, 15, 3241. [Google Scholar] [CrossRef]
  59. Shahin, H.A.E.R.A. Occurrence of uraniferous iron and manganese oxides in biotite granite North East Gabal El Sela area, South Eastern Desert, Egypt. Arab. J. Geosci. 2013, 6, 2245–2259. [Google Scholar] [CrossRef]
  60. Winter, J.D. Principles of Igneous and Metamorphic Petrology; Pearson Education: Harlow, UK, 2014; Volume 2. [Google Scholar]
Figure 1. Morphological characteristics of aggregates from the four groups analyzed in this study: (A) quartzitic siliceous aggregate (S12), (B) feldspathic (S9), (C) carbonate aggregate (C2), (D) volcanic aggregate (V3), and (E) granitic aggregate (G6).
Materials 18 01369 g001
Figure 2. Flowchart summarizing the methodology used in this study.
Materials 18 01369 g002
Figure 3. (A) Schematic of the gamma spectrometry equipment used; (B) granitic sand before being ground; and (C) ground sample sealed in the cylindrical geometry container used for sample measurement.
Materials 18 01369 g003
Figure 4. Chemical composition (wt.%) and activity concentrations (Bq kg−1) of the radionuclides from the natural uranium and thorium radioactive series, along with 40K, for the set of aggregates included in this study.
Materials 18 01369 g004
Figure 5. Diffractograms of aggregate samples: (A) silica, (B) carbonate, (C) volcanic, and (D) granite. The identified mineral phases were Q = Quartz (SiO2) (COD 1011097), Or = Orthoclase (K Feldspar) (KAlSi3O8) (COD 9000161), Ab = Albite (Plagioclase) (NaAlSi3O8) (COD 9000681), C = Calcite (CaCO3) (COD 1010962), D = Dolomite (CaMg(CO3)2) (COD 1200014), I = Illite ((K,H3O)(Al,Mg,Fe)2(Si,Al)4O10[(OH)2,(H2O)]) (COD 9013718), A = Anorthite (Plagioclase) (CaAl2Si2O8) (COD 9000747), S = Sanidine (K Feldspar) ((K,Na)(Si,Al)4O8) (COD 9001103), Cpx = Clinopyroxene, Diopside (CaMgSi2O6) (COD 9001307), Np = Nepheline (NaAlSiO4) (COD 9004995), Ol = Olivine (Mg2SiO4) (COD 9000166), H = Hematite (Fe2O3) (COD 9000139), Ti = Titanomagnetite (Fe3−xTiO4) (COD 9000933), Ch = Chlorite, Chamosite ((Fe,Mg)5Al(Si3Al)O10(OH)8) (COD 9009233), Bt = Biotite ((K(Mg,Fe)3(AlSi3O10)(OH)2) (COD 9000468), M = Microcline (K Feldspar) (KAlSi3O8) (COD 9000189), Ap = Apatite (Ca5(PO4)3(F, Cl, OH)) (COD 9010383), At = Anatase (TiO2) (COD 1010942). The peaks associated with the internal pattern of corundum (Al2O3) are marked as (*).
Materials 18 01369 g005
Figure 6. HJ-Biplot of the principal component analysis (PCA) relating the variables of the chemical composition and activity concentrations of the radionuclides from the natural uranium and thorium radioactive series, as well as 40K, for the aggregate set included in the study. This analysis achieved a KMO suitability index of 0.72. Samples where XRD was performed and the Rietveld method was applied are highlighted in red.
Materials 18 01369 g006
Figure 7. Predictive models of the activity concentrations of the radionuclides 226Ra, 232Th (212Pb), and 40K in granitic and siliceous/carbonate aggregates based on their chemical compositions. The red dashed lines indicate the upper and lower limits of the confidence band for each generated model. The RMSE index reflects the accuracy by indicating the average error. At the bottom, the expressions of the proposed models are shown, along with the chemical variables ordered from strongest to weakest influence in the models.
Materials 18 01369 g007
Figure 8. Comparison between the estimated activity concentration results and those obtained through gamma spectrometry for the radionuclides 226Ra, 232Th (212Pb), and 40K from siliceous, carbonate, and granitic aggregates. Additionally, the ACI calculated using the estimated values was compared with that calculated from experimental data. The RSD (%) values that met the acceptance criterion assigned for the models (RSD (%) ≤ 30%) are shaded in green, while those that exceeded the threshold value are shaded in red.
Materials 18 01369 g008
Table 1. Energy (keV) and emission probabilities (%) of the radionuclides analyzed in this study.
Radioactive
Series
RadionuclideEnergy (keV)Photons/100
Disintegrations
Uranium
Series
234Th63.30 (2)3.75 (8)
226Ra186.211 (13)3.555 (19)
214Pb351.932 (2)35.60 (7)
214Bi609.312 (7)45.49 (19)
1120.287 (10)14.91 (3)
1764.494 (14)15.31 (5)
210Pb46.539 (1)4.252 (40)
Thorium
Series
228Ac911.196 (6)26.2 (8)
212Pb238.632 (2)43.6 (5)
208Tl583.187 (2)85.0 (5)
Potassium40K1460.822 (6)10.55 (11)
Table 2. Weight (wt.%) of mineral phases found in the analyzed aggregate samples. In the volcanic aggregates, the % of amorphous volume has been included. The Rwp index reflects the quality of the fit between the experimental data and the theoretical model obtained via Rietveld refinement.
Mineral ClassificationPhases (%)Siliceous Agg.Carbonate Agg.Volcanic Agg.Granitic Agg.
S9S12C2C5V3V6G5G12
SilicatesQuartz83.7770.350.15 30.5826.05
K Feldspar2.4615.70 1.146.5230.7231.69
Plagioclase13.779.71 16.1013.7422.6827.55
Biotite * 13.3611.53
Chlorite 0.320.42
Illite * 0.37
Diopside 37.8837.33
Nepheline 0.920.74
Olivine 1.432.67
Zircon 0.140.20
CarbonatesCalcite 4.240.2899.63
Dolomite 99.57
OxidesHematite 2.834.18
Titanomagnetite 3.29
Anatase 0.800.78
PhosphatesApatite 1.401.78
Amorphous 36.4034.81
Rwp13.909.9911.5611.353.924.2610.6510.68
* Minerals of the mica group.
Table 3. p-Values from the paired Student’s t-test and Fisher’s F-test, which evaluated the accuracy and precision of the estimated activity concentration results compared to those obtained through gamma spectrometry. Both tests were performed at a significance level of α = 0.05.
RadionuclideStudent’s t-TestFisher’s F-Test
Siliceous and Carbonate Aggregates226Ra1.0000.125
232Th(212Pb)1.0000.084
40K1.0000.528
Granite Aggregates226Ra1.0000.261
232Th(212Pb)1.0000.477
40K0.9990.712
Disclaimer/Publisher’s Note: The statements, opinions and data contained in all publications are solely those of the individual author(s) and contributor(s) and not of MDPI and/or the editor(s). MDPI and/or the editor(s) disclaim responsibility for any injury to people or property resulting from any ideas, methods, instructions or products referred to in the content.

