
Calibration of Cone Factor in Cone Penetration Test for Evaluating the Undrained Shear Strength of Silty Clay


Abstract
1. Introduction
2. Laboratory Tests
2.1. Test Soil
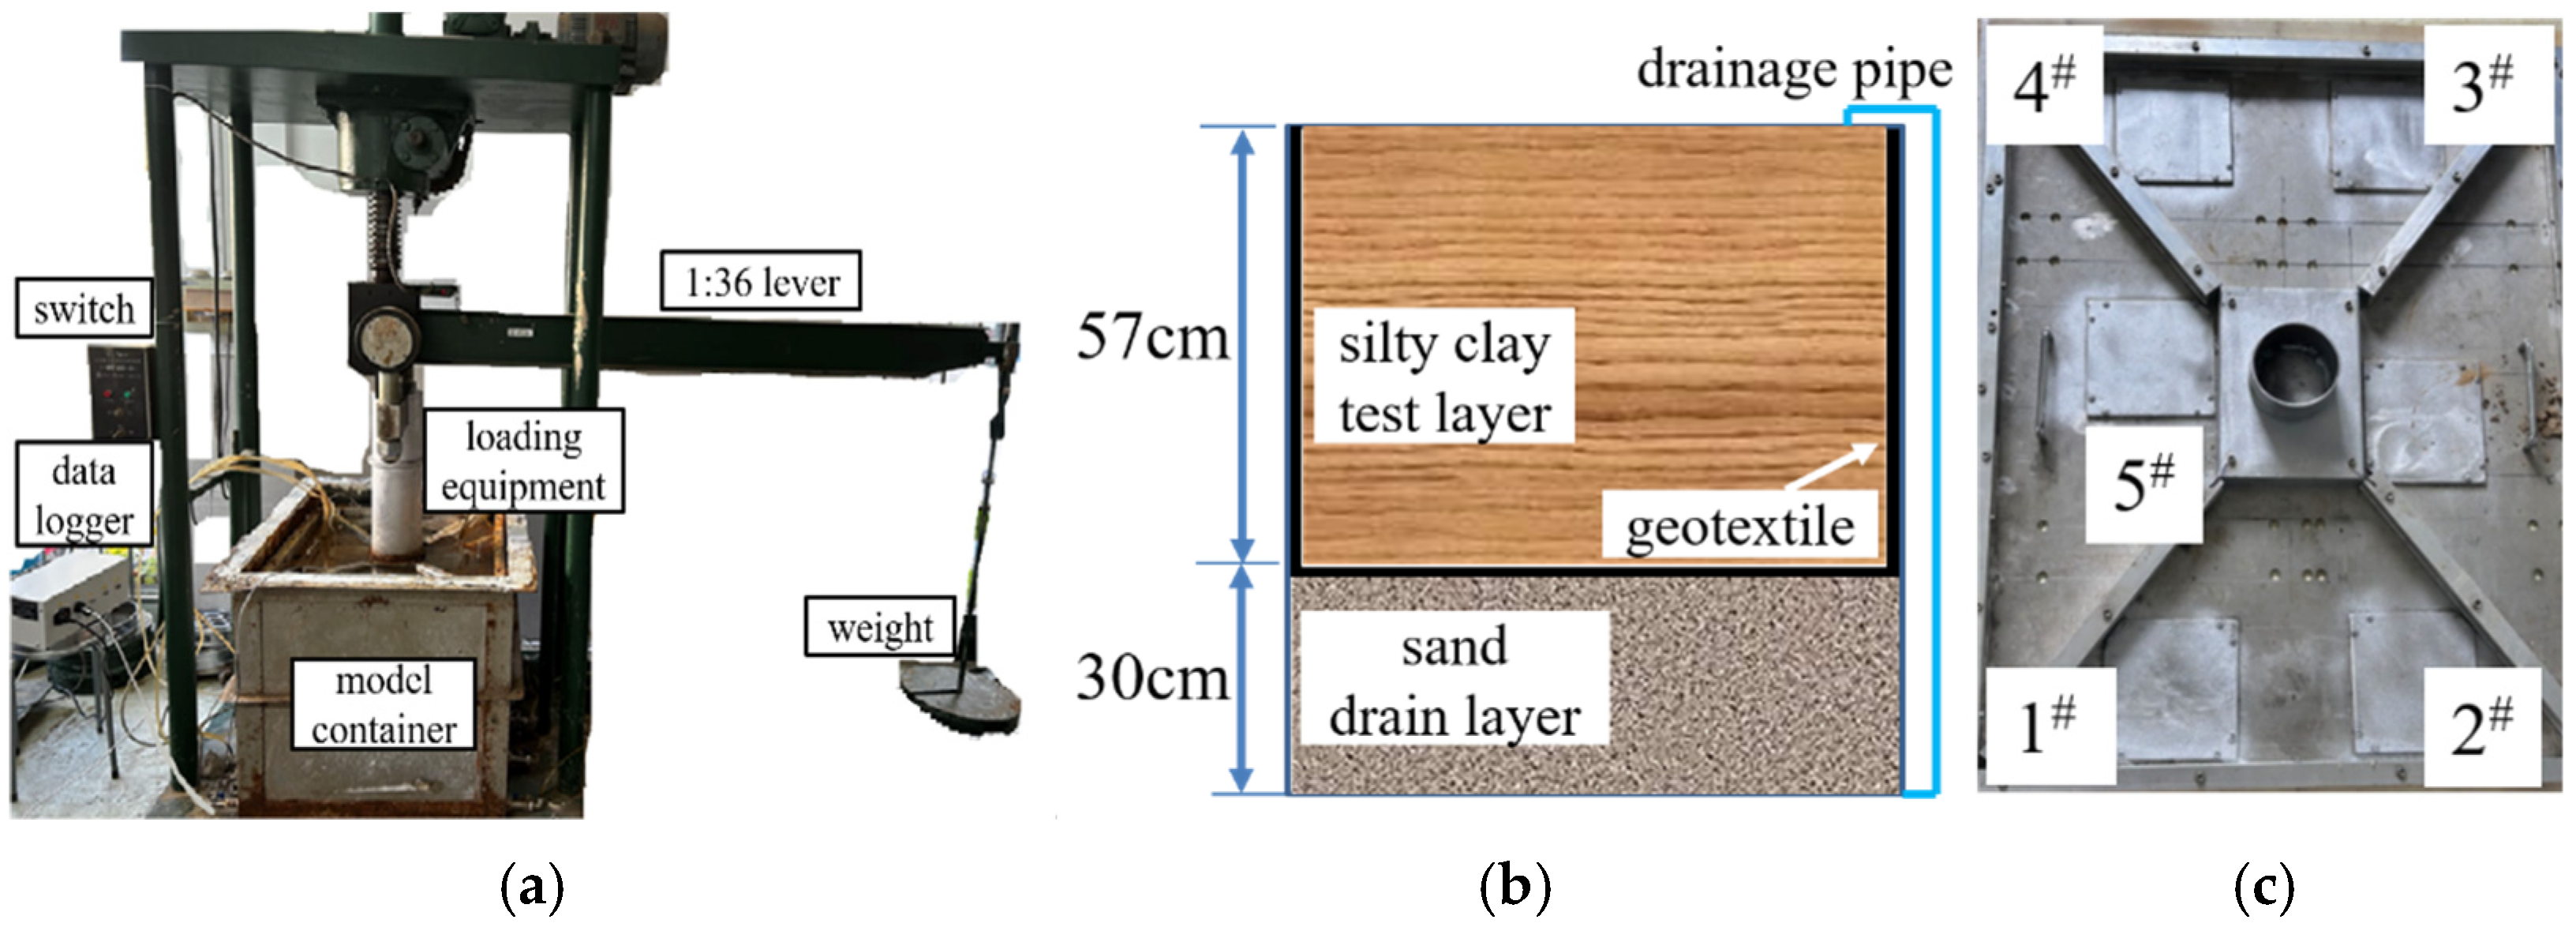
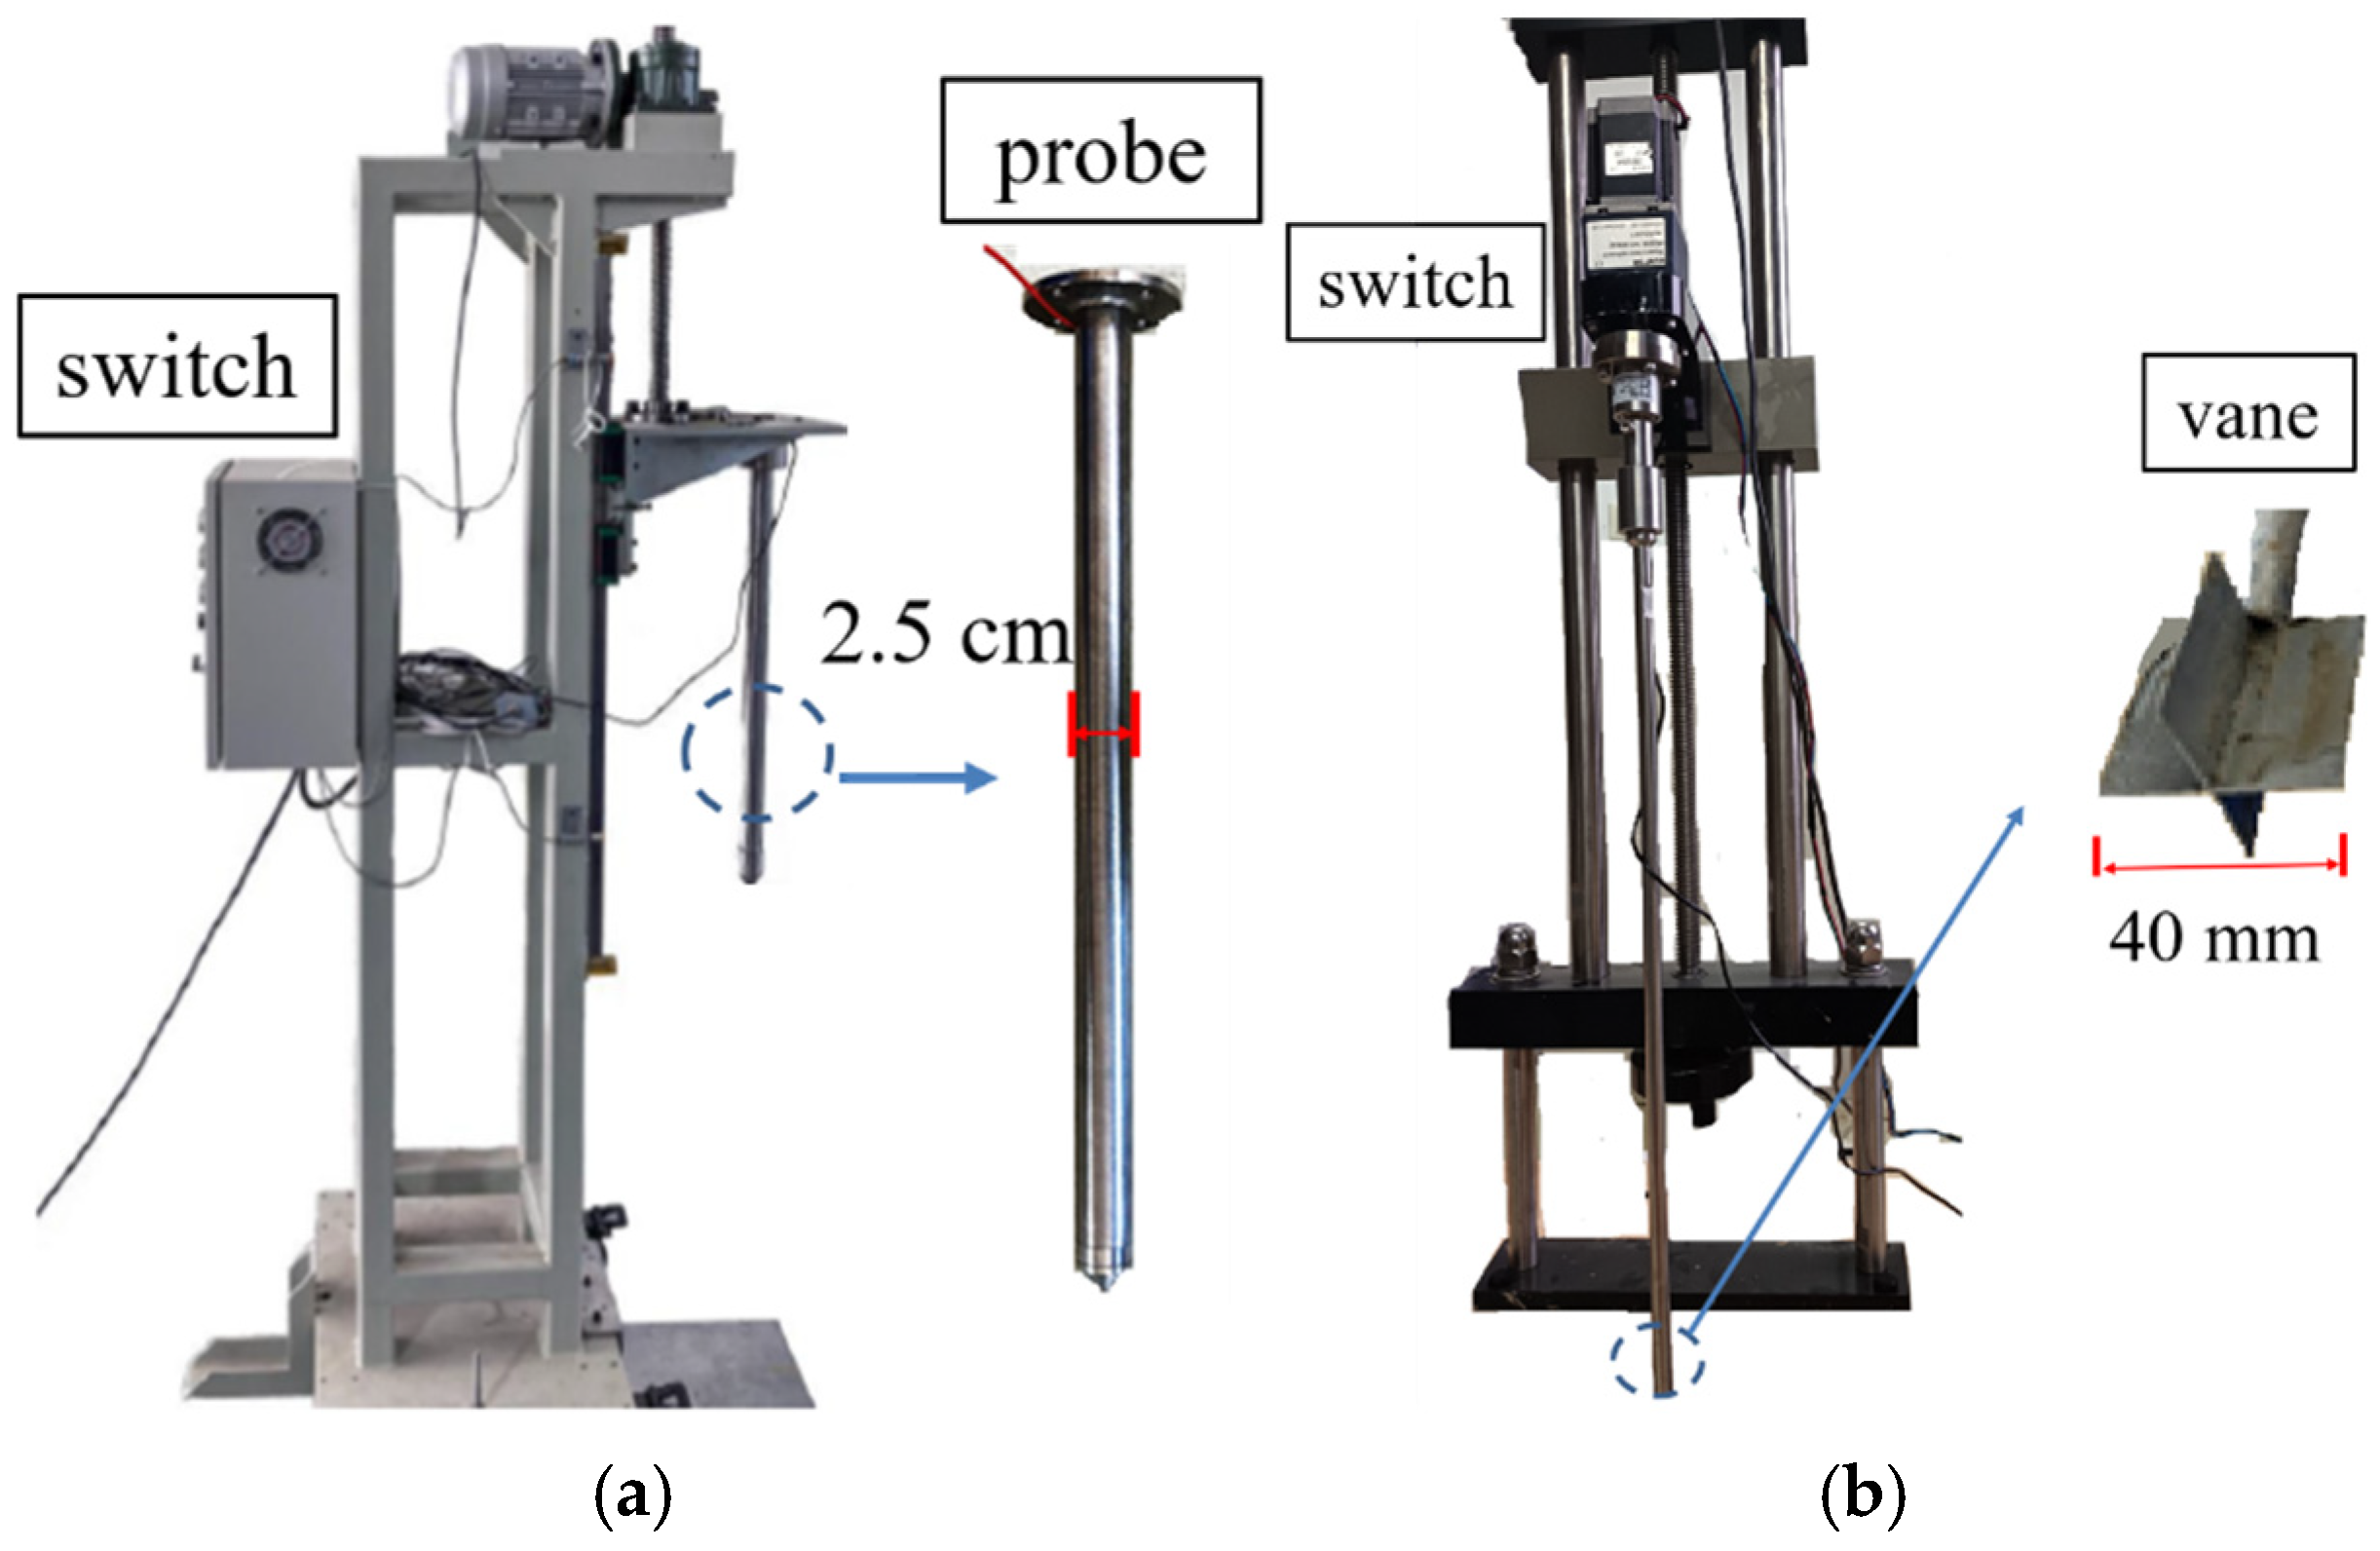
2.2. Test Equipment
2.3. Test Protocol and Procedure
3. Test Results
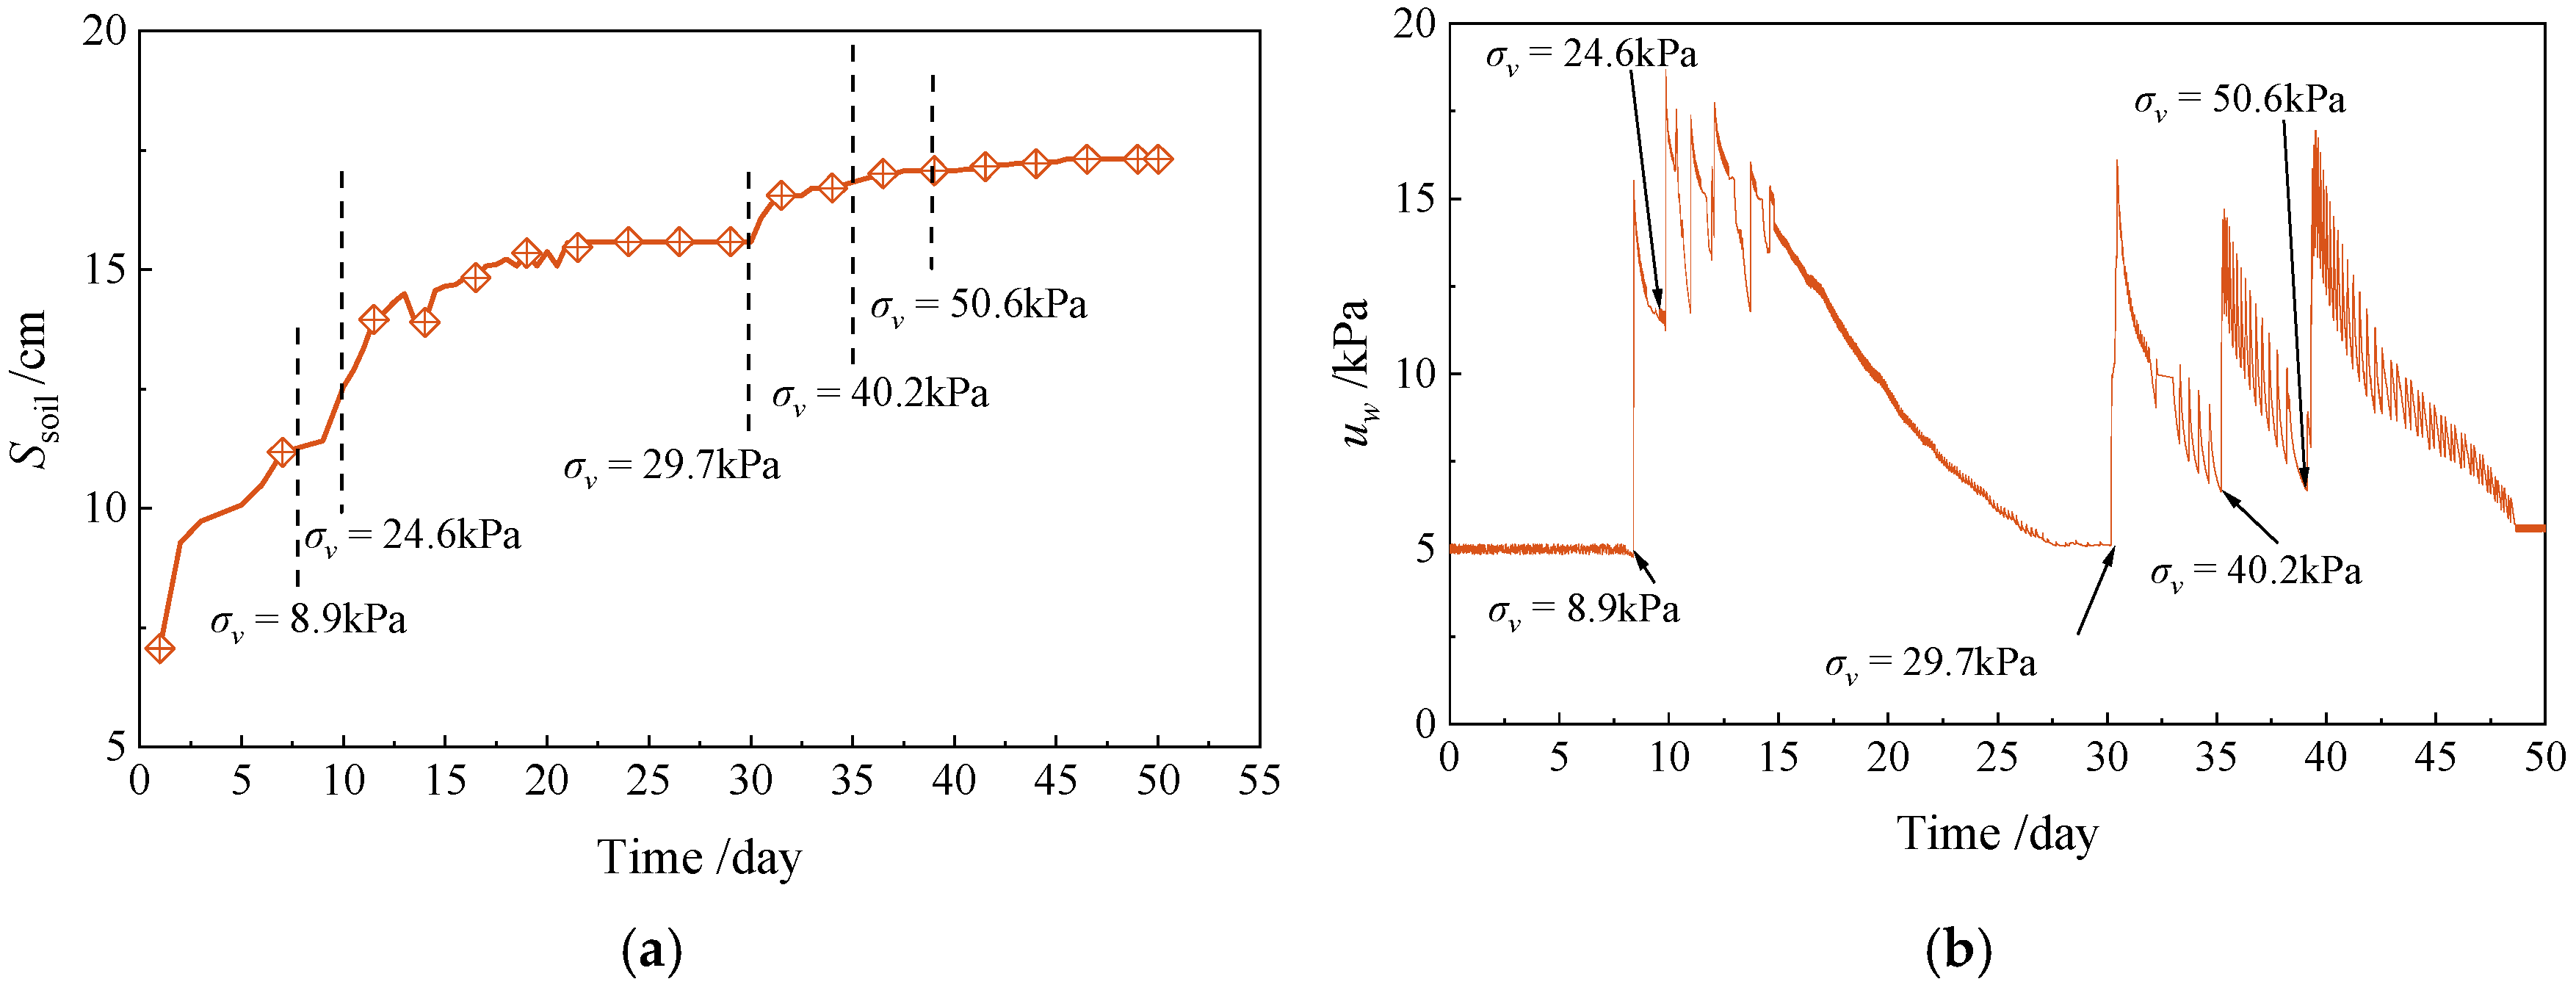
3.1. Soil Mechanical Behavior Monitoring
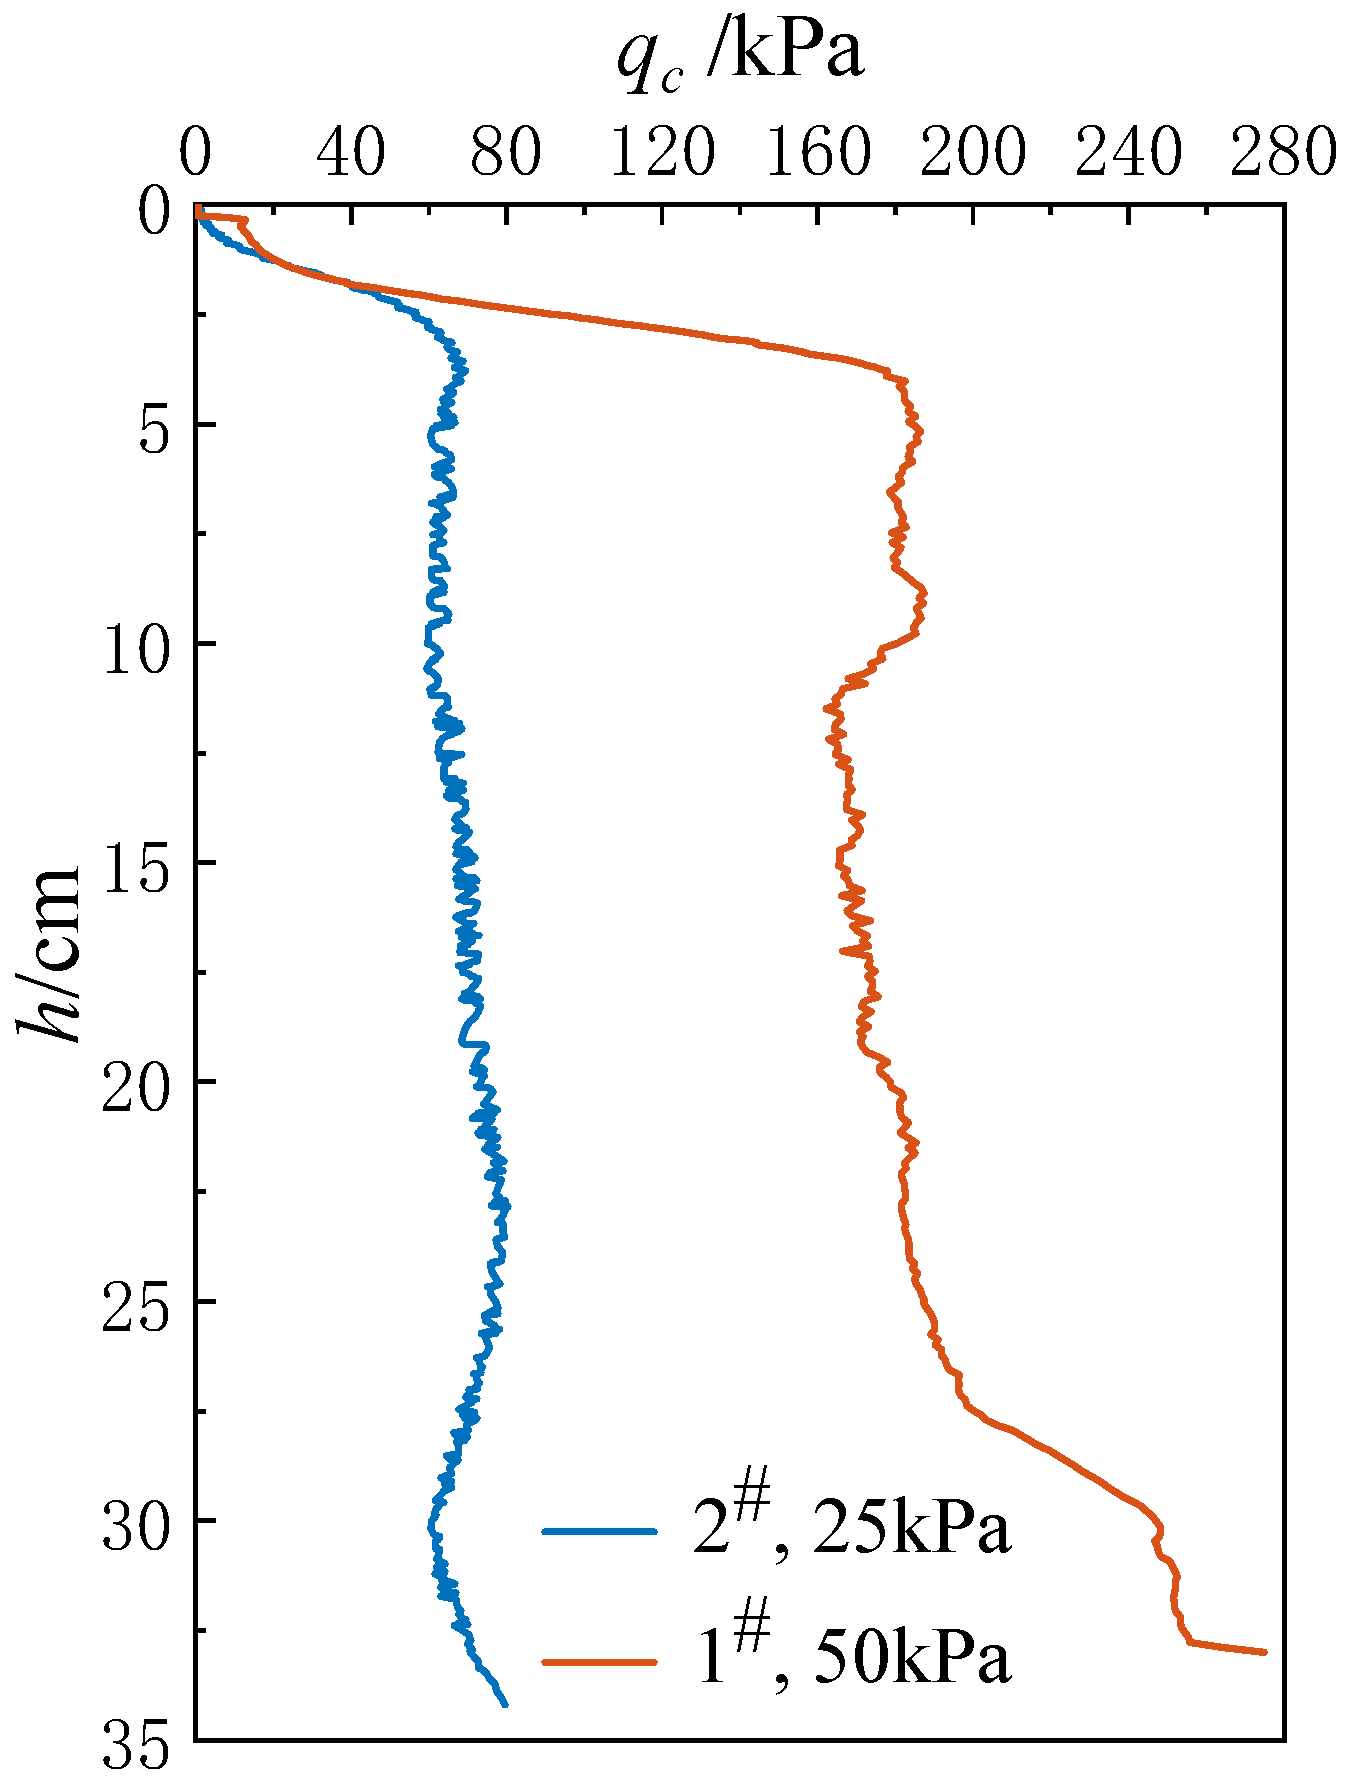
3.2. Cone Penetration Test Results
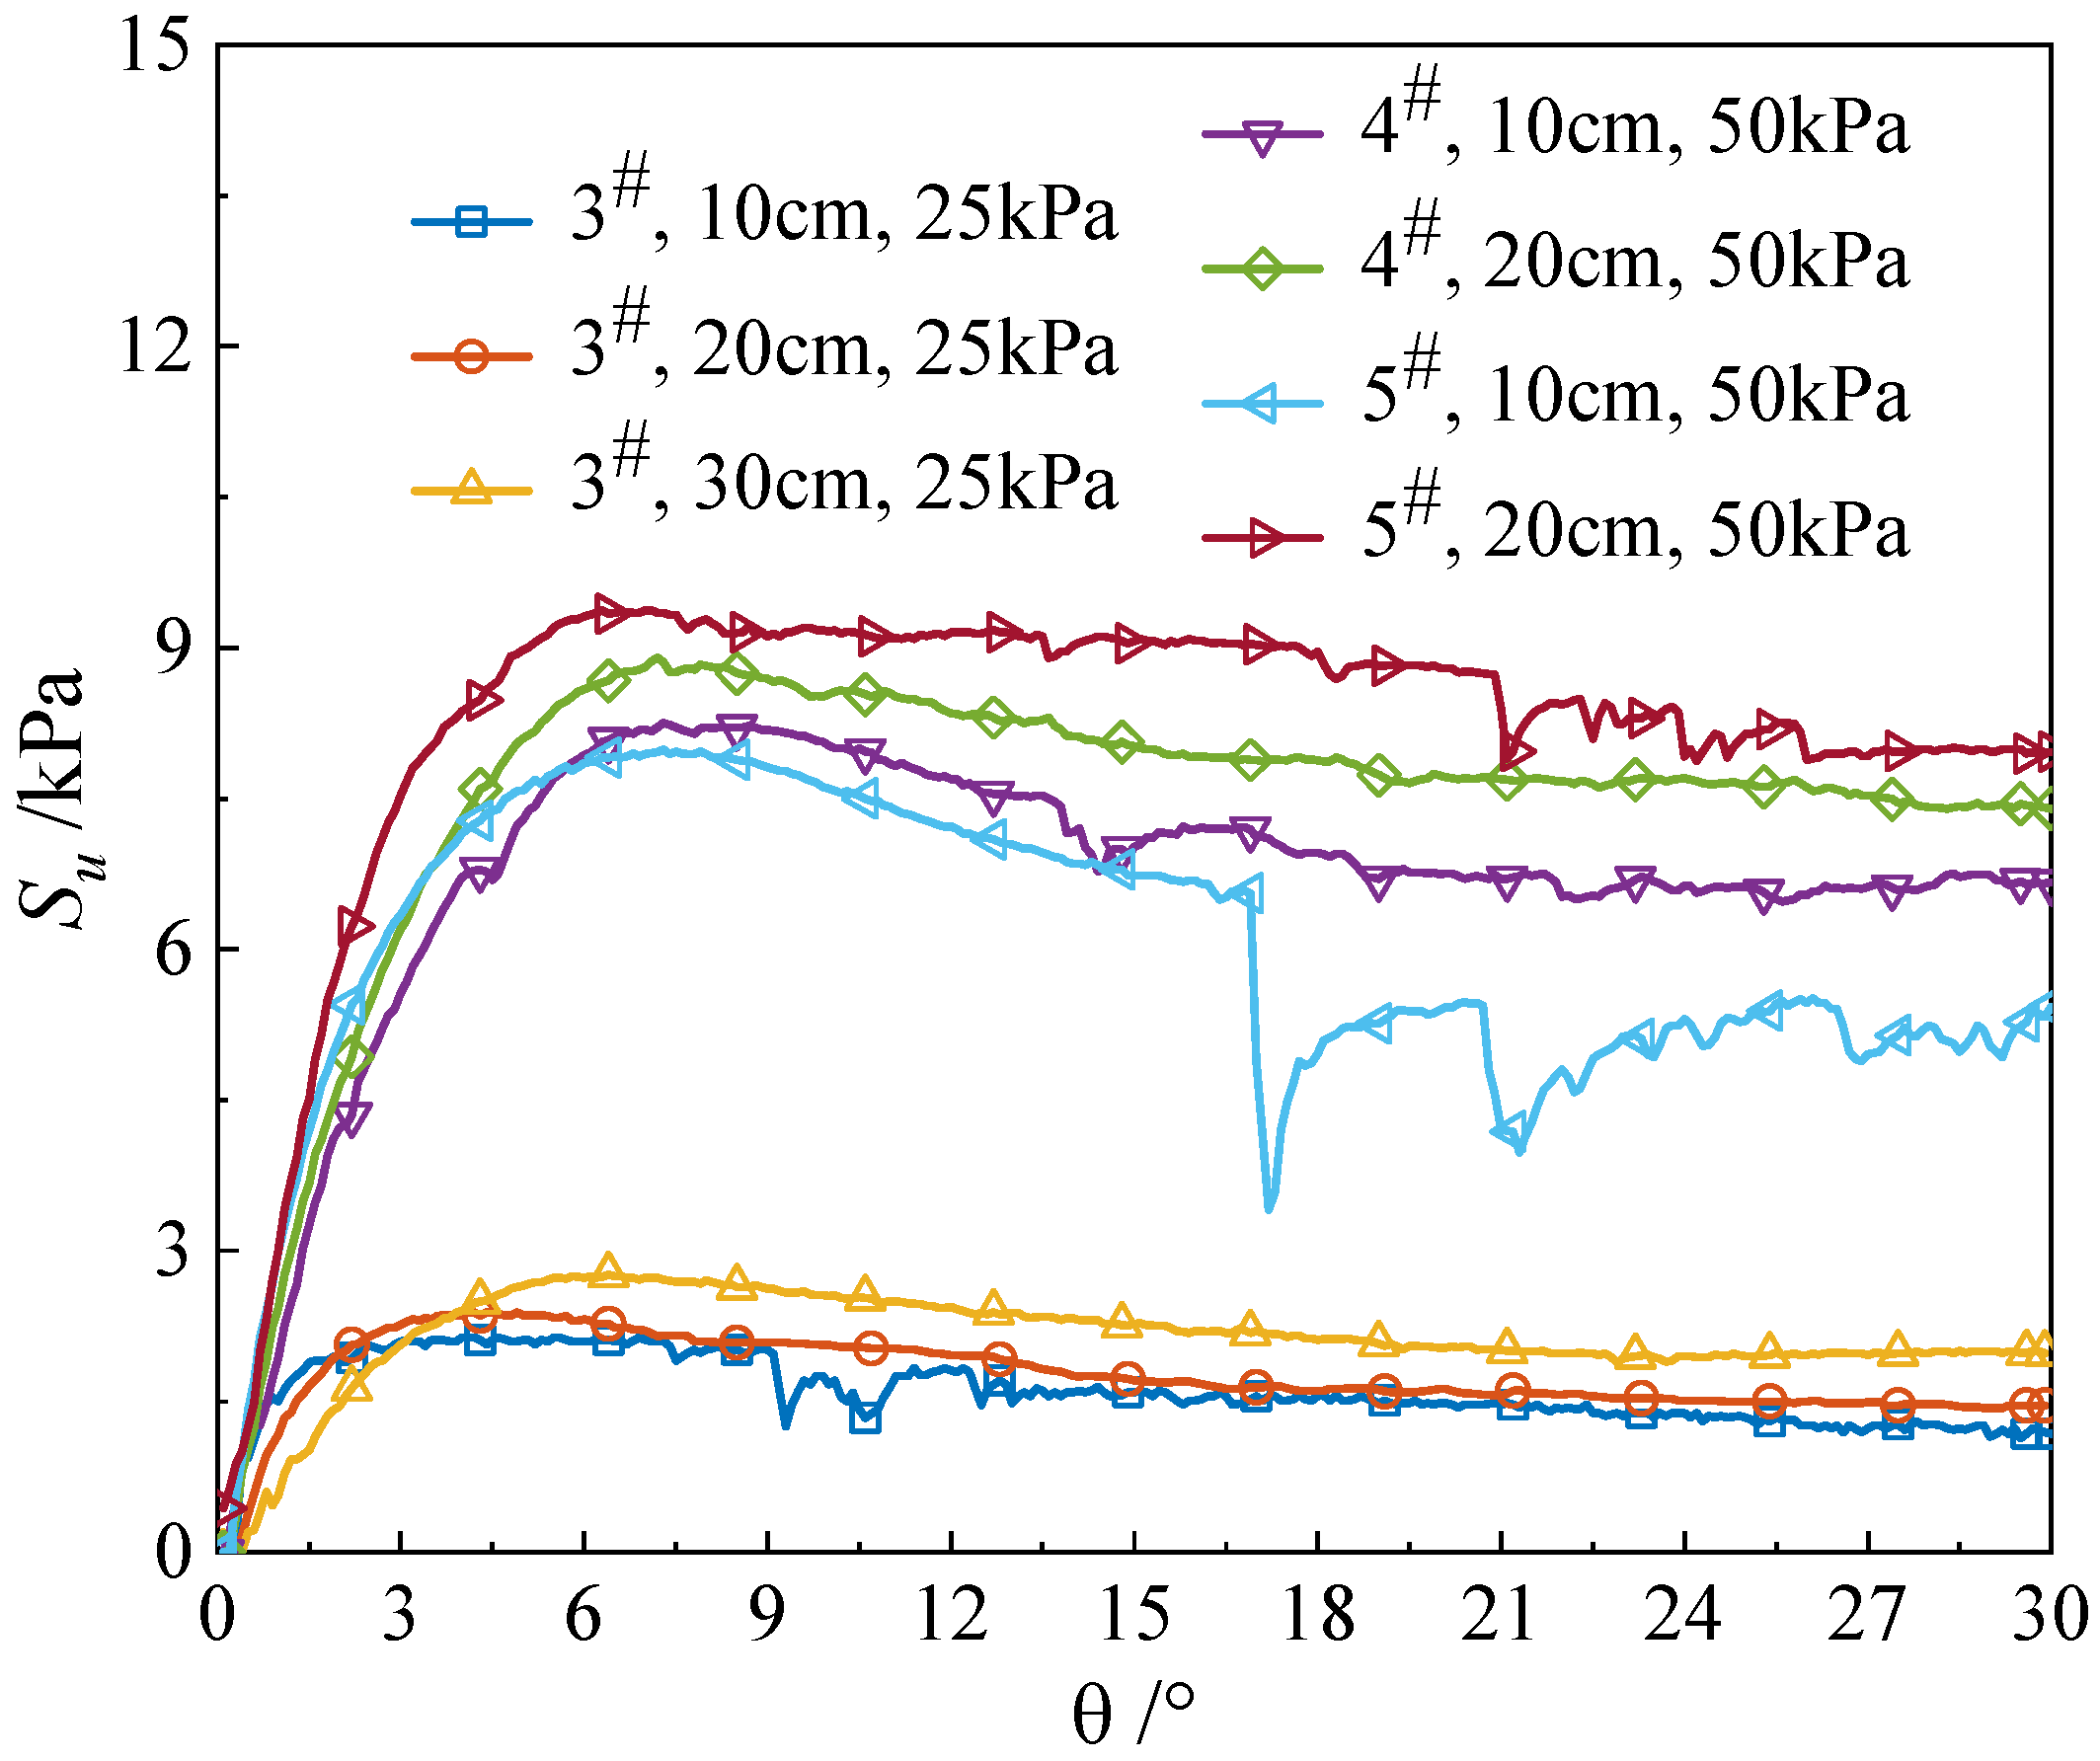
3.3. Vane Shear Test Results
3.4. Cone Tip Coefficient Analysis
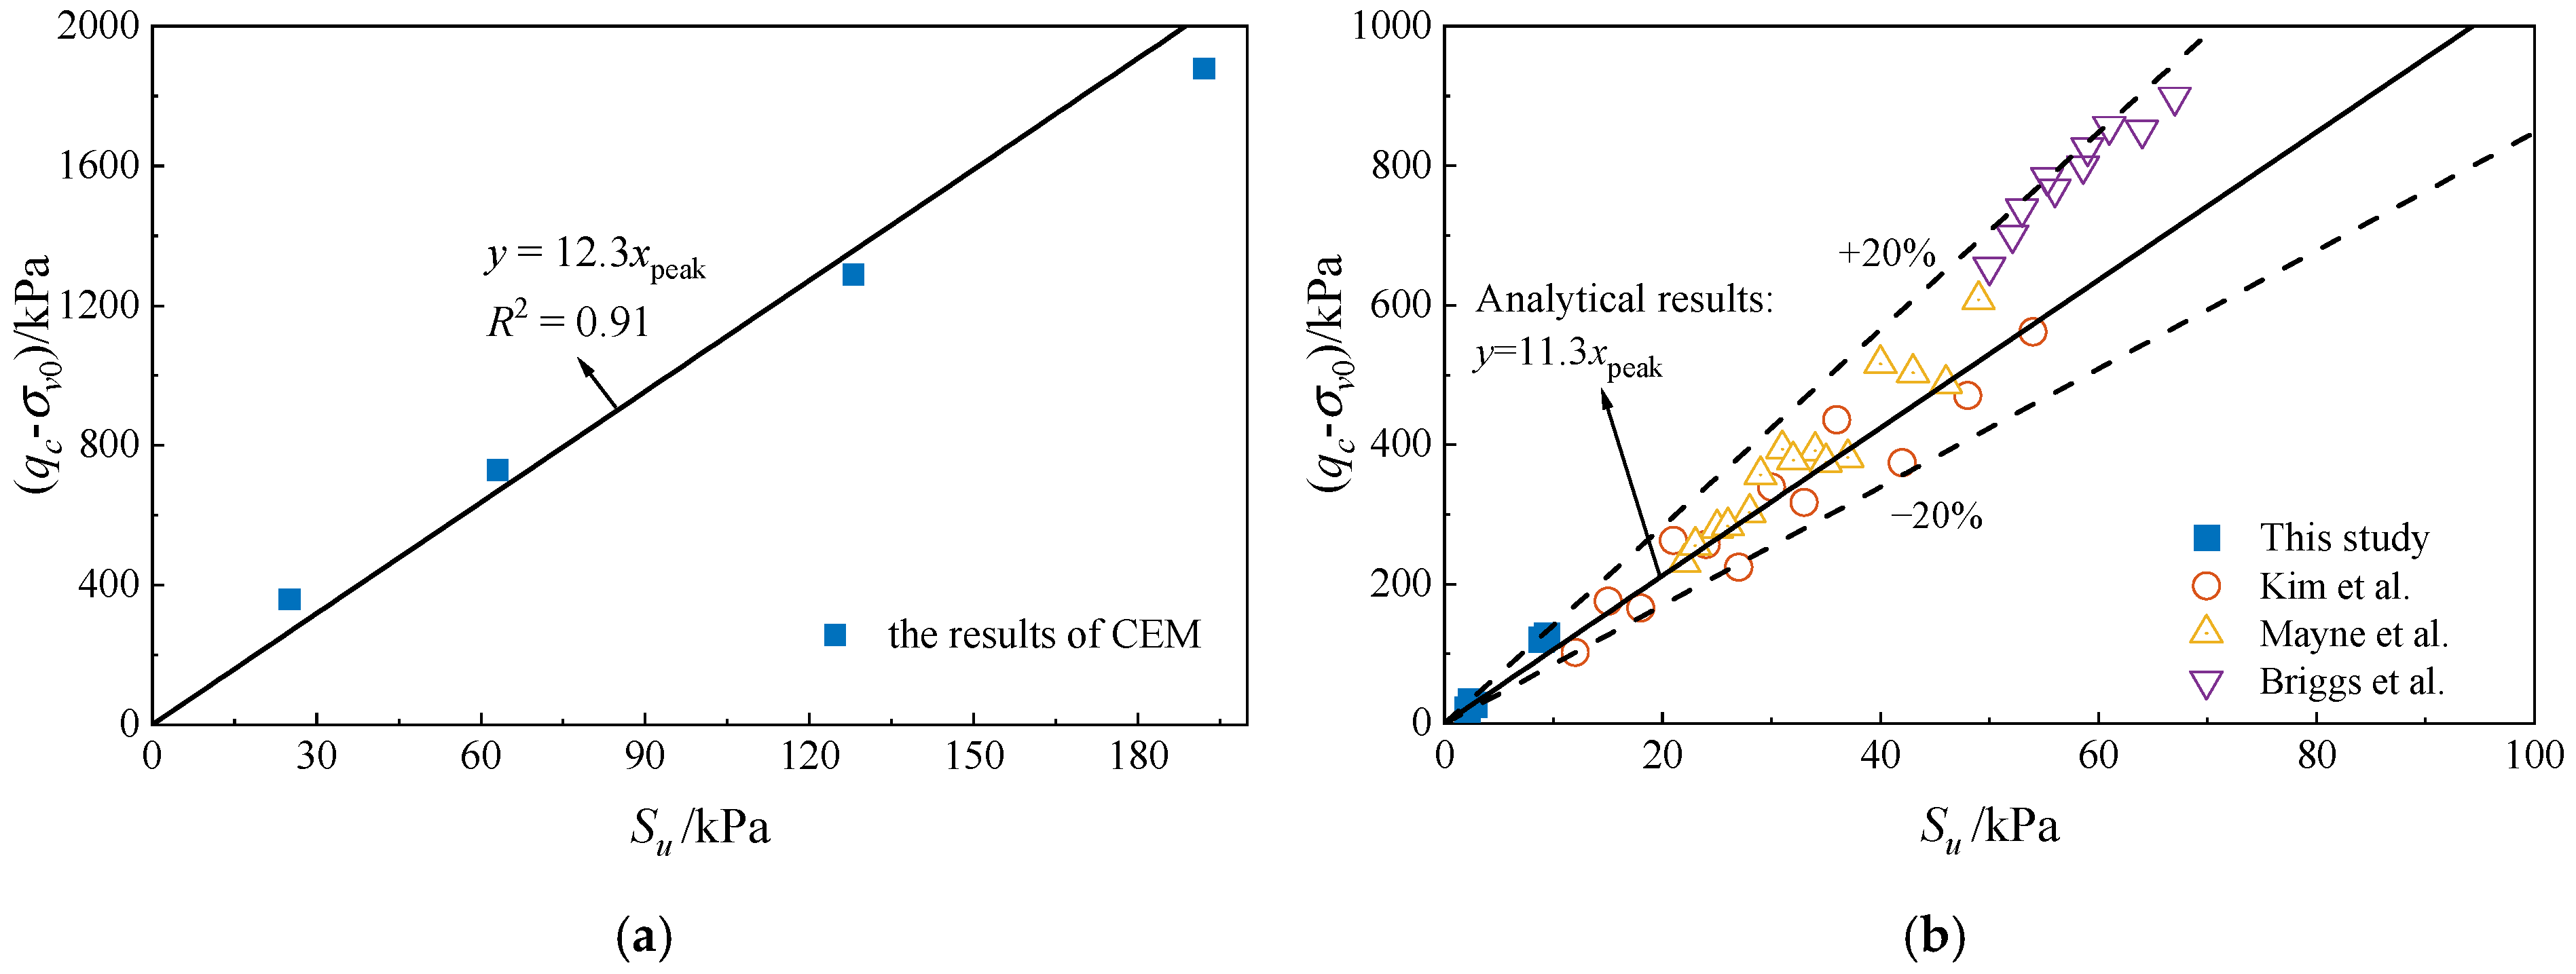
3.5. Comparison of Laboratory Nk with Cavity Expansion Method
4. Field Measurement Results
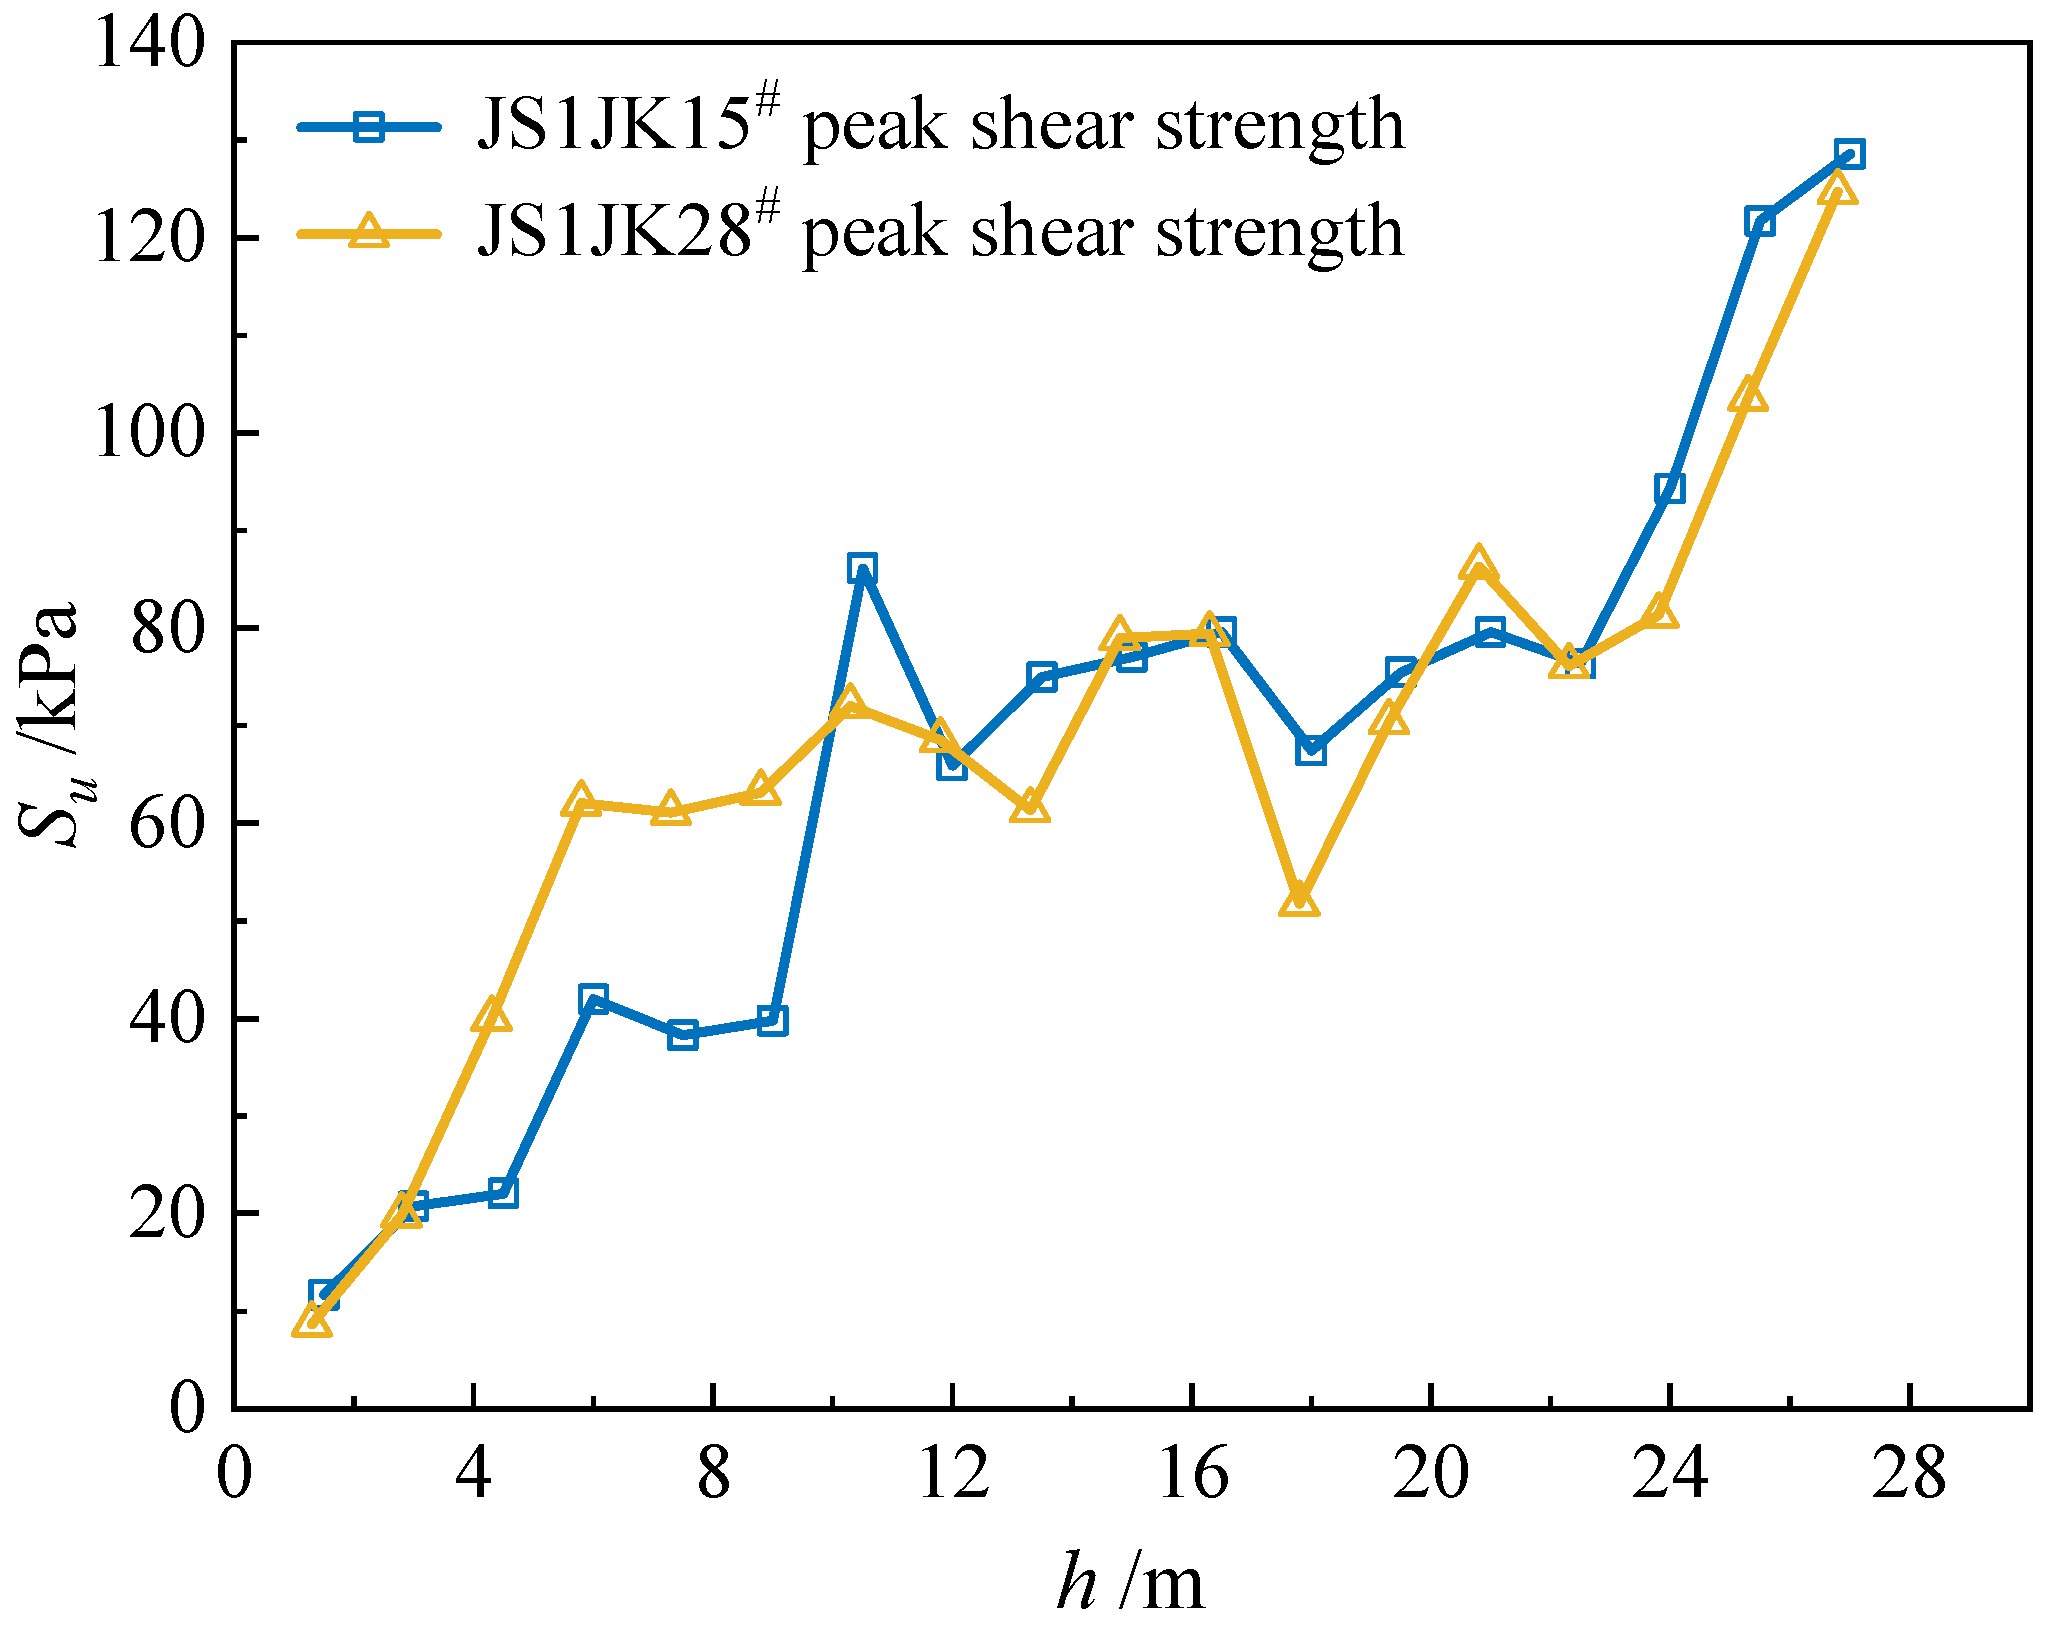
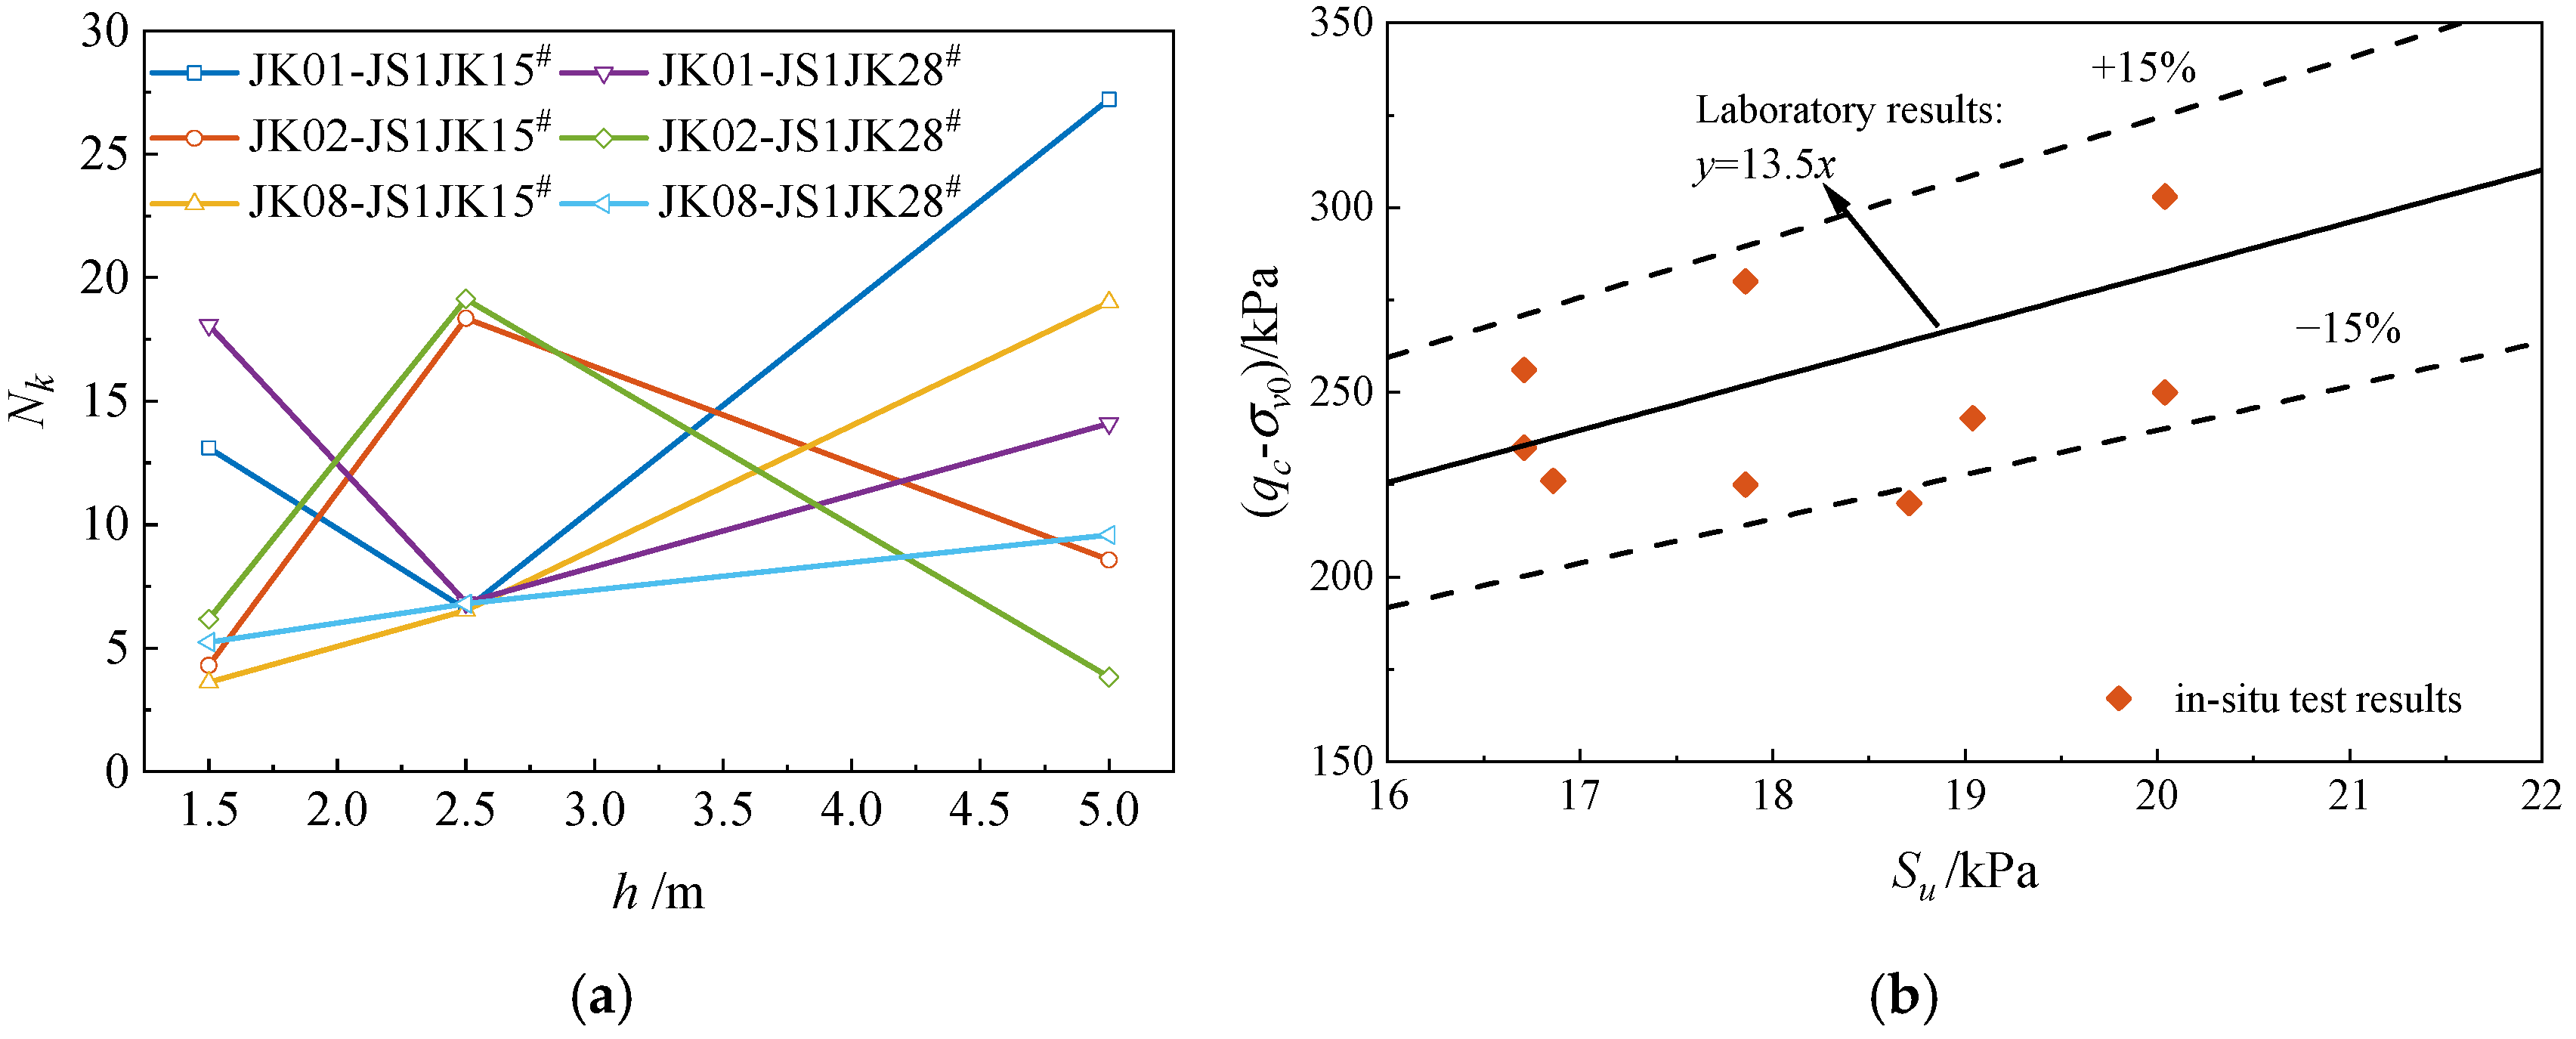
4.1. The Results of In Situ Tests
4.2. Cone Factor Evaluation
5. Discussion
6. Conclusions
- Nk determination combines the cavity expansion method and laboratory tests. The cavity method, incorporating soil shear strength and soil–cone interaction kinematics, yields Nk values aligning with laboratory tests. This consistency confirms the reliability of both approaches: the theoretical simulation of axial-radial stress complements the experimental replication of directional penetration effects, enhancing Nk accuracy.
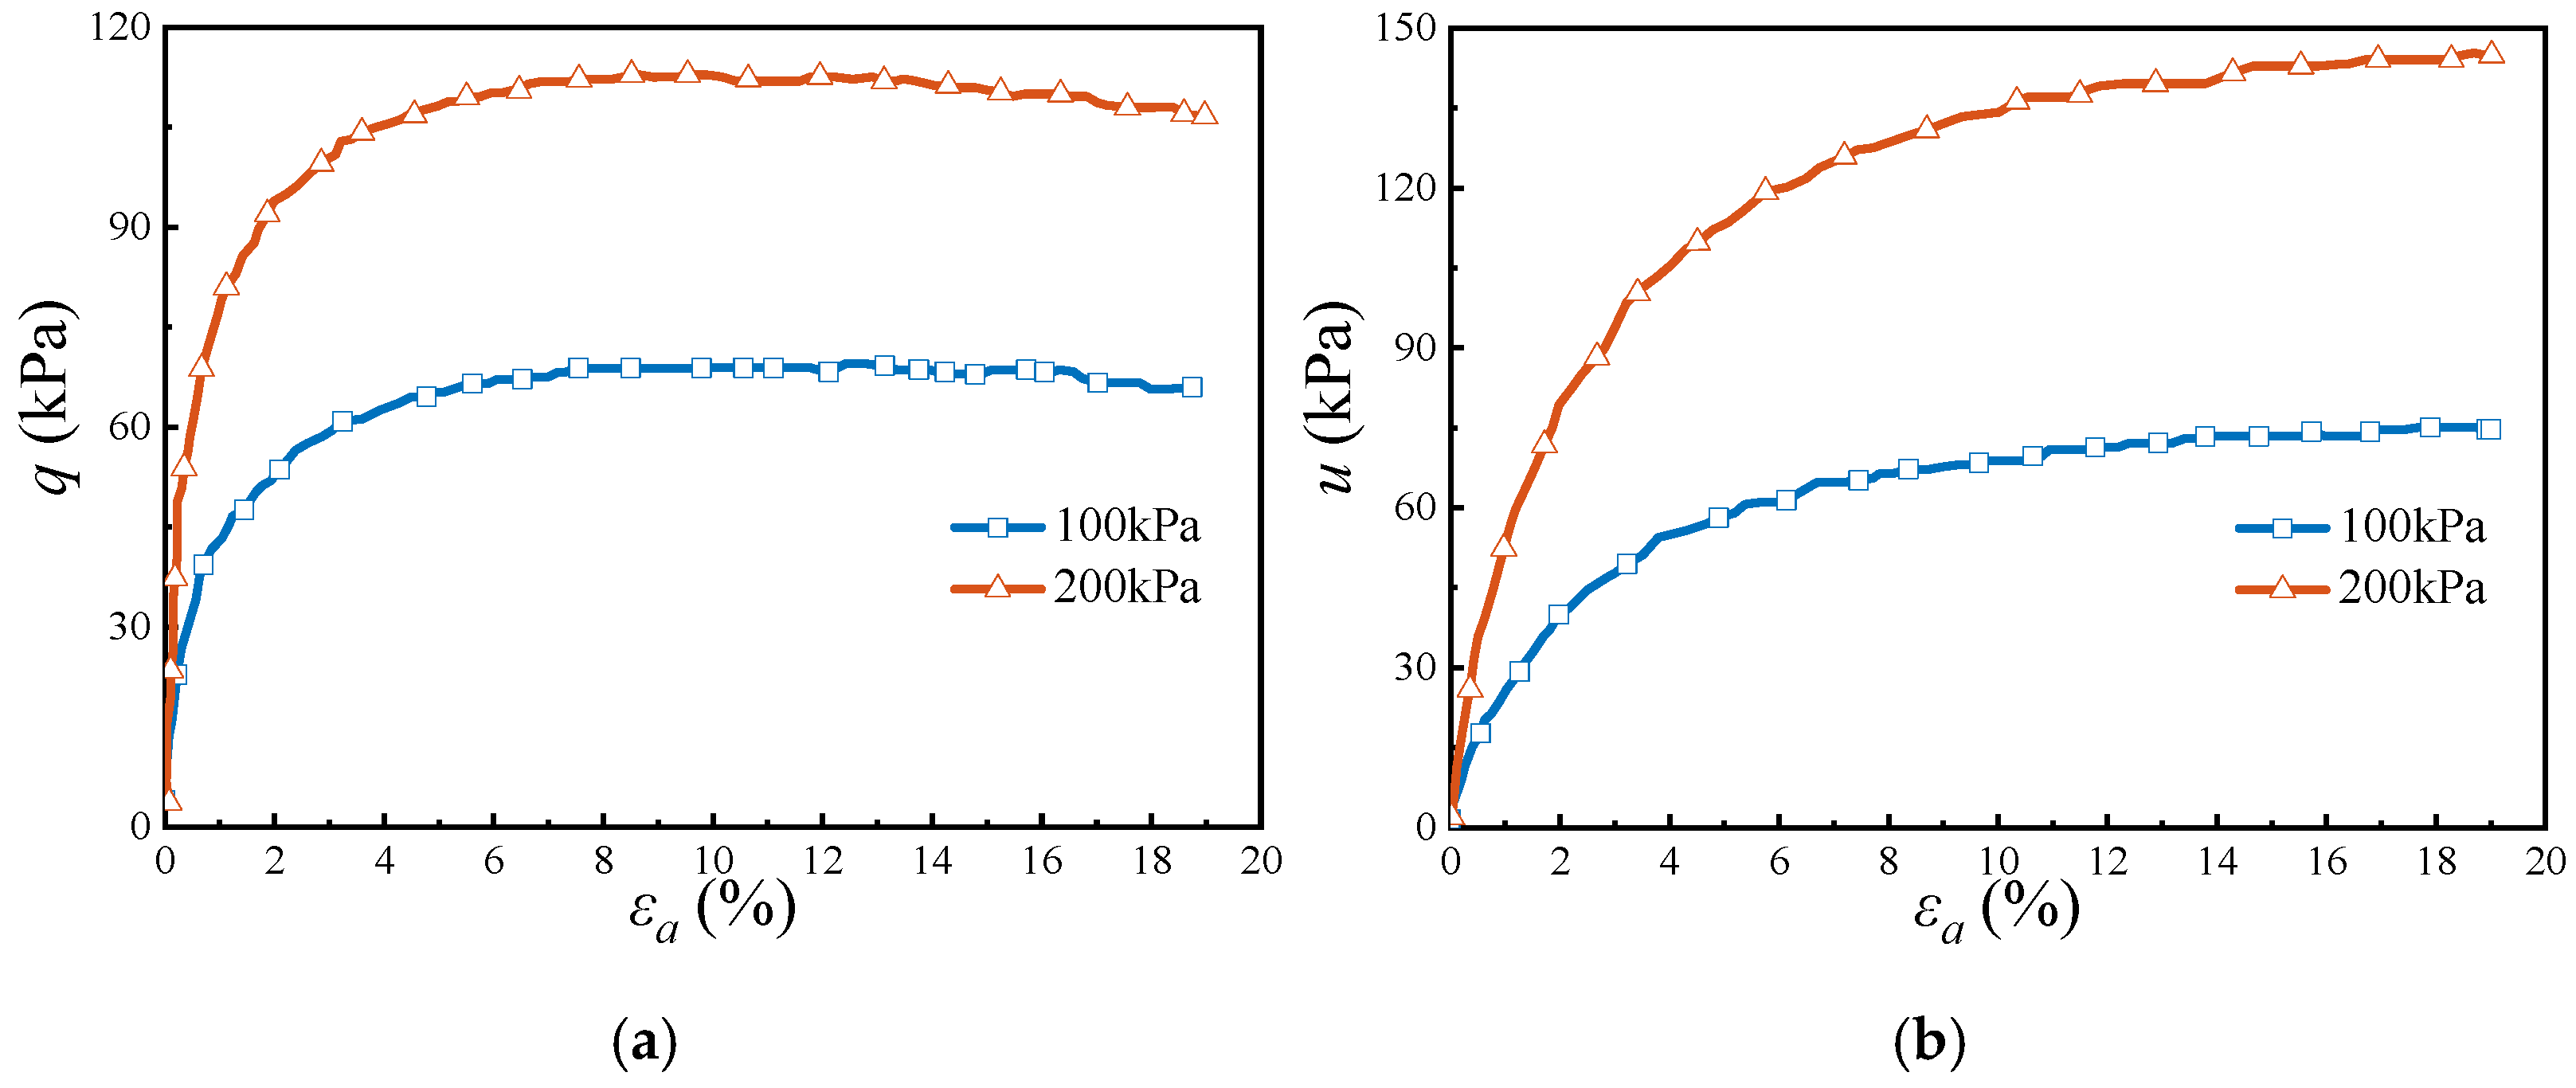
- Laboratory tests show that cone tip resistance qc and undrained shear strength Su increase with overburden stress, with the effective stress principle governing cohesive soil. The ratio of Nk values corresponding to peak strength in in situ and laboratory tests is 0.91, suggesting that Nk values from laboratory tests can reliably calculate Su for silty clay.
- For the silty clay in third layer, the Nk values from laboratory model tests are comparable to those from in situ tests. The predicted shear strength at various depths based on laboratory Nk values differs from in situ measurements within ±30%. This shows that laboratory tests can reliably estimate in situ soil shear strength and support engineering investigations effectively.
Author Contributions
Funding
Institutional Review Board Statement
Informed Consent Statement
Data Availability Statement
Conflicts of Interest
References
- Higgins, P.; Foley, A. The evolution of offshore wind power in the United Kingdom. Renew. Sustain. Energy Rev. 2014, 37, 599–612. [Google Scholar] [CrossRef]
- Soares-Ramos, E.P.; de Oliveira-Assis, L.; Sarrias-Mena, R.; Fernández-Ramírez, L.M. Current status and future trends of offshore wind power in Europe. Energy 2020, 202, 117787. [Google Scholar] [CrossRef]
- Arshad, M.; O’Kelly, B.C. Offshore Wind-Turbine Structures: A Review. Proc. Inst. Civ. Eng. Energy 2013, 166, 139–152. [Google Scholar] [CrossRef]
- Enevoldsen, P.; Valentine, S.V. Do Onshore and Offshore Wind Farm Development Patterns Differ? Energy Sustain. Dev. 2016, 35, 41–51. [Google Scholar] [CrossRef]
- Oh, K.Y.; Nam, W.; Ryu, M.S.; Kim, J.Y.; Epureanu, B.I. A Review of Foundations of Offshore Wind Energy Convertors: Current Status and Future Perspectives. Renew. Sustain. Energy Rev. 2018, 88, 16–36. [Google Scholar] [CrossRef]
- Wu, X.; Hu, Y.; Li, Y.; Yang, J.; Duan, L.; Wang, T.; Liao, S. Foundations of Offshore Wind Turbines: A Review. Renew. Sustain. Energy Rev. 2019, 104, 379–393. [Google Scholar] [CrossRef]
- Scott, C.R. Soil Mechanics and Foundations; Applied Science Publishers: London, UK, 1980. [Google Scholar]
- Rowe, R.K.; Li, A.L. Geosynthetic-Reinforced Embankments over Soft Foundations. Geosynth. Int. 2005, 12, 50–85. [Google Scholar] [CrossRef]
- Greig, J.W. Estimating Undrained Shear Strength of Clay from Cone Penetration Tests; University of British Columbia: Vancouver, BC, Canada, 1985. [Google Scholar]
- Mayne, P.W.; Kulhawy, F.H. Calibration Chamber Data Base and Boundary Effects Correction for CPT Data. In Proceedings of the First International Symposium on Calibration Chamber Testing, Potsdam, NY, USA, 28–29 June 1991; pp. 257–264. [Google Scholar]
- Schneider, J.A.; Xu, X.; Lehane, B.M. Database Assessment of CPT-Based Design Methods for Axial Capacity of Driven Piles in Siliceous Sands. J. Geotech. Geoenviron. Eng. 2008, 134, 1227–1244. [Google Scholar] [CrossRef]
- Das, B.M.; Sivakugan, N. Principles of Foundation Engineering; Cengage Learning: Boston, MA, USA, 2018. [Google Scholar]
- Ismail, H.A.; Zein, A.K.M. Prediction of Undrained Shear Strength and SPT Using the Static CPT Data. In Proceedings of the 9th Regional African Conference on SMFE, Lagos, Nigeria, 11–12 December 1987; pp. 185–192. [Google Scholar]
- Abdel Rahman, I. Correlation of Cone Resistance with Undrained Shear Strength for Clay Soils. Master’s Thesis, Universiti Teknologi Malaysia, Johor Bahru, Malaysia, 2007. [Google Scholar]
- Kim, C.; Kim, S.; Lee, J. Estimating Clay Undrained Shear Strength Using CPTu Results. Proc. Inst. Civil Eng. Geotec. 2009, 162, 119–127. [Google Scholar] [CrossRef]
- Chen, C. Evaluating Undrained Shear Strength of Klang Clay from Cone Penetration Test. In Proceedings of the International Conference on In-situ Measurement of Soil Properties and Case Histories, Bali, Indonesia, 21–24 May 2001. [Google Scholar]
- Gebreselassie, B. Experimental, Analytical and Numerical Investigations of Excavations in Normally Consolidated Soft Soils; Kassel University Press: Kassel, Germany, 2003. [Google Scholar]
- Rémai, Z. Correlation of Undrained Shear Strength and CPT Resistance. Period. Polytech. Civ. Eng. 2013, 57, 39–44. [Google Scholar] [CrossRef]
- Otoko, G.R.; Manuel, I.F.; Igwagu, M.; Edoh, C. Empirical Cone Factor for Estimation of Undrained Shear Strength. Electron. J. Geotech. Eng. 2016, 21, 6069–6076. [Google Scholar]
- Kim, K.K.; Prezzi, M.; Salgado, R. Interpretation of Cone Penetration Tests in Cohesive Soils. J. Geotech. Geoenviron. Eng. 2006, 132, 1–10. [Google Scholar]
- Hossain, M.I. Evaluation of Undrained Shear Strength and Soil Classification from Cone Penetration Test; Louisiana State University and Agricultural & Mechanical College: Baton Rouge, LA, USA, 2018. [Google Scholar]
- Terzaghi, K.; Peck, R.B.; Mesri, G. Soil Mechanics in Engineering Practice; John Wiley & Sons: New York, NY, USA, 1996. [Google Scholar]
- Yu, H.S.; Herrmann, L.R.; Boulanger, R.W. Analysis of Steady Cone Penetration in Clay. J. Geotech. Geoenviron. Eng. 2000, 126, 594–605. [Google Scholar] [CrossRef]
- Yi, J.T.; Goh, S.H.; Lee, F.H.; Randolph, M.F. A Numerical Study of Cone Penetration in Fine-Grained Soils Allowing for Consolidation Effects. Geotechnique 2012, 62, 707–719. [Google Scholar] [CrossRef]
- Lu, Q.; Randolph, M.F.; Hu, Y.; Bugarski, I.C. A Numerical Study of Cone Penetration in Clay. Geotechnique 2004, 54, 257–267. [Google Scholar] [CrossRef]
- Sheng, D.; Cui, L.; Ansari, Y. Interpretation of Cone Factor in Undrained Soils via Full-Penetration Finite-Element Analysis. Int. J. Geomech. 2013, 13, 745–753. [Google Scholar] [CrossRef]
- Hauser, L.; Schweiger, H.F. Numerical Study on Undrained Cone Penetration in Structured Soil Using G-PFEM. Comput. Geotech. 2021, 133, 104061. [Google Scholar] [CrossRef]
- Lefebvre, G.; Poulin, C. A New Method of Sampling in Sensitive Clay. Can. Geotech. J. 1979, 16, 226–233. [Google Scholar] [CrossRef]
- Tan, K.H. Soil Sampling, Preparation, and Analysis; CRC Press: Boca Raton, FL, USA, 2005. [Google Scholar]
- Pineda, J.A.; Liu, X.F.; Sloan, S.W. Effects of Tube Sampling in Soft Clay: A Microstructural Insight. Geotechnique 2016, 66, 969–983. [Google Scholar] [CrossRef]
- Shirazi, M.A.; Boersma, L. A Unifying Quantitative Analysis of Soil Texture. Soil Sci. Soc. Am. J. 1984, 48, 142–147. [Google Scholar] [CrossRef]
- Saxton, K.E.; Rawls, W.; Romberger, J.S.; Papendick, R.I. Estimating Generalized Soil-Water Characteristics from Texture. Soil Sci. Soc. Am. J. 1986, 50, 1031–1036. [Google Scholar] [CrossRef]
- ASTM D937-07; Test Method for Cone Penetration of Petrolatum. ASTM: West Conshohocken, PA, USA, 2019.
- ASTM D2573; Standard Test Method for Field Vane Shear Test in Saturated Fine-Grained Soils. ASTM: West Conshohocken, PA, USA, 2015.
- JTG 3430-2020; Test Methods of Soils for Highway Engineering. People’s Communications Press Co., Ltd.: Beijing, China, 2021.
- O’Kelly, B.C.; Vardanega, P.J.; Haigh, S.K. Use of Fall Cones to Determine Atterberg Limits: A Review. Geotechnique 2018, 68, 843–856. [Google Scholar] [CrossRef]
- Zhang, R.; Xiao, Y.P.; Gao, Q.F.; Zheng, J.L. Effect of Adsorbed Water on Compression Behavior of High Liquid Limit Soils. J. Cent. South Univ. 2023, 30, 530–541. [Google Scholar] [CrossRef]
- ASTM D698-07; Standard Test Methods for Laboratory Compaction Characteristics of Soils Using Standard Effort. ASTM: West Conshohocken, PA, USA, 2007.
- Peuchen, J.; Mayne, P. Rate Effects in Vane Shear Testing. In Proceedings of the SUT Offshore Site Investigation and Geotechnics Conference, SUT, London, UK, 11–13 September 2007. [Google Scholar]
- Goughnour, R.D.; Sallberg, J.R. Evaluation of the Laboratory Vane Shear Test. Highw. Res. Rec. 1964, 48, 19–33. [Google Scholar]
- Cabalar, A.F.; Khalaf, M.M.; Isik, H. A Comparative Study on the Undrained Shear Strength Results of Fall Cone and Vane Shear Tests in Sand–Clay Mixtures. Arab. J. Geosci. 2020, 13, 395. [Google Scholar] [CrossRef]
- Cao, L.F.; Teh, C.I.; Chang, M.F. Undrained Cavity Expansion in Modified Cam Clay I: Theoretical Analysis. Geotechnique 2001, 51, 323–334. [Google Scholar] [CrossRef]
- Chang, M.F.; Teh, C.I.; Cao, L.F. Undrained Cavity Expansion in Modified Cam Clay II: Application to the Interpretation of the Piezocone Test. Geotechnique 2002, 52, 307–311. [Google Scholar] [CrossRef]
- Tavenas, F.; Blanchet, R.; Garneau, R.; Leroueil, S. The Stability of Stage-Constructed Embankments on Soft Clays. Can. Geotech. J. 1978, 15, 283–305. [Google Scholar] [CrossRef]
- Ladanyi, B.; Johnston, G.H. Behavior of Circular Footings and Plate Anchors Embedded in Permafrost. Can. Geotech. J. 1974, 11, 531–553. [Google Scholar] [CrossRef]
- Yin, Z.Y.; Hicher, P.Y.; Jin, Y.F. Practice of Constitutive Modelling for Saturated Soils; Springer Nature: Singapore, 2020. [Google Scholar]
- Mayne, P.W.; Peuchen, J. Evaluation of CPTU Nkt Cone Factor for Undrained Strength of Clays. In Cone Penetration Testing 2018; CRC Press: Boca Raton, FL, USA, 2018; pp. 423–429. [Google Scholar]
- Briggs, K.M.; Trinidad González, Y.; Powrie, W.; Butler, S.; Sartain, N. Quantifying CPT Cone Factors in Clays Derived from Weathered Mudstone. Q. J. Eng. Geol. 2024, 57, qjegh2023-014. [Google Scholar] [CrossRef]
- Salgado, R.; Ganju, E.; Prezzi, M. Site Variability Analysis Using Cone Penetration Test Data. Comput. Geotech. 2019, 105, 37–50. [Google Scholar] [CrossRef]
- Salgado, R. Analysis of Penetration Resistance in Sands. Ph.D. Thesis, Department of Civil Engineering, University of California, Berkeley, CA, USA, 1993. [Google Scholar]
- Silver, M.L.; Kiefer, T.A.; Reuter, G.R. Cone Penetration Testing for Geologic, Geotechnical and Environmental Investigations. In Proceedings of the Illinois AEG and ASCE Sections Joint Meeting, Chicago, IL, USA, 12 March 1988. [Google Scholar]
- Finno, R.J. Subsurface Conditions and Pile Installation Data. In Geotechnical Special Publication No. 23: 1989 Foundation Engineering Congress Test Section; ASCE: Reston, VA, USA, 1989. [Google Scholar]


| Soil Type | Source | Characteristics | Nk Range | Reference |
|---|---|---|---|---|
| Silty clay | Sudan | High plastic | 32–39 | Ismail and Zein [13] |
| Clay | Malaysia | High plastic | 12–19 | Abdel Rahman [14] |
| Silty clay | Korea | High plastic, soft marine clay | 7–20 | Kim et al. [15] |
| Clay | Indonesia | Soft clays, high plastic | 5–12 | Chen [16] |
| Clay | Germany | Soft clays | 8–29 | Gebreselassie [17] |
| Clay | Hungary | Soft Holocene clays | 12–32 | Rémai [18] |
| Clay | Niger | Soft to firm saturated clays | 34–57 | Otoko et al. [19] |
| Equation | Reference |
|---|---|
| Terzaghi et al. [22] | |
| Yu et al. [23] | |
| Yi et al. [24] |
| Soil Type | Depth h (m) | Saturated Density γsat (kN·m−3) | Effective Density γʹ (kN·m−3) |
|---|---|---|---|
| Silty clay | 0–7 | 21.55 | 11.74 |
| Sandy silt | 7–20 | 23.32 | 13.51 |
| Silty clay | 20–40 | 22.67 | 12.86 |
| Loading Lever | Weight (kg) | σv0 (kPa) |
|---|---|---|
| 1 | 5 | 3.69 |
| 2 | 10 | 8.91 |
| 3 | 10 | 14.12 |
| 4 | 20 | 24.55 |
| 5 | 10 | 29.76 |
| 6 | 20 | 40.19 |
| 7 | 20 | 50.62 |
| 2# and 3# | 2# and 3# | 2# and 3# | 1# and 4# | 1# and 4# | |
|---|---|---|---|---|---|
| h (cm) | 10 | 20 | 30 | 10 | 20 |
| σv0 (kPa) | 27.2 | 29.2 | 31.3 | 52.2 | 54.2 |
| (kPa) | 26.2 | 27.2 | 28.3 | 51.2 | 52.2 |
| Su (kPa) | 2.1 | 2.4 | 2.7 | 7.9 | 9.4 |
| qc (kPa) | 57.5 | 61.4 | 58.8 | 182.6 | 178.8 |
| Nk | 14.9 | 14.2 | 11.3 | 16.6 | 13.5 |
| P0 (kPa) | Su (kPa) | E (MPa) | ν | c (kPa) | (°) |
|---|---|---|---|---|---|
| 50 | 25 | 4.7 | 0.3 | 8.3 | 30.6 |
| 100 | 63 | 6.8 | 0.3 | 8.3 | 30.6 |
| 200 | 128 | 9.6 | 0.3 | 8.3 | 30.6 |
| 300 | 202 | 11.2 | 0.3 | 8.3 | 30.6 |
| Number | Plane X-Coordinate (m) | Plane Y-Coordinate (m) | Soil Type | Depth (m) | Saturated Density γsat (kN·m−3) | Test |
|---|---|---|---|---|---|---|
| JK01# | 3,394,812.3 | 356,848.8 | Silty clay | 0–7 | 21.55 | CPT |
| JK02# | 3,394,799.5 | 356,902.5 | Silty clay | 0–7 | 22.32 | CPT |
| JK08# | 3,392,216.5 | 357,409.3 | Silty clay | 0–7 | 21.86 | CPT |
| JS1JK15# | 3,389,312.6 | 357,312.6 | Silty clay | 0–7 | 21.12 | VST |
Disclaimer/Publisher’s Note: The statements, opinions and data contained in all publications are solely those of the individual author(s) and contributor(s) and not of MDPI and/or the editor(s). MDPI and/or the editor(s) disclaim responsibility for any injury to people or property resulting from any ideas, methods, instructions or products referred to in the content. |
© 2025 by the authors. Licensee MDPI, Basel, Switzerland. This article is an open access article distributed under the terms and conditions of the Creative Commons Attribution (CC BY) license (https://creativecommons.org/licenses/by/4.0/).
Share and Cite
Wu, C.; Song, Y.; Dai, J.; Li, L.; Gu, X. Calibration of Cone Factor in Cone Penetration Test for Evaluating the Undrained Shear Strength of Silty Clay. Materials 2025, 18, 1283. https://doi.org/10.3390/ma18061283
Wu C, Song Y, Dai J, Li L, Gu X. Calibration of Cone Factor in Cone Penetration Test for Evaluating the Undrained Shear Strength of Silty Clay. Materials. 2025; 18(6):1283. https://doi.org/10.3390/ma18061283
Chicago/Turabian StyleWu, Caihong, Yue Song, Jialin Dai, Lin Li, and Xiaoqiang Gu. 2025. "Calibration of Cone Factor in Cone Penetration Test for Evaluating the Undrained Shear Strength of Silty Clay" Materials 18, no. 6: 1283. https://doi.org/10.3390/ma18061283
APA StyleWu, C., Song, Y., Dai, J., Li, L., & Gu, X. (2025). Calibration of Cone Factor in Cone Penetration Test for Evaluating the Undrained Shear Strength of Silty Clay. Materials, 18(6), 1283. https://doi.org/10.3390/ma18061283