Figure 1.
Refractory brick.
Figure 1.
Refractory brick.
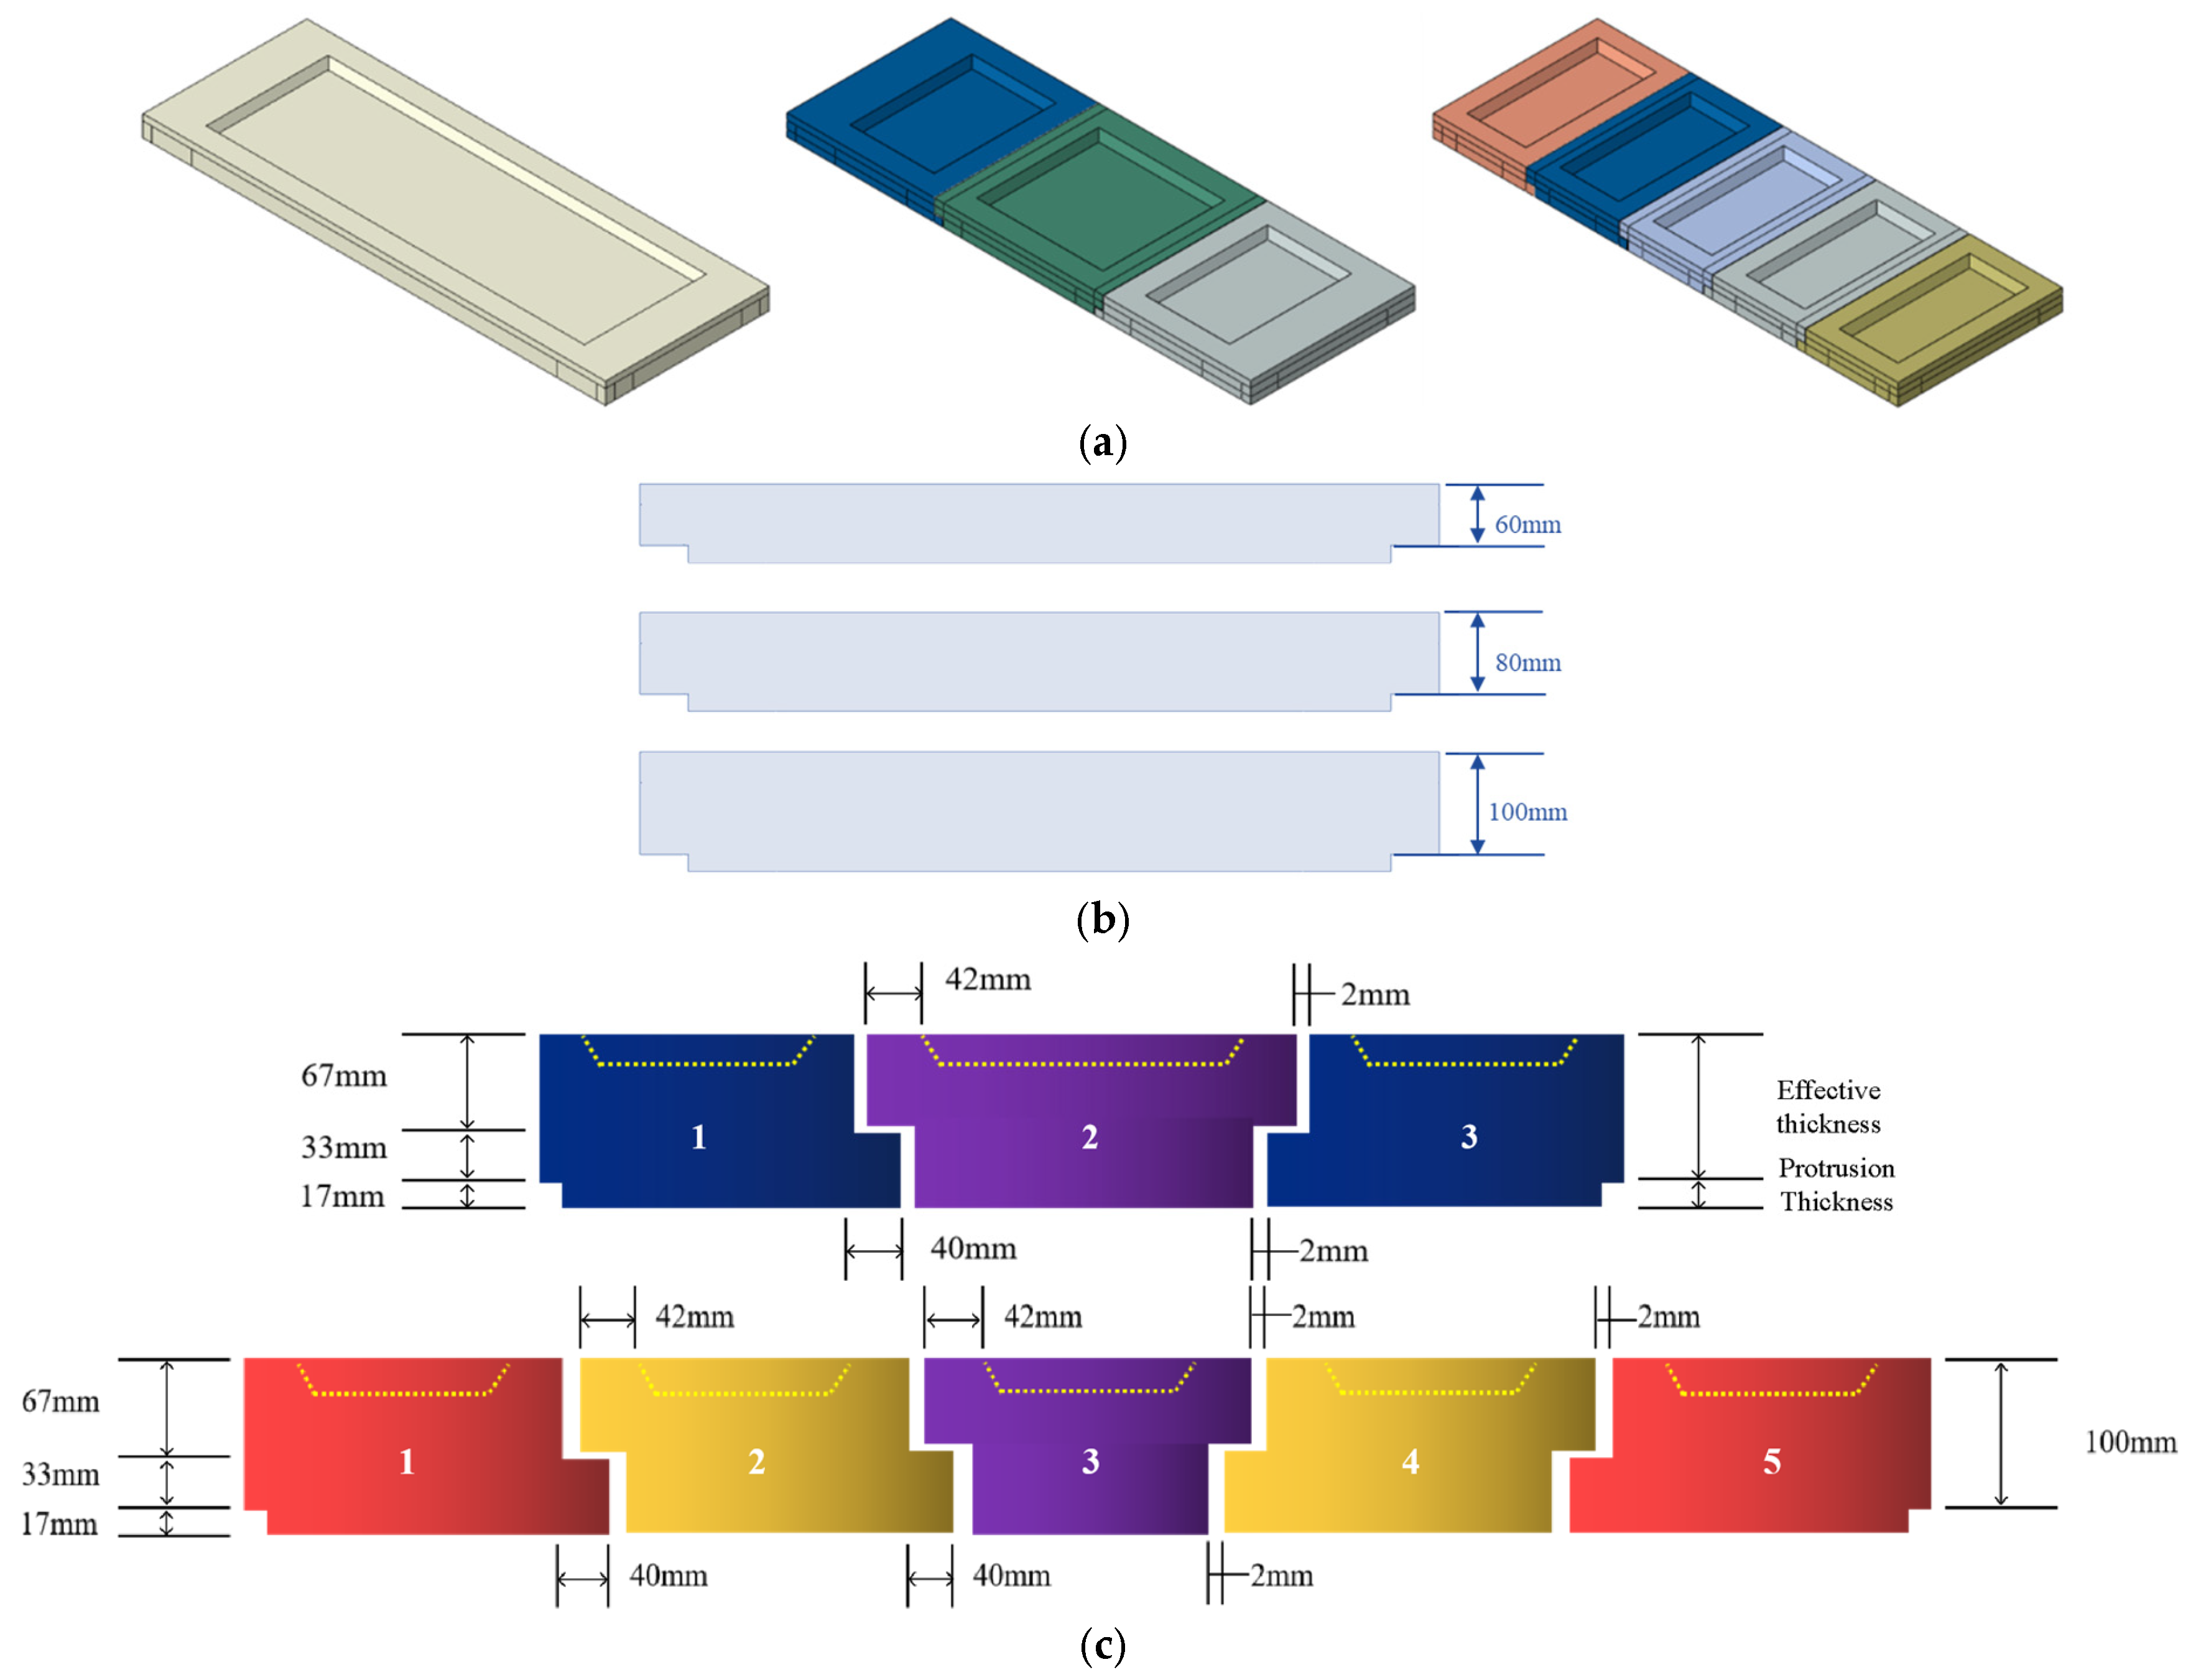
Figure 2.
Schematic diagram of the finite element model of refractory bricks. (a) Single-brick, three-brick, and five-brick models; (b) refractory brick of different thicknesses; and (c) splicing of three and five refractory bricks.
Figure 2.
Schematic diagram of the finite element model of refractory bricks. (a) Single-brick, three-brick, and five-brick models; (b) refractory brick of different thicknesses; and (c) splicing of three and five refractory bricks.
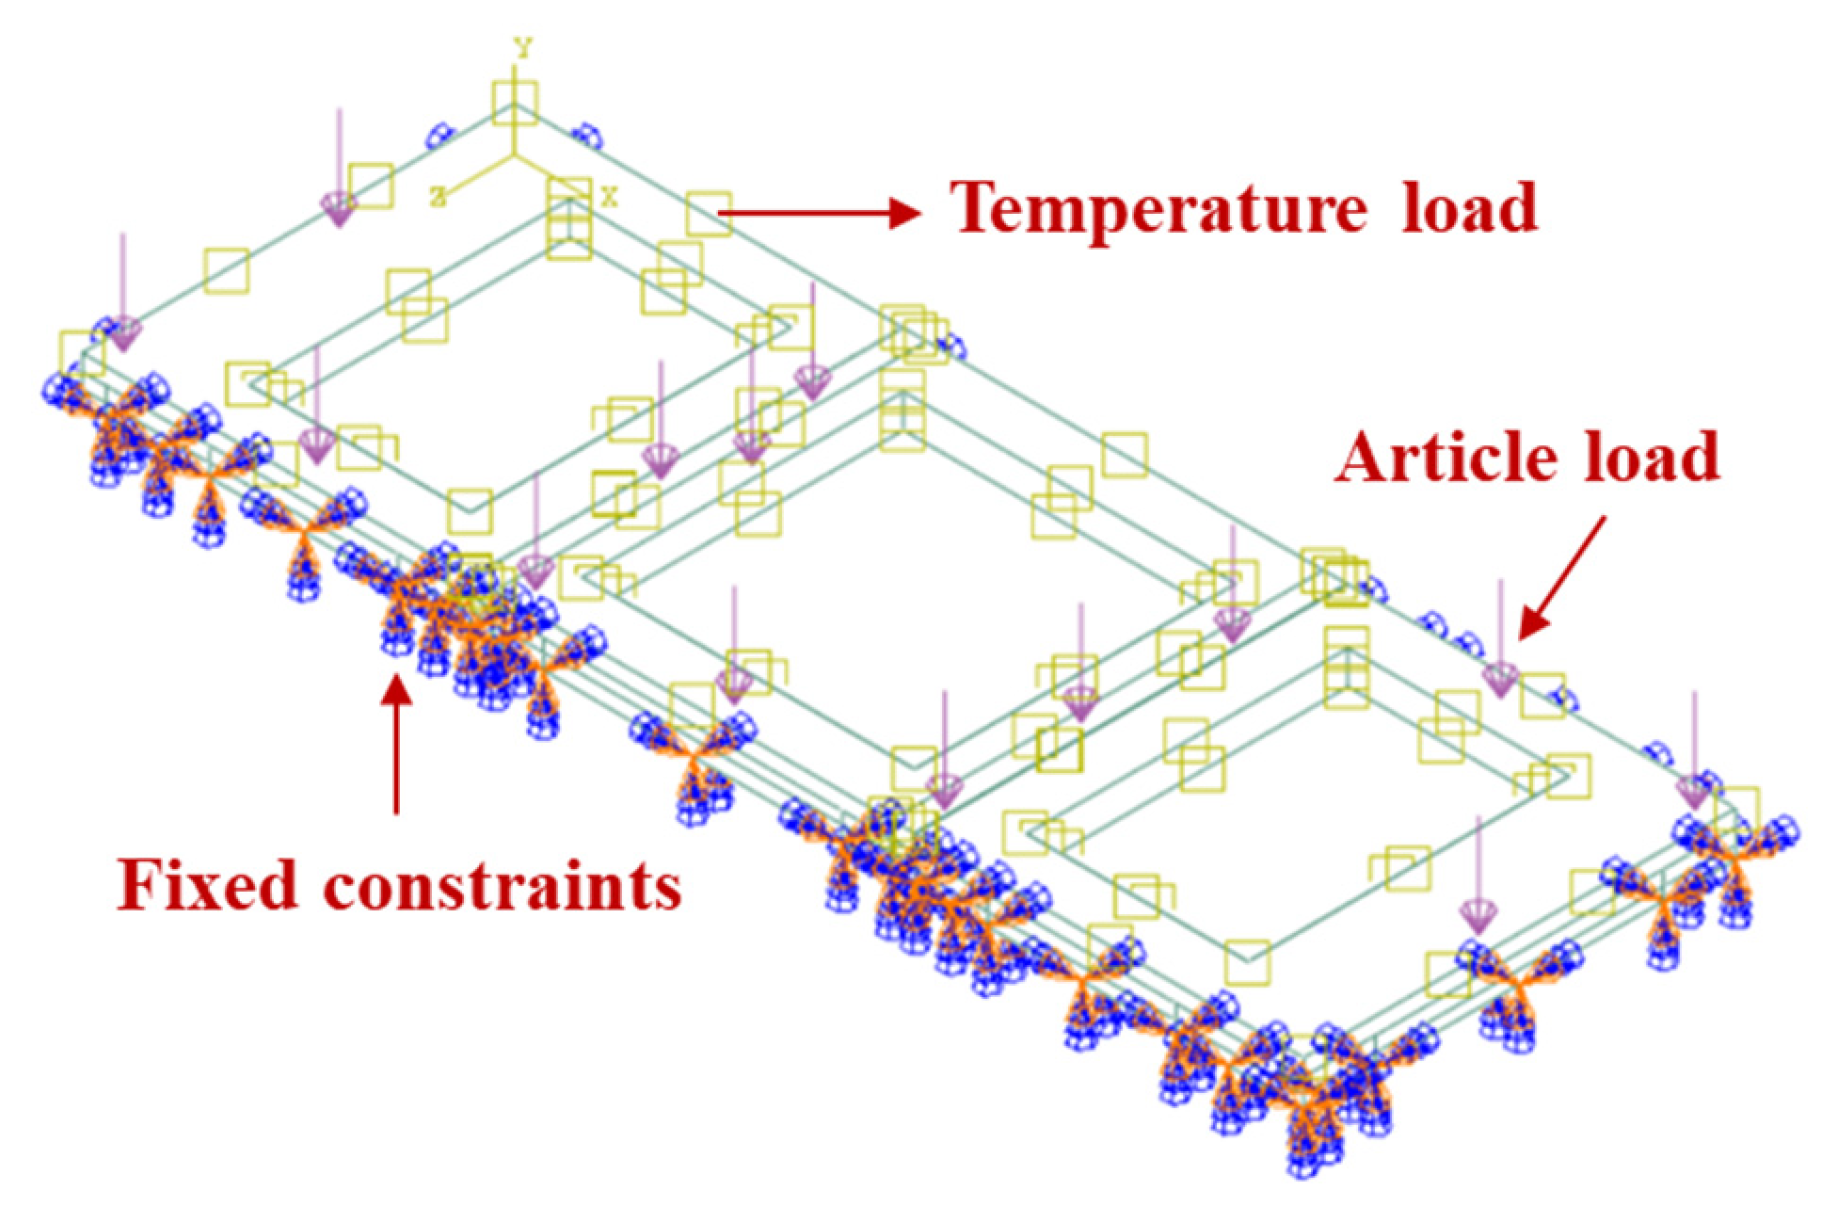
Figure 3.
Boundary condition diagram for the three-refractory-brick model.
Figure 3.
Boundary condition diagram for the three-refractory-brick model.
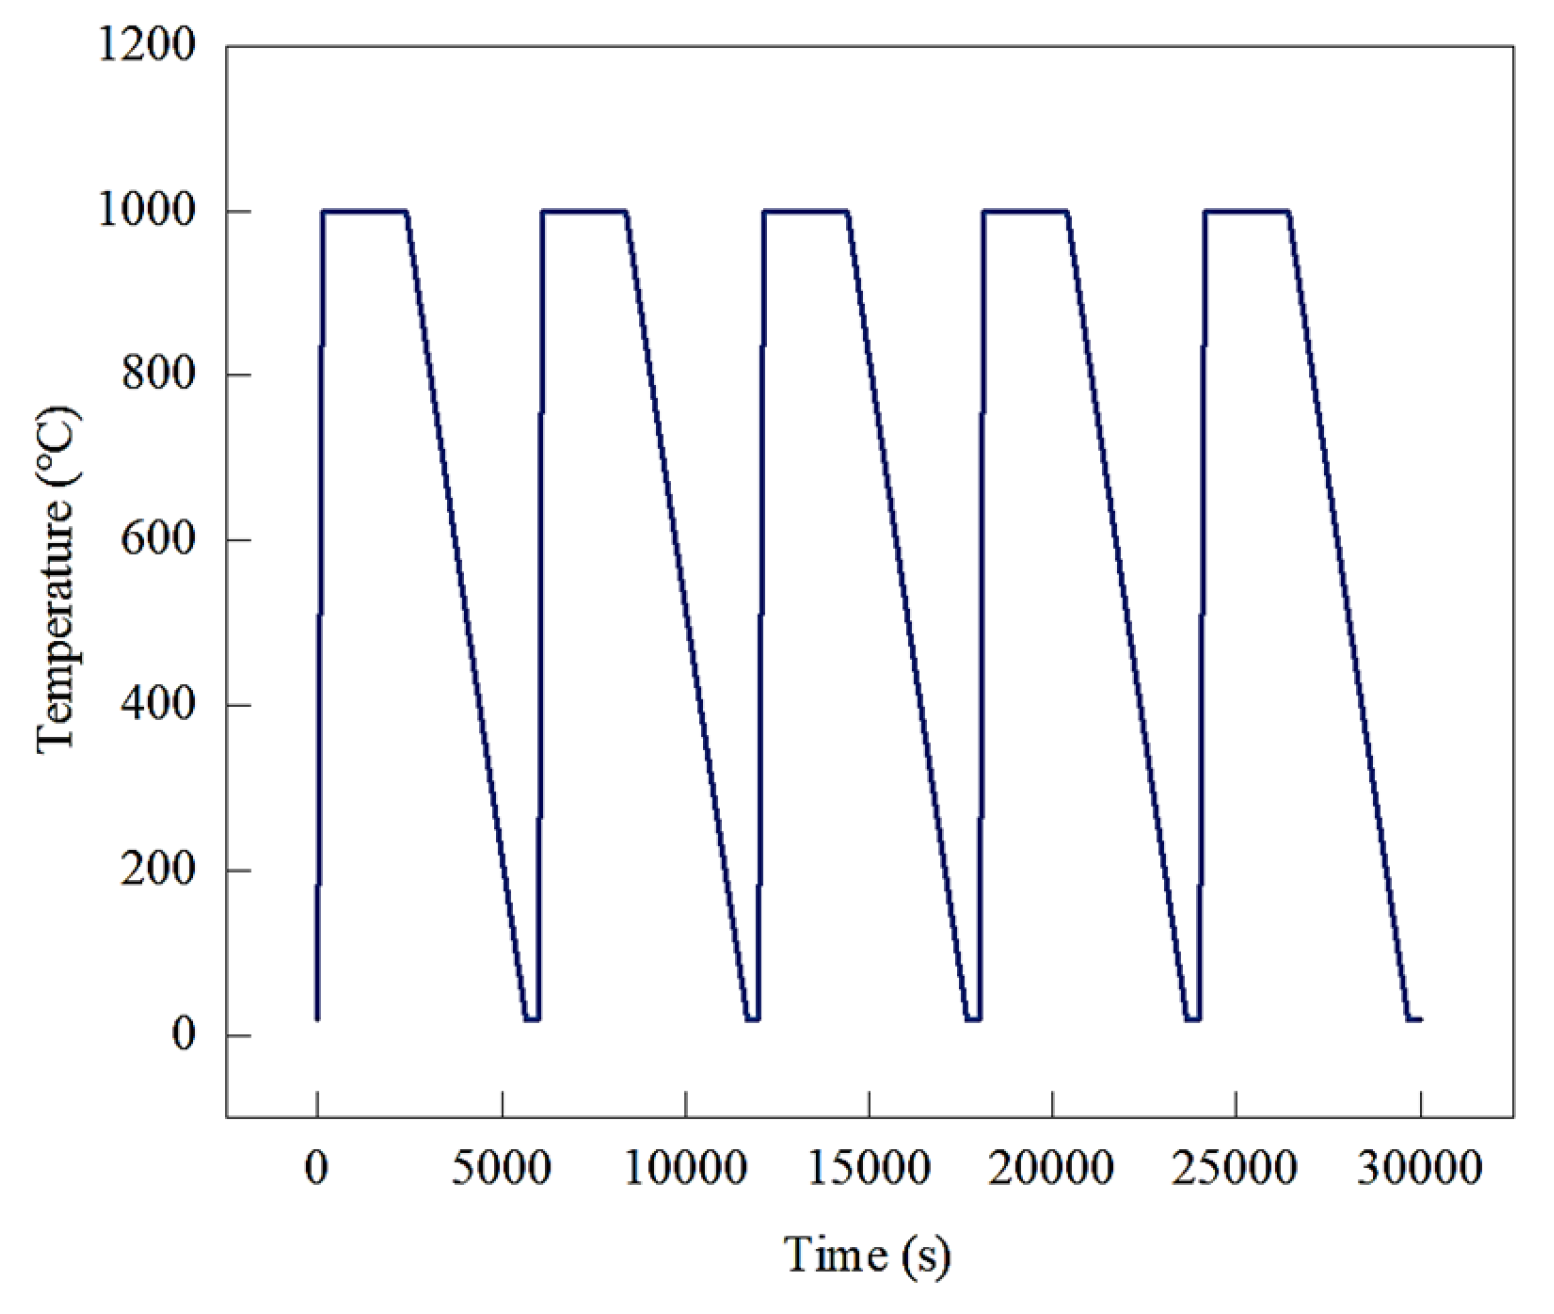
Figure 4.
Schematic diagram of the temperature cycles.
Figure 4.
Schematic diagram of the temperature cycles.
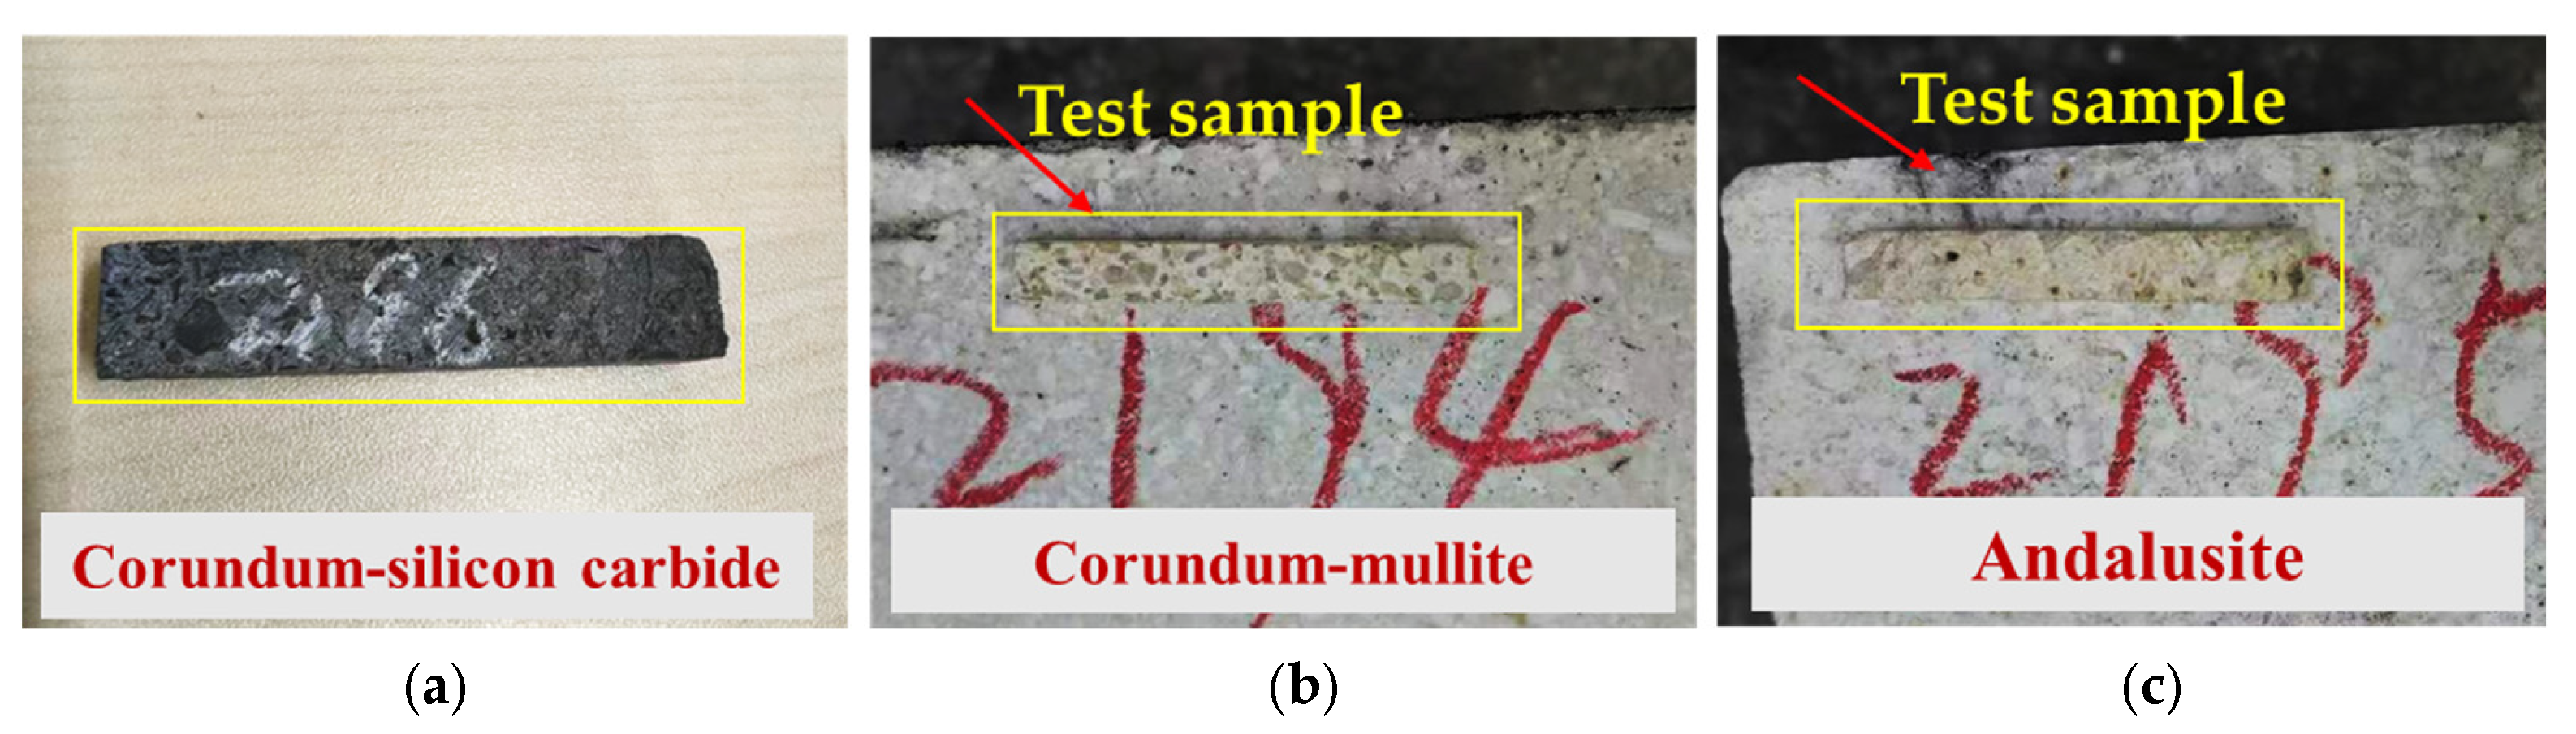
Figure 5.
Thermal expansion test samples of refractory materials. (a) Corundum–silicon carbide samples; (b) corundum–mullite samples; and (c) andalusite samples.
Figure 5.
Thermal expansion test samples of refractory materials. (a) Corundum–silicon carbide samples; (b) corundum–mullite samples; and (c) andalusite samples.
Figure 6.
Experimental numerical model of thermal expansion of refractory brick specimens. (a) Boundary condition diagram; (b) mesh delineation diagram; and (c) full 3D view of the model.
Figure 6.
Experimental numerical model of thermal expansion of refractory brick specimens. (a) Boundary condition diagram; (b) mesh delineation diagram; and (c) full 3D view of the model.
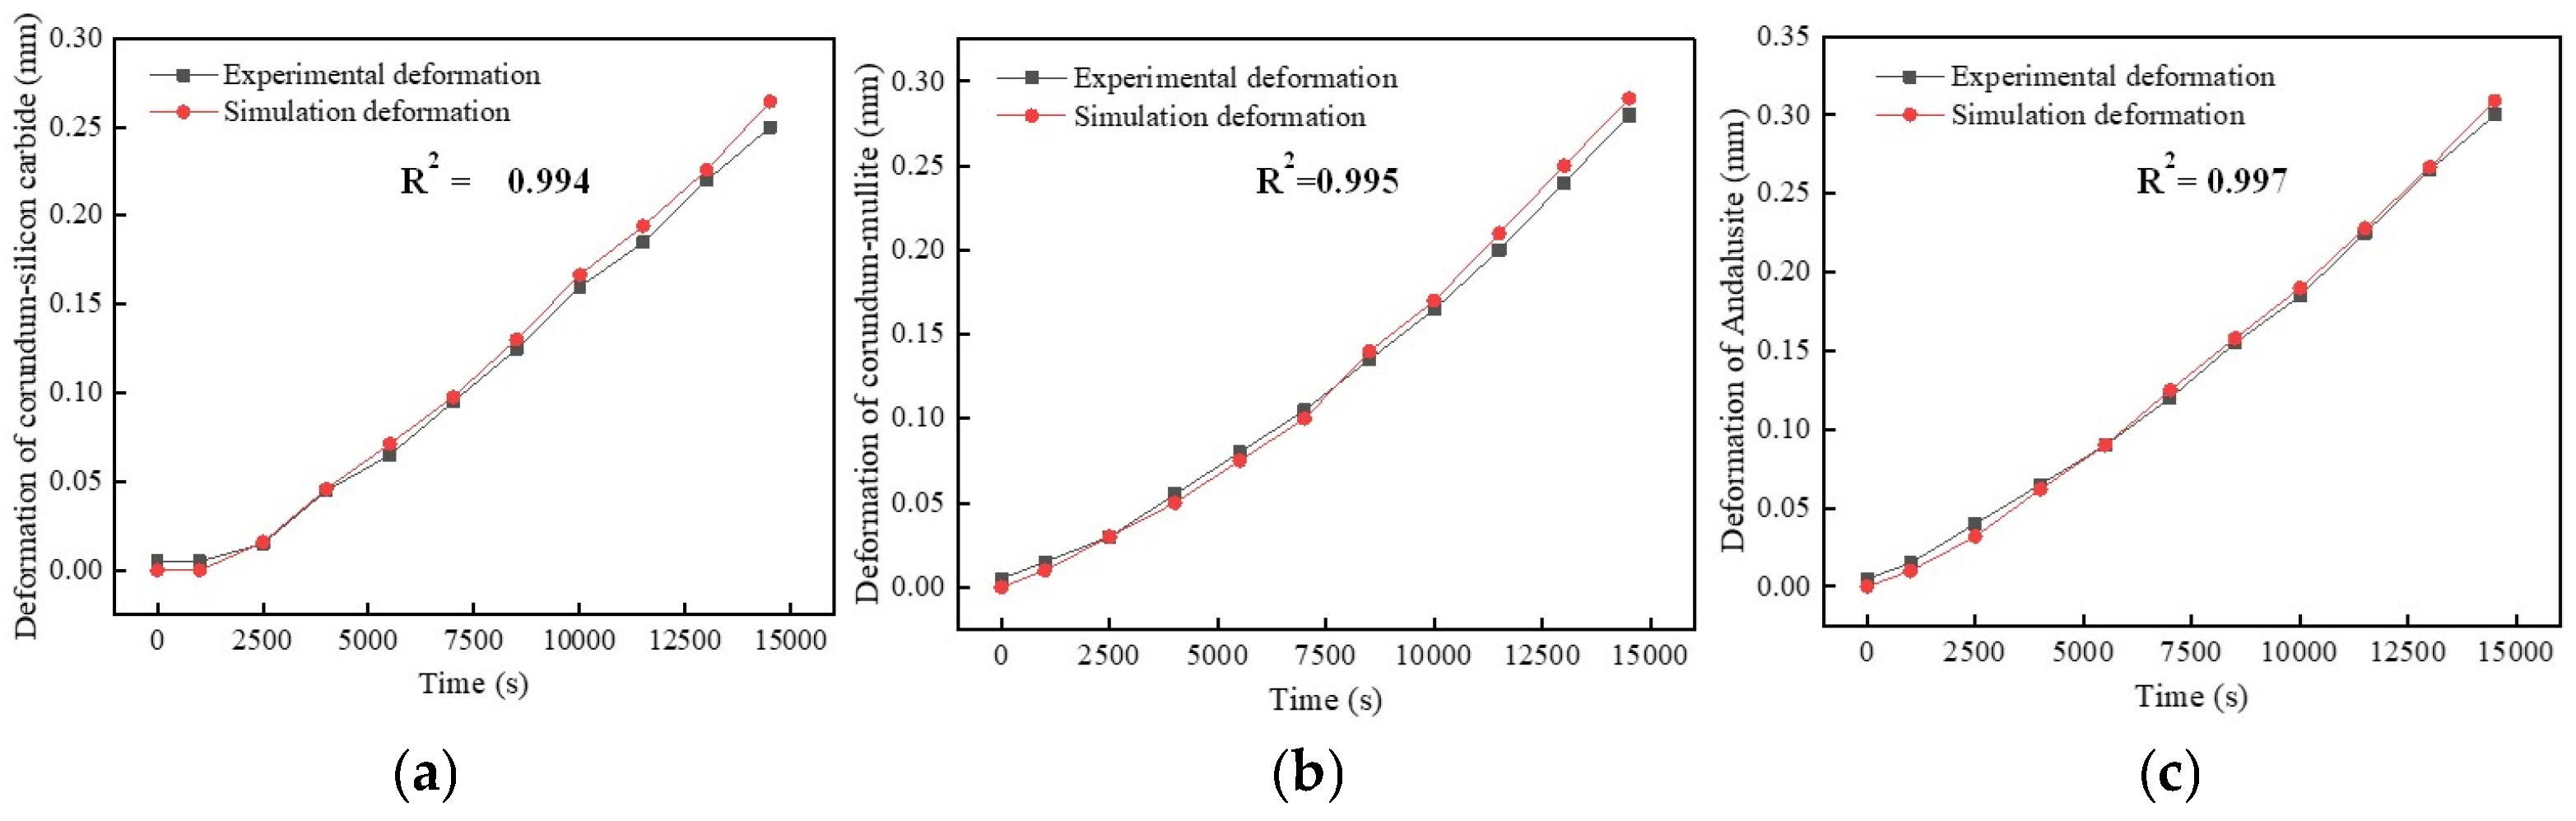
Figure 7.
Comparison between model results and experimental results. (a) Deformation of corundum–silicon carbide; (b) deformation of corundum–mullite; and (c) deformation of andalusite.
Figure 7.
Comparison between model results and experimental results. (a) Deformation of corundum–silicon carbide; (b) deformation of corundum–mullite; and (c) deformation of andalusite.
Figure 8.
Temperature at the center of the refractory bricks’ recesses as a function of time.
Figure 8.
Temperature at the center of the refractory bricks’ recesses as a function of time.
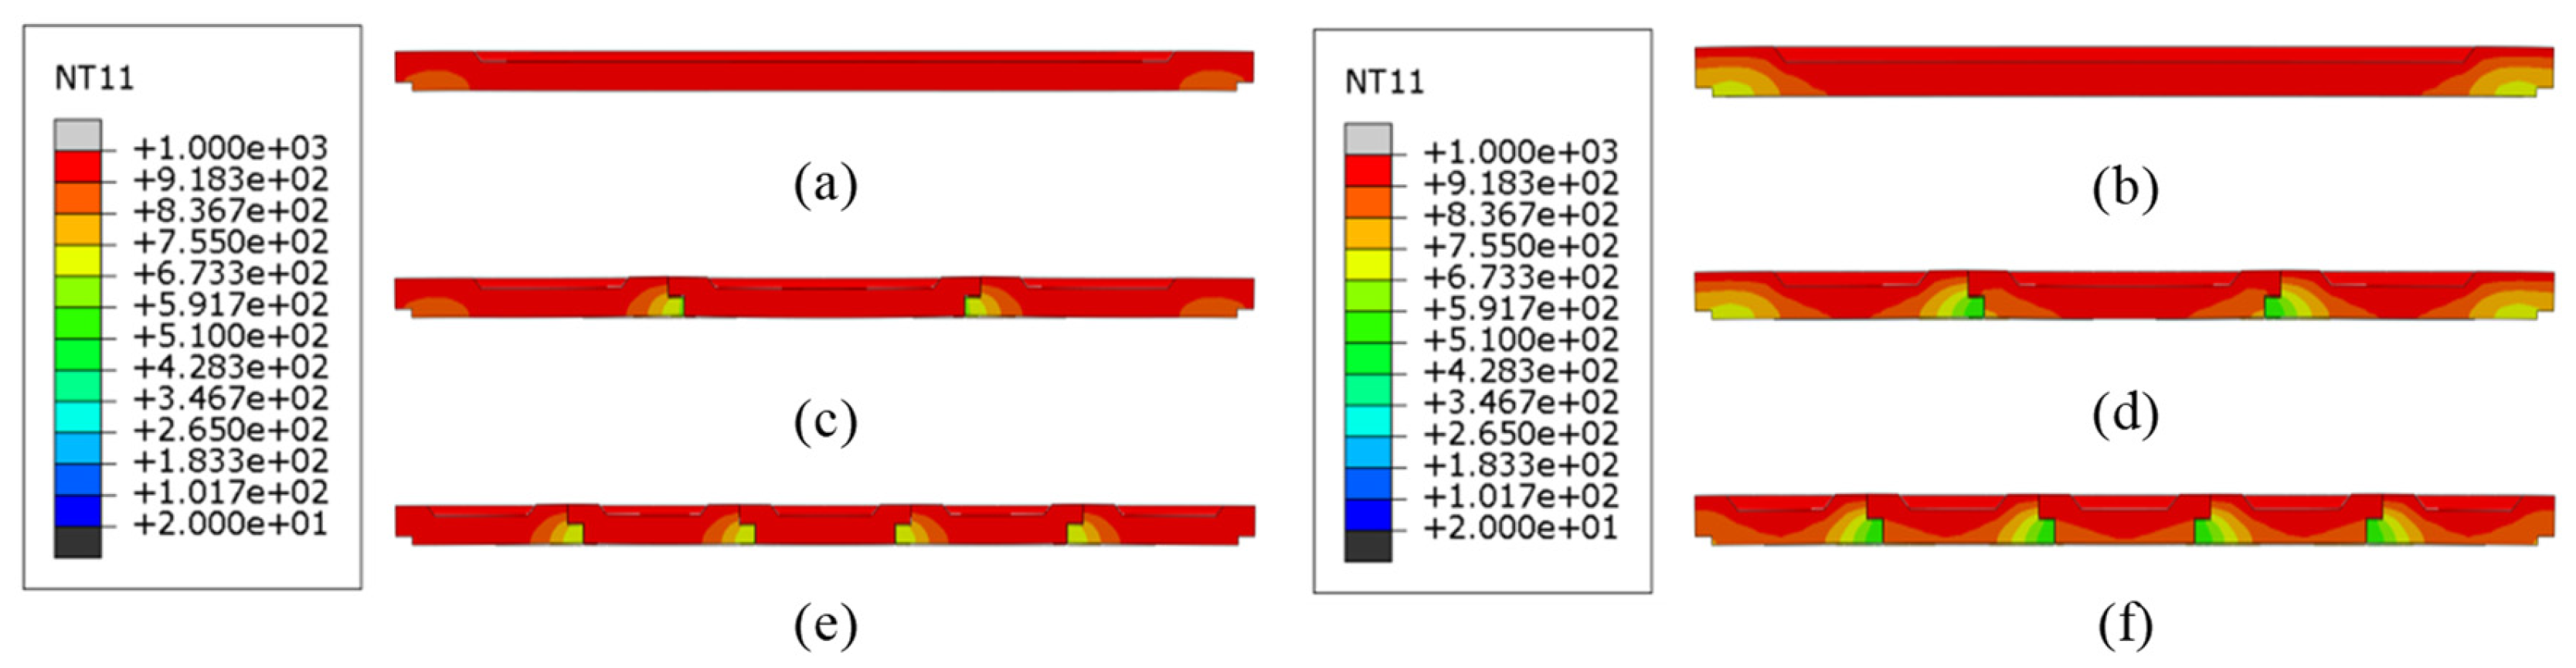
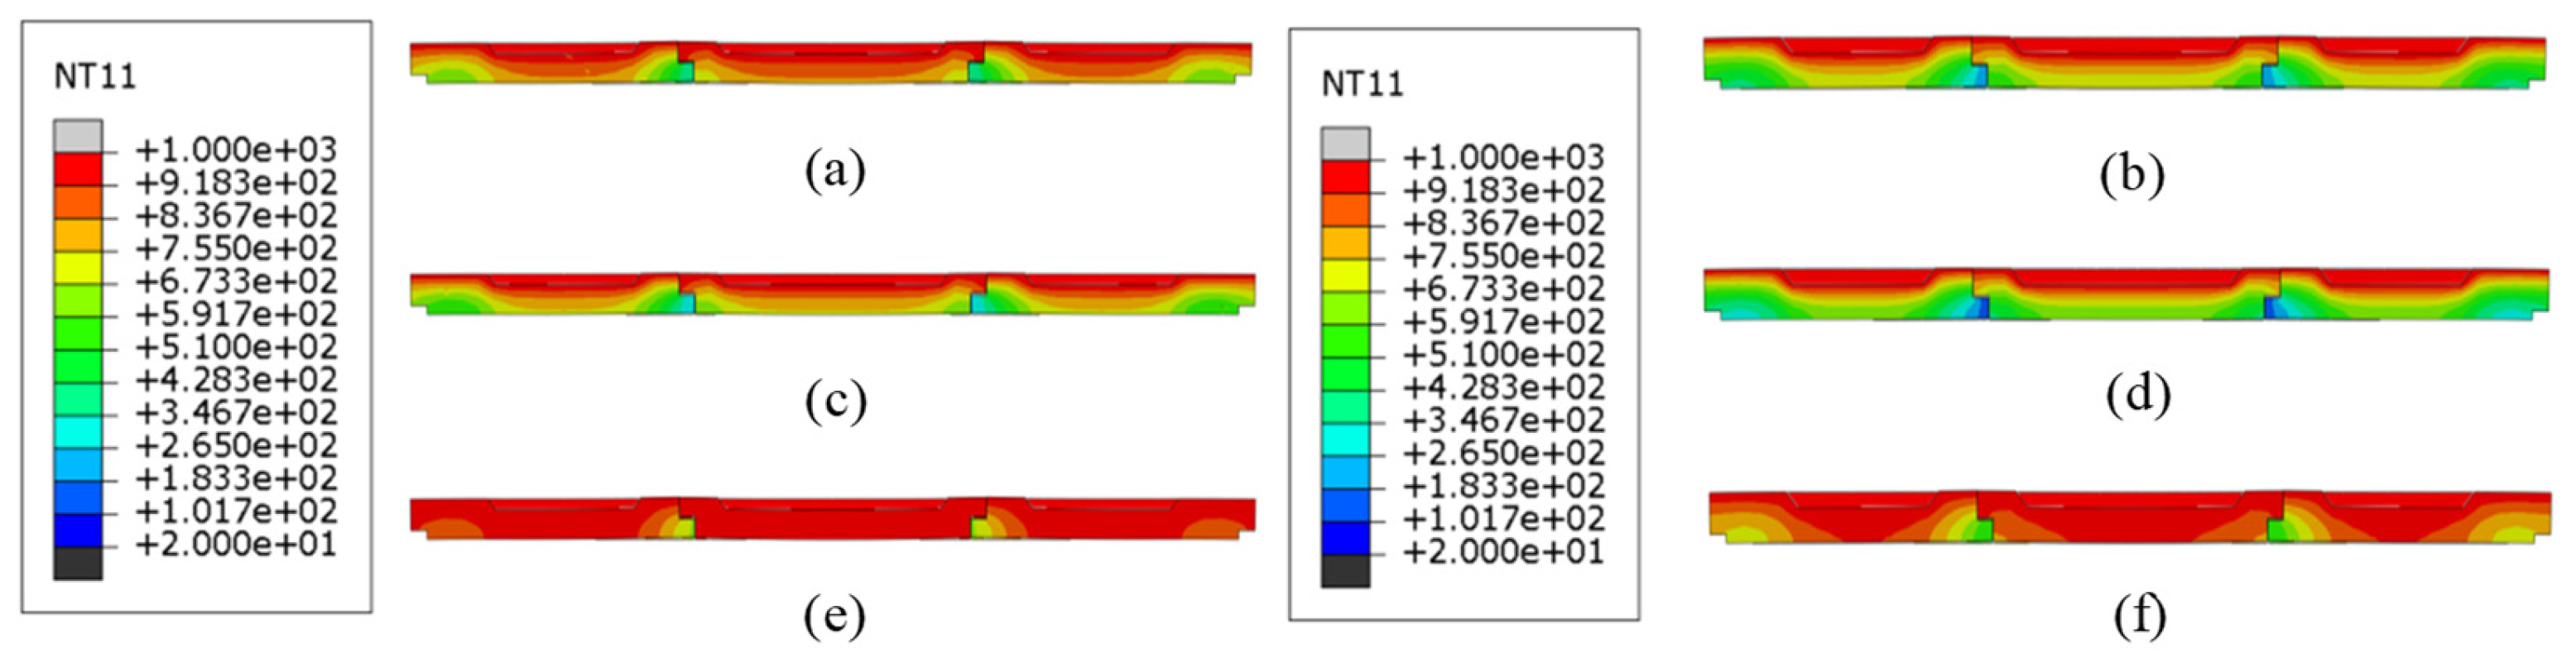
Figure 9.
Temperature contour profiles of structures with different brick thicknesses and brick numbers. (a) Single brick, 60 mm; (b) single brick, 80 mm; (c) three bricks, 60 mm; (d) three bricks, 80 mm; (e) five bricks, 60 mm; and (f) five bricks, 80 mm.
Figure 9.
Temperature contour profiles of structures with different brick thicknesses and brick numbers. (a) Single brick, 60 mm; (b) single brick, 80 mm; (c) three bricks, 60 mm; (d) three bricks, 80 mm; (e) five bricks, 60 mm; and (f) five bricks, 80 mm.
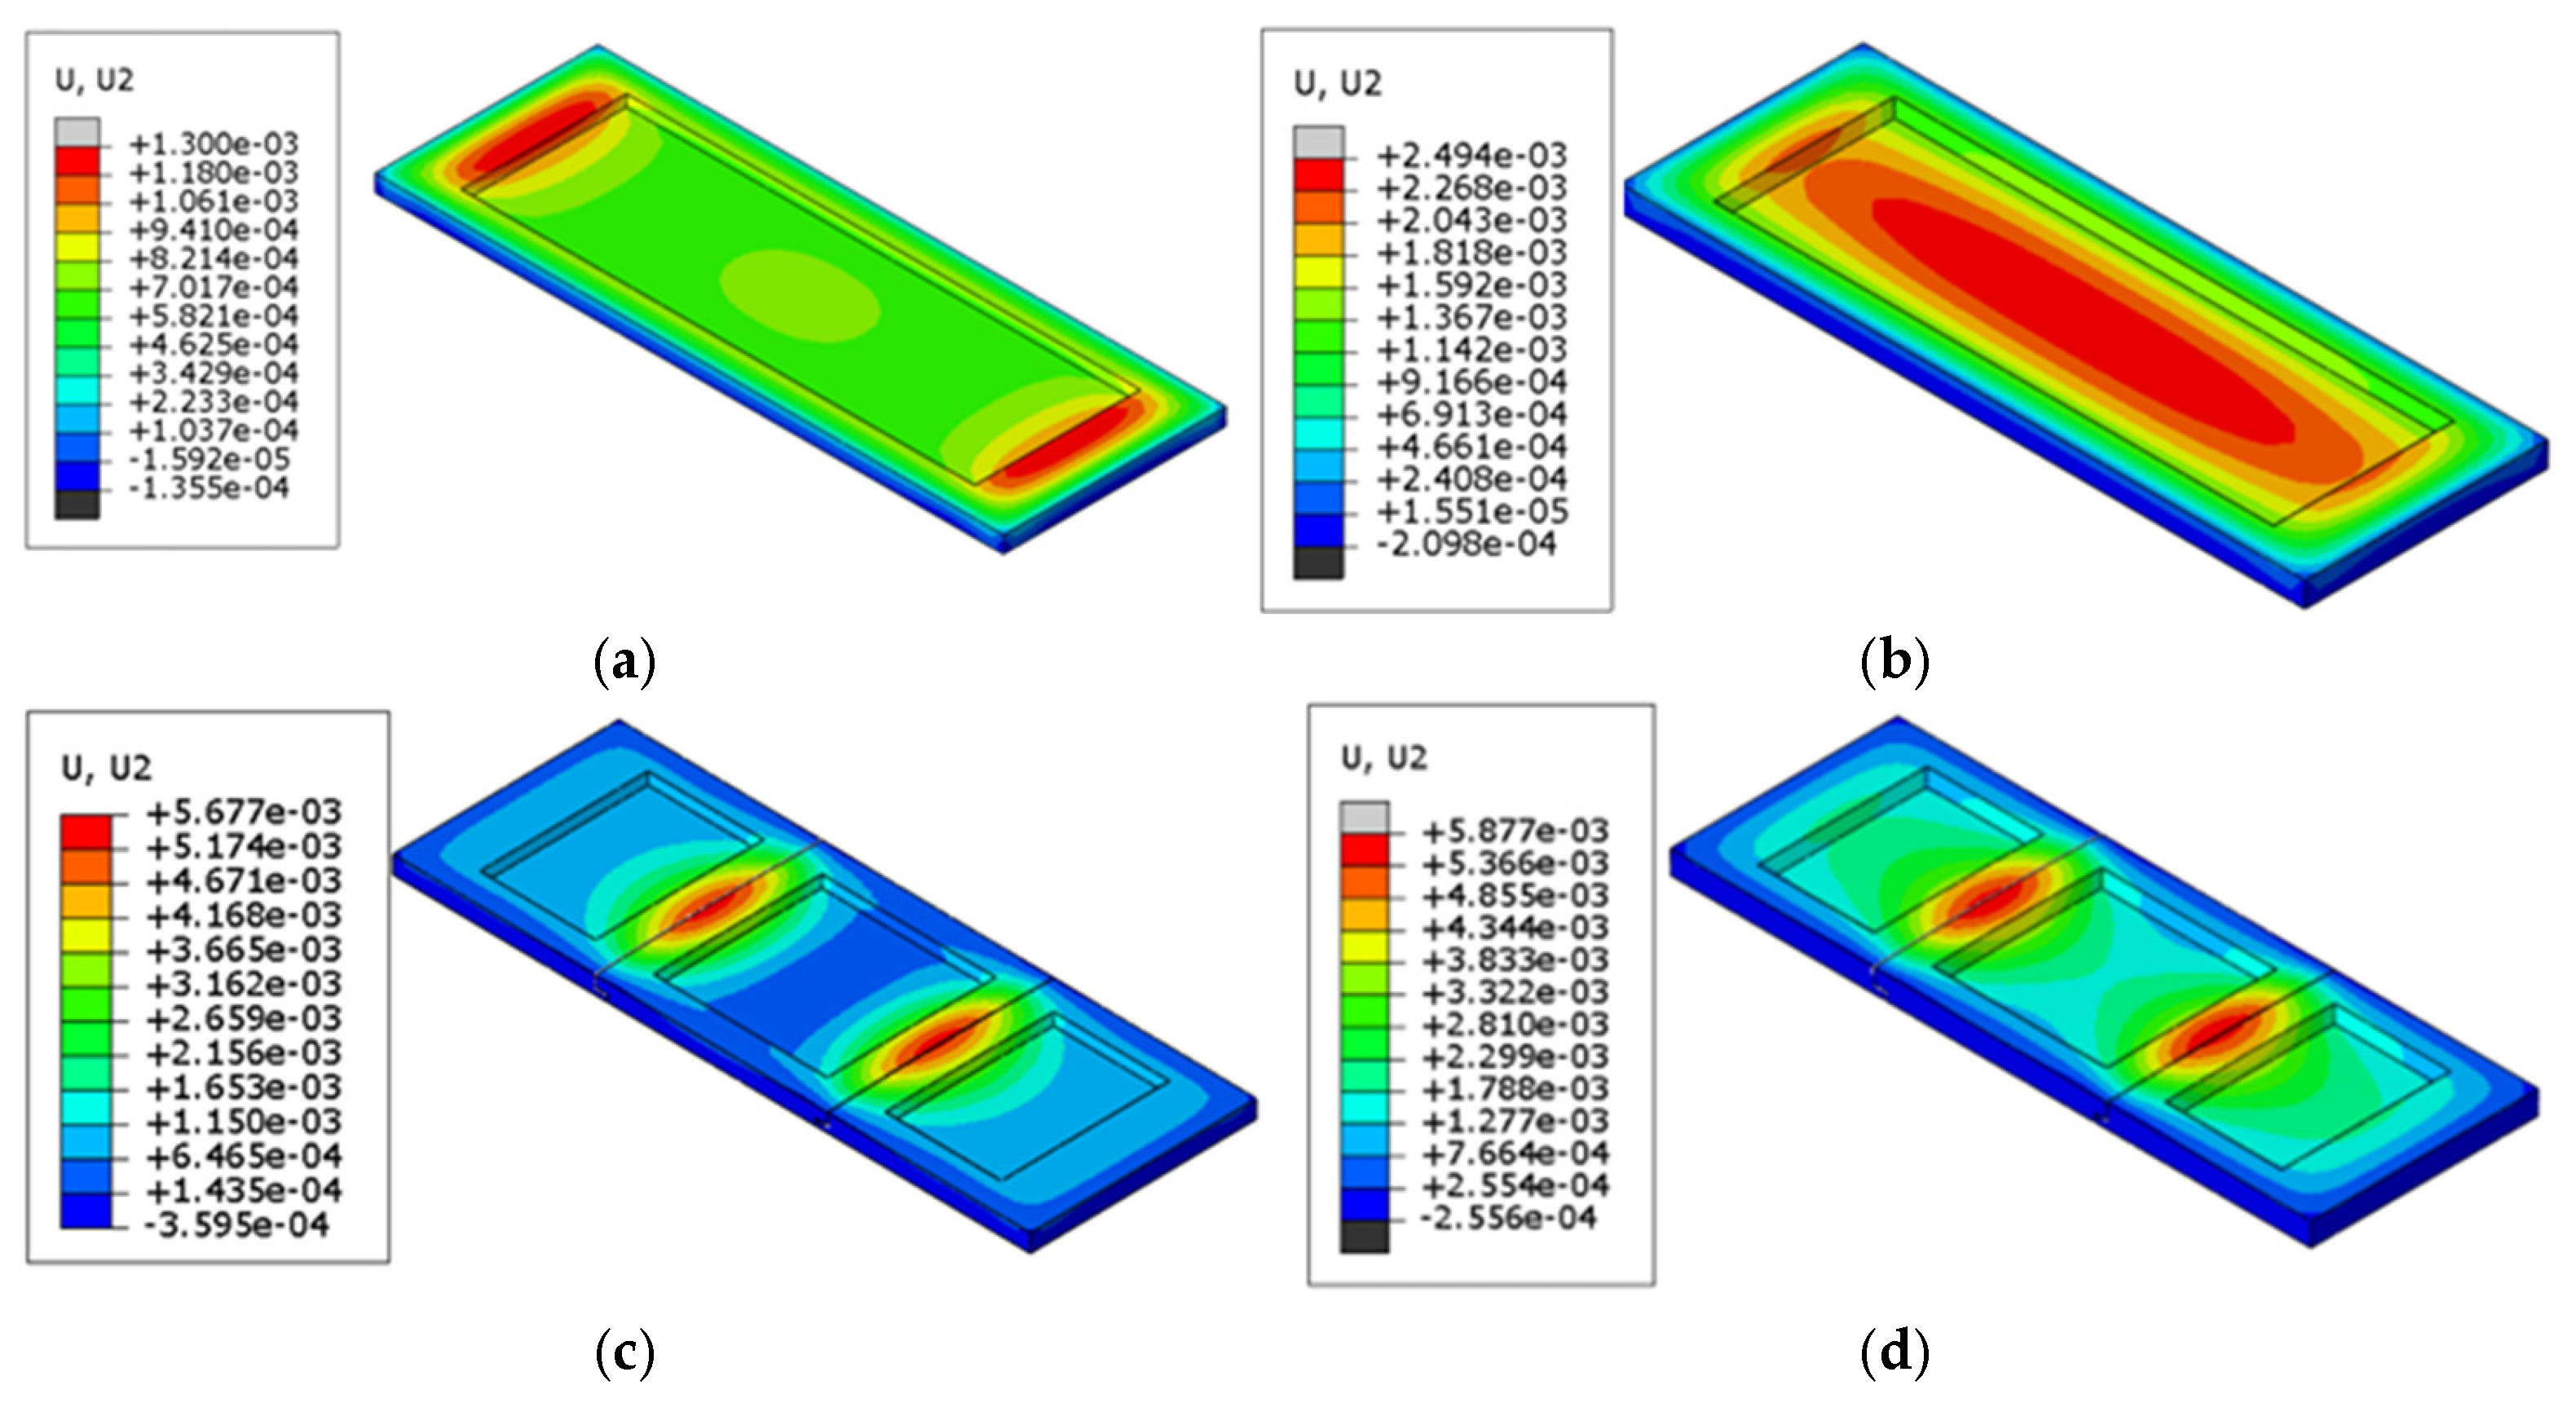
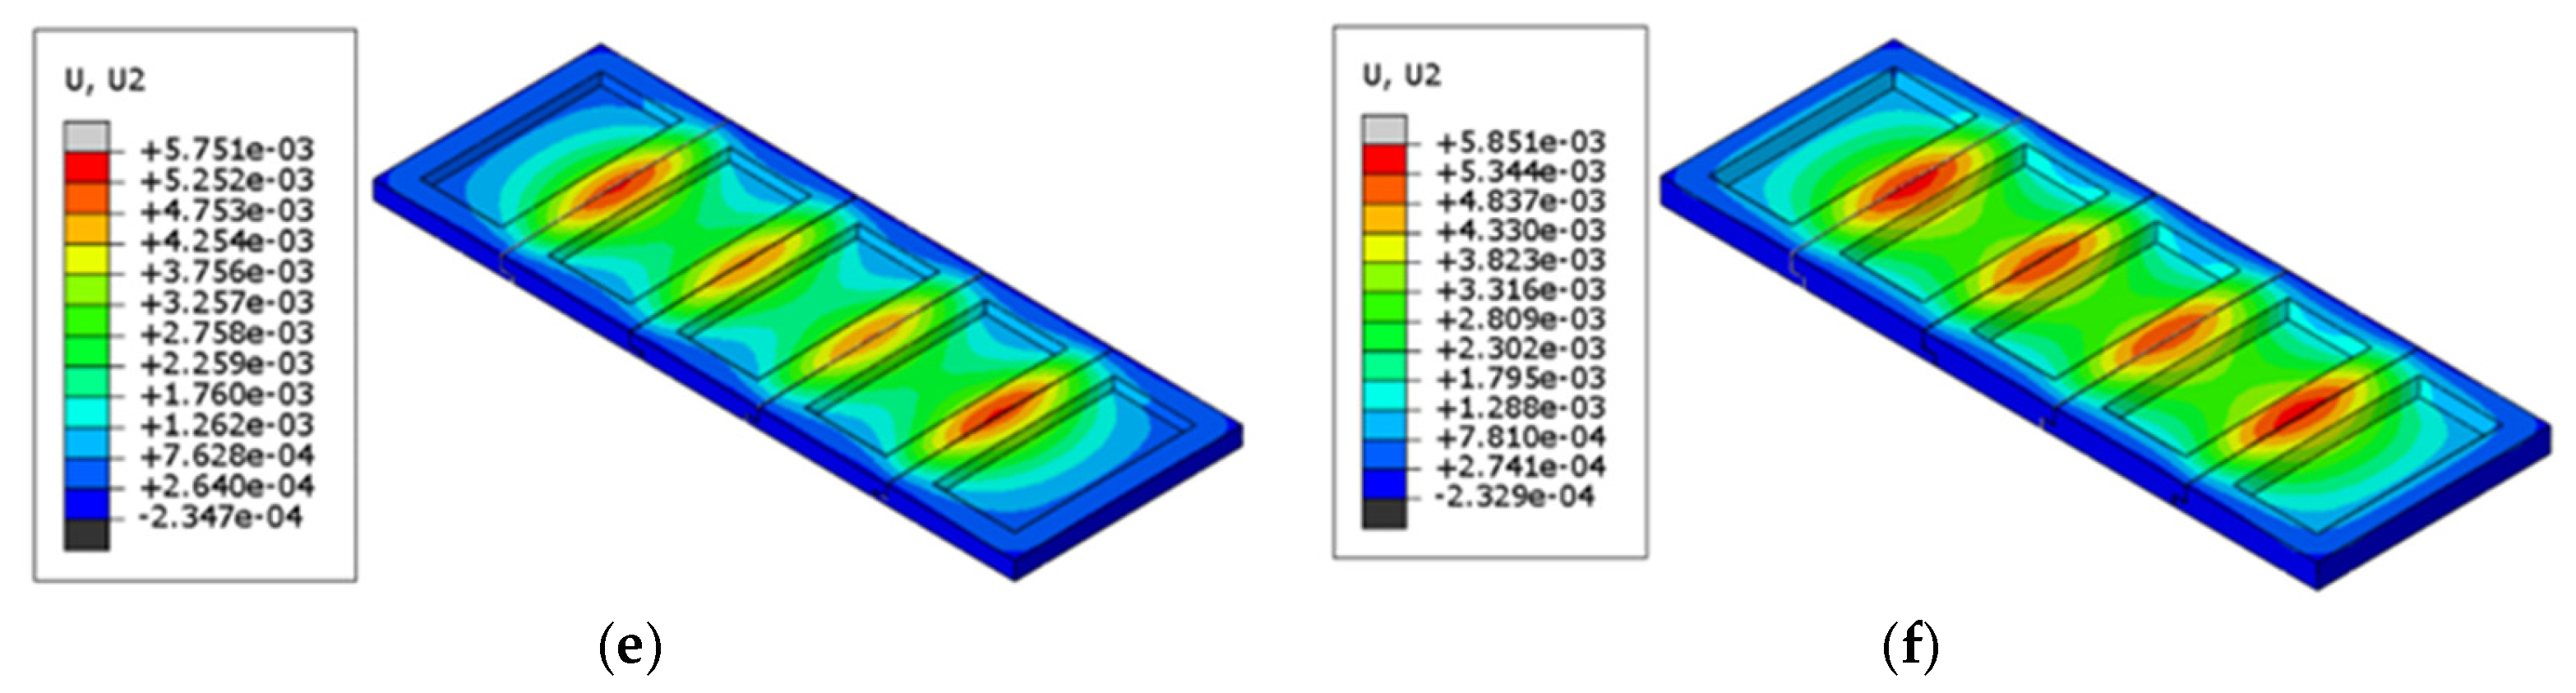
Figure 10.
Points of maximum vertical displacement for corundum–silicon carbide refractory bricks. (a) Single brick, 60 mm; (b) single brick, 80 mm; (c) three bricks, 60 mm; (d) three bricks, 80 mm; (e) five bricks, 60 mm; (f) five bricks, 80 mm.
Figure 10.
Points of maximum vertical displacement for corundum–silicon carbide refractory bricks. (a) Single brick, 60 mm; (b) single brick, 80 mm; (c) three bricks, 60 mm; (d) three bricks, 80 mm; (e) five bricks, 60 mm; (f) five bricks, 80 mm.
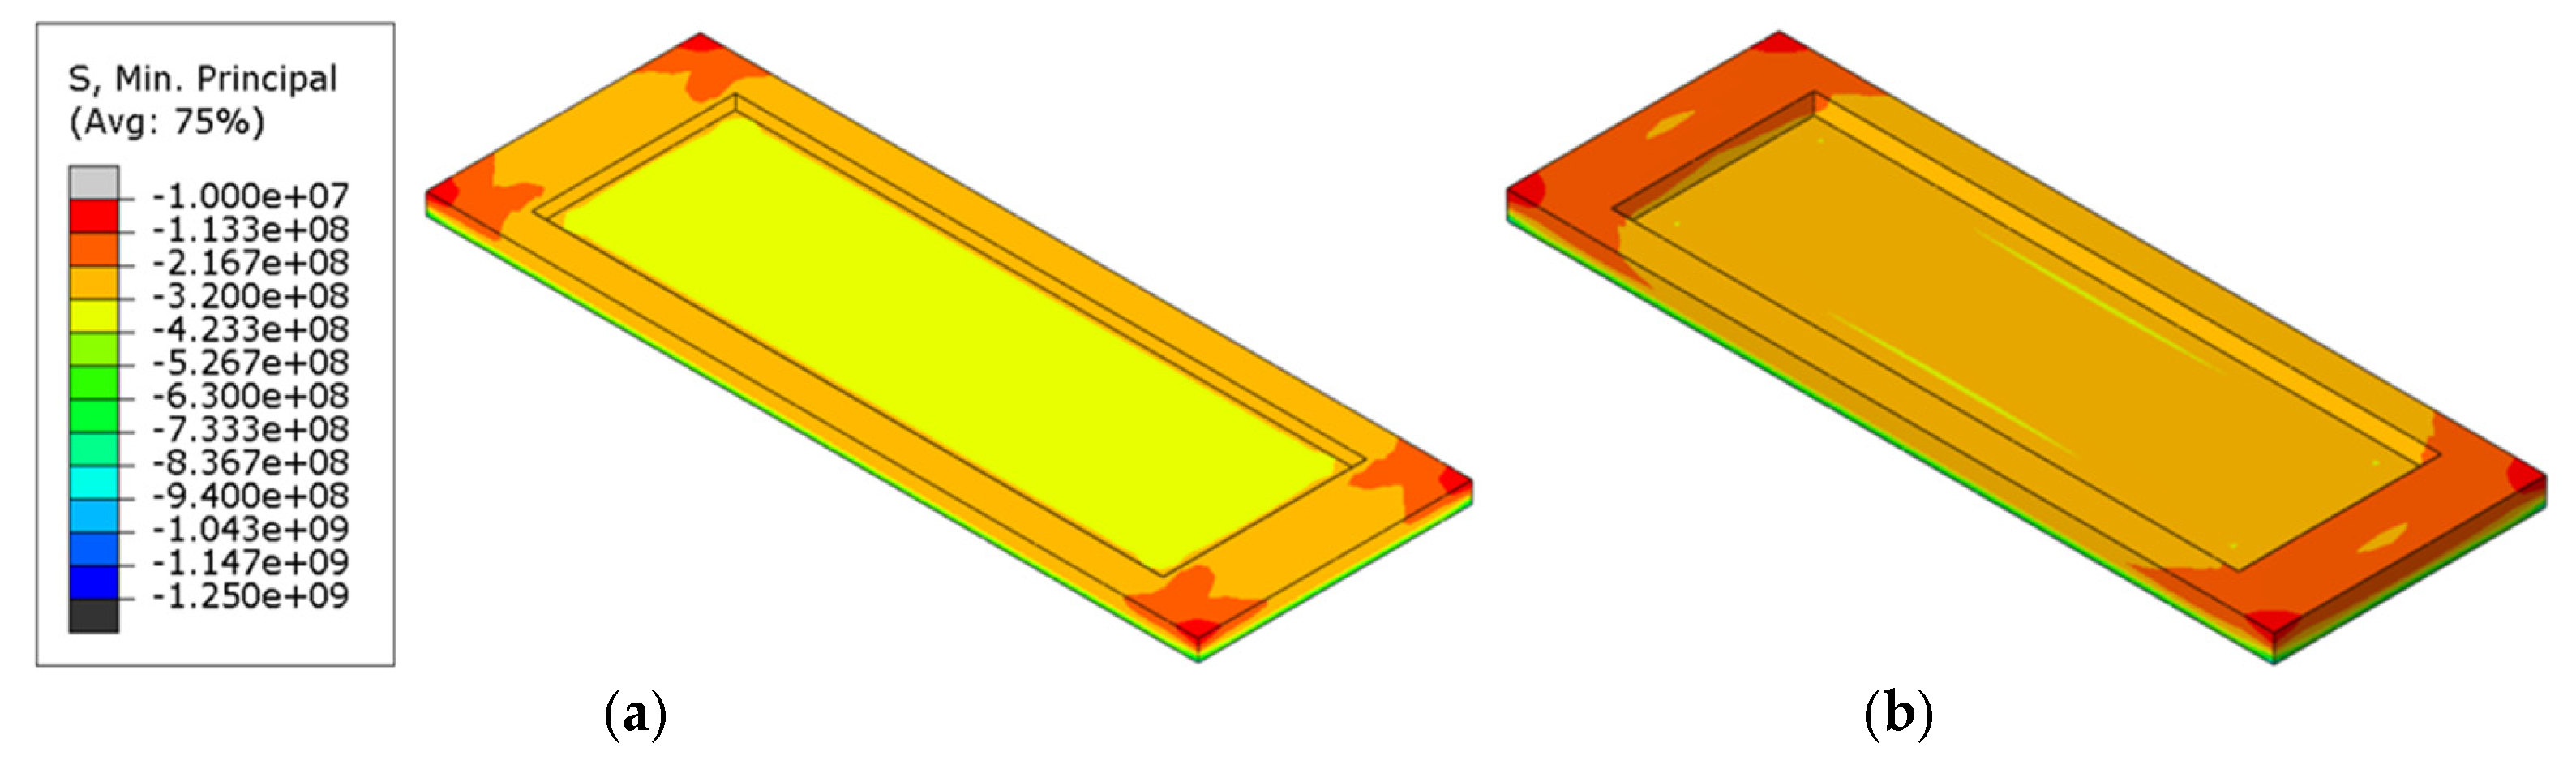
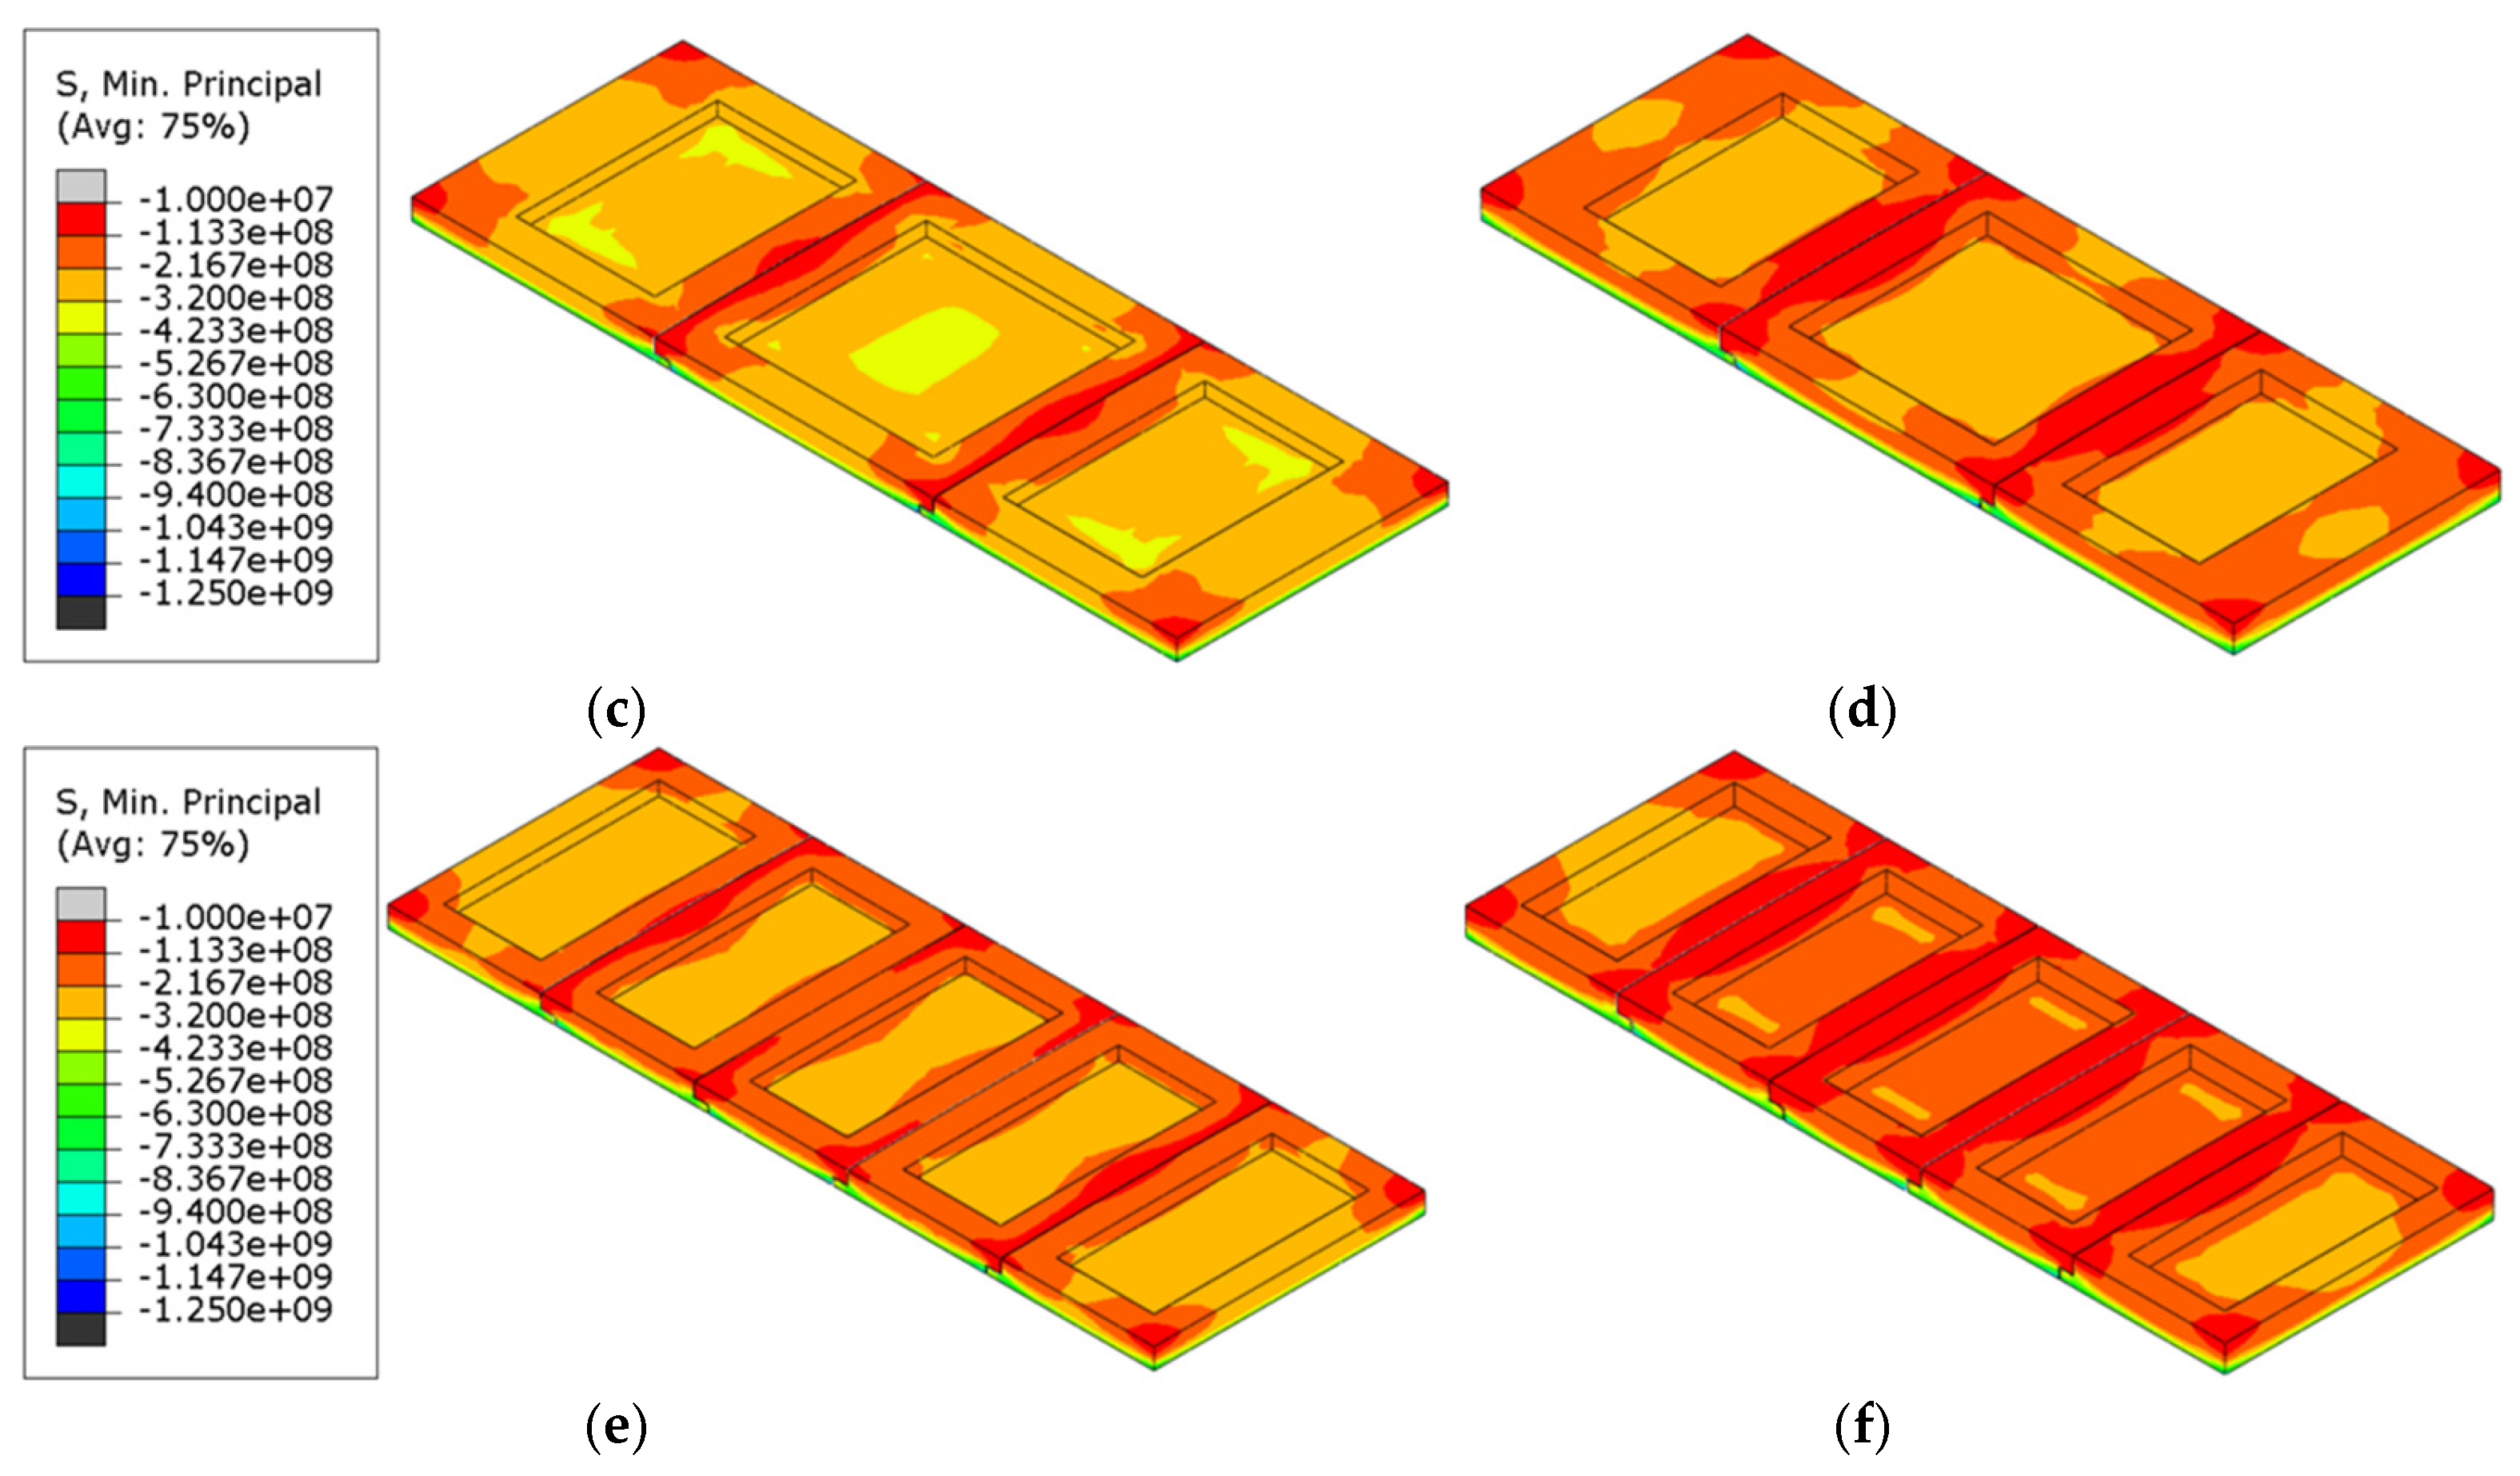
Figure 11.
Maximum principal compressive stress cloud of refractory bricks (T = 2400 s). (a) Single brick, 60 mm; (b) single brick, 80 mm; (c) three bricks, 60 mm; (d) three bricks, 80 mm; (e) five bricks, 60 mm; and (f) five bricks, 80 mm.
Figure 11.
Maximum principal compressive stress cloud of refractory bricks (T = 2400 s). (a) Single brick, 60 mm; (b) single brick, 80 mm; (c) three bricks, 60 mm; (d) three bricks, 80 mm; (e) five bricks, 60 mm; and (f) five bricks, 80 mm.
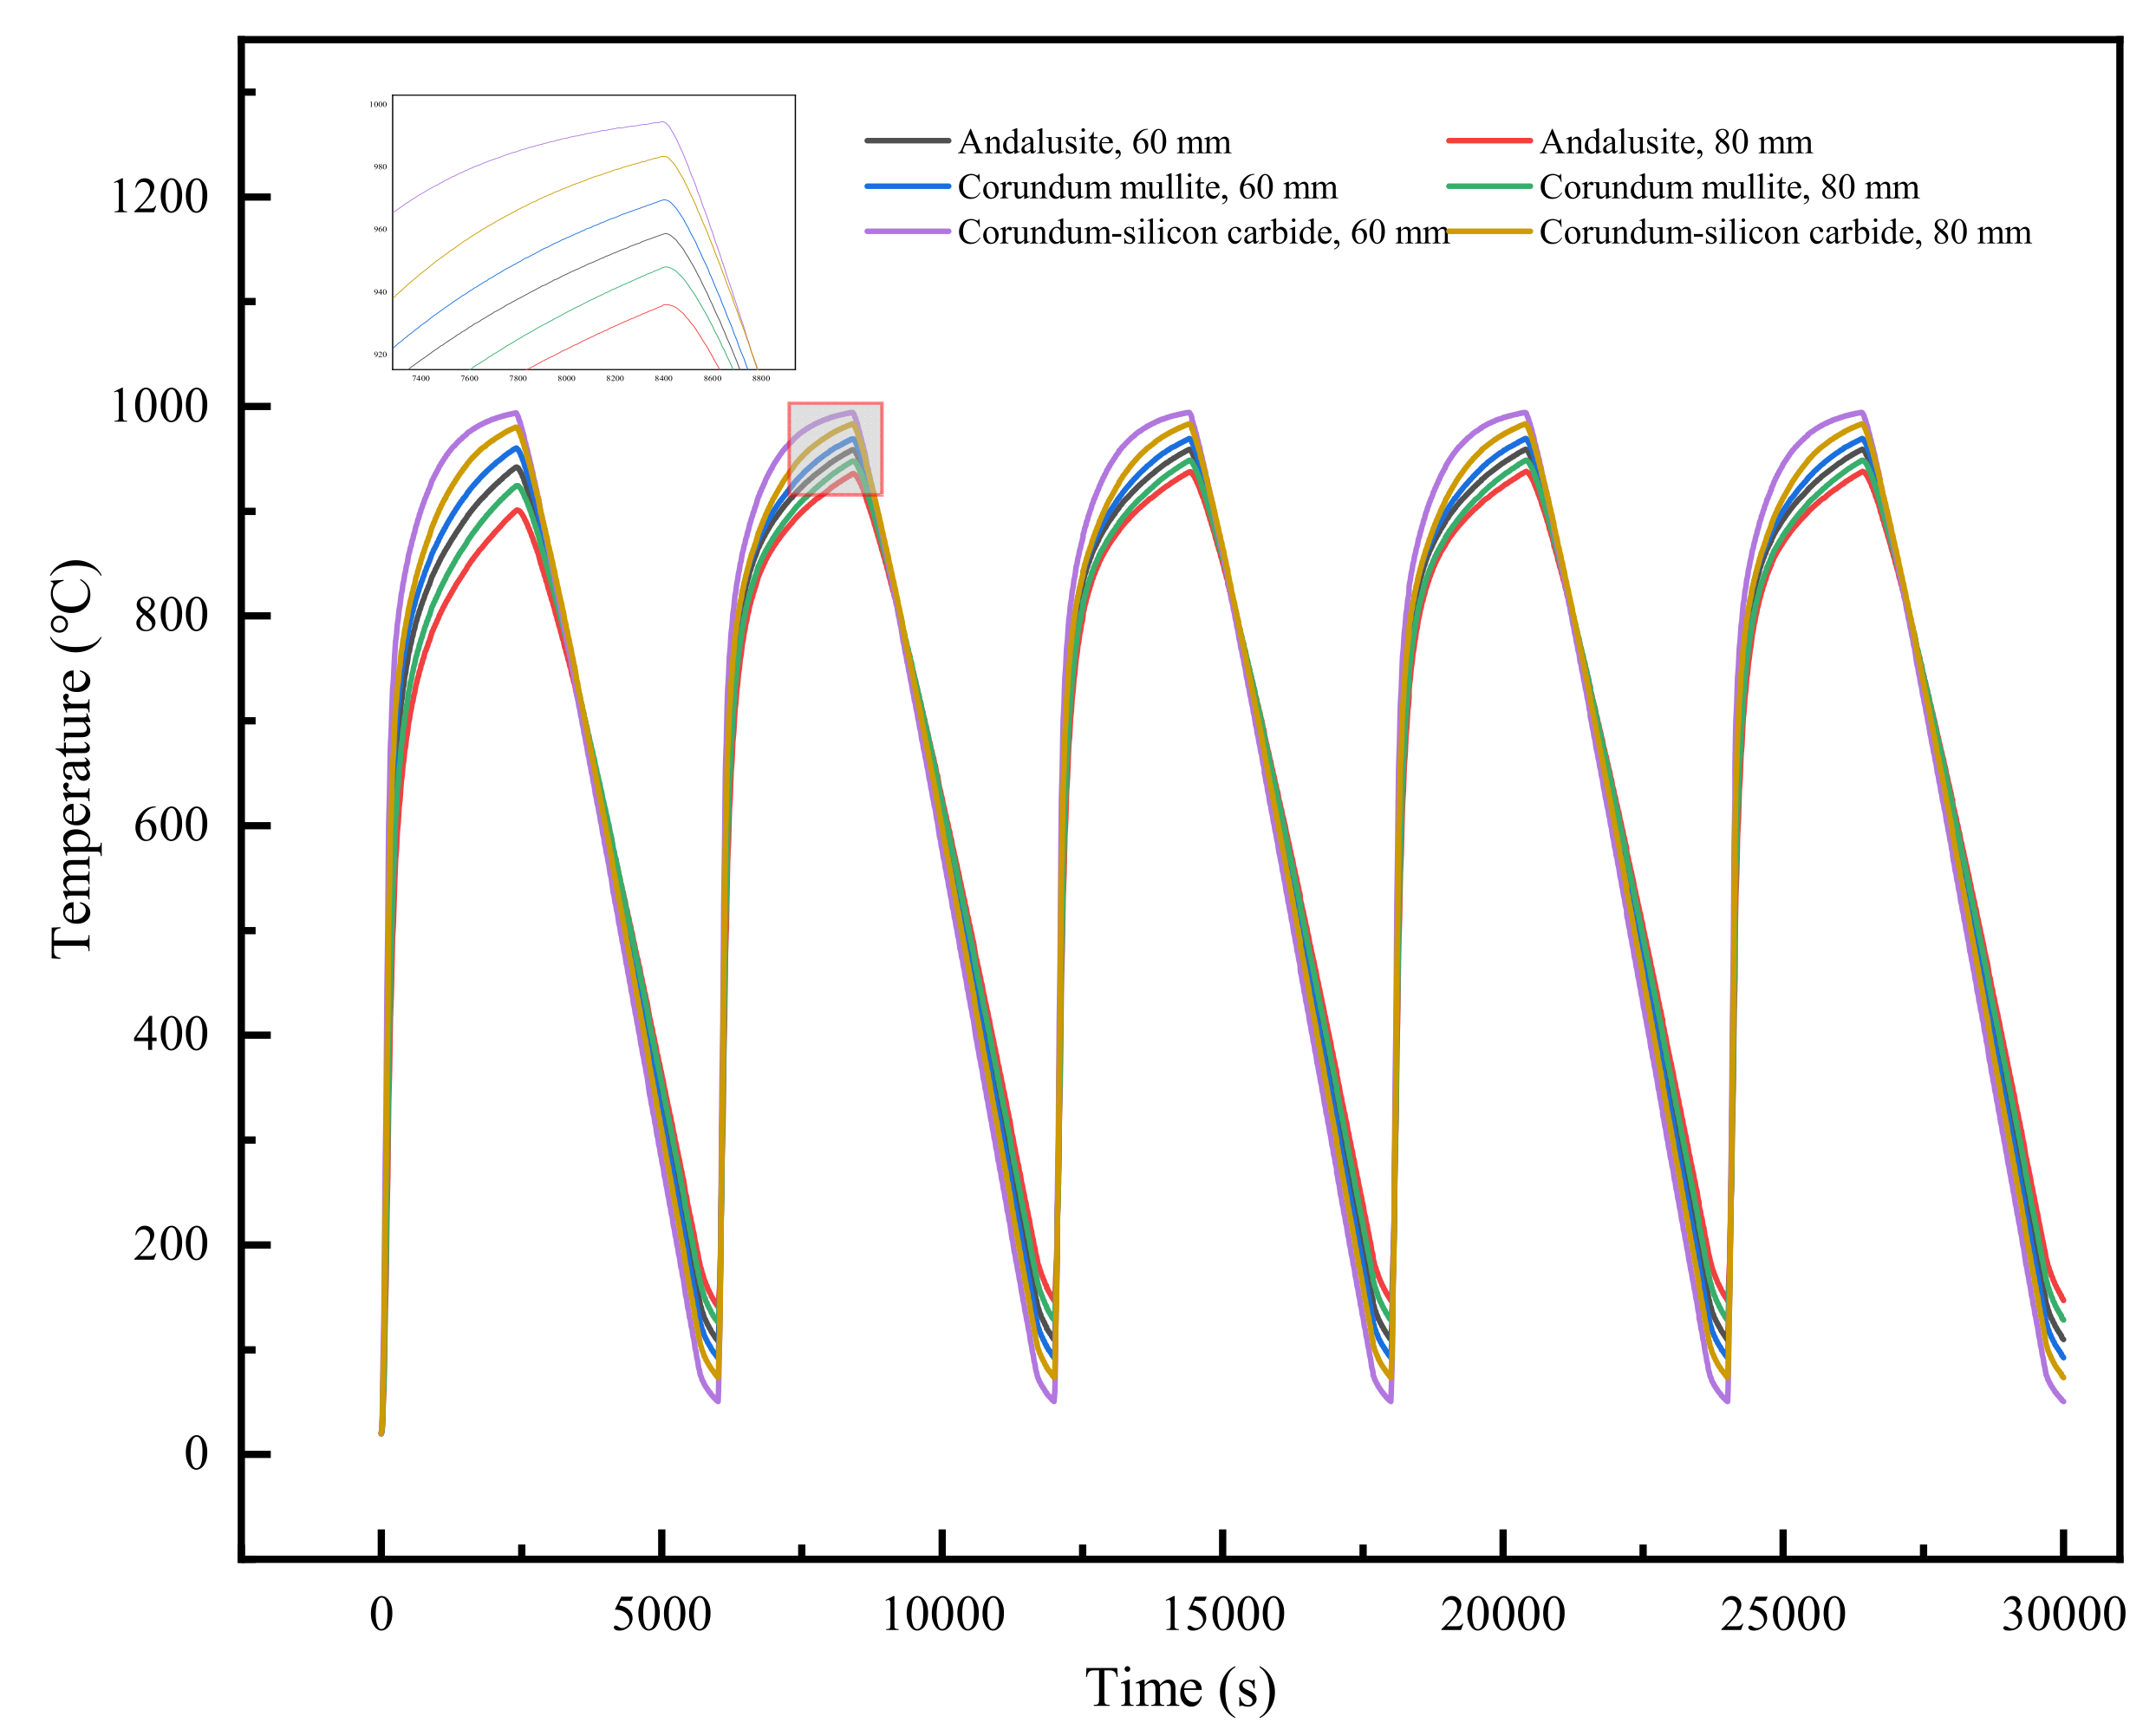
Figure 12.
Temperature variation in the center of the refractory bricks’ recesses.
Figure 12.
Temperature variation in the center of the refractory bricks’ recesses.
Figure 13.
Temperature contour profiles of structures with different brick materials and brick thicknesses. (a) Corundum–mullite, 60 mm; (b) corundum–mullite, 80 mm; (c) andalusite, 60 mm; (d) andalusite, 80 mm; (e) corundum–silicon carbide, 60 mm; and (f) corundum–silicon carbide, 80 mm.
Figure 13.
Temperature contour profiles of structures with different brick materials and brick thicknesses. (a) Corundum–mullite, 60 mm; (b) corundum–mullite, 80 mm; (c) andalusite, 60 mm; (d) andalusite, 80 mm; (e) corundum–silicon carbide, 60 mm; and (f) corundum–silicon carbide, 80 mm.
Figure 14.
Points of maximum vertical displacement for refractory bricks (corundum–silicon carbide). (a) Corundum–mullite, 60 mm; (b) corundum–mullite, 80 mm; (c) andalusite, 60 mm; (d) andalusite, 80 mm; (e) corundum–silicon carbide, 60 mm; and (f) corundum–silicon carbide, 80 mm.
Figure 14.
Points of maximum vertical displacement for refractory bricks (corundum–silicon carbide). (a) Corundum–mullite, 60 mm; (b) corundum–mullite, 80 mm; (c) andalusite, 60 mm; (d) andalusite, 80 mm; (e) corundum–silicon carbide, 60 mm; and (f) corundum–silicon carbide, 80 mm.
Figure 15.
Maximum principal compressive stress cloud of refractory bricks (T = 2400 s). (a) Corundum–mullite, 60 mm; (b) corundum–mullite, 80 mm; (c) andalusite, 60 mm; (d) andalusite, 80 mm; (e) corundum–silicon carbide, 60 mm; and (f) corundum–silicon carbide, 80 mm.
Figure 15.
Maximum principal compressive stress cloud of refractory bricks (T = 2400 s). (a) Corundum–mullite, 60 mm; (b) corundum–mullite, 80 mm; (c) andalusite, 60 mm; (d) andalusite, 80 mm; (e) corundum–silicon carbide, 60 mm; and (f) corundum–silicon carbide, 80 mm.
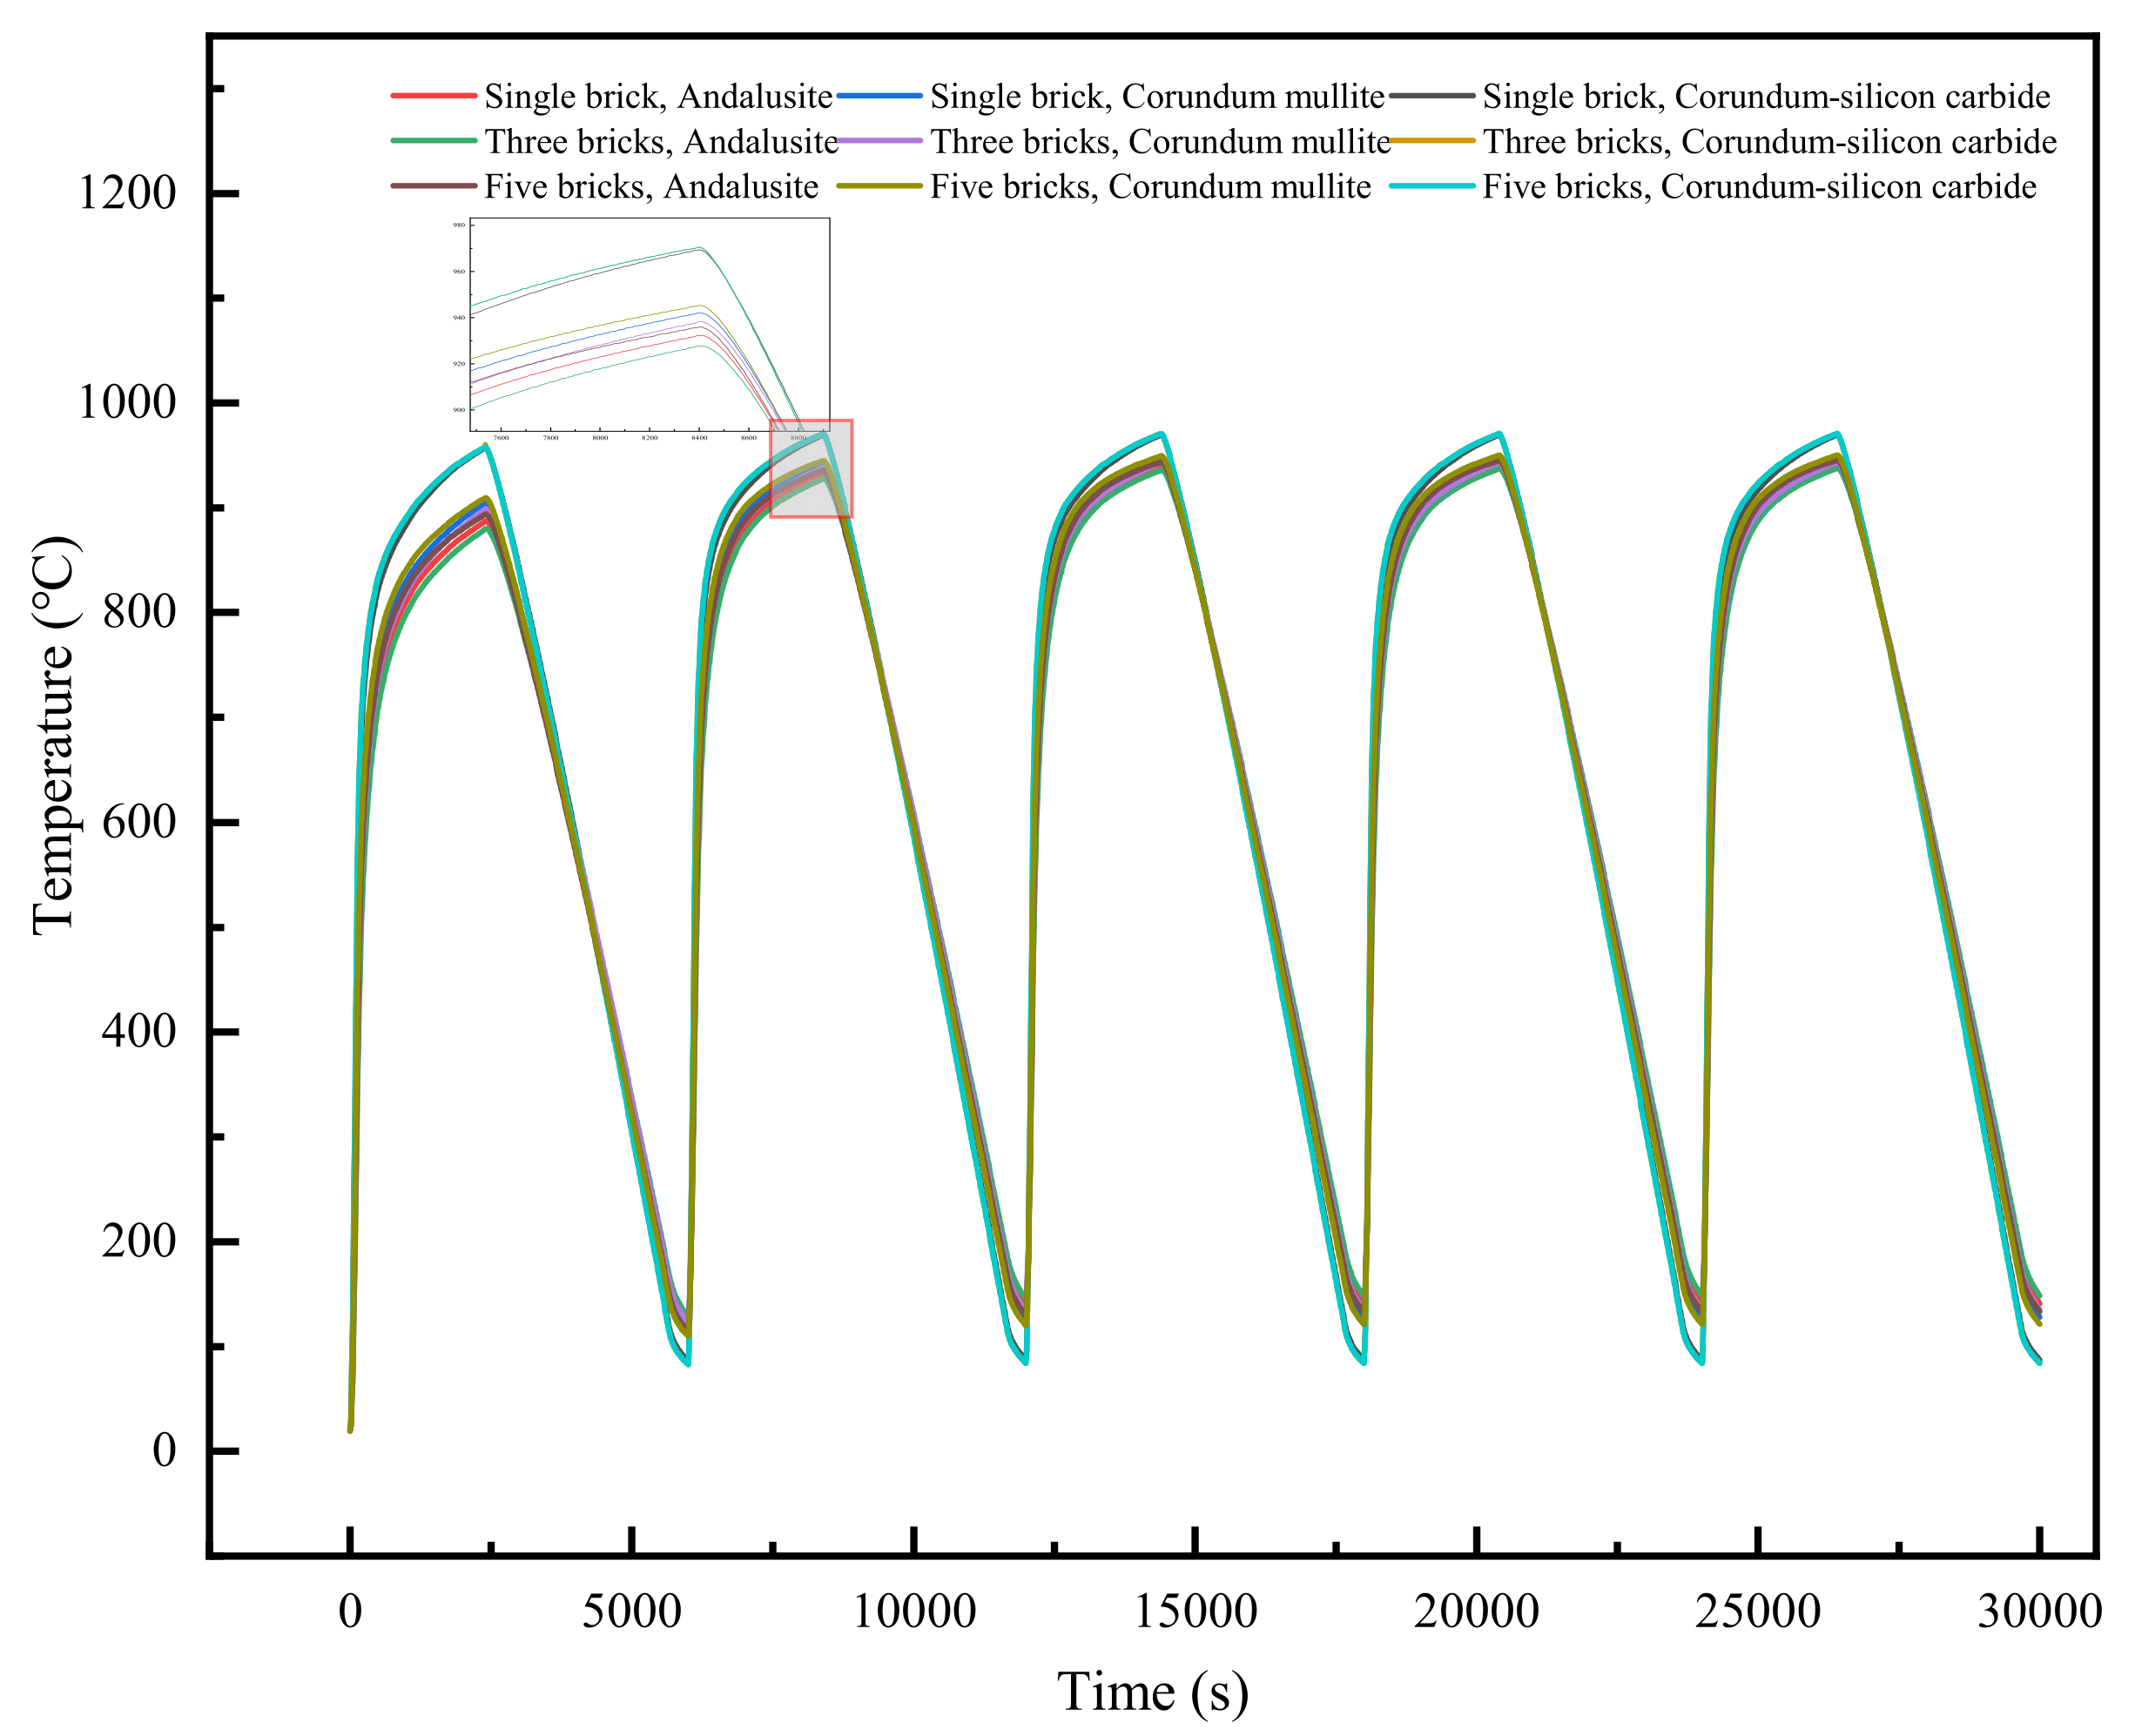
Figure 16.
Temperature variation in the center of the refractory bricks’ recesses.
Figure 16.
Temperature variation in the center of the refractory bricks’ recesses.
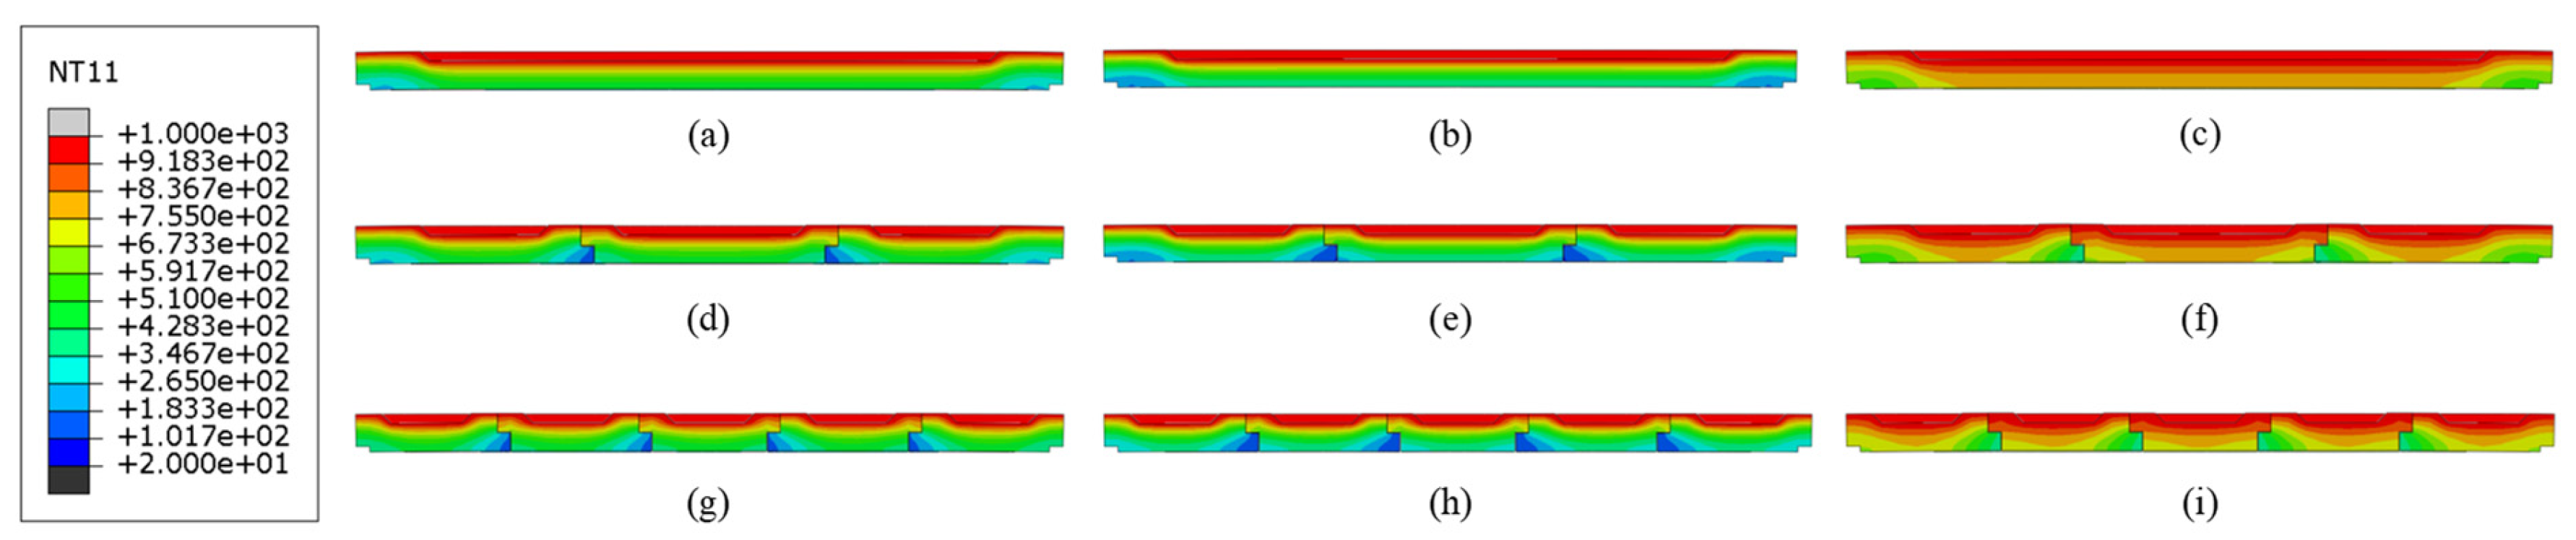
Figure 17.
Temperature contour profiles of structures with different brick materials and brick numbers. (a) Single brick, corundum–mullite; (b) single brick, andalusite; (c) single brick, corundum–silicon carbide; (d) three bricks, corundum–mullite; (e) three bricks, andalusite; (f) three bricks, corundum–silicon carbide; (g) five bricks, corundum–mullite; (h) five bricks, andalusite; and (i) five bricks, corundum–silicon carbide.
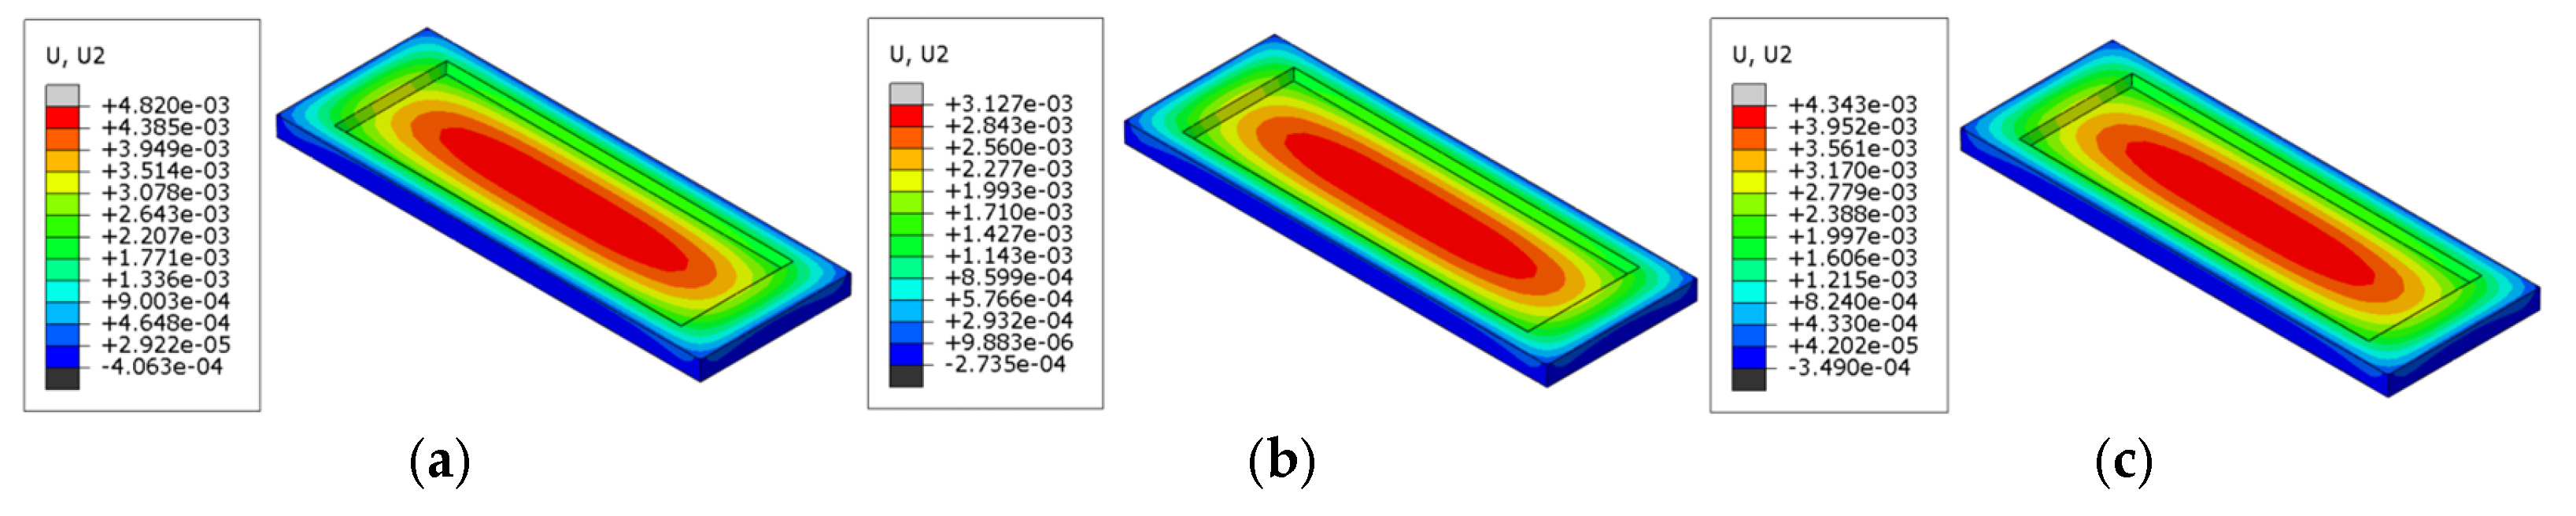
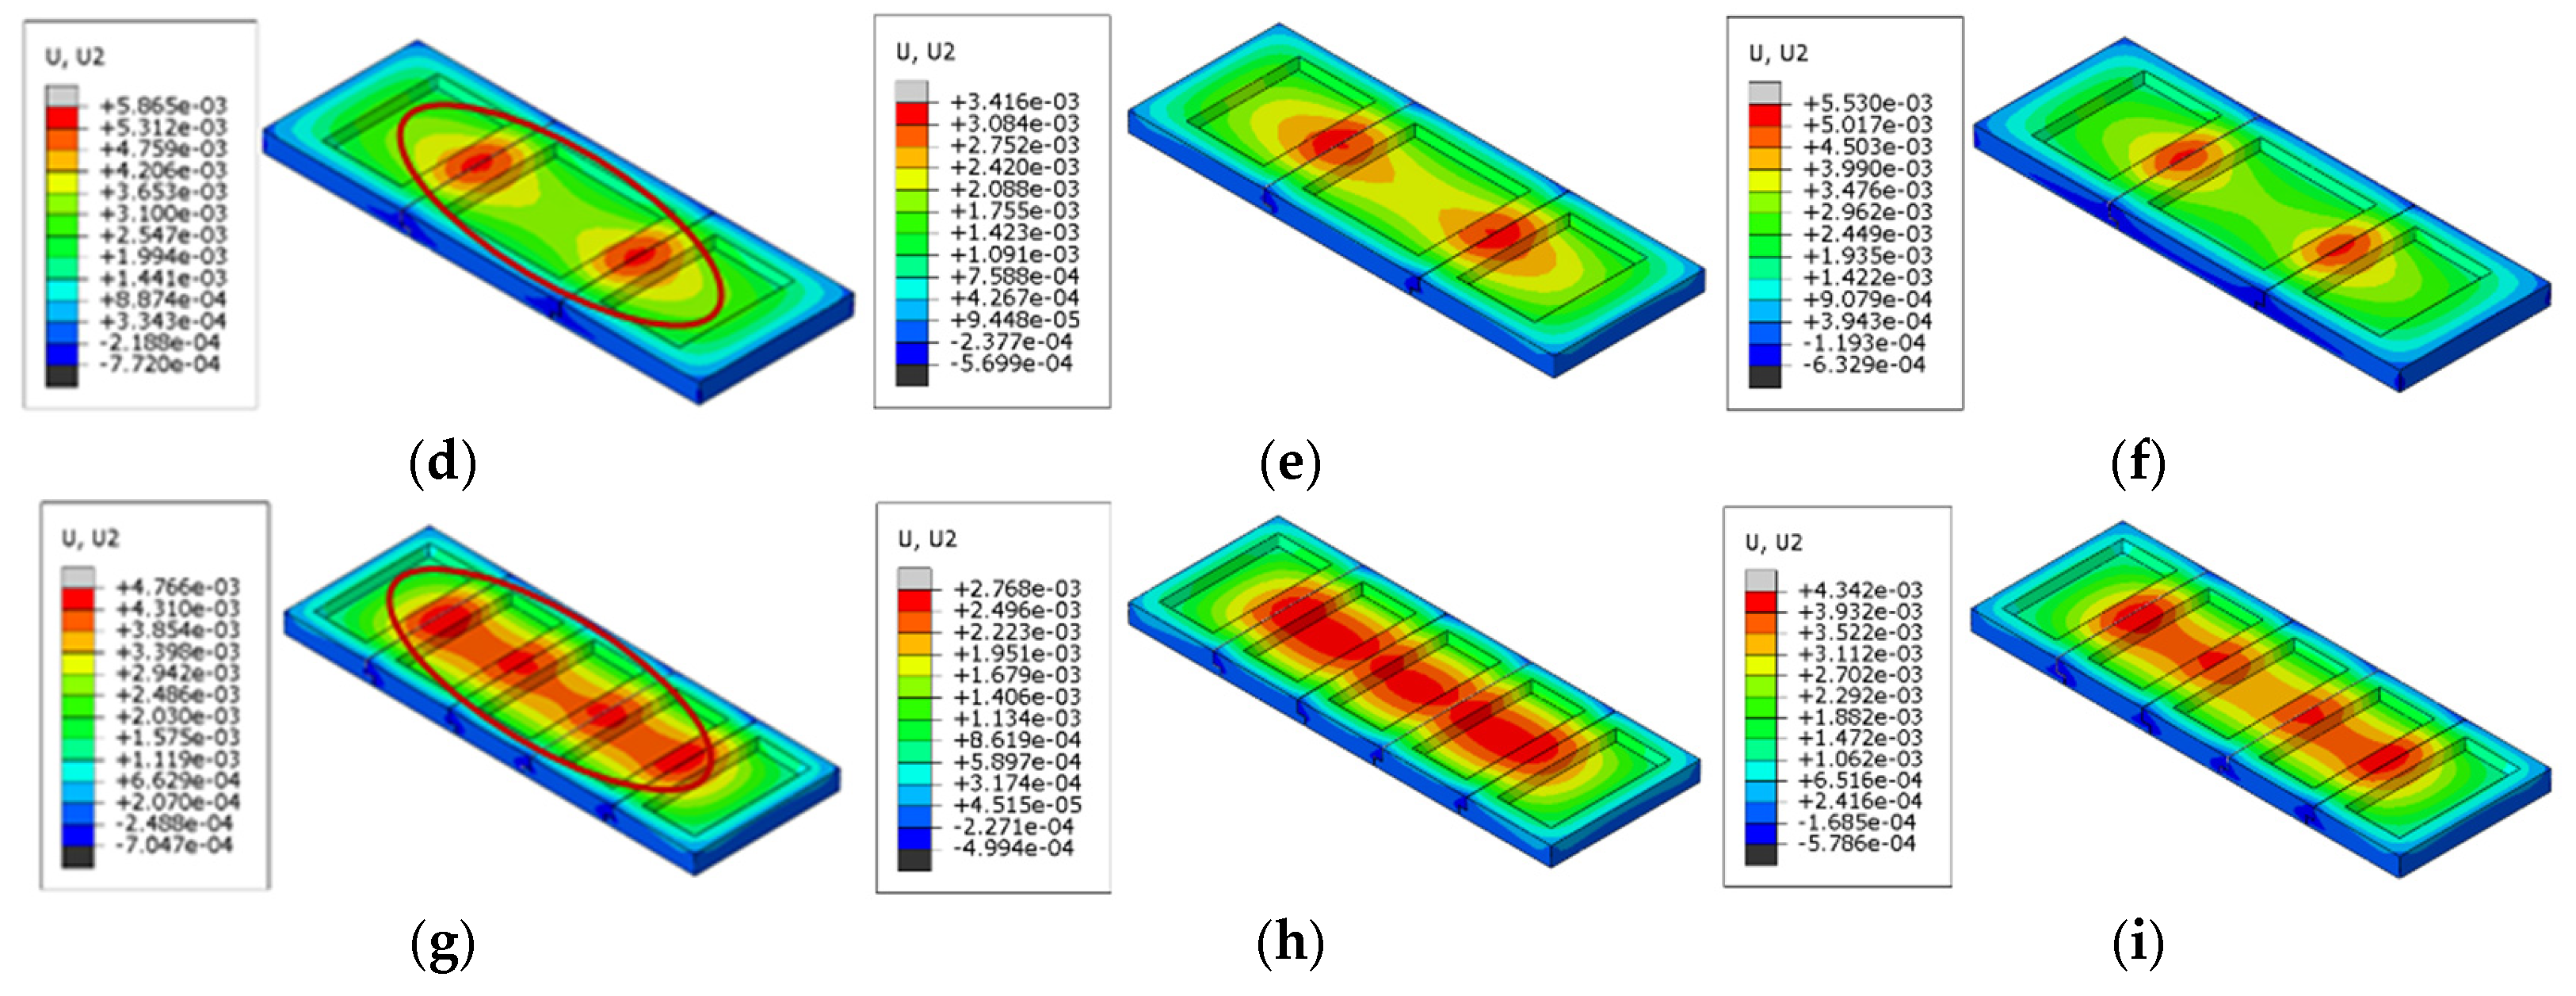
Figure 18.
Points of maximum vertical displacement for refractory bricks (corundum-silicon carbide). (a) Single brick, corundum-mullite; (b) single brick, andalusite; (c) single brick, corundum-silicon carbide; (d) three bricks, corundum-mullite; (e) three bricks, andalusite; (f) three bricks, corundum-silicon carbide; (g) five bricks, corundum-mullite; (h) five bricks, andalusite; and (i) five bricks, corundum-silicon carbide.
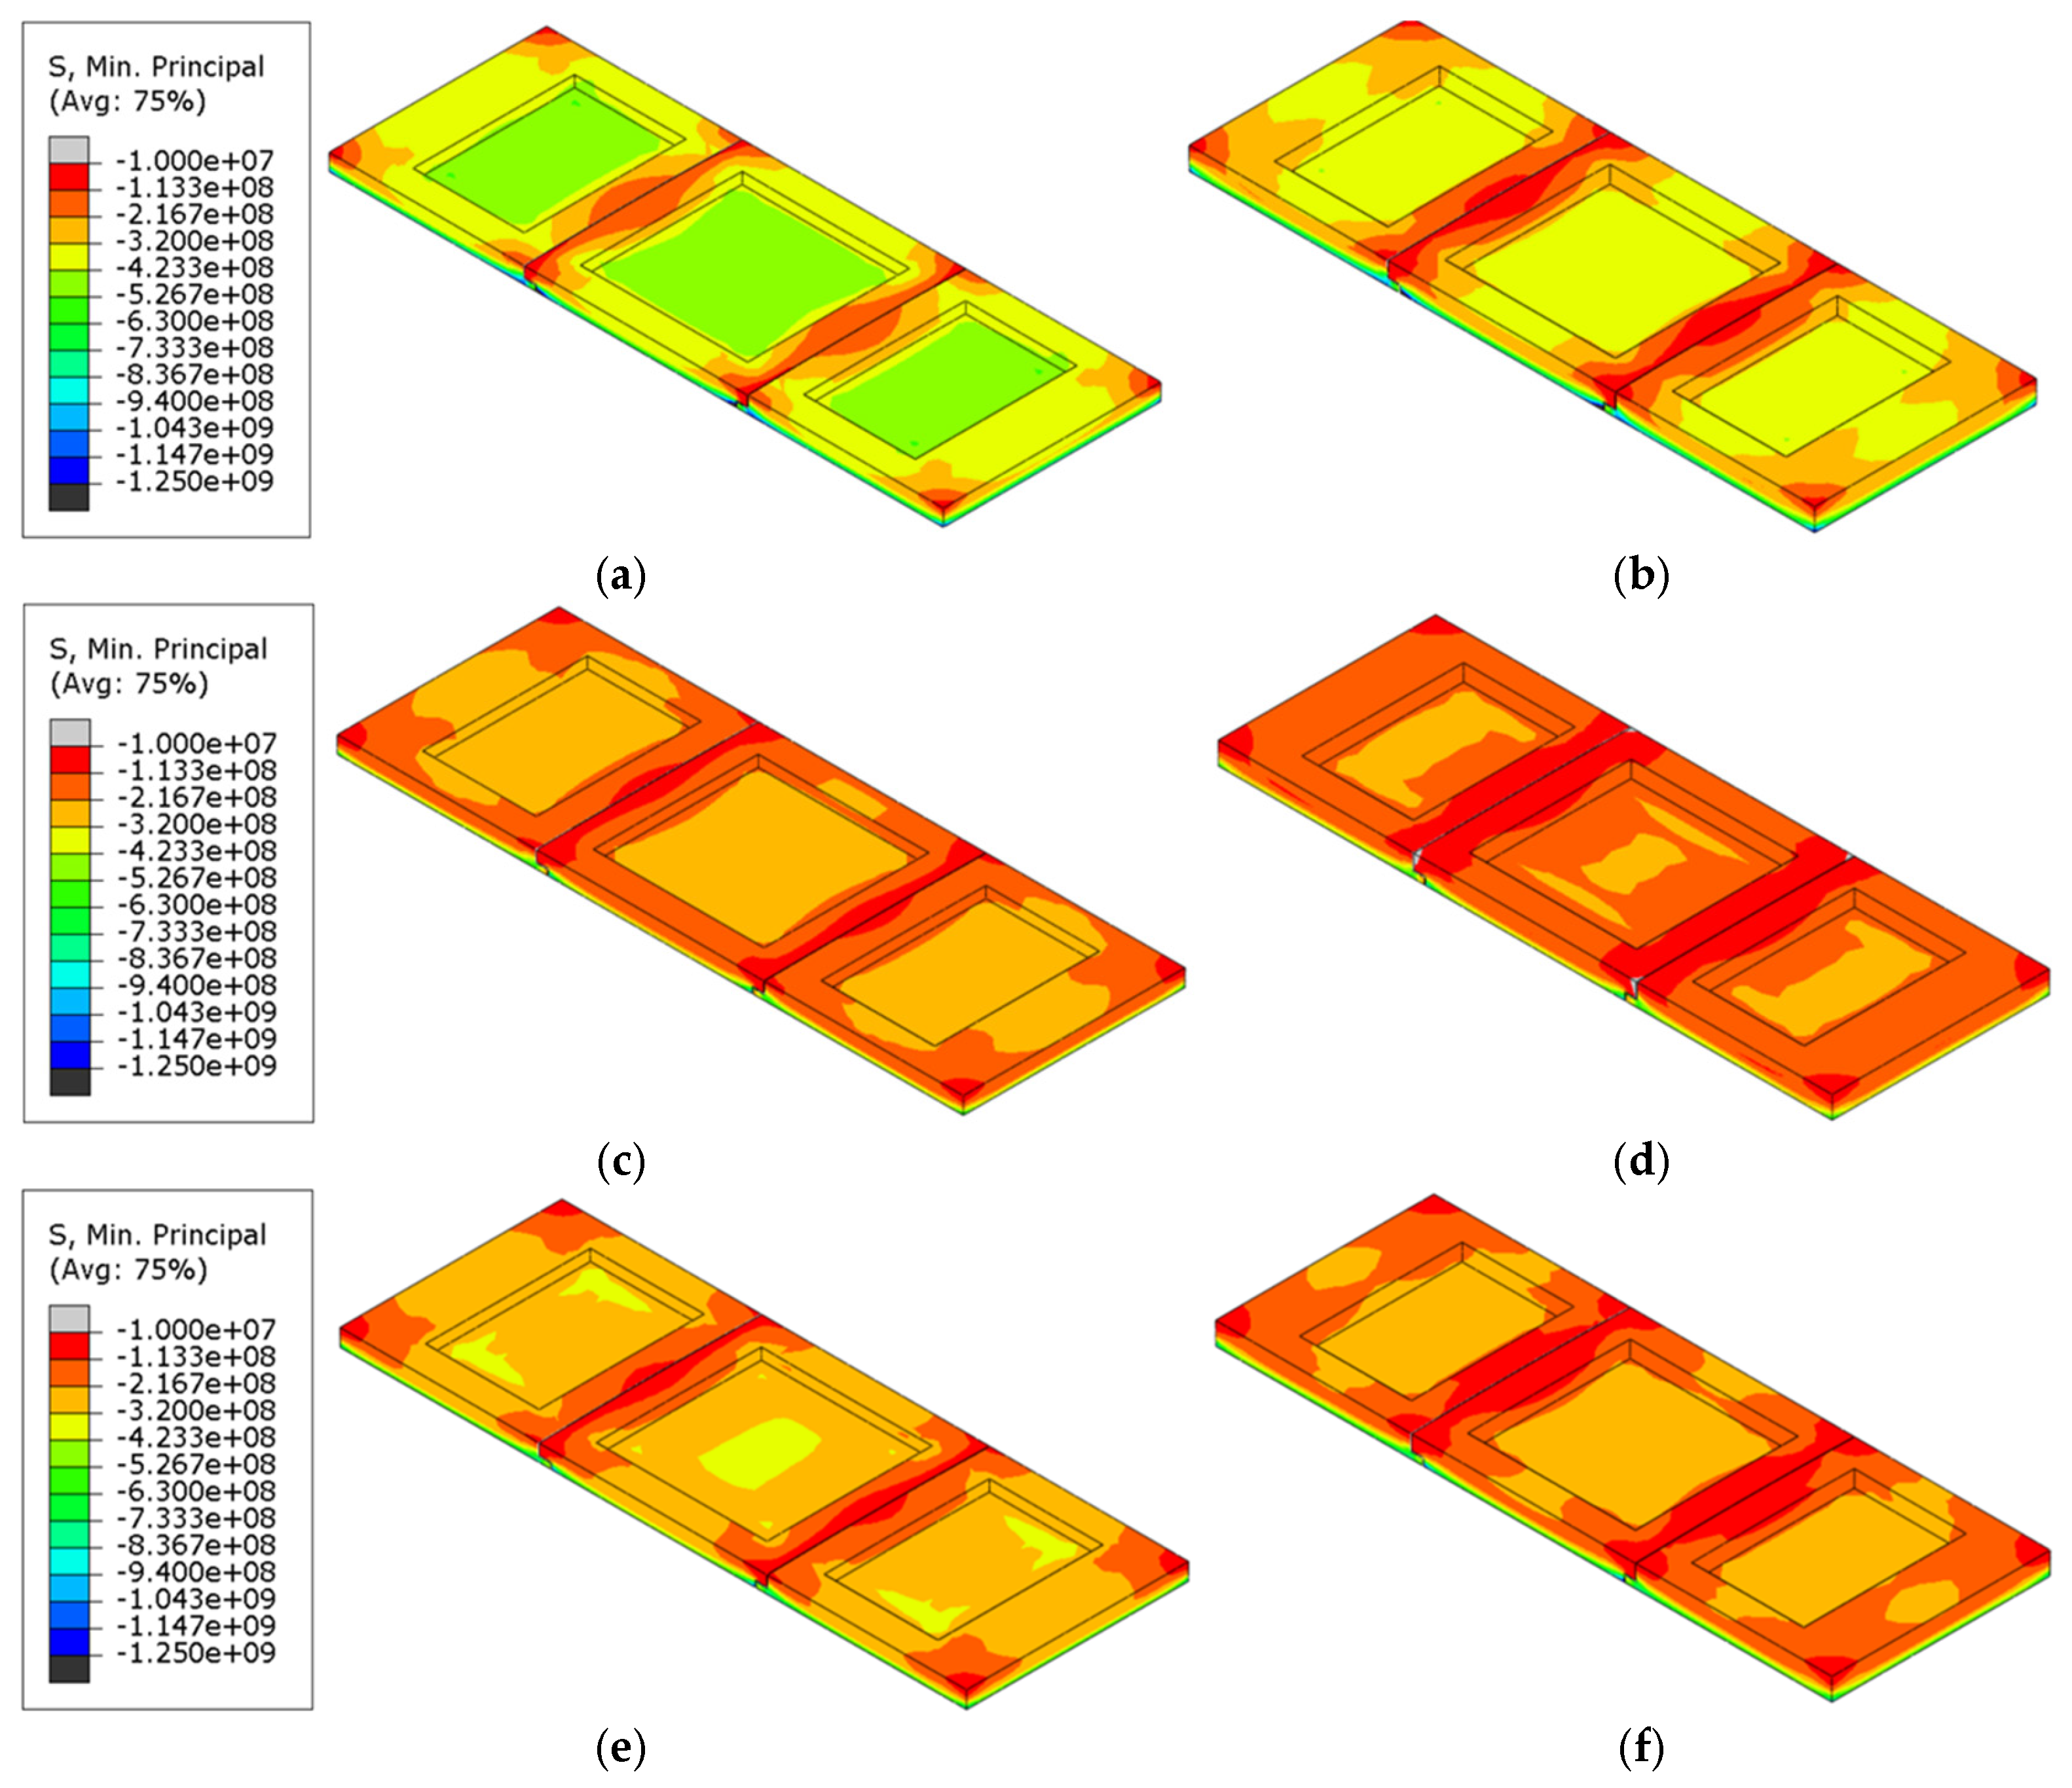
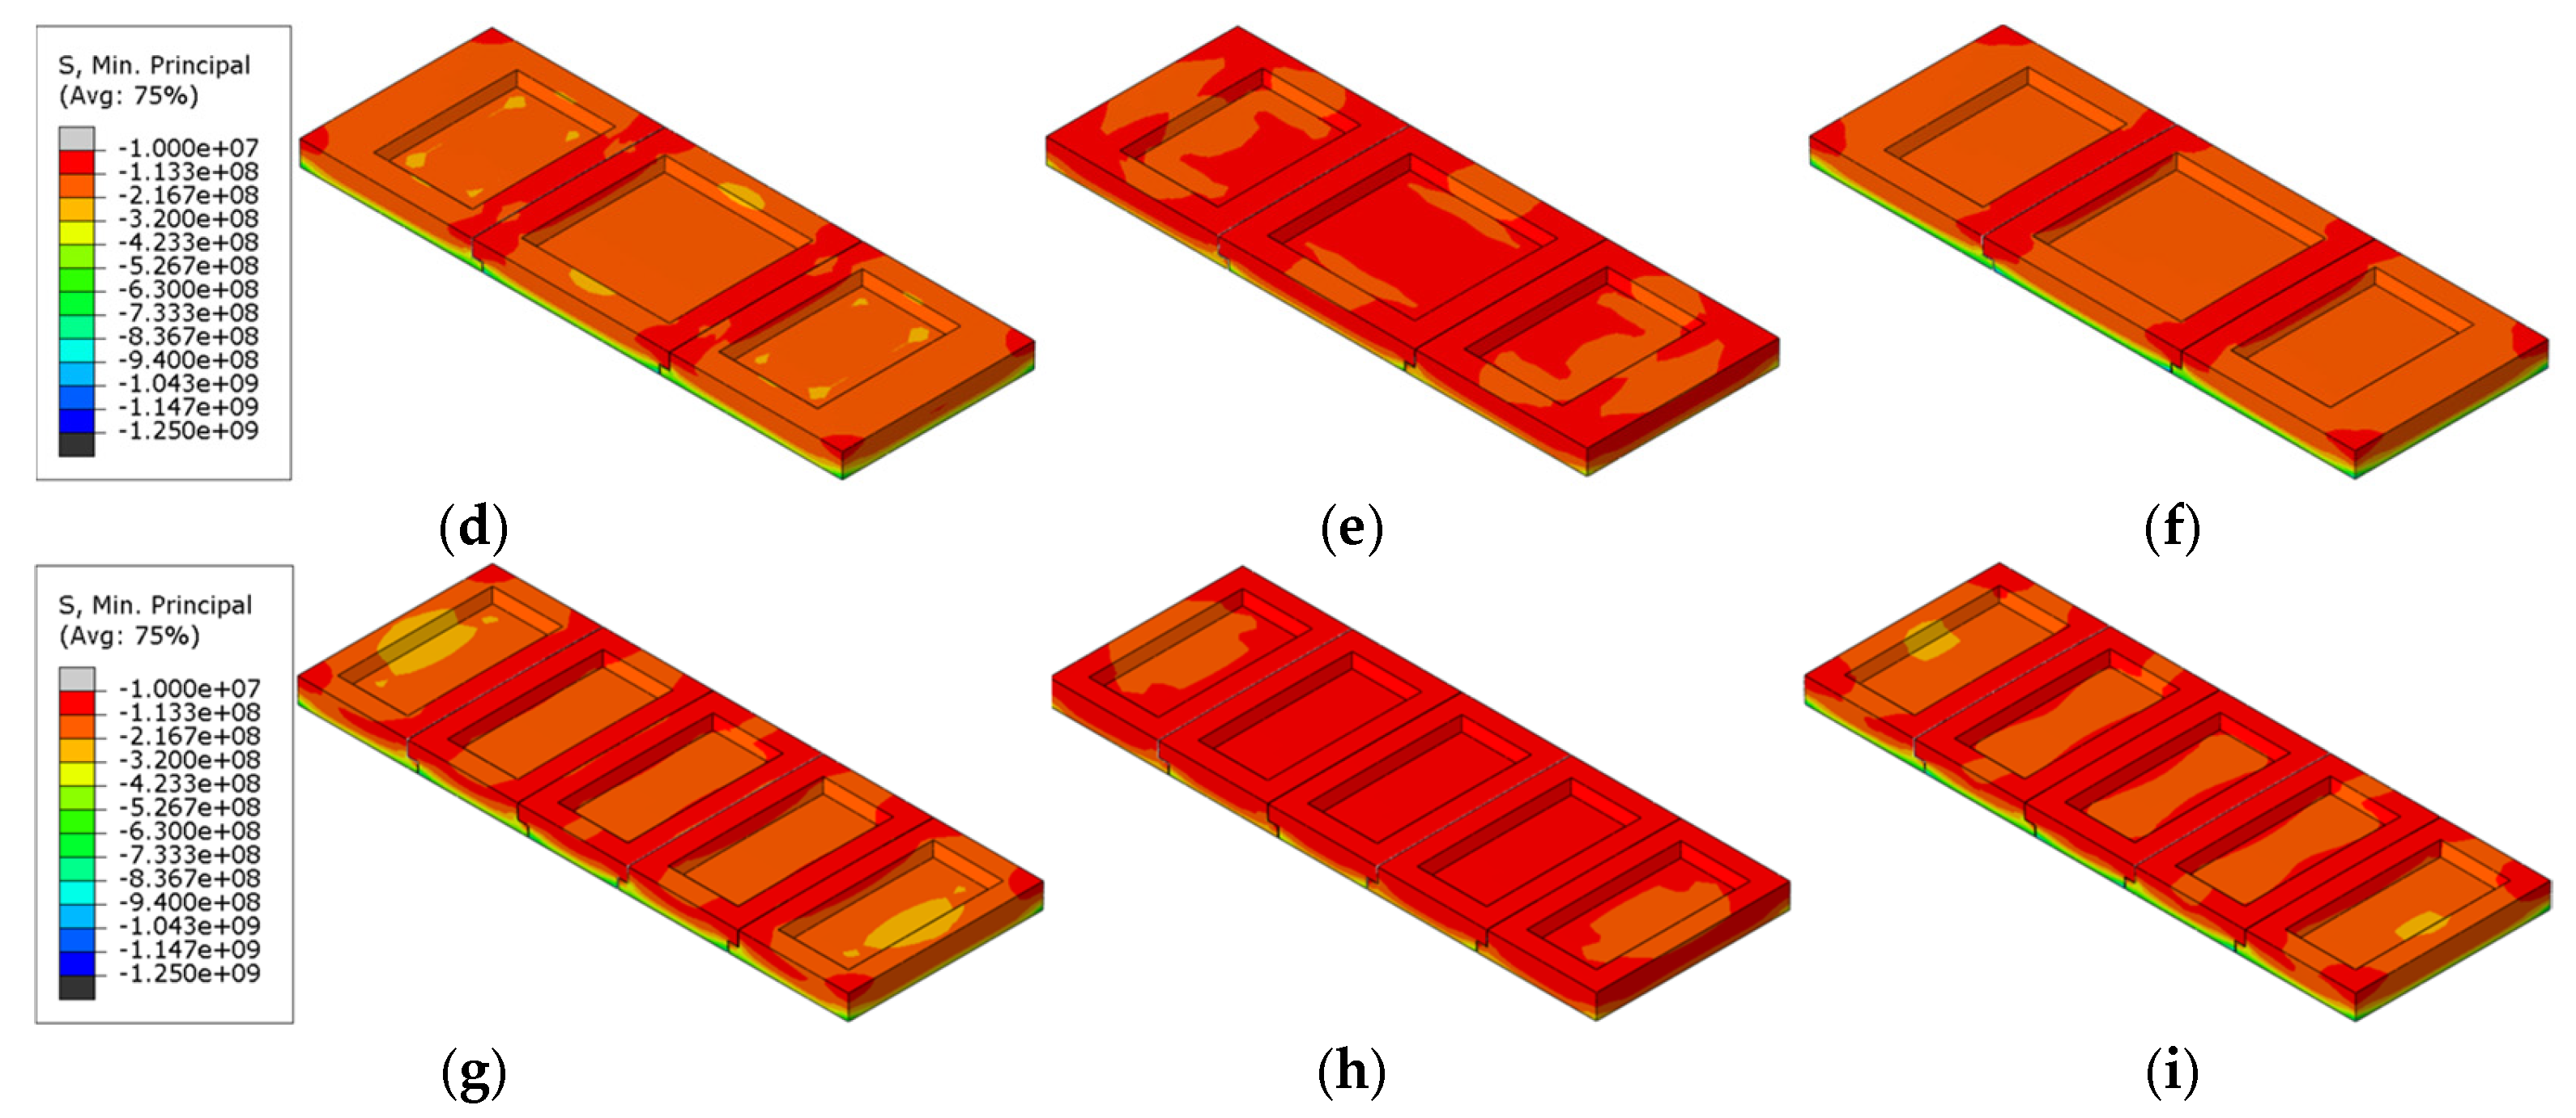
Figure 19.
Maximum principal compressive stress cloud of refractory bricks (T = 2400 s). (a) Single brick, corundum-mullite; (b) single brick, andalusite; (c) single brick, corundum-silicon carbide; (d) three bricks, corundum-mullite; (e) three bricks, andalusite; (f) three bricks, corundum-silicon carbide; (g) five bricks, corundum-mullite; (h) five bricks, andalusite; and (i) five bricks, corundum-silicon carbide.
Table 1.
Specific input parameters in the FEM of refractory bricks.
Table 1.
Specific input parameters in the FEM of refractory bricks.
| Factors | Material | Brick Number | Brick Thickness (mm) |
|---|
| Brick number and brick thickness | Corundum–silicon carbide | Single, three, and five | 60, 80, and 100 |
| Material and brick thickness | Corundum–mullite, andalusite, and corundum–silicon carbide | Three | 60, 80, and 100 |
| Brick number and material | Corundum–mullite, andalusite, and corundum–silicon carbide | Single, three, and five | 100 |
Table 2.
Parameters of refractory materials.
Table 2.
Parameters of refractory materials.
| Items | Corundum–Mullite | Andalusite | Corundum–Silicon Carbide |
|---|
| Density (g·cm−3) | 2.90 | 2.53 | 2.98 |
| Young’s modulus (Pa) | 42 × 109 | 37 × 109 | 45 × 109 |
| Poisson’s ratio | 0.3 | 0.3 | 0.3 |
| Specific heat [J/(kgK)] | 700 | 650 | 700 |
| Thermal conductivity [W/(m·K)] | 2.3 | 1.5 | 4.6 |
| Thermal expansion coefficient (K−1) | 6.3 × 10⁻⁶ | 4.3 × 10⁻⁶ | 5.5 × 10⁻⁶ |
Table 3.
Comparison of brick numbers and brick thicknesses.
Table 3.
Comparison of brick numbers and brick thicknesses.
| Number | Brick Number | Brick Thickness (mm) |
|---|
| 1 | Single brick | 60 |
| 2 | Single brick | 80 |
| 3 | Three bricks | 60 |
| 4 | Three bricks | 80 |
| 5 | Five bricks | 60 |
| 6 | Five bricks | 80 |
Table 4.
Comparison of the maximum values of vertical displacement for different model parameters.
Table 4.
Comparison of the maximum values of vertical displacement for different model parameters.
| Number | Model Parameters | Maximum Vertical Displacement (mm) |
|---|
| 1 | Single brick, 60 mm | 1.30 |
| 2 | Single brick, 80 mm | 2.49 |
| 3 | Three bricks, 60 mm | 5.68 |
| 4 | Three bricks, 80 mm | 5.88 |
| 5 | Five bricks, 60 mm | 5.75 |
| 6 | Five bricks, 80 mm | 5.85 |
Table 5.
Comparison of maximum values of principal compressive stress.
Table 5.
Comparison of maximum values of principal compressive stress.
| Number | Model Parameters | Maximum Principal Compressive Stress (MPa) |
|---|
| 1 | Single brick, 60 mm | 895.8 |
| 2 | Single brick, 80 mm | 1061 |
| 3 | Three bricks, 60 mm | 1155 |
| 4 | Three bricks, 80 mm | 1243 |
| 5 | Five bricks, 60 mm | 1019 |
| 6 | Five bricks, 80 mm | 1064 |
Table 6.
Comparison of brick materials and brick thicknesses.
Table 6.
Comparison of brick materials and brick thicknesses.
| Number | Material | Brick Thickness (mm) |
|---|
| 1 | Corundum–mullite | 60 |
| 2 | Corundum–mullite | 80 |
| 3 | Andalusite | 60 |
| 4 | Andalusite | 80 |
| 5 | Corundum–silicon carbide | 60 |
| 6 | Corundum–silicon carbide | 80 |
Table 7.
Comparison of the maximum vertical displacement values for different model parameters.
Table 7.
Comparison of the maximum vertical displacement values for different model parameters.
| Number | Model Parameters | Maximum Vertical Displacement (mm) |
|---|
| 1 | Corundum–mullite, 60 mm | 5.23 |
| 2 | Corundum–mullite, 80 mm | 5.55 |
| 3 | Andalusite, 60 mm | 3.20 |
| 4 | Andalusite, 80 mm | 3.32 |
| 5 | Corundum–silicon carbide, 60 mm | 5.68 |
| 6 | Corundum–silicon carbide, 80 mm | 5.88 |
Table 8.
Comparison of maximum values of principal compressive stresses.
Table 8.
Comparison of maximum values of principal compressive stresses.
| Number | Model Parameters | Maximum Principal Compressive Stress (MPa) |
|---|
| 1 | Corundum–mullite, 60 mm | 1147 |
| 2 | Corundum–mullite, 80 mm | 1235 |
| 3 | Andalusite, 60 mm | 701.6 |
| 4 | Andalusite, 80 mm | 742.5 |
| 5 | Corundum–silicon carbide, 60 mm | 1155 |
| 6 | Corundum–silicon carbide, 80 mm | 1243 |
Table 9.
Comparison of brick numbers and brick thicknesses.
Table 9.
Comparison of brick numbers and brick thicknesses.
| Number | Brick Number | Material |
|---|
| 1 | Single brick | Corundum–mullite |
| 2 | Single brick | Andalusite |
| 3 | Single brick | Corundum–silicon carbide |
| 4 | Three bricks | Corundum–mullite |
| 5 | Three bricks | Andalusite |
| 6 | Three bricks | Corundum–silicon carbide |
| 7 | Five bricks | Corundum–mullite |
| 8 | Five bricks | Andalusite |
| 9 | Five bricks | Corundum–silicon carbide |
Table 10.
Comparison of maximum vertical displacement values for different model parameters.
Table 10.
Comparison of maximum vertical displacement values for different model parameters.
| Number | Model Parameters | Maximum Vertical Displacement (mm) |
|---|
| 1 | Single brick, corundum-mullite | 4.82 |
| 2 | Single brick, andalusite | 3.13 |
| 3 | Single brick, corundum-silicon carbide | 4.34 |
| 4 | Three bricks, corundum-mullite | 5.87 |
| 5 | Three bricks, andalusite | 3.42 |
| 6 | Three bricks, corundum-silicon carbide | 5.53 |
| 7 | Five bricks, corundum-mullite | 4.77 |
| 8 | Five bricks, andalusite | 2.77 |
| 9 | Five bricks, corundum-silicon carbide | 4.34 |
Table 11.
Comparison of maximum values of principal compressive stresses.
Table 11.
Comparison of maximum values of principal compressive stresses.
| Number | Model Parameters | Maximum Principal Compressive Stress (MPa) |
|---|
| 1 | Single brick, corundum-mullite | 1215 |
| 2 | Single brick, andalusite | 712.5 |
| 3 | Single brick, corundum-silicon carbide | 1213 |
| 4 | Three bricks, corundum-mullite | 1258 |
| 5 | Three bricks, andalusite | 773.5 |
| 6 | Three bricks, corundum-silicon carbide | 1276 |
| 7 | Five bricks, corundum-mullite | 1103 |
| 8 | Five bricks, andalusite | 661.8 |
| 9 | Five bricks, corundum-silicon carbide | 1118 |


