


Strategies for Minimizing Environmental Impact in Construction: A Case Study of a Cementitious 3D Printed Lost Formwork for a Staircase †

Abstract
1. Introduction
2. Materials and Methods
2.1. Goal and Scope
2.2. Life Cycle Inventory (LCI)
2.3. Life Cycle Impact Assessment (LCIA)
3. Results and Interpretation
3.1. Results
3.2. Interpretation and Dominance Analysis
4. Discussion
4.1. Cement Datasets
4.2. Energy Datasets
5. Conclusions and Outlook
Author Contributions
Funding
Institutional Review Board Statement
Informed Consent Statement
Data Availability Statement
Acknowledgments
Conflicts of Interest
Abbreviations
| 3DPCC | 3D printed concrete |
| AP | Acidification Potential |
| CED | cumulative energy demand |
| E-LCA | Environmental Life Cycle Assessment |
| EPD | Environmental Product Declaration |
| EP-freshwater | eutrophication potential—aquatic freshwater |
| EP-marine | eutrophication potential—aquatic marine |
| EP-terrestrial | eutrophication potential—terrestrial |
| GGBFS | ground granulated blast furnace slag |
| GWP | Global Warming Potential |
| IPCC | Intergovernmental Panel on Climate Change |
| LCA | Life Cycle Assessment |
| LCI | Life Cycle Inventory |
| LCIA | Life Cycle Impact Assessment |
| ODP | Ozone Depletion Potential |
| PE | primary energy resources |
| PENRT | total use of non-renewable primary energy resources |
| PERT | total use of renewable primary energy resources |
| POCP | Photochemical Ozone Creation Potential |
| SCA | Selective Cement Activation |
| WMO | World Meteorological Organization |
References
- Brucker Juricic, B.; Galic, M.; Marenjak, S. Review of the Construction Labour Demand and Shortages in the EU. Buildings 2021, 11, 17. [Google Scholar] [CrossRef]
- United Nations Environment Programme. Global Status Report for Buildings and Construction—Beyond Foundations: MainStreaming Sustainable Solutions to Cut Emissions from the Buildings Sector; United Nations Environment Programme: Nairobi, Kenya, 2024. [Google Scholar]
- Statista Research Department. Available online: https://www.statista.com/topics/5466/global-housing-market/#topicOverview (accessed on 25 October 2024).
- Circle Economy Foundation. The Circularity Gap Report; Circle Economy Foundation: Amsterdam, The Netherlands, 2024. [Google Scholar]
- United Nations Environment Programme. Global Status Report for Buildings and Construction: Towards a Zero-Emissions, Efficient and Resilient Buildings and Construction Sector; United Nations Environment Programme: Nairobi, Kenya, 2022. [Google Scholar]
- UNEP/SETAC Life Cycle Initiative. In Towards a Life Cycle Sustainability Assessment: Making Informed Choices on Products; UNEP: Brussels, Belgium, 2011; pp. 1–5.
- Hauschild, M.Z.; Rosenbaum, R.K.; Olsen, S.I. Life Cycle Assessment: Theory and practice, 1st ed.; Springer Nature: Cham, Switzerland, 2018. [Google Scholar] [CrossRef]
- DIN EN 15804:2022-03; Sustainability of Construction Works—Environmental Product Declarations—Core Rules for the Product Category of Construction Products. Beuth: Berlin, Germany, 2022.
- García de Soto, B.; Agustí-Juan, I.; Hunhevicz, J.; Joss, S.; Graser, K.; Habert, G.; Adey, B.T. Productivity of digital fabrication in construction: Cost and time analysis of a robotically built wall. Autom. Constr. 2018, 92, 297–311. [Google Scholar] [CrossRef]
- Agustí-Juan, I.; Müller, F.; Hack, N.; Wangler, T.; Habert, G. Potential benefits of digital fabrication for complex structures: Environmental assessment of a robotically fabricated concrete wall. J. Clean. Prod. 2017, 154, 330–340. [Google Scholar] [CrossRef]
- Balasbaneh, A.T.; Sher, W.; Ibrahim, M.H.W. Life cycle assessment and economic analysis of Reusable formwork materials considering the circular economy. Ain Shams Eng. J. 2024, 15, 102585. [Google Scholar] [CrossRef]
- Bakırhan, E.K.; Kayılı, M.T. Evaluation of the Environmental Impact of Formwork Systems Depending on the Service Life and Cost Analysis. CRPASE Trans. Civ. Environ. Eng. 2023, 9, 1–10. [Google Scholar] [CrossRef]
- ISO 14040: 2006; Environmental Management—Life Cycle Assessment—Principles and Framework. Beuth: Berlin, Germany, 2022.
- ISO 14044: 2006; Environmental Management—Life Cycle Assessment— Requirements and Guidelines. Beuth: Berlin, Germany, 2022.
- Herding, F.; Mai, I.; Lowke, D. Reduction of the cement content in Selective Cement Activation. Ce/papers 2023, 6, 790–796. [Google Scholar] [CrossRef]
- Dirk Lowke, D.; Talke, D.; Dressler, I.; Weger, D.; Gehlen, C.; Ostertag, C.; Rael, R. Particle bed 3D printing by selective cement activation—Applications, material and process technology. Cem. Concr. Res. 2020, 134, 106077. [Google Scholar] [CrossRef]
- Albrecht, S.V.; Hellerbrand, S.; Weininger, F.; Thiel, C. Possibilities for Reducing the Environmental Impact in the Construction Industry Using the Example of a 3D Printed Staircase. In Proceedings of the 4th International Conference on Sustainable Development in Civil, Urban and Transportation Engineering, CUTE 2024, Wrocław, Poland, 14–17 October 2024; Springer Nature: Singapore, 2024. [Google Scholar]
- Fonseca, M.; Matos, A.M. 3D Construction Printing Standing for Sustainability and Circularity: Material-Level Opportunities. Materials 2023, 16, 2458. [Google Scholar] [CrossRef] [PubMed]
- IEA; WBCSD. Cement Technology Roadmap 2009 Carbon Emissions Reductions Up to 2050; WBCSD: Paris, France; Conches: Geneva, Switzerland, 2009. [Google Scholar]
- Bhagath Singh, G.V.P.; Durga Prasad, V. Environmental impact of concrete containing high volume fly ash and ground granulated blast furnace slag. J. Clean. Prod. 2024, 448, 141729. [Google Scholar] [CrossRef]
- Krause, T.; Ulke, B. Zahlentafeln für den Baubetrieb, 9th ed.; Springer: Wiesbaden, Germany, 2016. [Google Scholar]
- European Comission. International Reference Life Cycle Data System (ILCD) Handbook: Recommendations for Life Cycle Impact Assessment in the European Context: Based on Existing Environmental Impact Assessment Models and Factors, 1st ed.; Publications Office: Luxembourg, 2011; Available online: https://data.europa.eu/doi/10.2788/33030 (accessed on 25 November 2024).
- Acero, A.P.; Rodríguez, C.; Ciroth, A. LCIA methods: Impact Assessment Methods in Life Cycle Assessment and Their Impact Categories; GreenDelta: Berlin, Germany, 2016. [Google Scholar]
- Boulay, A.M.; Bare, J.; Benini, L.; Berger, M.; Lathuillière, M.J.; Manzardo, A.; Margni, M.; Motoshita, M.; Núnez, M.; Pastor, A.V.; et al. The WULCA consensus characterization model for water scarcity footprints: Assessing impacts of water consumption based on available water remaining (AWARE). Int. J. Life Cycle Assess 2018, 23, 368–378. [Google Scholar] [CrossRef]
- Hischier, R.; Weidema, B.; Althaus, H.-J.; Bauer, C.; Doka, G.; Dones, R.; Frischknecht, R.; Hellweg, S.; Humbert, S.; Jungbluth, N.; et al. Implementation of Life Cycle Impact Assessment Methods; Ecoinvent Report No. 3, v2.2; Swiss Centre for Life Cycle Inventories: Dübendorf, Switzerland, 2010. [Google Scholar]
- United Nations Environment Programme. Building Materials and the Climate: Constructing a New Future; United Nations Environment Programme: Nairobi, Kenya, 2023. [Google Scholar]
- Poudyal, L.; Adhikari, K. Environmental sustainability in cement industry: An integrated approach for green and economical cement production. Resour. Environ. Sustain. 2021, 4, 100024. [Google Scholar] [CrossRef]
- Batuecas, E.; Liendo, F.; Tommasi, T.; Bensaid, S.; Deorsola, F.A.; Fino, D. Recycling CO2 from flue gas for CaCO3 nanoparticles production as cement filler: A life cycle assessment. J. CO2 Util. 2021, 45, 101446. [Google Scholar] [CrossRef]
- Stemmermann, P.; Schweike, U.; Garbev, K.; Beuchle, G. Celitement—A sustainable prospect for the cement industry. Cem. Int. 2010, 8, 52–67. [Google Scholar]
- Kuzmenko, K. Environmental Performance in Construction: A Case-Study of 3D Concrete Printing Technology. Ph.D. Thesis, École des Ponts ParisTech, Champs-sur-Marne, France, 2021. [Google Scholar]
- Hong, J.; Shen, G.Q.; Feng, Y.; Lau, W.S.; Mao, C. Greenhouse gas emissions during the construction phase of a building: A case study in China. J. Clean. Prod. 2015, 103, 249–259. [Google Scholar] [CrossRef]
- Beton Umweltproduktdeklarationen. Available online: https://www.beton.org/betonbau/planungshilfen/umweltproduktdeklarationen/ (accessed on 25 November 2024).
- AMC TRR 277. Available online: https://amc-trr277.de/projects/project-area-c/focus-area-c-09/ (accessed on 29 November 2024).


| Name | Type of Formwork | Material for Formwork |
|---|---|---|
| Scenario 1 | Conventional one-time use wood formwork | plywood |
| Scenario 2 | Conventional one-time use wood formwork | timber |
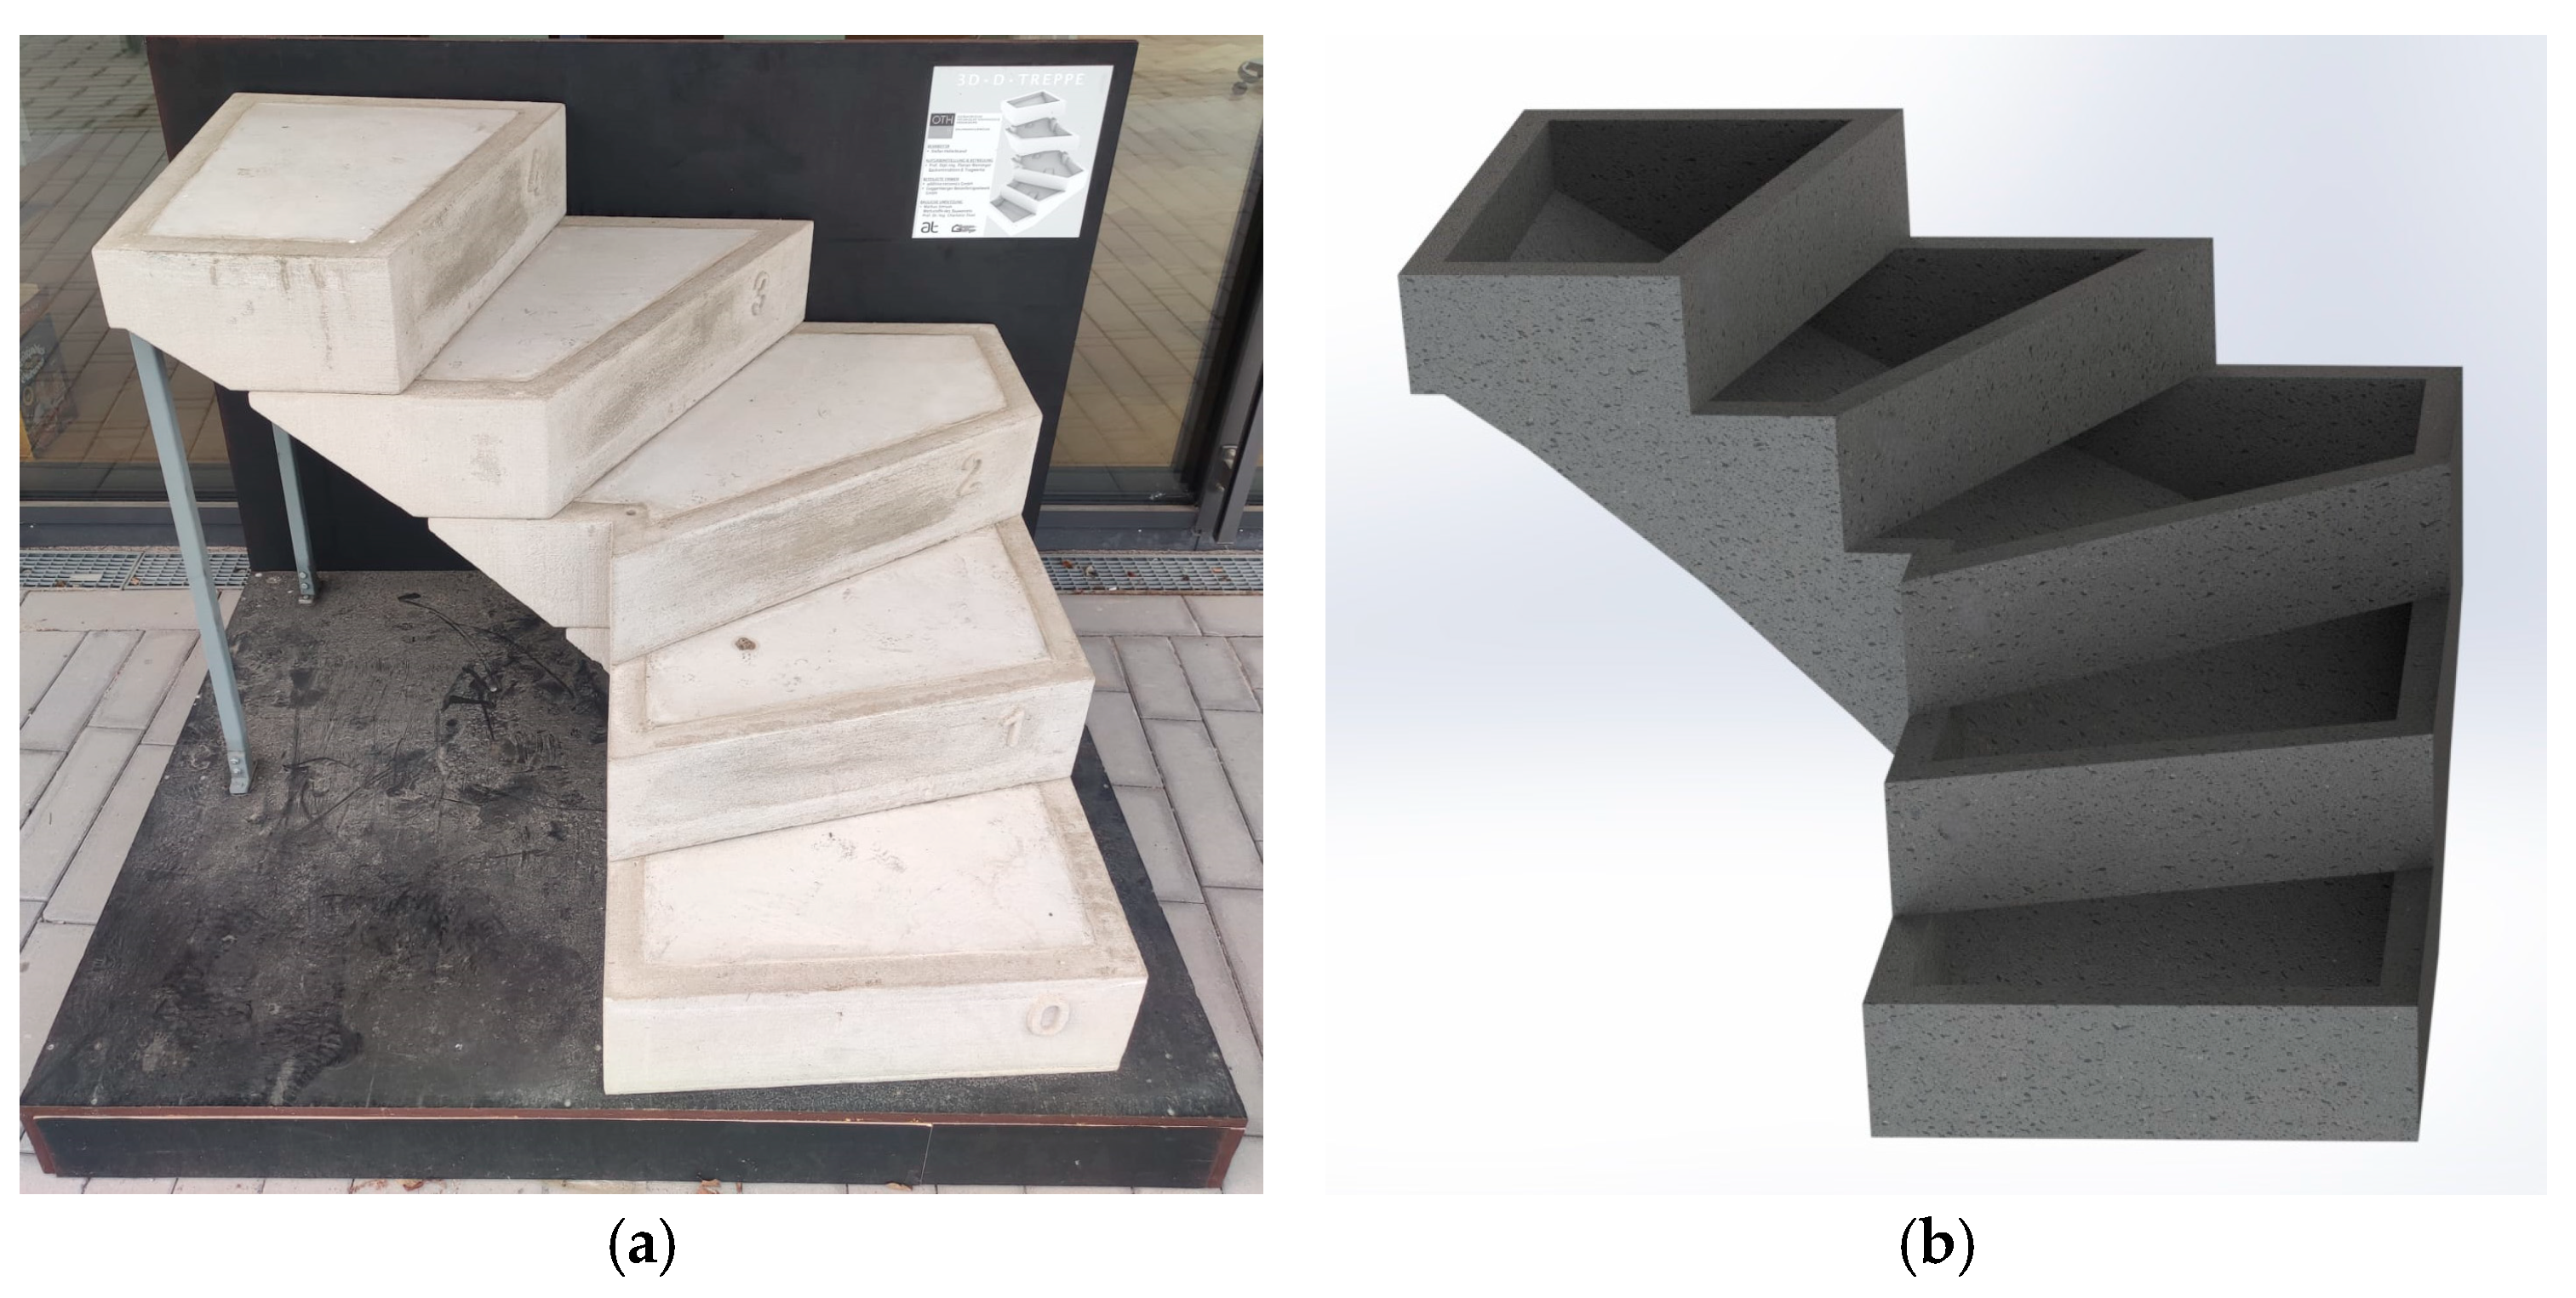
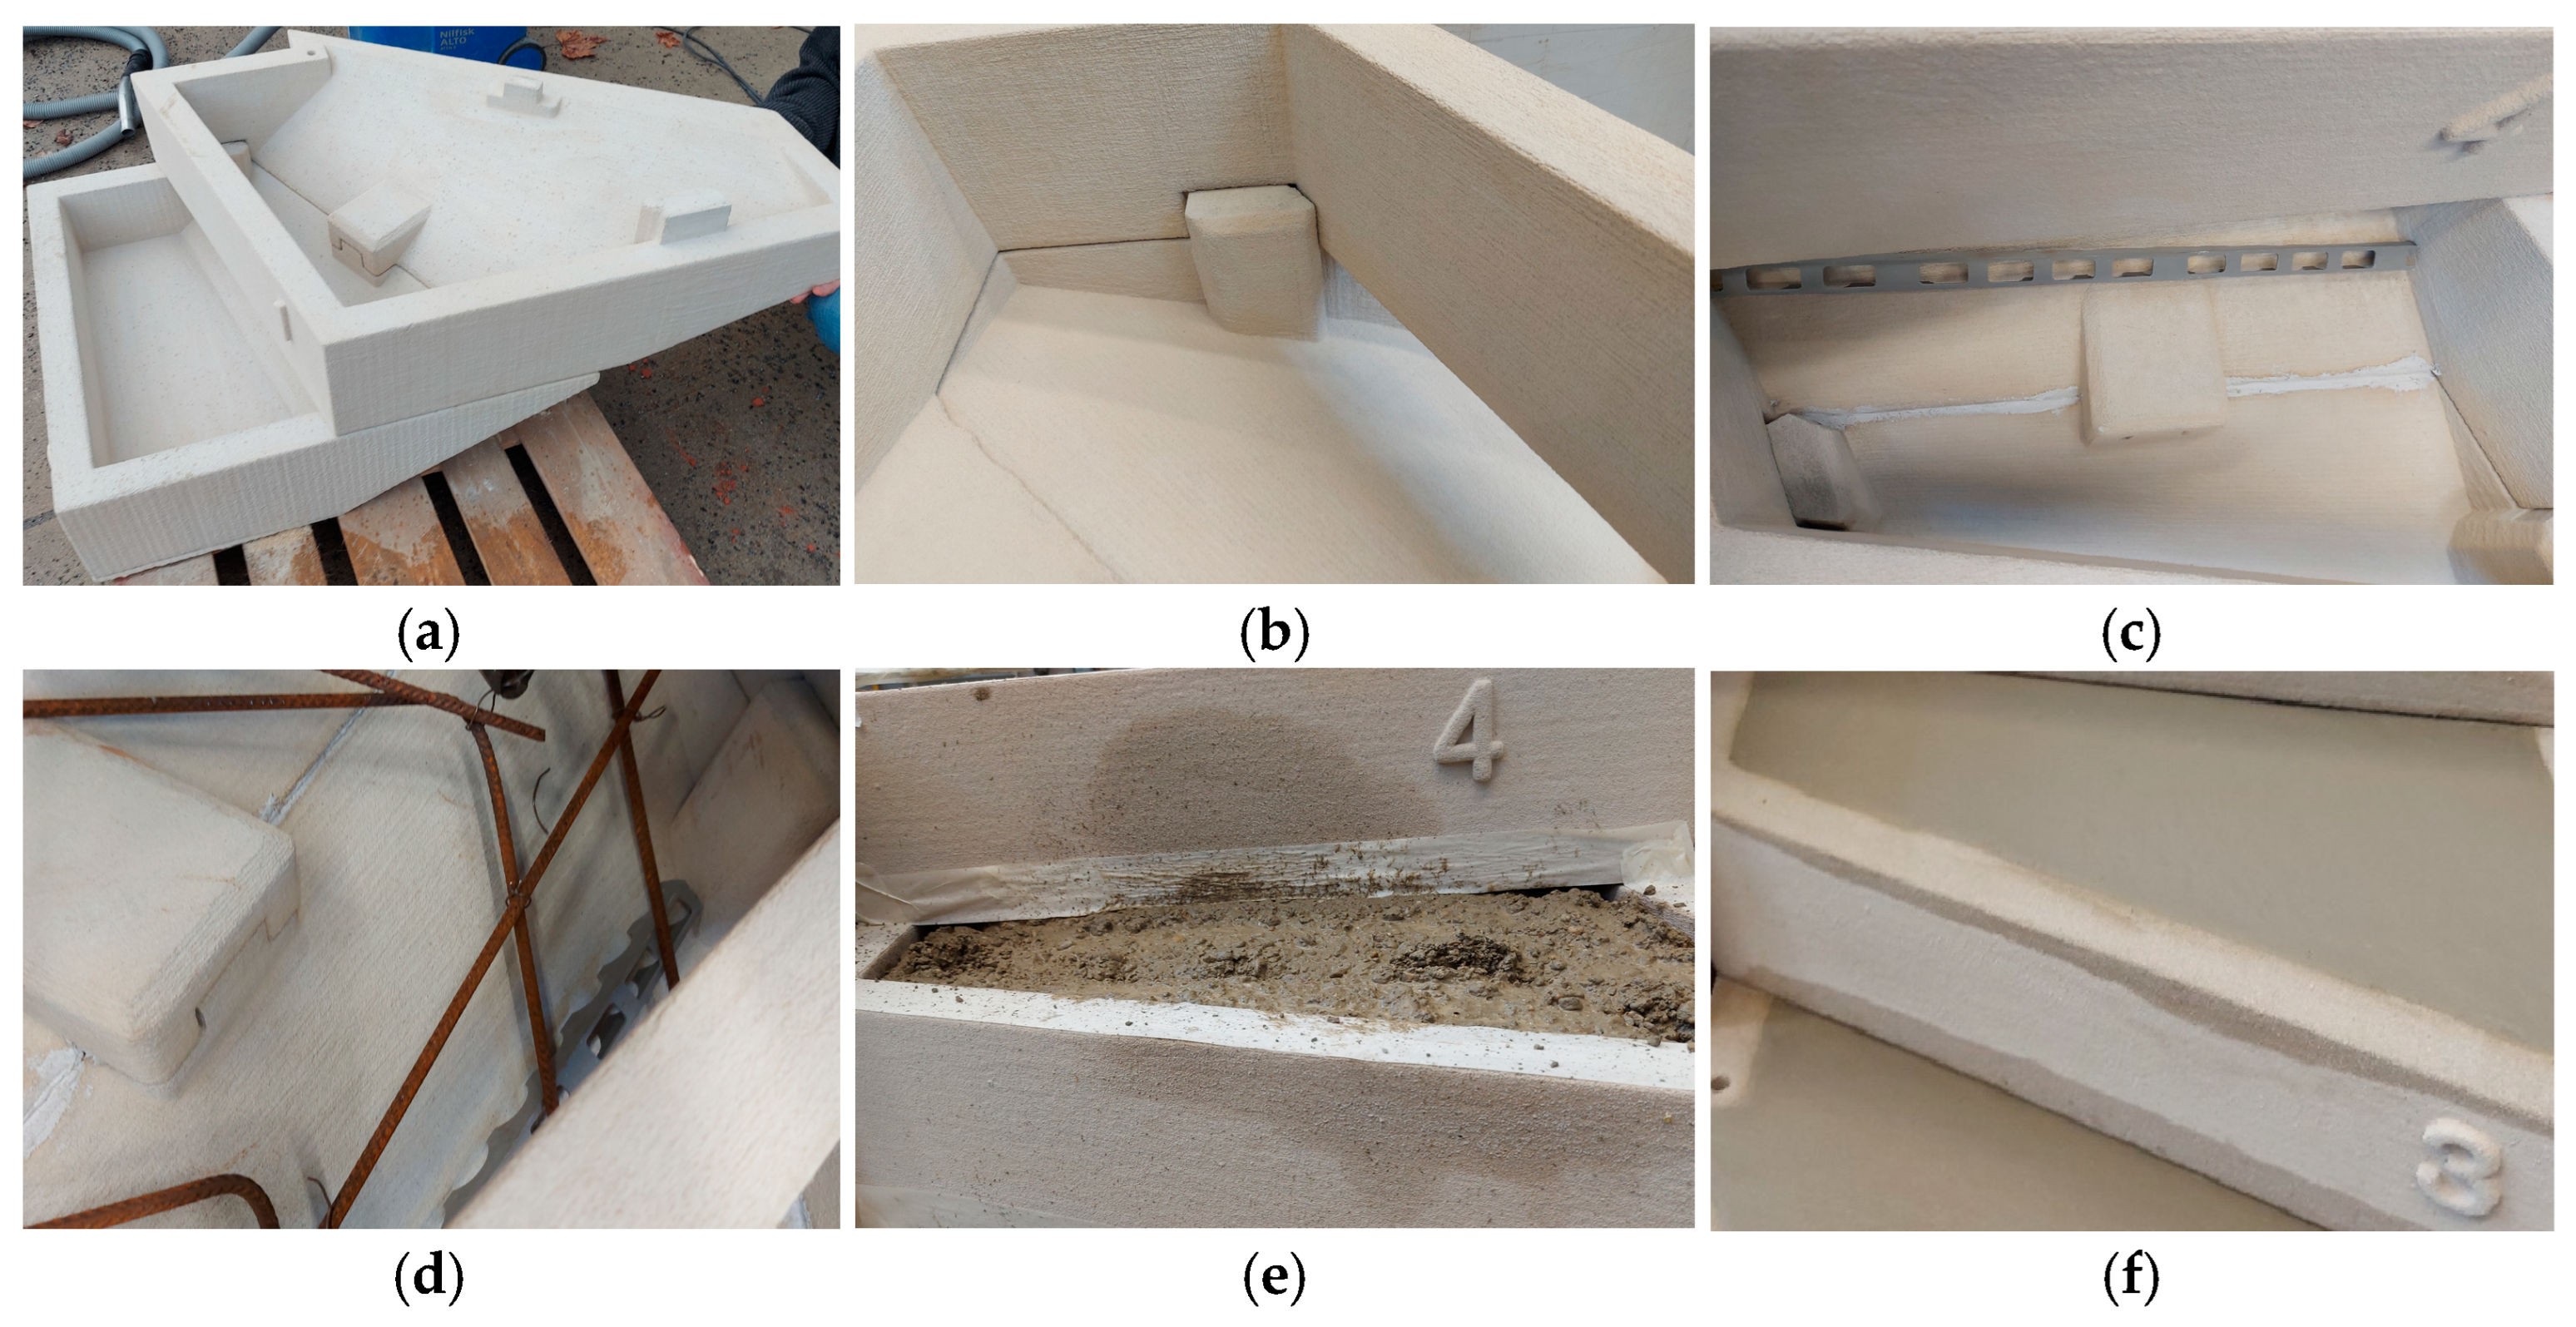
| Scenario 3 | SCA 3D printed lost formwork | 60/40 volumetric share of aggregate/cement [15] mixture with CEM I |
| Scenario 4 | SCA 3D printed lost formwork | 60/40 volumetric share of aggregate/cement [15] mixture with CEM III |
| Scenario 5 | SCA 3D printed lost formwork | 80/20 volumetric share of aggregate/cement [15] mixture with CEM I |
| Scenario 6 | SCA 3D printed lost formwork | 80/20 volumetric share of aggregate/cement [15] mixture with CEM III |
| Material | Process | Amount | Unit |
|---|---|---|---|
| Concrete filling | |||
| Cement, Portland | market for cement, Portland|cement, Portland|Cutoff, U—Europe without Switzerland | 119.70 | kg |
| Gravel, round | market for gravel, round|gravel, round|Cutoff, U—CH | 349.30 | kg |
| Reinforcing steel | market for reinforcing steel|reinforcing steel|Cutoff, U—GLO | 10.63 | kg |
| Sand | market for sand|sand|Cutoff, U—CH | 285.95 | kg |
| Tap water | market for tap water|tap water|Cutoff, U—Europe without Switzerland | 63.00 | kg |
| Waste concrete, not reinforced | market for waste concrete, not reinforced|waste concrete, not reinforced|Cutoff, U—Europe without Switzerland | 60.00 | kg |
| Wastewater from concrete production | market for wastewater from concrete production|wastewater from concrete production|Cutoff, U—CH | 0.09 | m3 |
| One-time use wood formwork | |||
| Plywood | market for plywood|plywood|Cutoff, U—RER | 0.32904 | m3 |
| Waste wood, untreated | market for waste wood, untreated|waste wood, untreated|Cutoff, U—AT | 236.9088 | kg |
| Material | Process | Amount | Unit |
|---|---|---|---|
| Concrete filling | |||
| Cement, Portland | market for cement, Portland|cement, Portland|Cutoff, U—Europe without Switzerland | 71.82 | kg |
| Gravel, round | market for gravel, round|gravel, round|Cutoff, U—CH | 209.58 | kg |
| Reinforcing steel | market for reinforcing steel|reinforcing steel|Cutoff, U—GLO | 10.63 | kg |
| Sand | market for sand|sand|Cutoff, U—CH | 171.57 | kg |
| Tap water | market for tap water|tap water|Cutoff, U—Europe without Switzerland | 37.80 | kg |
| Waste concrete, not reinforced | market for waste concrete, not reinforced|waste concrete, not reinforced|Cutoff, U—Europe without Switzerland | 36.00 | kg |
| Wastewater from concrete production | market for wastewater from concrete production|wastewater from concrete production|Cutoff, U—CH | 0.09 | m3 |
| SCA 3D printed lost formwork | |||
| Cement, Portland | market for cement, Portland|cement, Portland|Cutoff, U—Europe without Switzerland | 83.72 | kg |
| Silica sand | market for silica sand|silica sand|Cutoff, U—GLO | 296.80 | kg |
| Tap water | market for tap water|tap water|Cutoff, U—Europe without Switzerland | 34.86 | kg |
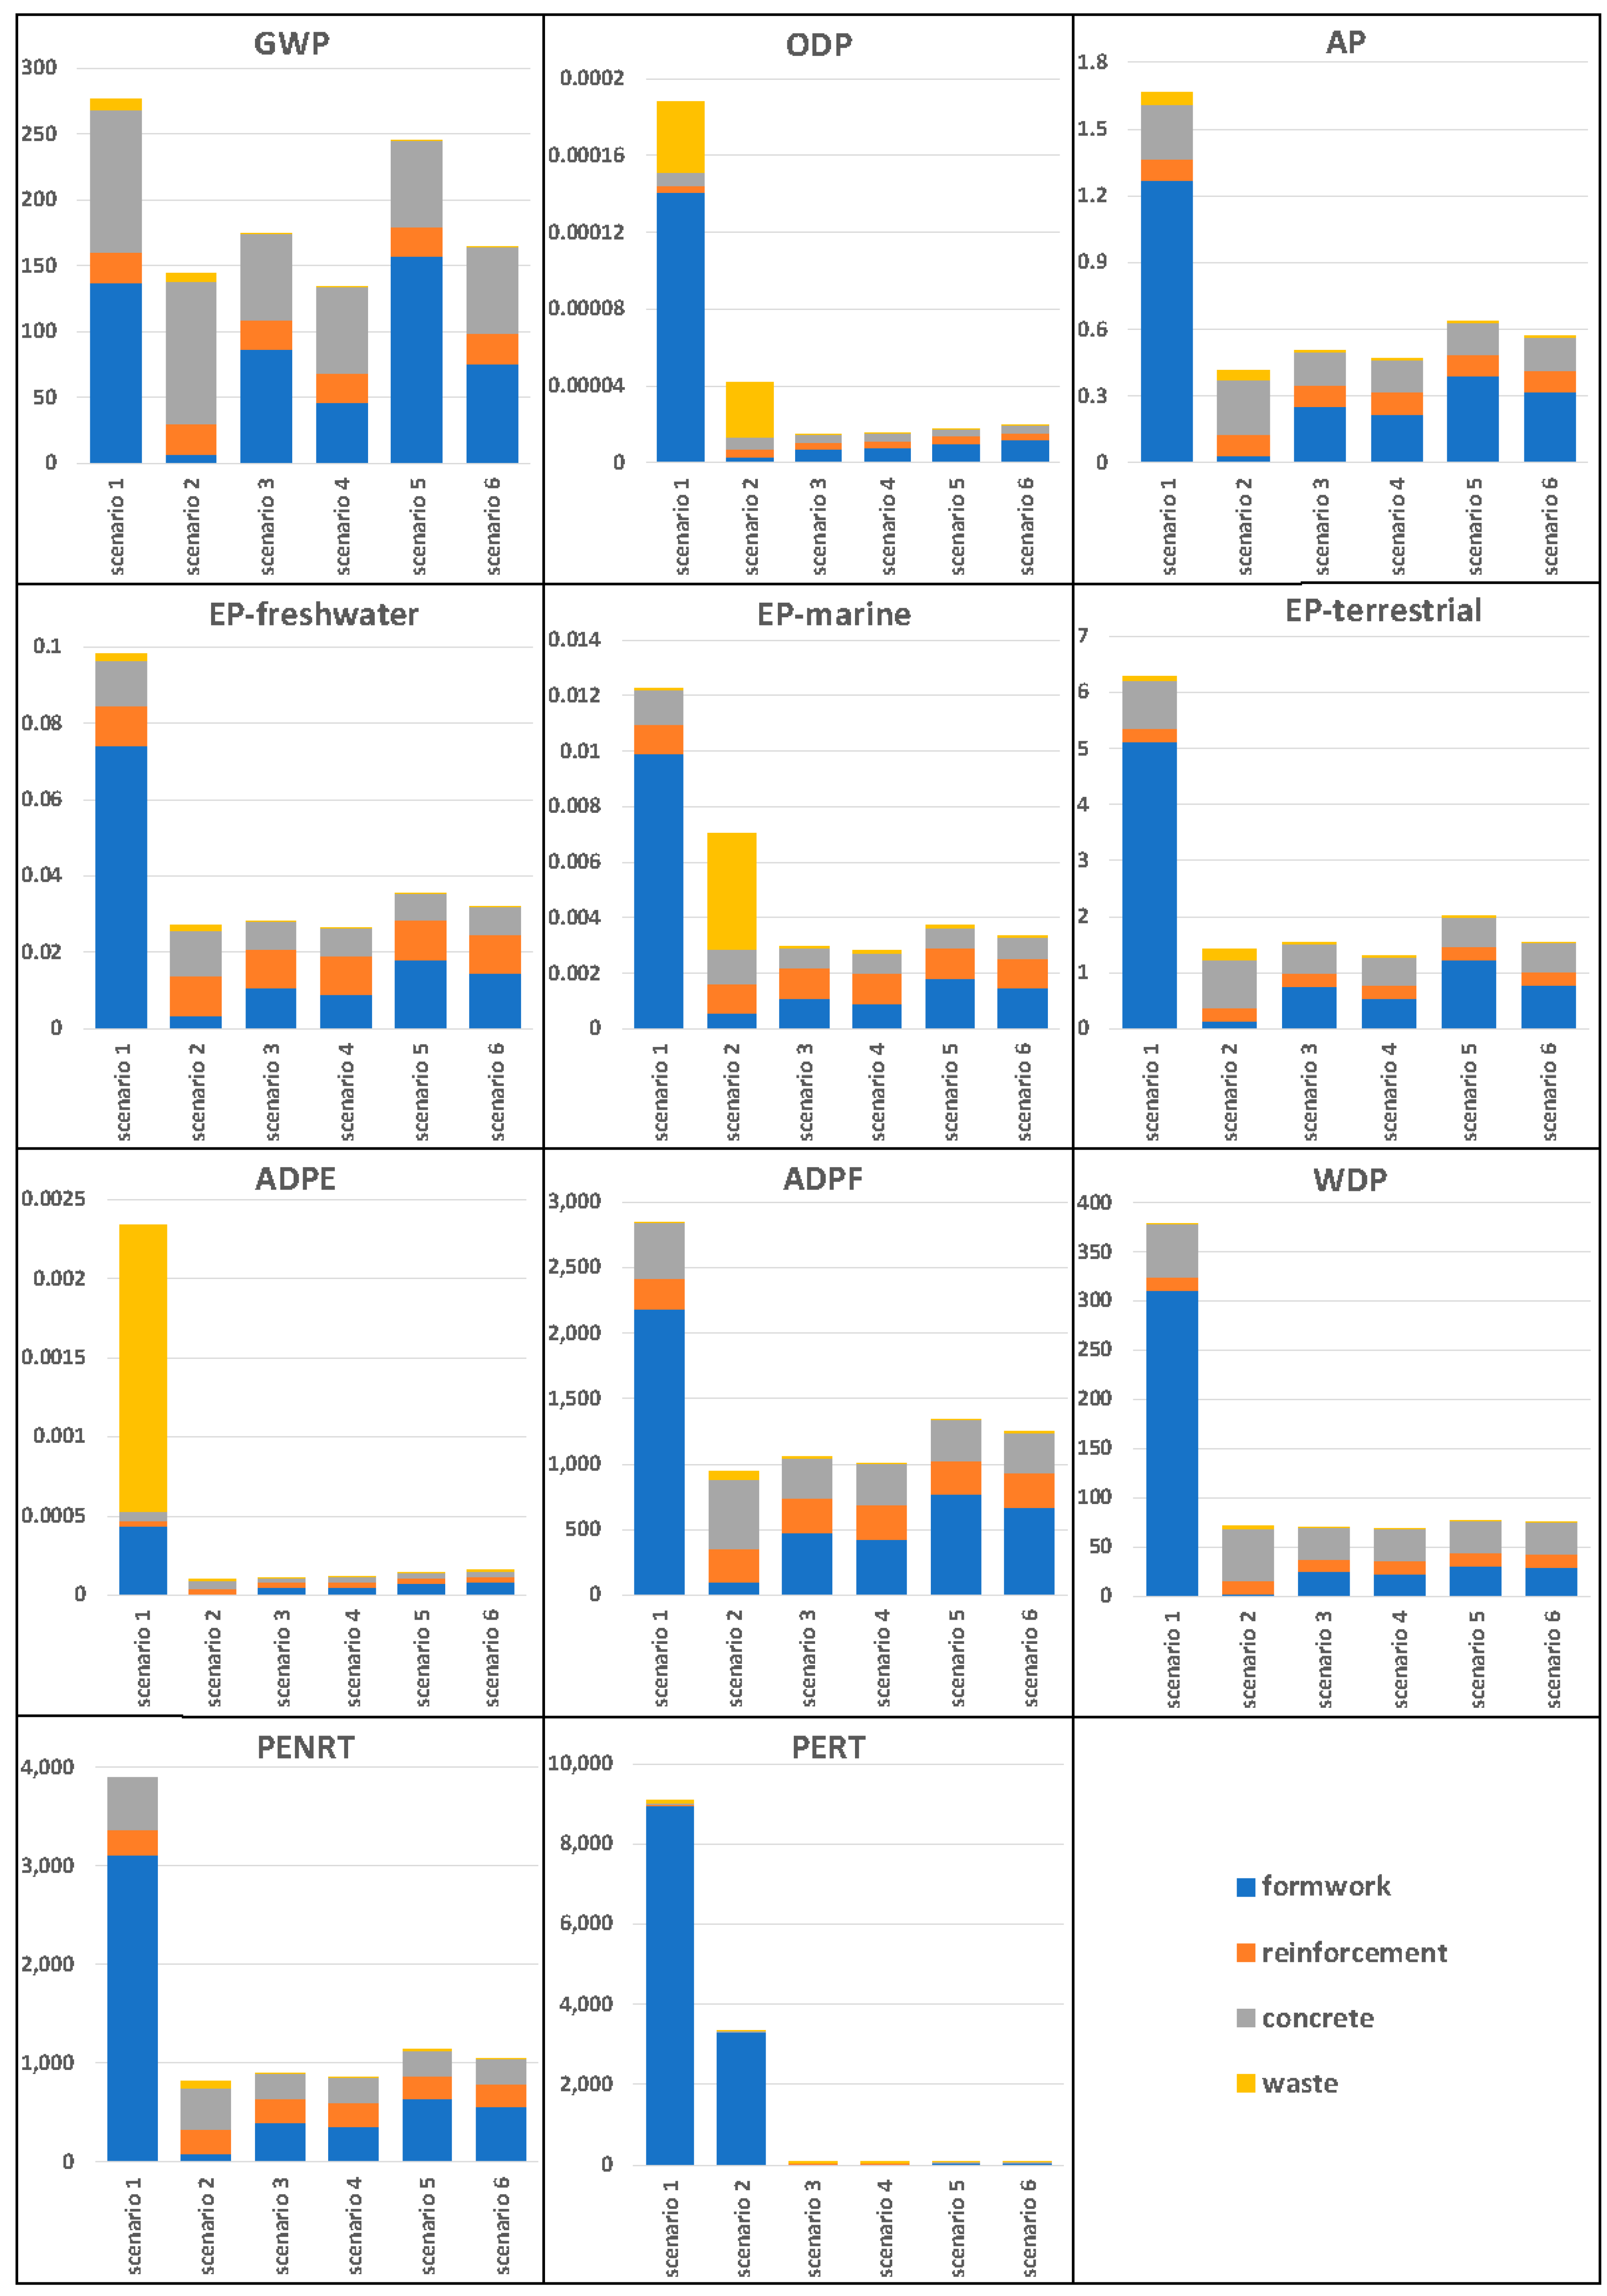
| GWP kg CO2 eq. | ODP kg CFC-11 eq. | AP molc H+ eq. | EP-Freshwater kg P eq. | EP-Marine kg N eq. | EP-Terrestrial molc N eq. | ADPE kg Sb eq. | ADPF MJ | WDP m3 | PENRT MJ eq. | PERT MJ eq. | |
|---|---|---|---|---|---|---|---|---|---|---|---|
| Scenario 1 | 276 | 1.88 × 10⁻⁴ | 1.67 | 0.098 | 0.018 | 6.47 | 4.37 × 10⁻⁴ | 2918 | 382 | 3979 | 9013 |
| Scenario 2 | 144 | 4.19 × 10⁻⁵ | 0.42 | 0.027 | 0.007 | 1.43 | 1.03 × 10⁻⁴ | 944 | 72 | 811 | 3345 |
| Scenario 3 | 246 | 1.78 × 10⁻⁵ | 0.64 | 0.035 | 0.004 | 2.01 | 1.38 × 10⁻⁴ | 1346 | 77 | 1134 | 80 |
| Scenario 4 | 164 | 1.94 × 10⁻⁵ | 0.57 | 0.032 | 0.003 | 1.55 | 1.53 × 10⁻⁴ | 1252 | 75 | 1053 | 86 |
| Scenario 5 | 176 | 1.52 × 10⁻⁵ | 0.51 | 0.028 | 0.003 | 1.57 | 1.11 × 10⁻⁴ | 1074 | 83 | 915 | 66 |
| Scenario 6 | 134 | 1.56 × 10⁻⁵ | 0.47 | 0.026 | 0.003 | 1.31 | 1.19 × 10⁻⁴ | 1008 | 68 | 860 | 67 |
| Market Process Medium Voltage | Switzerland | Canada | Europe/CH | US | Peru | India | South Africa |
|---|---|---|---|---|---|---|---|
| GWP [kg CO2 eq.] | 0.74008 | 0.86674 | 0.880346 | 0.90786 | 0.91638 | 0.93117 | 1.02766 |
| Market Process Medium Voltage | Switzerland | Europe/CH | Rest of World |
|---|---|---|---|
| GWP [kg CO2 eq.] | 0.31174 | 0.39590 | 0.44263 |
| GWP kg CO2 eq. | ODP kg CFC-11 eq. | AP molc H+ eq. | ADPE kg Sb eq. | ADPF MJ | WDP m3 | PENRT MJ eq. | PERT MJ eq. | |
|---|---|---|---|---|---|---|---|---|
| CEM I 3.9.1 | 0.880346 | 4.54 × 10⁻⁸ | 0.001899 | 3.59 × 10⁻⁷ | 3.191437 | 0.095574 | 3.906352 | 0.223288 |
| CEM I 3.10 | 0.879083 | 4.42 × 10⁻⁸ | 0.001875 | 8.64 × 10⁻⁷ | 3.164876 | 0.087237 | 3.851083 | 0.258631 |
| Deviation [%] | −0.14 | −2.64 | −1.26 | +140.67 | −0.83 | −8.72 | −1.41 | +15.83 |
| GWP kg CO2 eq. | ODP kg CFC-11 eq. | AP molc H+ eq. | ADPE kg Sb eq. | ADPF MJ | WDP m3 | PENRT MJ eq. | PERT MJ eq. | |
|---|---|---|---|---|---|---|---|---|
| CEM III/B 3.9.1 | 0.396287 | 5.53 × 10⁻⁸ | 0.001495 | 4.51 × 10⁻⁷ | 2.706048 | 0.089025 | 3.343201 | 0.262794 |
| CEM III/B 3.10 | 0.396783 | 5.20 × 10⁻⁸ | 0.001514 | 1.11× 10⁻⁶ | 2.532155 | 0.059845 | 3.098149 | 0.276835 |
| Deviation [%] | +0.13 | −5.97 | +1.27 | +146.12 | −6.43 | −32.78 | −7.33 | +5.34 |
| GWP kg CO2 eq. | ODP kg CFC-11 eq. | AP molc H+ eq. | ADPE kg Sb eq. | ADPF MJ | WDP m3 | PENRT MJ eq. | PERT MJ eq. | |
|---|---|---|---|---|---|---|---|---|
| CEM I 3.10 | 0.879083 | 4.42 × 10⁻⁸ | 0.001875 | 8.64 × 10⁻⁷ | 3.164876 | 0.087237 | 3.851083 | 0.258631 |
| CEM I oekobaudat | 0.665000 | 2.11 × 10⁻¹¹ | 0.000940 | 4.91 × 10⁻⁸ | 2.060000 | 0.004690 | 2.060000 | 0.644000 |
| Deviation [%] | −24.35 | −99.95 | −49.87 | −94.32 | −34.91 | −94.62 | −46.51 | +149.00 |
| GWP kg CO2 eq. | ODP kg CFC-11 eq. | AP molc H+ eq. | ADPE kg Sb eq. | ADPF MJ | WDP m3 | PENRT MJ eq. | PERT MJ eq. | |
|---|---|---|---|---|---|---|---|---|
| CEM III/B 3.10 | 0.396783 | 5.20 × 10⁻⁸ | 0.001514 | 1.11 × 10⁻⁶ | 2.532155 | 0.059845 | 3.098149 | 0.276835 |
| CEM III/B oekobaudat | 0.327000 | 7.10 × 10⁻¹² | 0.000520 | 3.85 × 10⁻⁸ | 1.410000 | 0.007850 | 1.410000 | 0.519000 |
| Deviation [%] | −17.59 | −99.99 | −65.65 | −96.53 | −44.32 | −86.88 | −54.49 | +87.48 |
| Market Process Medium Voltage | Europe | Switzerland | Germany | France | China | Canada |
|---|---|---|---|---|---|---|
| GWP [kg CO2 eq.] | 0.32536 | 0.02332 | 0.42080 | 0.07711 | 0.95041 | 0.18963 |
Disclaimer/Publisher’s Note: The statements, opinions and data contained in all publications are solely those of the individual author(s) and contributor(s) and not of MDPI and/or the editor(s). MDPI and/or the editor(s) disclaim responsibility for any injury to people or property resulting from any ideas, methods, instructions or products referred to in the content. |
© 2025 by the authors. Licensee MDPI, Basel, Switzerland. This article is an open access article distributed under the terms and conditions of the Creative Commons Attribution (CC BY) license (https://creativecommons.org/licenses/by/4.0/).
Share and Cite
Albrecht, S.V.; Hellerbrand, S.; Weininger, F.; Thiel, C. Strategies for Minimizing Environmental Impact in Construction: A Case Study of a Cementitious 3D Printed Lost Formwork for a Staircase. Materials 2025, 18, 825. https://doi.org/10.3390/ma18040825
Albrecht SV, Hellerbrand S, Weininger F, Thiel C. Strategies for Minimizing Environmental Impact in Construction: A Case Study of a Cementitious 3D Printed Lost Formwork for a Staircase. Materials. 2025; 18(4):825. https://doi.org/10.3390/ma18040825
Chicago/Turabian StyleAlbrecht, Sophie Viktoria, Stefan Hellerbrand, Florian Weininger, and Charlotte Thiel. 2025. "Strategies for Minimizing Environmental Impact in Construction: A Case Study of a Cementitious 3D Printed Lost Formwork for a Staircase" Materials 18, no. 4: 825. https://doi.org/10.3390/ma18040825
APA StyleAlbrecht, S. V., Hellerbrand, S., Weininger, F., & Thiel, C. (2025). Strategies for Minimizing Environmental Impact in Construction: A Case Study of a Cementitious 3D Printed Lost Formwork for a Staircase. Materials, 18(4), 825. https://doi.org/10.3390/ma18040825