Abstract
This study aimed to optimize the electrochemical dissolution process of GH4738 scrap, a Ni-based superalloy, to achieve a high dissolution rate with minimal energy consumption. Using the Plackett–Burman design, we identified four key factors from a pool of eight candidates that significantly influence both the dissolution rate and energy consumption: current density, NiCl2 concentration, electrolysis time, and H2SO4 concentration. The steepest ascent method was then applied to define a region that minimized energy consumption while maximizing the dissolution rate. Response surface methodology (RSM) was used to determine the central point for further analysis, providing valuable insights for optimizing the dissolution parameters. The study demonstrated that increasing the NiCl2 concentration reduced the breakdown potential, and at an H2SO4 concentration of 1.5 mol/L, high dissolution efficiency was achieved with minimal energy consumption. The interactions among the parameters significantly affected the dissolution performance. Analysis of variance (ANOVA) confirmed the significant influence of these parameters on the dissolution behavior of Ni-based superalloys. This research contributes to the understanding of GH4738 scrap dissolution and provides a systematic approach for optimizing the process, which is crucial for efficient material recovery and laboratory sustainability.
1. Introduction
Industrialization has rendered non-ferrous metals essential across economic, societal, defense, and technological sectors [1]. Their increasing demand underscores the critical role they play in societal progress. Recycling scrap metals and promoting their circular use are strategic moves aimed at conserving resources, reducing reliance on external sources, and ensuring economic sustainability. Improving recycling efficiency is crucial for maintaining a sustainable industry, safeguarding national security, and preserving ecological balance [2,3]. In the field of metal recycling, pyrometallurgy and hydrometallurgy are key methods for extracting metals from secondary sources. A comprehensive review of the literature reveals that pyrometallurgy, which employs high-temperature processes to separate metals from impurities, is known for its simplicity and high recovery rates [4]. However, hydrometallurgy, which includes leaching and solvent extraction, is often considered a more sustainable approach compared to traditional methods. This is due to its reduced environmental impact and potentially higher recovery rates [5,6,7]. For instance, Guan [5] reported a 79.40% leaching rate using hydrochloric acid on coal gangue, while Yang [6] achieved a 94.68% extraction rate with an aqueous process. Ding [7] showed that ultrasonic assistance can markedly improve leaching efficiency, raising zinc leaching rates from 94.43% to 99.57%.
In practical production and applications, the dissolution behavior of GH4738 scrap is subject to increasingly complex laboratory conditions. However, most current research has focused on single-variable conditions, which limits our understanding of the combined effects of these variables on the dissolution of Ni-based superalloys [8]. Furthermore, there is a lack of systematic statistical analysis on the dissolution response of GH4738 scrap. To address this gap, this study applied Response Surface Methodology (RSM) to statistically analyze the dissolution behavior of GH4738 scrap. The study investigated the impact of NiCl2 concentration, current density, H2SO4 concentration, and electrolysis time on both the dissolution rate (η) and energy consumption (E) of GH4738 scrap using Design-Expert 13.0.5.0. The RSM experimental design facilitated the analysis of parameter contributions and their interactions, effectively fitting a quadratic surface model to optimize the dissolution parameters. This study aims to optimize the dissolution parameters of GH4738 scrap using Response Surface Methodology to enhance dissolution efficiency and reduce energy consumption. By analyzing multiple variables, this research provides a scientific basis for the efficient recycling and reuse of GH4738 scrap.
2. Experimental
2.1. Composition of GH4738 Scrap Material
GH4738 is a nickel-based superalloy renowned for its exceptional mechanical properties at high temperatures. This makes it widely used in the aerospace and power-generation sectors. However, the production and fabrication of GH4738 components generate a significant amount of scrap material. The scrap used in this study was sourced from KOCEL Steel Foundry Co., Ltd. (Yinchuan, China), a leading Chinese company specializing in large-scale steel castings. The company is well known for manufacturing high-quality castings for energy equipment, including gas turbines, steam turbines, and hydroelectric power components. The chemical composition of these scraps matches that of the original GH4738 alloy, as shown in Table 1.

Table 1.
Composition of GH4738 scraps.
2.2. Performance Testing Method
An electrochemical workstation was used to measure the anodic polarization curve, electrochemical impedance spectroscopy (EIS), and Tafel curve of electrolytic nickel in the electrolyte. The detailed procedure is as follows:
- (a)
- Sample Preparation: The sample was polished with abrasive papers of sequentially finer grit sizes: 400#, 600#, 1000#, 1500#, and 2000#. This was performed to ensure a consistent surface finish for each sample. (The samples utilized in this study were derived from GH4738 scrap material. To ensure uniformity and ease of handling, the samples were machined into a parallelepiped form, with each face having a surface area of 1 cm2. This geometric configuration was selected to facilitate consistent processing and subsequent analysis. Following machining, the samples were embedded in epoxy resin to protect the edges and provide a stable base for further testing and characterization.)
- (b)
- Electrochemical Setup: In the three-electrode setup, the sample acted as the working electrode, with a titanium electrode functioning as the auxiliary electrode in a loop configuration. A saturated calomel electrode served as the reference electrode, providing the potential for the working electrode and establishing the potential standard for the system [9].
- (c)
- Electrolysis and Measurement: Post-electrolysis, the anode residual material was dried and weighed to calculate the dissolution rate using the formula outlined below [10]:
- (d)
- Energy Consumption Calculation: The calculation formula for the energy consumption of GH4738 scrap dissolution is as follows [11]:
2.3. Response Surface Methodology
2.3.1. Plackett–Burman Design
The Plackett–Burman Design (PBD) incorporated eight critical factors, which were identified following a review of single-factor experiments. Spanning 12 experimental groups, the design featured eight active factors and three placeholders, with four groups designated as blank controls. Factors were assessed at two levels—high and low—to determine their impact. The study’s objectives were to quantify dissolution rate and energy consumption. Table 2 outlines the factors and their levels within the PBD.

Table 2.
Factors and levels of Plackett–Burman design.
The Plackett–Burman (PB) experiment delineated the path of steepest ascent, aligning with the gradient to efficiently reach the optimal value range. The experiment identified current density, H2SO4 concentration, NiCl2 concentration (the use of NiCl2 as an additive is favored for its ability to provide nickel cations, which positively influence the electrochemical dissolution process. Moreover, NiCl2 is more effective than HCl in reducing energy consumption and enhancing dissolution efficiency.), and electrolysis time as pivotal factors. The subsequent steepest ascent test targeted these factors.
2.3.2. Path of the Steepest Ascent Method
The results from the Plackett–Burman (PB) experiment enabled the identification of the direction of the steepest ascent, which is crucial for efficiently targeting the optimal value region. The experiment pinpointed current density, H2SO4 concentration, NiCl2 concentration, and electrolysis time as the key factors affecting the process. Subsequently, the steepest ascent test was performed focusing on these factors.
2.3.3. Box–Behnken Design
Response Surface Methodology (RSM) is utilized to validate and refine the empirical model’s design parameters, employing polynomial equations derived from experimental data. This approach effectively identifies the factors that influence outcomes and clarifies the process of data analysis. The Central Composite Design (CCD)-based RSM model, as implemented in Design Expert version 13 software, was applied to evaluate the parameters for dissolution testing. RSM excels in analyzing parameter interactions and optimizing system parameters efficiently with a minimal number of tests. As outlined in Table 3, the study focused on four parameters: current density, H2SO4 concentration, NiCl2 concentration, and electrolysis time, each tested across three levels. A total of twenty-nine experimental runs were conducted to measure the responses of these parameters. The energy consumption and dissolution rate data were modeled using a standard second-order polynomial equation, as referenced in [11].

Table 3.
Factor and levels of Central Composite Design.
3. Results
3.1. Corrosion Reaction
Drawing from the established knowledge of nickel (Ni) and its superalloys’ corrosion mechanisms as detailed in prior research [12,13], the general reaction for Ni corrosion in chloride-containing solutions is depicted by the subsequent equations:
The anode dissolution:
The anode passivation:
3.2. Result of Plackett–Burman Design
This study utilized the Plackett–Burman design (PBD) with 12 trials to assess the impact of eight factors, derived from single-factor testing, on the dissolution rate and energy consumption. Each factor was evaluated at two levels: high and low. To accommodate experimental variability, four dummy variables were included. Table 4 details the factors and their respective levels. Design Expert 13 software facilitated the analysis of results, comparing the influence of each factor on dissolution rate (η) and energy consumption (E), and identified the most significant factors influencing the process.

Table 4.
Results of the Plackett–Burman Design.
The Plackett–Burman (PB) test’s main effect analysis for each influencing factor is detailed in Table 5. The model’s p-value (the p-value is used to assess the significance of each factor’s effect on the response variables) of 0.0032 was well below the 0.05 threshold, signifying the statistical significance of the regression equation. Additionally, the coefficient of determination (R2) exceeds 0.8, indicating a robust fit to the data and affirming the model’s ability to interpret the PB design’s results effectively.

Table 5.
Variance analysis of Plackett–Burman Design results.
The electrochemical dissolution of GH4738 scrap was markedly affected by four principal factors: current density, NiCl2 concentration, electrolysis duration, and acid concentration. These factors contribute positively to both dissolution rate and energy consumption. Their combined effects boost process efficiency, which may result in higher dissolution rates or more efficient energy use. As such, these variables were recognized as the main determinants of the electrochemical dissolution process. The response values of these factors were analyzed to establish the direction and magnitude of the steepest ascent path.
3.3. Path of the Steepest Ascent Method
The steepest ascent test, informed by the Plackett–Burman (PB) experiment outcomes, targeted regions with low energy consumption (E) and high dissolution rates (η). Four experimental gradients were established based on the factors’ directional changes. Table 6 details the experimental design and outcomes, highlighting Group 3′s highest comprehensive indicator (Z) value. Consequently, a central composite design for the Response Surface Methodology (RSM) was initiated with a current density of 650 mA/cm2, acidity of 1.5 mol/L, NiCl2 concentration of 50 g/L, and electrolysis time of 0.75 h.

Table 6.
Result of the steepest accent experiments.
3.4. Analysis and Results of Central Composite Design
Table 7 displays the input values for the four pivotal parameters: NiCl2 concentration, acidity concentration, current density, and electrolysis time, and their corresponding output responses, which are energy consumption and dissolution rate, for a subset of 11 out of the total 29 experimental data sets. Analysis of Variance (ANOVA) evaluated the impact of these parameters and their interactions on the responses. The F-value, derived from the ratio of Mean Square Between to Mean Square Error, affirms the assessment’s validity [14]. The p-value gauges the statistical evidence against the null hypothesis, with lower values indicating stronger evidence for rejection. It is a pivotal metric in hypothesis testing, aiding in the validation or refutation of the null hypothesis and in assessing the significance of model coefficients [15]. A p-value below 0.05 is generally regarded as statistically significant at the 95% confidence level. Degrees of freedom (df) for subjects are calculated by subtracting the number of treatments from the total number of subjects, while error df is found by subtracting the number of groups from the total number of subjects [16]. For dissolution rate (η), model terms A, D, AD, and C2 are significant; for energy consumption (E), model terms A, B, AB, BC, BD, A2, and D2 are significant. Values exceeding 0.1000 in Table 8 and Table 9 indicate that the corresponding model terms are not statistically significant. The final regression models are succinctly summarized below:

Table 7.
Experimental parameters in actual units and experimental responses (11 out of 29 Data Sets).

Table 8.
Analysis of Variance of the quadratic polynomial model for η (dissolution efficiency).

Table 9.
Analysis of Variance of the quadratic polynomial model for E (energy consumption).
3.5. Influences of Laboratory Parameters on Responses
3.5.1. Influence of NiCl2 Concentration
Figure 1a shows that increasing NiCl2 concentration shifts the anodic polarization curve towards higher current density values. This trend is due to a significant activation effect, which leads to a gradual rise in the passivation current density for nickel dissolution. The rapid increase in the anodic polarization curve is closely related to the continuous hydrogen evolution process [17,18]. Anodic dissolution in nickel-based alloys involves the formation, breakdown, and dissolution of the passivation film on the substrate’s surface [19]. Contrary to common assumptions, film breakdown sites do not align with high chloride ion concentrations but occur at adjacent areas where chloride ions have a lesser influence. Research indicates that passive films are mostly amorphous, with a small number of embedded nanocrystals (NCs), and the interfaces between NCs and the amorphous region resemble grain boundaries, facilitating chloride ion transport [20]. However, high NiCl2 concentrations increase the electrolyte’s internal stress, reducing the passivation current density. Thus, at a NiCl2 concentration of 50 g/L, the passivation current density is at its peak. As shown in Figure 1b, the breakdown potential (Eb) shifts negatively with increasing NiCl2 concentration, and the anode slope decreases due to reduced reaction resistance, accelerating the corrosion rate. These observations underscore the effect of NiCl2 concentration on the passivation film’s breakdown.
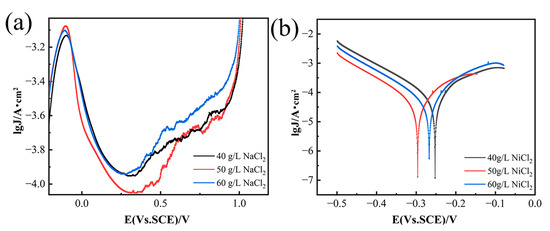
Figure 1.
Anodic polarization curves of GH4738 scrap under different NiCl2. (a) Potentiodynamic polarization curves and (b) Tafel curves.
The 3D surface analysis is crucial for evaluating the parameters that influence the response. It helps to understand the interactions between NiCl2 concentration, current density, H2SO4 concentration, and electrolysis time on the response surface. Figure 2 illustrates the 3D surfaces of η and E for various combinations of NiCl2 and H2SO4 concentrations at a fixed current density and electrolysis time. Figure 2a indicates that η initially increases and then decreases with rising NiCl2 concentrations. High NiCl2 concentrations in the electrolyte increase ionic concentrations, enhancing ion interactions and increasing internal stress. This increased stress can impede ion migration and reactions, slowing the electrolytic process and reducing solubility. Figure 2b shows that E slightly decreases as NiCl2 concentration increases from 40 g/L to 50 g/L, but then rises rapidly as the concentration goes from 50 g/L to 60 g/L.
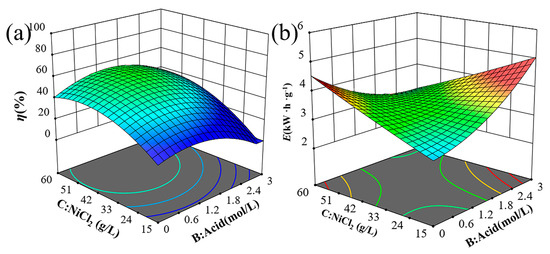
Figure 2.
Trend graph of test indicators 3D surface between NiCl2 and H2SO4 concentration on (a) solubility and (b) energy consumption.
Figure 3 displays the SEM images of the corroded surfaces after the removal of corrosion products for samples tested at an H2SO4 concentration of 1.5 mol/L, a current density of 650 mA/cm2, and an electrolysis time of 500 s, with varying NiCl2 concentrations: (a) 40 g/L, (b) 50 g/L, and (c) 60 g/L. The images reveal that corrosion becomes more severe with increasing NiCl2 concentration under identical test conditions. Figure 3a shows no visible corrosion pits, while Figure 3b clearly displays them. This observation aligns with the anodic polarization curves in Figure 1b, suggesting the presence of a protective film. The protective effect of the corrosion film is diminished by the presence of Cl− ions, which convert Ni(OH)2 into soluble NiCl2, reducing the film’s protective properties. The anodic polarization curves also indicate that as NiCl2 concentration increases, the breakdown potential decreases and the corrosion current density increases, providing further evidence of the reduced protective film properties. Figure 3c shows a reduction in corrosion pits, consistent with the findings in Figure 1b, where high NiCl2 concentrations increase ionic concentration, enhance ion interactions, and raise internal stress. Figure 3d–f depicts the mass percentage variations in metals across varying nickel chloride concentrations. At 40 g/L NiCl2, Al mass percentage is 1.55%, decreasing to 1.31% at 50 g/L, suggesting that higher concentrations may marginally increase aluminum’s dissolution rate, thereby reducing its mass percentage in the matrix. Ti mass percentage is stable between 2.00% and 2.08%, indicating its stability during electrochemical dissolution and insensitivity to NiCl2 concentration changes. Cr mass percentage drops from 18.45% at 40 g/L to 18.42% and 17.74% at 50 g/L and 60 g/L, respectively, which may indicate a heightened dissolution rate at elevated NiCl2 concentrations. Co mass percentage decreases slightly from 13.31% to 13.18% and 13.03%, implying a minor rise in its dissolution rate with increasing NiCl2 concentration. Ni, being the principal metal in GH4738 scrap, shows a mass percentage that first rises and then falls with increasing NiCl2 concentration, reflecting a variable reaction rate. Zr mass percentage exhibits significant fluctuations, from 1.56% down to 1.02% and up to 1.94%, indicating a dissolution rate that initially increases and subsequently decreases. While the dissolution rates of Al, Co, and Cr incrementally rise with NiCl2 concentration, those of Ni and Zr show an initial increase followed by a decrease. Given the experimental focus on the nickel dissolution rate, a NiCl2 concentration of 50 g/L is identified as the optimal condition.
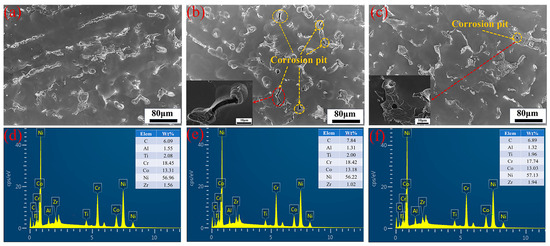
Figure 3.
Surface appearance and EDX of GH4738 scrap under different NiCl2 concentration: (a,d) 40 g/L, (b,e) 50 g/L, and (c,f) 60 g/L.
3.5.2. Influence of H2SO4 Concentration
As depicted in Figure 4a,b, the pitting corrosion resistance (Φ), which is defined as the difference between the protective potential (Etp) and the breakdown potential (Eb) [21], exhibits a decrease followed by an increase with the rise in NiCl2 concentration. The nickel anode demonstrates the lowest resistance to pitting corrosion in a 1.5 mol/L H2SO4 solution. During anodic polarization, current density decreases initially and then rises with increasing H2SO4 concentration, reaching a peak at 1.5 mol/L H2SO4. Figure 5 shows the effects of H2SO4 concentration and current density on solubility and energy consumption, assuming constant NiCl2 concentration and electrolysis time. Figure 5a indicates that solubility (η) first increases and then decreases with increasing H2SO4 concentration. This trend is attributed to the higher hydrogen ion concentration in more acidic solutions, which promotes hydrogen gas formation. This process destabilizes the passivation film and enhances matrix dissolution. However, beyond a certain H2SO4 concentration threshold, solute molecules may become locally supersaturated, leading to frequent ion collisions that hinder movement and limit diffusion rates [22,23]. Figure 5b demonstrates that energy consumption (E) first decreases and then increases as H2SO4 concentration rises. The initial decrease in energy consumption is due to the higher frequency of ion collisions at increased H2SO4 concentrations, which speeds up the reaction rate and reduces the time required to achieve a similar level of reaction. Consequently, this leads to lower energy consumption. However, at very high H2SO4 concentrations, the reaction generates significant heat, necessitating additional energy for heat dissipation and maintenance of reaction temperature stability, thereby increasing energy consumption.
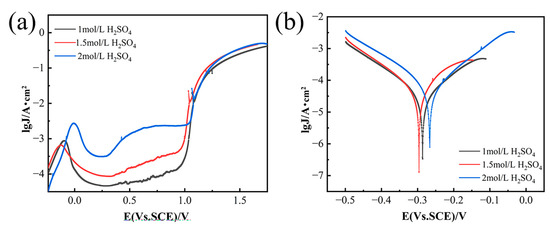
Figure 4.
Anodic polarization curves of GH4738 scrap under different H2SO4 concentration. (a) Potentiodynamic polarization curves and (b) Tafel curves.
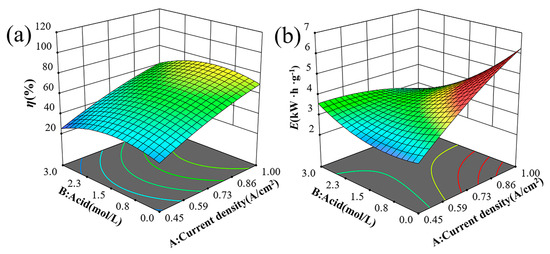
Figure 5.
Trend graph of test indicators 3D surface between current density and H2SO4 concentration on (a) solubility and (b) energy consumption.
3.5.3. Influence of Current Density and Electrolysis Time
Current density and electrolysis duration are pivotal parameters influencing dissolution rates and energy expenditure in electrochemical processes. Figure 6a depicts constant current curves at a set electrolysis duration, showing an increase in potential with rising current density. This trend is due to the intensified electrochemical reactions at the electrode surface, which also boosts the dissolution rate. Figure 6b further indicates that increasing current density correlates with higher dissolution rates and energy consumption. This pattern suggests that electrochemical reactions shift from being kinetically controlled at the electrode surface to being limited by mass transport at elevated current densities, consequently raising energy demands [24,25]. The interplay between current density and electrolysis time on dissolution rates and energy consumption is highlighted in Figure 6c,d. Prolonging the electrolysis time allows for dissolution rates and energy consumption to approach levels typically seen at higher current densities, even when operating at lower current densities. This underscores the substantial impact of electrolysis time on the dissolution process, emphasizing the need to consider both current density and electrolysis time when optimizing electrochemical processes.
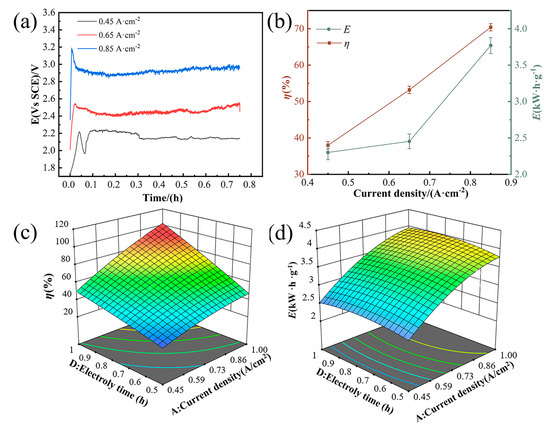
Figure 6.
Current density and electrolysis time impact on dissolution and energy efficiency. (a) Current–density curves at a set electrolysis duration. (b) Variation in the dissolution rate and energy consumption across current densities. (c) 3D trend analysis: solubility as a function of current density and electrolysis time. (d) 3D trend analysis: energy consumption as a function of current density and electrolysis time.
3.6. Optimization and Confirmation
In this part, we utilized the Design Expert 13.0.5.0 for numerical optimization, selecting parameters and responses from the menu to meet our objectives. These objectives included setting a range, targeting a specific value, minimizing or maximizing responses, and specifying exact parameter values. Parameters were set within their experimental ranges to optimize the dissolution rate and minimize energy consumption, with the most favorable outcomes being higher dissolution rates and lower energy usage. The regression and experimental data were compared to calculate the percentage error, as detailed in Table 10. To validate the preferred dissolution process, we performed three replicate tests, and the results, with errors under 10%, confirmed the process’s stability and viability.

Table 10.
Parameters and Results of the Confirmation Experiment.
4. Conclusions
This study investigated the influence of complex laboratory factors on the electrochemical dissolution response of GH4738 scrap using statistical methods. The Plackett–Burman Design (PBD) effectively identified four significant factors influencing both dissolution rate and energy consumption: current density, NiCl2 concentration, electrolysis time, and H2SO4 concentration. Subsequently, the steepest ascent path method was employed to locate an optimal region characterized by high dissolution rates and low energy consumption, leading to a Response Surface Methodology (RSM) under specific conditions. The research revealed that elevated concentrations of NiCl2 and H2SO4 can impact the passivation film, thereby affecting the dissolution rate. Two quadratic models, developed using Response Surface Methodology (RSM), accurately predicted the parameters with high R2 values, indicating a strong fit between the model and the experimental data. Optimal conditions for achieving a high dissolution rate and minimal energy consumption were identified as a current density of 850 mA/cm2, an acidity level of 2.0 mol/L, a NiCl2 concentration of 60 g/L, and an electrolysis time of 1 h.
Author Contributions
Methodology, X.F.; Validation, X.F.; Formal analysis, X.Z., X.F. and G.L. (Guiqun Liu); Resources, G.L. (Guiqun Liu); Writing—original draft, X.F. and G.L. (Guanglei Lv); Writing—review & editing, G.L. (Guanglei Lv). All authors have read and agreed to the published version of the manuscript.
Funding
This work was supported by the young top-notch talents of Ningxia province [2022033].
Institutional Review Board Statement
Not applicable.
Informed Consent Statement
Not applicable.
Data Availability Statement
The original contributions presented in this study are included in the article. Further inquiries can be directed to the corresponding author.
Conflicts of Interest
Author Guanglei Lv was employed by the company CNOOC (Tianjin) Pipeline Engineering Technology Ltd. The remaining authors declare that the research was conducted in the absence of any commercial or financial relationships that could be construed as a potential conflict of interest.
References
- Xu, T.; Zhou, Y. Research progress of hydrometallurgical recovery and utilization of valuable metals from secondary resources. Chin. J. Nonferrous Met. 2024, 34, 855–876. [Google Scholar]
- Jie, X.; Zhang, B. Experimental Study on Recovery of Platinum Group Metals from Oxidation Furnace Ash in Nitric Acid Industry. China Resour. Compr. Util. 2017, 2, 13–15. [Google Scholar]
- Li, Z.; Quan, D. Research Progress on Rhodium Recovery Technology from Waste Precious Metal Catalysts. Petrochem. Ind. Technol. 2020, 27, 270–271. [Google Scholar]
- Mao, J.K.; Li, J. Coupling reactions and collapsing model in the roasting process metals from LiCoO2 batteries. J. Clean. Prod. 2018, 205, 923–929. [Google Scholar] [CrossRef]
- Guan, C.P.; Yan, C.H. Study on the Dissolving Ratio of Coal Gangue Treated with Acids. Sichuan Nonferrous Met. 2011, 4, 35–39. [Google Scholar]
- Yang, Q.; Zhang, F. Extraction of alumina from alumina rich coal gangue by a hydro-chemical process. R. Soc. Open Sci. 2020, 7, 192132. [Google Scholar] [CrossRef]
- Ding, W.; Bao, S. Mechanism and kinetics study on ultrasound assisted leaching of gallium and zinc from corundum flue dust. Miner. Eng. 2022, 183, 107624. [Google Scholar] [CrossRef]
- Hang, Z.Q. Study on Electrochemical Dissolution Behavior of Electrolytic Nickel and Dissolution Control Technology; Nanchang Hangkong University: Nanchang, China, 2020. [Google Scholar]
- Zeng, Y.; Chen, J. Study of residual chlorine sensor based on tri-electrode system. Electron. Meas. Technol. 2016, 38, 110–114. [Google Scholar]
- Guo, R.; Zhang, X.C. Study on Electrochemical Dissolution Process of Tungsten-rhenium Alloy. Guangzhou Chem. Ind. 2019, 47, 63–65. [Google Scholar]
- Chen, K.K.; Cao, Q.G. Study on Electrochemical Dissolution an Precipitation Separation of W-Re Alloy. Rare Met. Mater. Eng. 2021, 50, 279–285. [Google Scholar]
- Xin, D.; Huang, H.; Yang, Y.; Wang, G.; Qu, J.; Chen, Y.; Wu, C.; Zhao, J.; Wang, Y.; Ma, W. Cyclic hot corrosion behavior and mechanism of GH4738 superalloy in mixed molten salt. J. Mater. Res. Technol. 2024, 32, 3456–3464. [Google Scholar] [CrossRef]
- Wang, H.; Dong, H.; Cai, Z.; Liu, Y.; Wang, W. Fatigue behaviors of a nickel-based superalloy after hot-corrosion: Experiments and peridynamic simulations. Int. J. Fatigue 2024, 180, 108070. [Google Scholar] [CrossRef]
- Wang, L.S.; Jiang, J.H. Optimization of the Experimental Parameters Affecting the Corrosion Behavior for Mg–Y–Zn–Mn Alloy via Response Surface Methodology. Met. Mater. Int. 2021, 27, 5095–5107. [Google Scholar] [CrossRef]
- Muhammad, N.M.; Suhaidi, S. Optimization of power conversion efficiency of polyvinyl-alcohol/titanium dioxide compact layer using response surface methodology/central composite design. Sol. Energy 2019, 183, 689–696. [Google Scholar]
- Khalid, H.R.; Anees, A.K. Optimization of inhibitive action of sodium molybdate (VI) for corrosion of carbon steel in saline water using response surface methodology. Korean J. Chem. Eng. 2019, 36, 1350–1359. [Google Scholar]
- Shi, Z.; Jia, J.X. Galvanostatic anodic polarization curves and galvanic corrosion of high purity Mg in 3.5% NaCl saturated with Mg (OH)2. Corros. Sci. 2012, 60, 296–308. [Google Scholar] [CrossRef]
- Leng, Z.; Zhang, J. Influence of biocorrosion on microstructure and mechanical properties of deformed Mg–Y–Er–Zn biomaterial containing 18R-LPSO phase. J. Mech. Behav. Biomed. Mater. 2013, 28, 332–339. [Google Scholar] [CrossRef] [PubMed]
- Birbilis, N.; Easton, M.A. On the corrosion of binary magnesium-rare earth alloys. Corros. Sci. 2009, 51, 683–689. [Google Scholar] [CrossRef]
- Zhang, B.; Wang, J. Unmasking chloride attack on the passive film of metals. Nat. Commun. 2018, 9, 2559. [Google Scholar] [CrossRef]
- Jaleh, B.; Nasri, A.; Eslamipanah, M.; Nasrollahzadeh, M.; Daneshnazar, M.; Advani, J.H.; Fornasiero, P.; Zbořil, R.; Antonietti, M.; Gawande, M.B. State-of-the-art and perspectives of nickel-based single-atom catalysts. Appl. Catal. B Environ. Energy 2024, 361, 124590. [Google Scholar] [CrossRef]
- Fan, M.; Huang, J.E. Cationic-group-functionalized electrocatalysts enable stable acidic CO2 electrolysis. Nat. Catal. 2023, 6, 763–772. [Google Scholar] [CrossRef]
- Song, X.; Li, X.; Wang, J.; Dong, H.; Lyu, Z. The Effects of Magnetic Field on Corrosion Rate and Anodic Processes of Axel Steel in Sodium Chloride Solution. Corros. Prot. 2024, 45, 1–7. [Google Scholar]
- Li, H.; Luan, D. Electrochemical Reaction Kinetics at Constant Interfacial Potential. ACS Catal. 2024, 14, 12814–12823. [Google Scholar] [CrossRef]
- Gichan, O.I.; Pototskaya, V.V. Mass transport and dynamical instabilities in a model electrocatalytic process with a preceding chemical reaction. Electrochim. Acta 2020, 363, 137228. [Google Scholar] [CrossRef]
Disclaimer/Publisher’s Note: The statements, opinions and data contained in all publications are solely those of the individual author(s) and contributor(s) and not of MDPI and/or the editor(s). MDPI and/or the editor(s) disclaim responsibility for any injury to people or property resulting from any ideas, methods, instructions or products referred to in the content. |
© 2025 by the authors. Licensee MDPI, Basel, Switzerland. This article is an open access article distributed under the terms and conditions of the Creative Commons Attribution (CC BY) license (https://creativecommons.org/licenses/by/4.0/).