Article

Magnesium Silicate Honeycomb Structure on Attapulgite Clay Composite by Self-Template Method for Adsorption of Methylene Blue

1
State Key Laboratory of Chemical Resource Engineering, College of Chemistry, Beijing University of Chemical Technology, No. 15 Beisanhuan East Road, Beijing 100029, China
2
Guangxi Petrochemical Company, PetroChina, Qinzhou 535008, China
3
Department of Chemistry, University of Chakwal, Chakwal 48800, Pakistan
*
Authors to whom correspondence should be addressed.
Materials 2025, 18(4), 792; https://doi.org/10.3390/ma18040792
Submission received: 22 November 2024 / Revised: 27 January 2025 / Accepted: 8 February 2025 / Published: 11 February 2025

Abstract

:
A series of porous silica materials coated with honeycomb-like magnesium silicate were prepared under hydrothermal conditions, using natural one-dimensional porous attapulgite as the template and a silicon source with different Mg/Si ratios, by adjusting the amount of MgCl2⋅6H2O and the attapulgite precursor and regulating pH. The influence of the Mg/Si ratios was carefully investigated on morphology, pore structure, and related adsorption actions toward methylene blue. The Langmuir isotherm and pseudo-second-order kinetic models were used to explain the adsorption behavior of methylene blue. The synthesized composite with the lowest magnesium content displayed the highest removal capability of 166.67 mg/g for methylene blue, with a zeta potential of −18.18 mV, a specific surface area of 310.4 m2/g, and an average pore size of 3.7 nm. The removal result was the synergetic adsorption between porous magnesium silicate grown on the surface and the rest of the silica, further indicating that the attapulgite is available as a silicon source and a rod-shaped template for magnesium silicate.

1. Introduction

The harmful effects of high dye concentrations in water on aquatic and human life make them a major concern [1]. There are several different technologies available to eliminate fabric dyes from water. Among them, adsorption is one of the most versatile and promising techniques because it is inexpensive, easy to operate, simple and adaptable in design, and does not produce secondary pollutants [2]. Recently, natural clays, including magnesium silicates, have become attractive as high-performance adsorbents because of their affordability, environmental friendliness, high porosity, and large surface area [3,4]. A metal hydroxide octahedral sheet with a tetrahedral-to-octahedral ratio of 2:1 (T-O-T) or 1:1 (T-O) holds one or two silica tetrahedral sheets, which together form the layered structure of silicate minerals. An octahedral sheet is made up of Al2(OH)6 units, in which Al can be substituted with other metal ions, like Mg, Fe, and so forth, whereas a tetrahedral sheet is typically composed of Si2O6(OH)4 units [5]. Some structures of a few magnesium silicates are sepiolite, 2:1 phyllosilicates/talc, and 1:1 phyllosilicate/serpentine group [6,7]. Silicate clays are used in a wide range of fields, including water treatment, due to their layer structure, silanol and metal hydroxyl groups, and ion exchangeability [8].
Furthermore, magnesium silicate’s adsorption performance mainly depends on the pore structure and surface properties, which are related to the corresponding synthesis methods [9]. For example, Huang et al. prepared a group of silicate hydrates with an improved adsorption performance toward methylene blue following negative surface charge density. Attapulgite is one type of natural clay made of nanoscale building blocks of hydrated magnesium silicate [10], with the chemical formula of Mg5Si8O20(OH)2(OH2)4⋅4H2O, which is a kind of one-dimensional mineral ranging in diameter from 20 to 70 nm and length from 1 to 5 µm [11]. Generally, attapulgite has been used as an adsorbent toward heavy metals and organic dyes due to its low cost and porous structure [12,13]. Yet, the removal capacity is limited. It is necessary to modify the pore structure and surface properties, which may enhance the removal performance and then accelerate the removal rate. Natural clay with high adsorption performance can be achieved through organic modification, pillaring, and acid treatment [14,15,16,17]. Anirudhan and Ramachandran [18] modified bentonite clay with hexadecyl trimethyl ammonium chloride to enhance the adsorption of some basic dyes from aqueous solutions, such as crystal violet and methylene blue. Furthermore, it is possible to create porous silicate composite materials and porous silica nanorods from naturally occurring palygorskite [19,20]. The formation, pore structure, and associated removal performance toward contaminants can be optimized by appropriately adjusting the feeding ratios of Mg/Si precursors (later, abbreviated as Mg/Si ratio) in the reaction system [9,21].
Until now, various hard or soft templates have been primarily used to develop layered magnesium silicates with improved pore structures [19,22]. However, removing templates is tricky, energy-intensive, and not discerning [23]. The simple synthesis design and self-templating methods are gaining attention as a simple way to overcome the difficulty to remove the used templates [24]. The distinct characteristics of natural clays, including easy availability, low cost, high specific surface area, and wide-ranging structure, make them a desirable class of template materials [25,26]. Among the available templates, attapulgite is regarded as a competitive template material used to create various nanomaterials [20].
In this work, we develop a series of silica coated with magnesium silicate with different Mg/Si ratios using the silica precursor as a Si-bearing self-templating agent, derived from raw attapulgite minerals under hydrothermal conditions. The primary objective is to alter the natural clay to improve its adsorption capacity for cationic dye polluters. The adsorption behavior of the composites toward methylene blue dye is carefully investigated. Figure 1 demonstrates the formation of the honeycomb structure of the ATP-MSH composite with the influence of Mg/Si ratios on the surface area and corresponding adsorption capacity toward methylene blue compared with raw clay.

2. Experimental Section

2.1. Materials and Method

All the chemicals, including ammonia solution (65% vol), ammonium chloride, hydrochloric acid solution (36% w/w), magnesium chloride hexahydrate, and methylene blue (MB), were acquired from Sigma Aldrich(Shanghai) Trading Co., Ltd. (Shanghai, China) and were of analytical quality. Attapulgite (ATP) was obtained from Gansu Western Attapulgite Research and Application Institute (Baiyin, China).
A series of silica porous materials coated with magnesium silicate were produced through the process of acid leaching of raw attapulgite minerals (R-ATP). Then, a hydrothermal reaction was performed [20]. When treating acid leaching, 3.0 g of R-ATP was dispersed into 60 mL of HCl solution with a 4.0 mol/L concentration to ensure a unified suspension. The suspension was put into a 100 mL stainless-steel reaction vessel and placed in an oven at 140 °C for 6 h. After allowing the vessel to naturally cool to room temperature, the precipitate was separated by centrifugation, washed with deionized water, dried for 12 h at 80 °C in an oven, and labeled as H-ATP. Four magnesium silicate hydrate (MSH) composites with different Mg/Si mole ratios (0.67–1.5) were produced by the hydrothermal method. For MSH with Mg/Si = 0.67, 20 mmol (1.21 g) of H-ATP was mixed with 60 mL of water containing 13.34 mmol (2.7120 g) of MgCl2⋅6H2O, 1.605 g (30 mmol) of NH4Cl, and 3 mL of 65% ammonia solution. After 20 min of sonication, it was removed into a 100 mL stainless-steel autoclave reactor and heated to 140 °C for 12 h. The white product was centrifuged, washed with deionized water, and allowed to cool to room temperature before being dried for 12 h at 80 °C. For other MSH samples, the same process was carried out, and the resulting products were labeled as ATP-MSH-0.67 to ATP-MSH-1.50 according to Mg/Si ratios, respectively.

2.2. Instrumentation

An X-ray diffractometer (SHIMADZU XRD-6000, Tokyo, Japan) was used to analyze the crystal structure at 40 kV using Cu Kα radiation (λ = 1.5406 Å). Using an FT-IR Spectrophotometer (SHIMADZU IRspirit-A224160, Tokyo Japan), the functional groups were examined in the range of 4000–400cm−1. The surface morphologies were examined using SEM (Zeiss Supra 55, Oberkochen, Germany). Low-temperature nitrogen adsorption–desorption tests were conducted using a BET analyzer (BEISHIDE BSD-PM2, Beijing, China) after a three-hour degassed treatment at 120 °C. A TGA-DTG analyzer (SDT Q-600, TA, Beijing, China) with a sensitivity of 0.1 μg and 0.001 °C was used to perform a thermal decomposition test. A Malvern Zeta sizer Pro (Malvern Panalytical, Malvern, UK) was used to measure the zeta potential.

2.3. Adsorption Experiment

For adsorption kinetics, 50.0 mg of each composite was dispersed into 100 mL (100.0 mg/L) of methylene blue at 25 °C and set in a thermostat shaker with a shaking speed of 150 rpm. A wavelength of 664 nm was used to perform spectrophotometric analysis on the dye concentrations after separating the solid adsorbent by centrifugation. Equation (1) was used to determine the adsorption capacity with time (qt):
q t = C 0 C t   m g / L × v o l u m e   o f   s o l u t i o n   ( L ) m a s s   o f   a d s o r b e n t   ( g )
where qt is the adsorption capacity at time t (mg/g), C0 is the initial concentration of dye (mg/L), and Ct is the concentration of dye at time t (mg/L). Furthermore, the removal rate of the adsorption reaction was calculated using the pseudo-first- and pseudo-second-order kinetic models in Equations (2) and (3):
ln q e q t = l n q e k 1 t
t q t = 1 k 2 q e 2 + t q e
where qe (mg/g) and qt (mg/g) are the respective amounts of dye adsorbed at equilibrium and at time t (h), and k1 (h−1) and k2 (mgg−1 h−1) are the respective rate constants for the pseudo-first- and pseudo-second-order models.
The Elovich kinetic model is described in Equation (4):
q t = 1 α   L n α β + 1 β   L n ( t )
where the constant α is the initial adsorption rate (mg g−1 min−1) and β (g mg−1) is related to the activation energy and the adsorption heat.
Then, 50 mg of adsorbent was dispersed into individual 100.0 mL MB solutions with different concentrations ranging from 80.0 mg/L to 300.0 mg/L for the isotherm investigation. After the equilibrium time, the remaining dye concentrations were examined, and the equilibrium adsorption amount was calculated using Equation (5). The Langmuir model in Equation (6) and the Freundlich model in Equation (7) were plotted using the obtained data:
q e = C 0 C e   m g / L × v o l u m e   o f   s o l u t i o n   ( L ) m a s s   o f   a d s o r b e n t   ( g )
C e q e = C e q m + 1 K L q m
l o g q e = l o g K F + 1 n l o g C e
where Ce (mg/L) is the equilibrium dye concentration, qe (mg/g) is the amount of dye adsorbed at the equilibrium state, KL, KF, and n are the empirical constants, and qm (mg/g) is the maximum adsorption capacity toward dye.

3. Results and Discussion

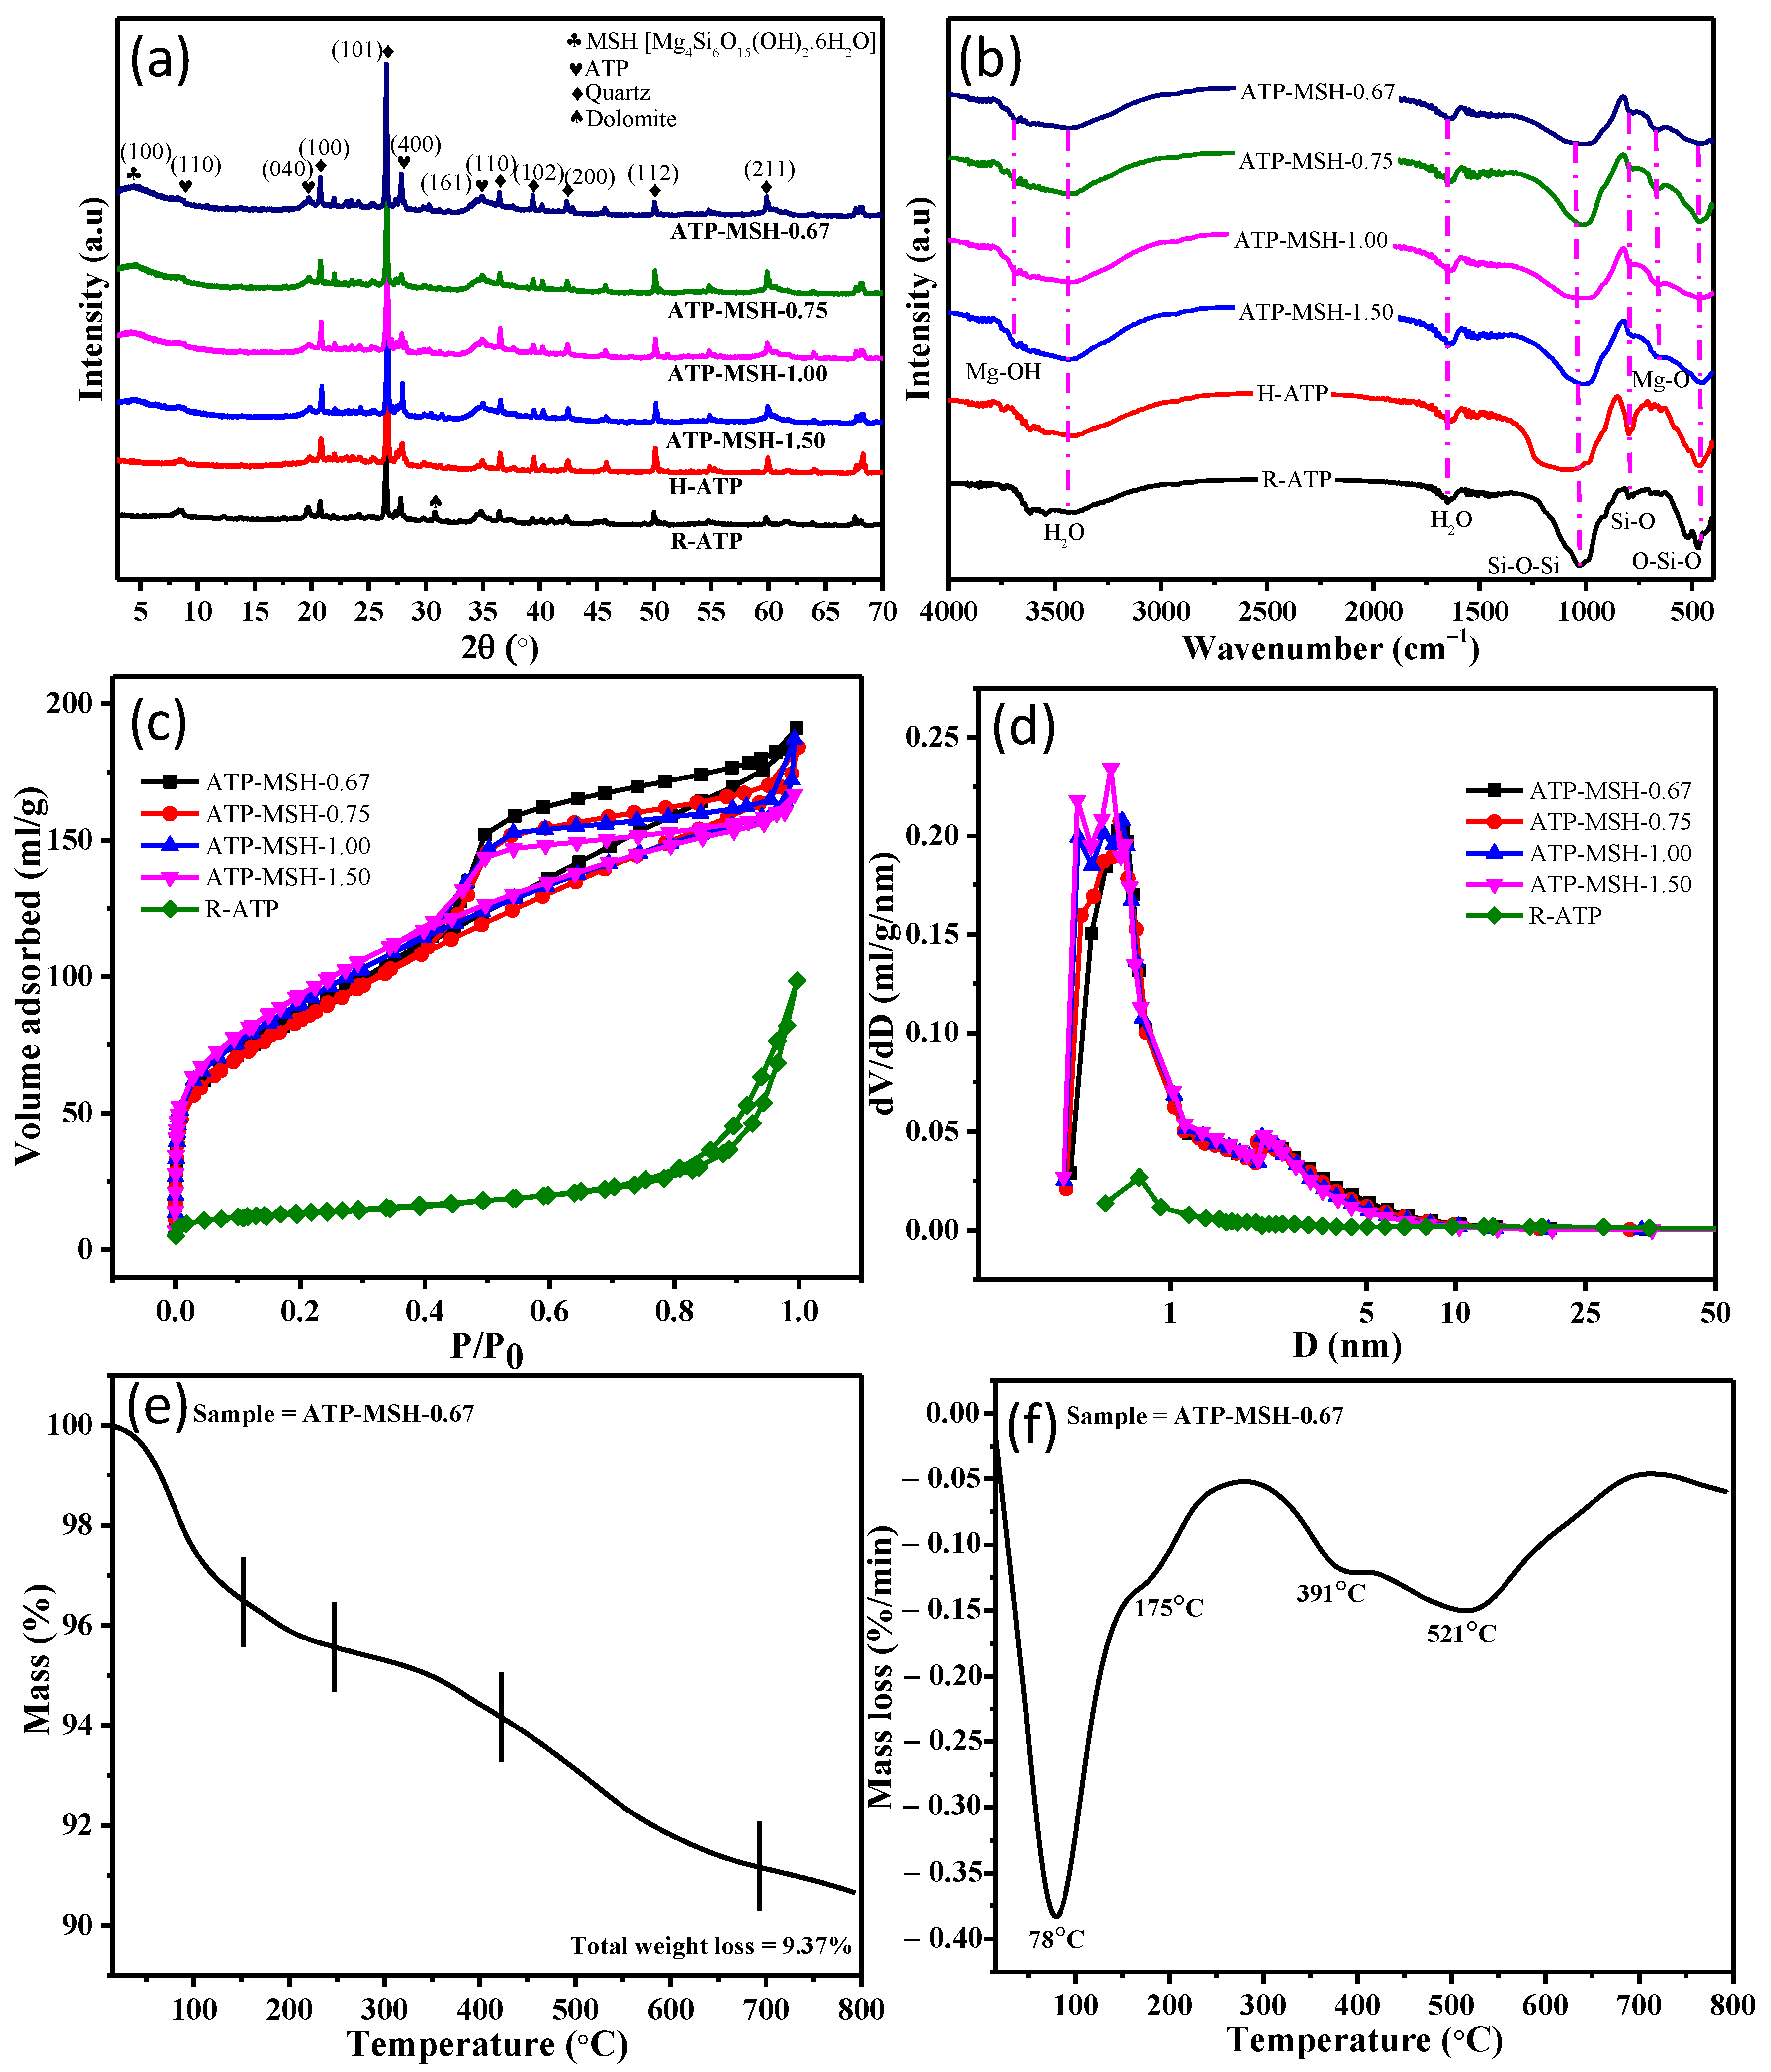
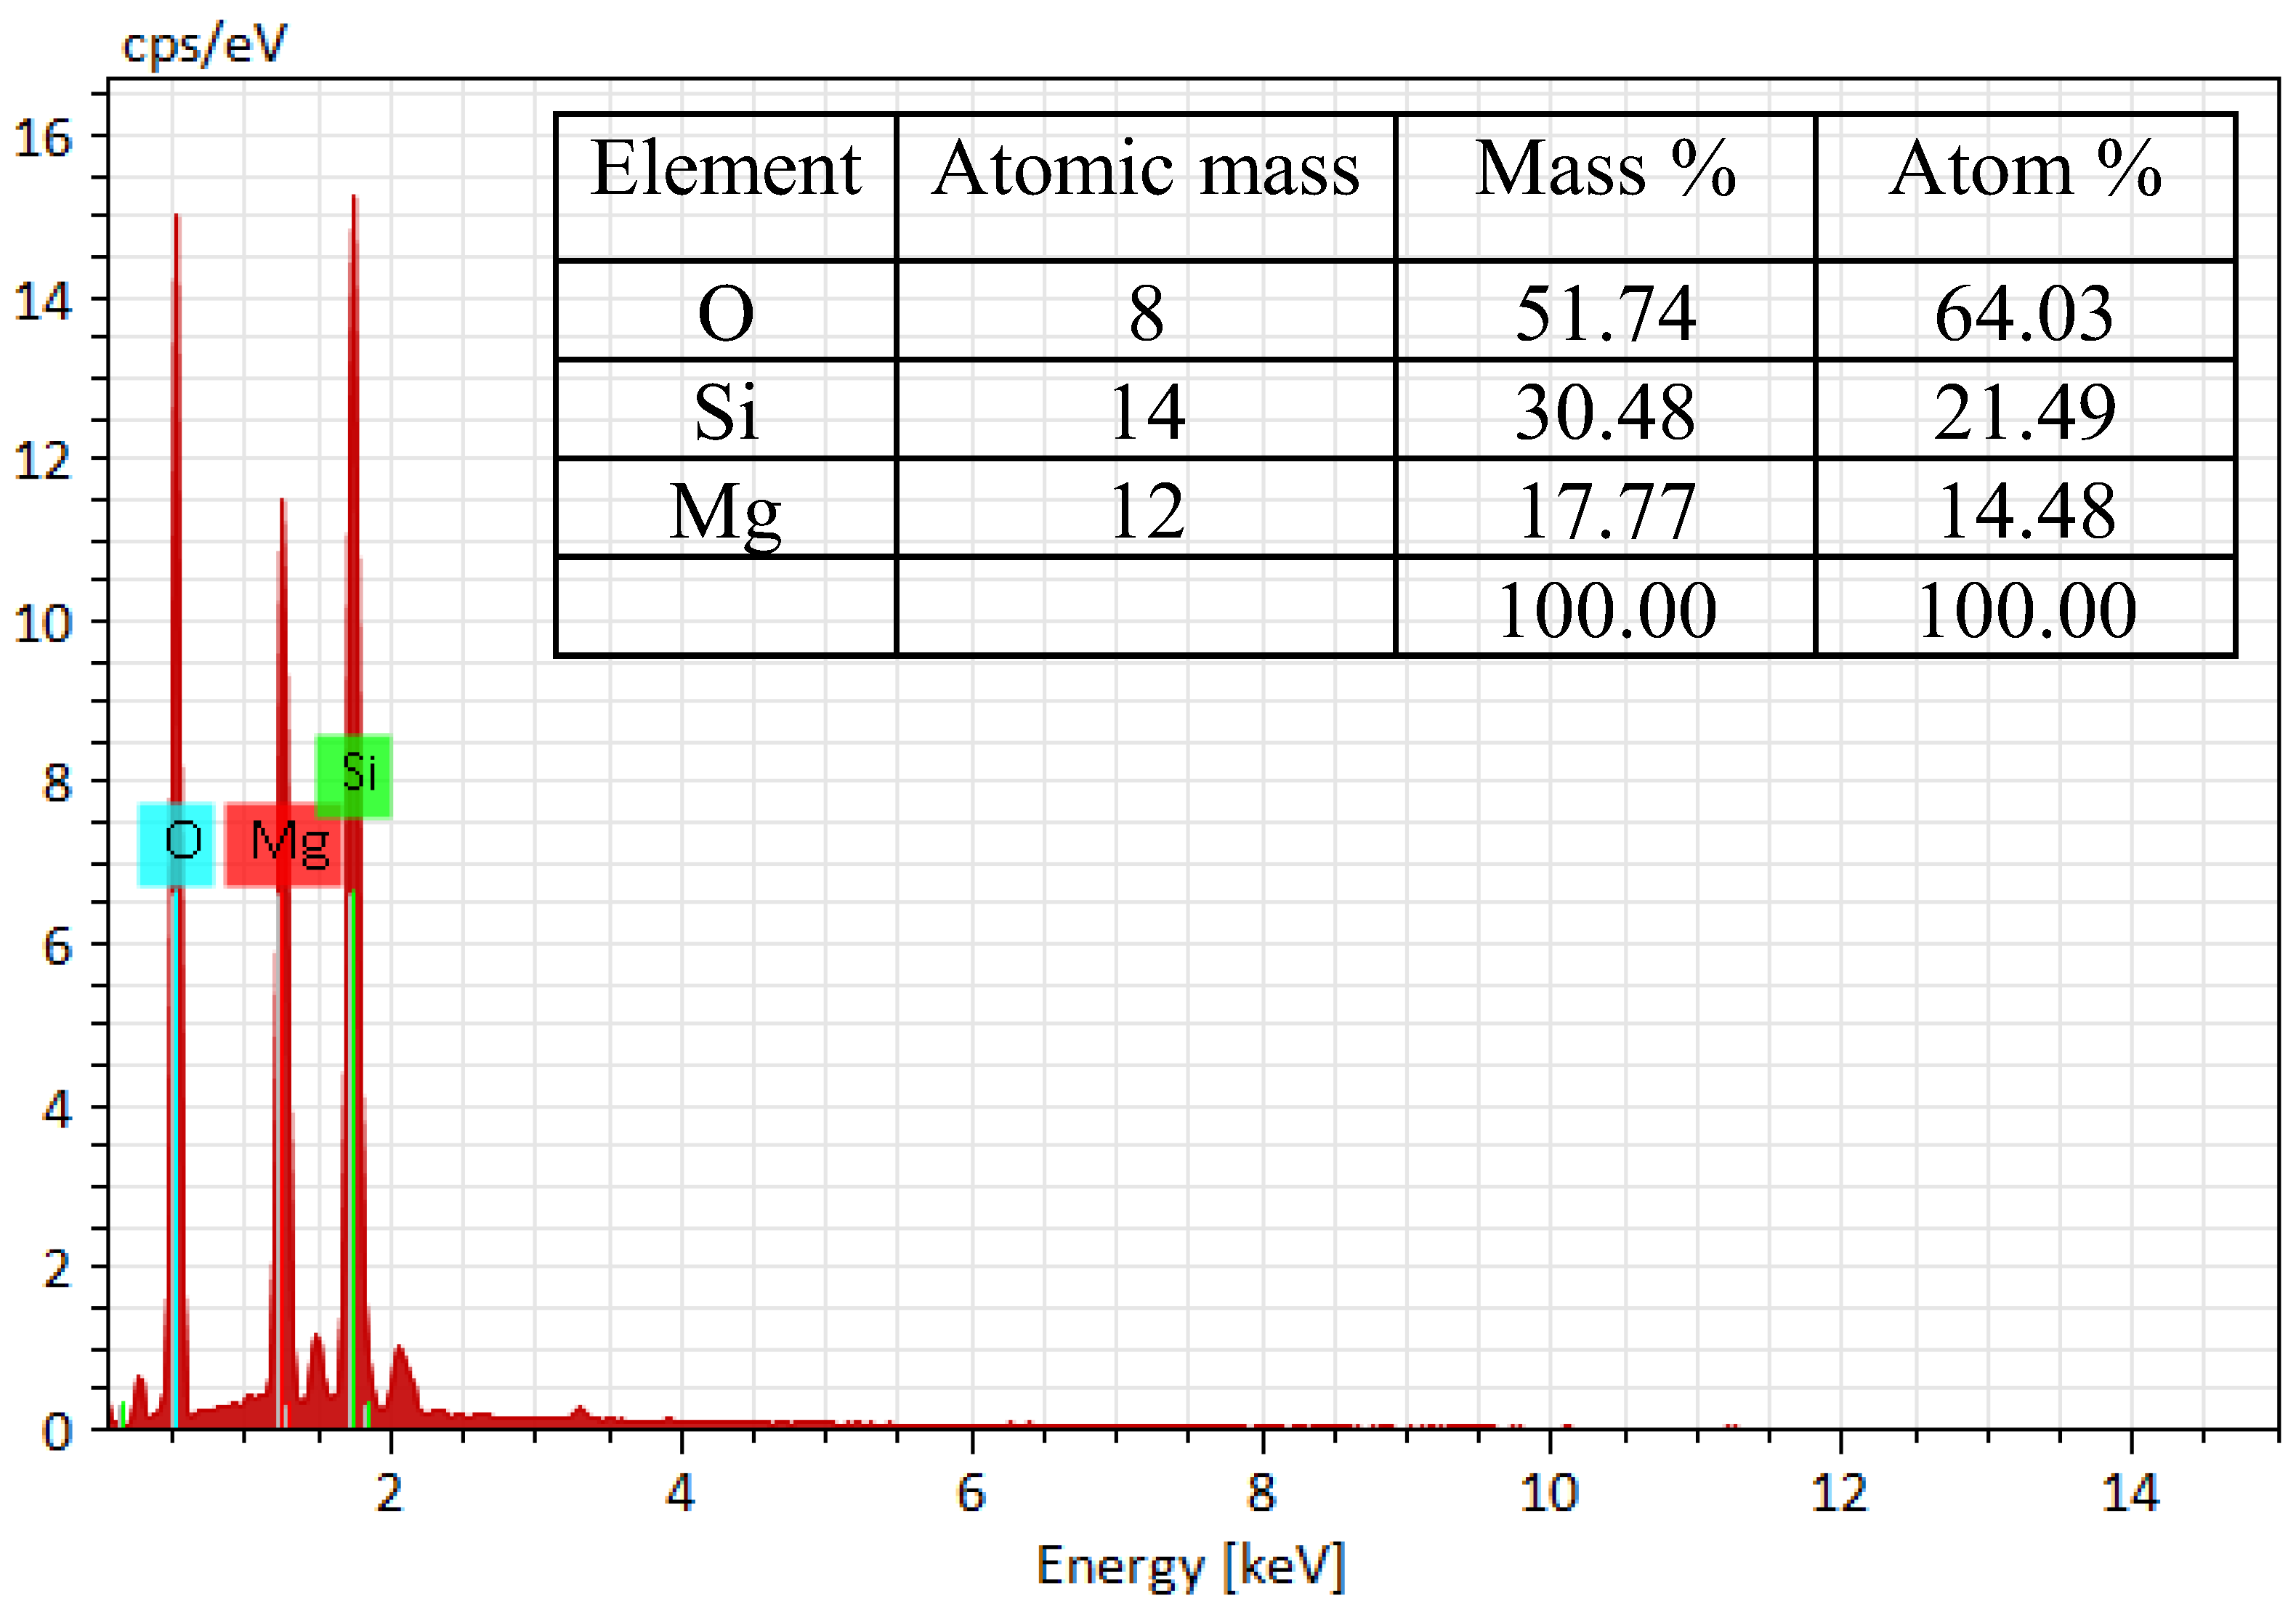
3.1. Structure and Chemical Composition

Figure 2a displays the crystal nature of raw ATP (R-ATP), acid-leached ATP (H-ATP), and a series of composites with different Mg/Si ratios. The XRD spectrum of R-ATP exhibits the characteristic diffractions of attapulgite (ATP) clay at 2θ = 8.44°, 19.68°, 27.8°, and 34.9° for (110), (040), (400), and (161) crystal planes, respectively [27,28,29]. Moreover, R-ATP also displays the diffraction pattern of quartz at 2θ = 20.76°, 26.52°, 36.44°, 39.34, 42.3°, 49.98°, and 59.86° for (100), (101), (110), (102), (200), (112), and (211) crystal planes (JCPDS Card No. 46-1045) and the diffraction pattern of dolomite at 2θ = 30.78° (JCPDS Card No. 36-0426), indicating raw clay is composed of ATP, quartz, and dolomite. After hydrochloric acid treatment, dolomite was completely removed from the raw material, and weak diffraction peaks of ATP were still observed, indicating that ATP has a high resistance to hydrochloric acid. Although ATP was not entirely removed from the raw material, the emergence of a strong silica diffraction peak between 2θ = 20 and 30° revealed the successful extraction of silica from raw ATP [30]. The silica diffraction peak’s intensity gradually dropped with an increase in Mg loading. The resulting magnesium silicate hydrates (MSH) showed similar peaks of sepiolite type MSH, Mg4Si6O15(OH)2.6H2O (JCPDS Card No. 29-1492) at 2θ = 4.5°, 20.12°, 34.62°, and 60.89°, which corresponded to the (100), (310), (102), and (4 15 1) crystal planes, excluding a slight shift of the (100) diffraction plane.
Figure 2b shows FT-IR spectra of raw ATP (R-ATP), acid-leached ATP (H-ATP), and a series of the prepared composites. The adsorbed and structural water in silica and magnesium silicate exhibited broad absorption bands around 3433 cm−1 and 1640 cm−1. H-ATP displayed a broad absorption band at 1094 cm−1 associated with the stretching vibration of Si-O-Si, an absorption band at 463 cm−1 related to the bending vibration of O-Si-O, and an additional absorption band centered at 798 cm−1 for Si-O vibration, which had more significant intensity compared to other MSH composites [31,32,33]. In comparison, the FT-IR spectra of composites were similar to H-ATP, except for a few typical absorption bands shifting to a lower wavenumber. For instance, the absorption band centered at 798 cm−1 for the Si-O vibration and the broad absorption band at roughly 1094 cm−1 associated with the stretching vibration of Si-O-Si were shifted to 778 cm−1 and 1008 cm−1, respectively. Additionally, a new absorption band at 666 cm−1 for lattice vibration of the Mg-O bond and an absorption band related to the O-H stretching vibration of Mg-OH appeared at 3677 cm−1, revealing the formation of magnesium silicates [34,35].
Figure 2c,d demonstrate the pore size distribution by the BJH method and the nitrogen adsorption–desorption isotherm by the BET method at 77 K of R-ATP and the prepared composites, and Table 1 lists the corresponding pore parameters. The observation of the Type-IV adsorption isotherm with the H3 hysteresis loop exhibited the mesoporous nature of the composite [36,37]. The reaction system can enhance the surface area by adjusting the feeding ratios of MgCl2.6H2O and the ATP. For example, the synthesized composites had a larger surface area (303–332 m2/g), which was over six times larger compared with raw ATP clay (46.15 m2/g), which may enhance the adsorption capacity. Compared with raw ATP, pore volume increased from 0.14 cm3/g to 0.29 cm3/g, while pore sizes decreased from 13.53 nm to 3.74 nm when the Mg/Si ratio reached 0.67. Among the synthesized composites, pore sizes gradually increased from 3.23 nm to 3.74 nm. Consequently, the surface area and porous nature of the materials, which are also important parameters for adsorption, can be adjusted by adjusting the Mg/Si ratios [38,39].
Thermogravimetric analysis was conducted under atmospheric air to study the thermal decomposition of composites. Figure 2e,f display the TGA-DTG curves for the composites. Based on the TGA-DTG curves, thermal degradation of the composite (ATP-MSH-0.67) involved five stages (first (15–156 °C), second (156–264 °C), third (264–424 °C), fourth (424–698 °C), and fifth (698–800 °C)). The release of absorbed water was related to the first stage. The second, third, and fourth stages were attributed to the initial to final releases of hydrated water from the layer of the MSH lattice. On the other hand, the final stage involved the release of water in coordination with magnesium as a result of anhydride formation. Additionally, the hydroxyl group’s breakdown and the release of hydrated water caused a 9.37% mass loss in the synthesized composite.

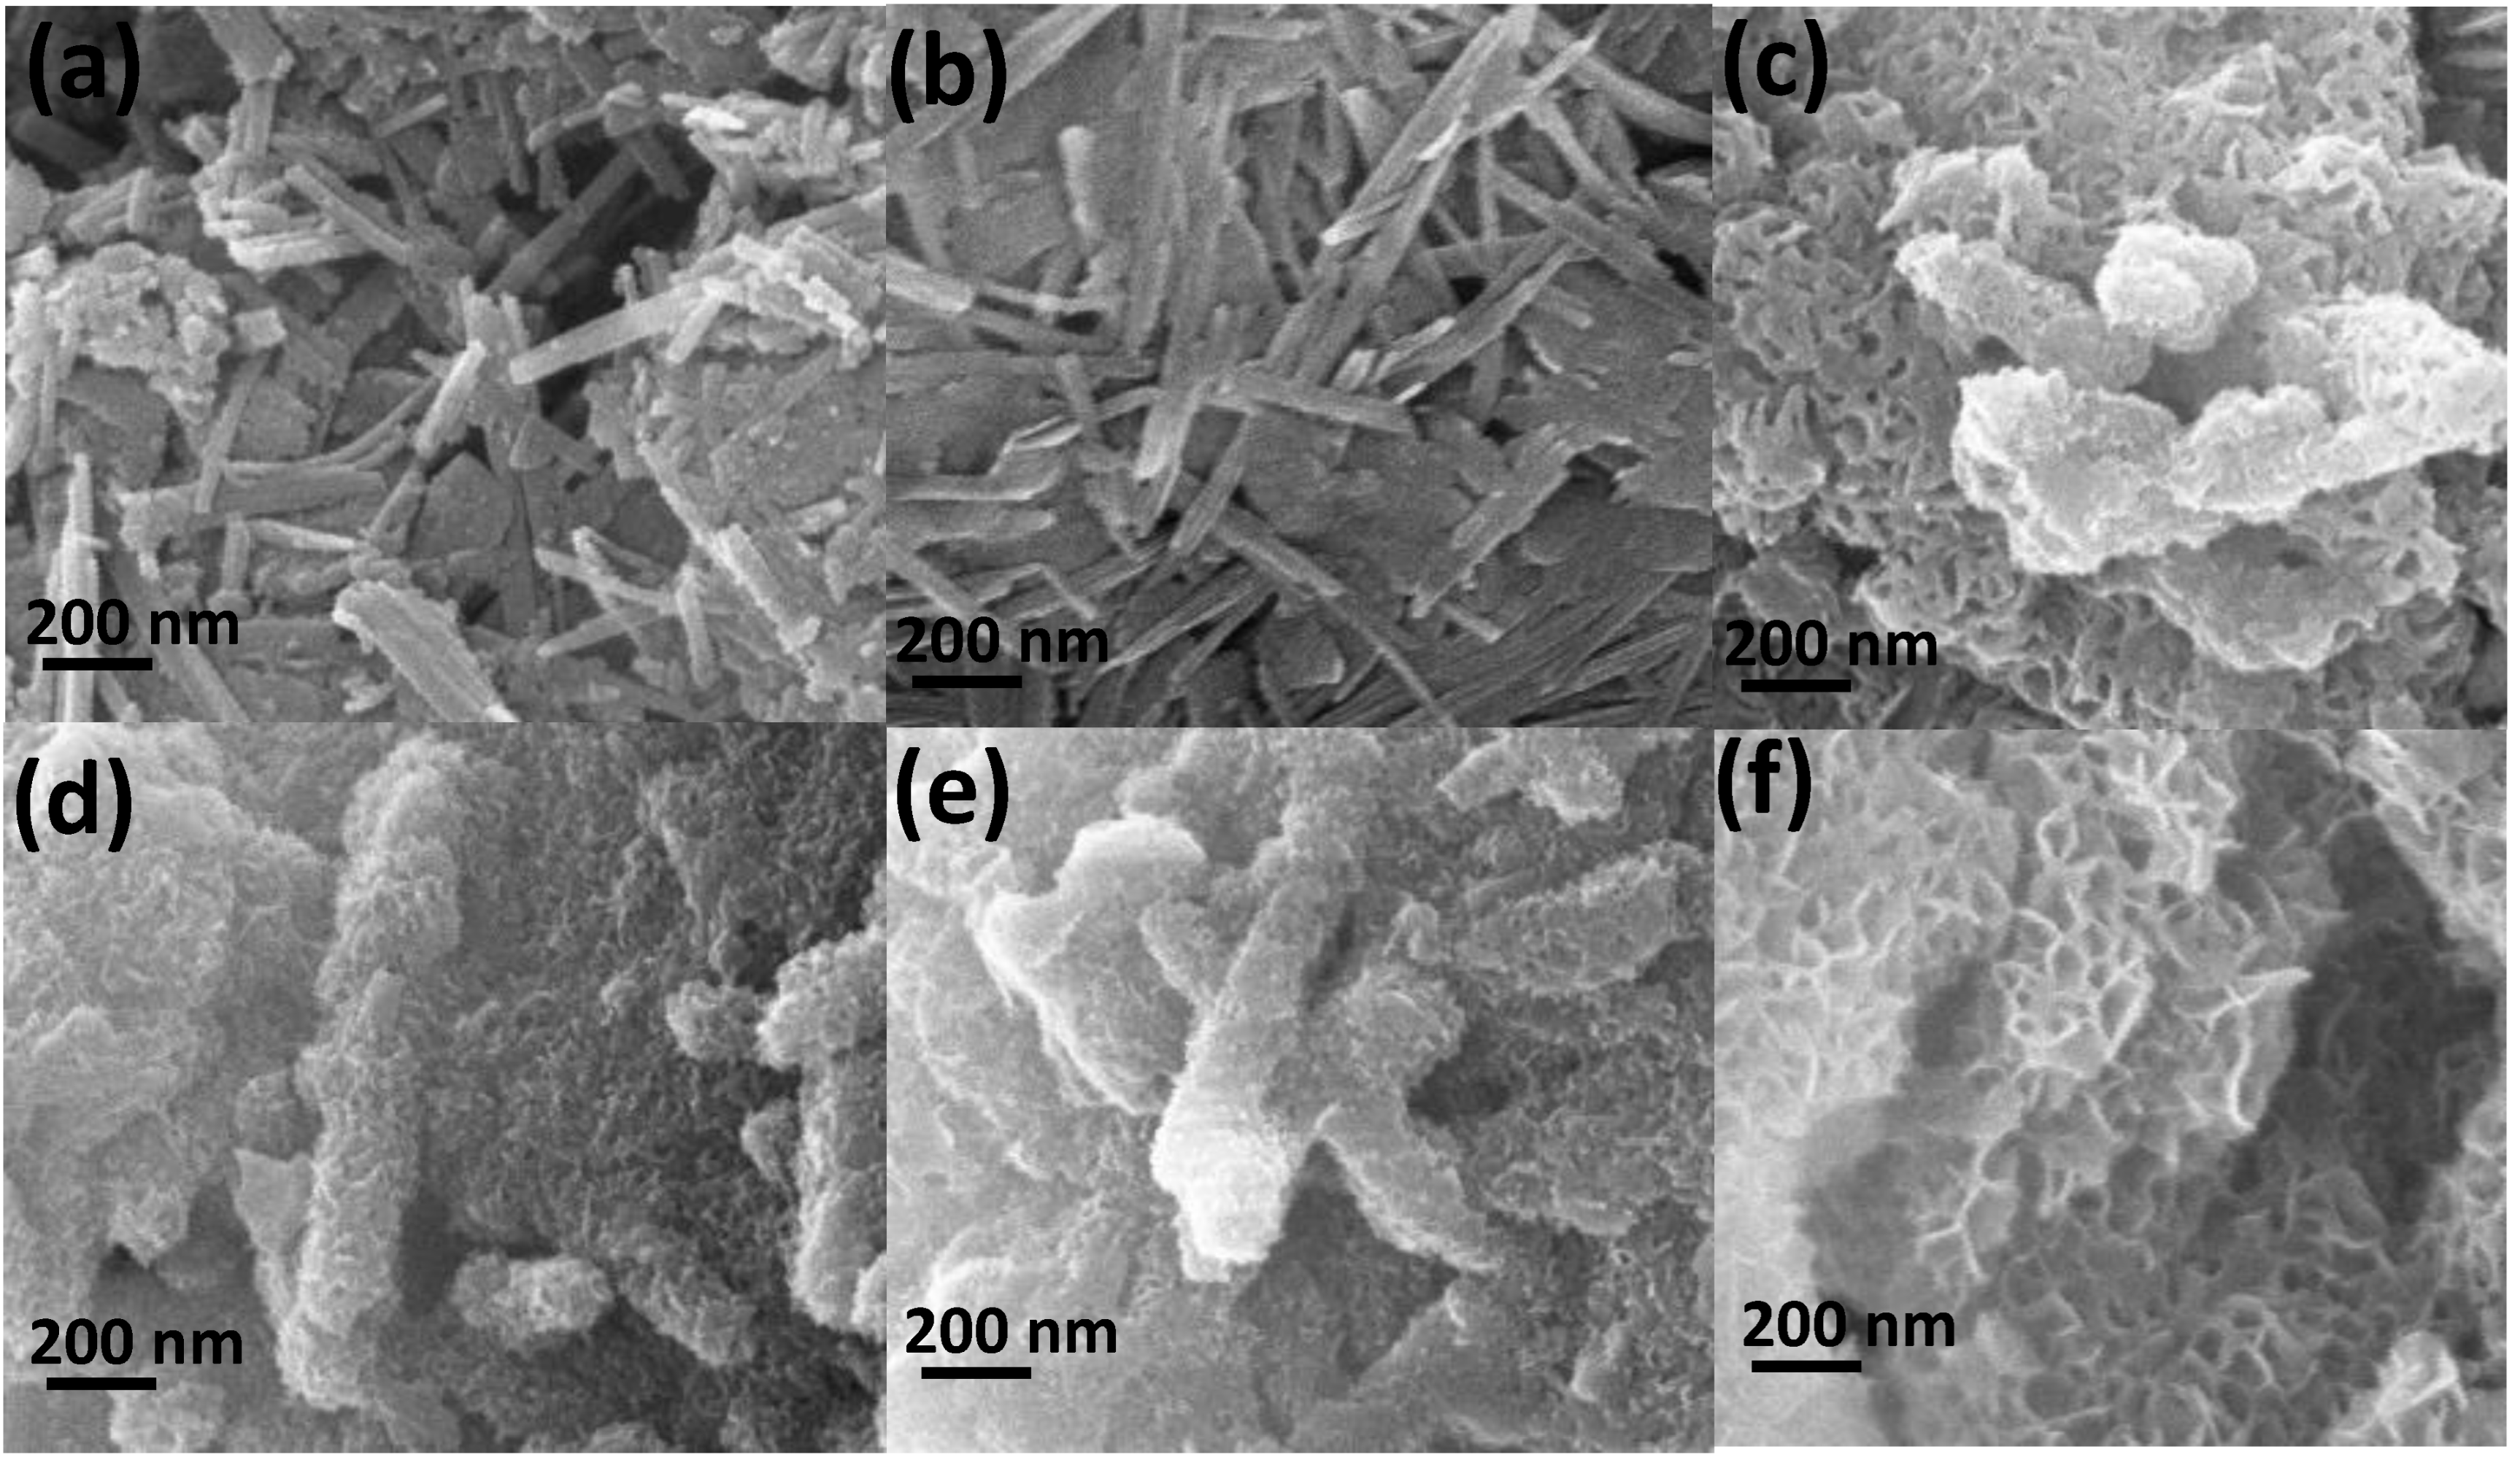
3.2. Surface Morphology

Figure 3 demonstrates SEM images of raw ATP, acid-leached ATP, and the synthesized composites. Before acid treatment, attapulgite nanofibers (Figure 3a) were clumped together. At the same time, they were split into separate nanofibers or smaller crystal bundles (Figure 3b) after the acid-leaching treatment. Acid attack altered their smooth surfaces into rough ones. After adding different amounts of Mg into the reaction system, honeycomb structures composed of small interlaced nanosheets were formed (Figure 3c–f). Among the synthesized composites, the one with the lowest Mg content (Figure 3f) exhibited the thinnest interlaced sheets along the rod. The morphology of the synthesized products differed noticeably from those of H-ATP and R-ATP, suggesting that the morphological structure of honeycomb composites was significantly influenced by the molar ratio of magnesium to silicon [40]. From the elemental composition of the prepared composite (MSH-ATP-0.67) characterized by EDS spectra, the material was composed of Mg, Si, and O, with corresponding atomic percentages of 14.48%, 21.49%, and 64.03%, showing that the resulted material exhibited the same calculated and experimental Mg-to-Si mole ratio of 0.67 (Figure 4).

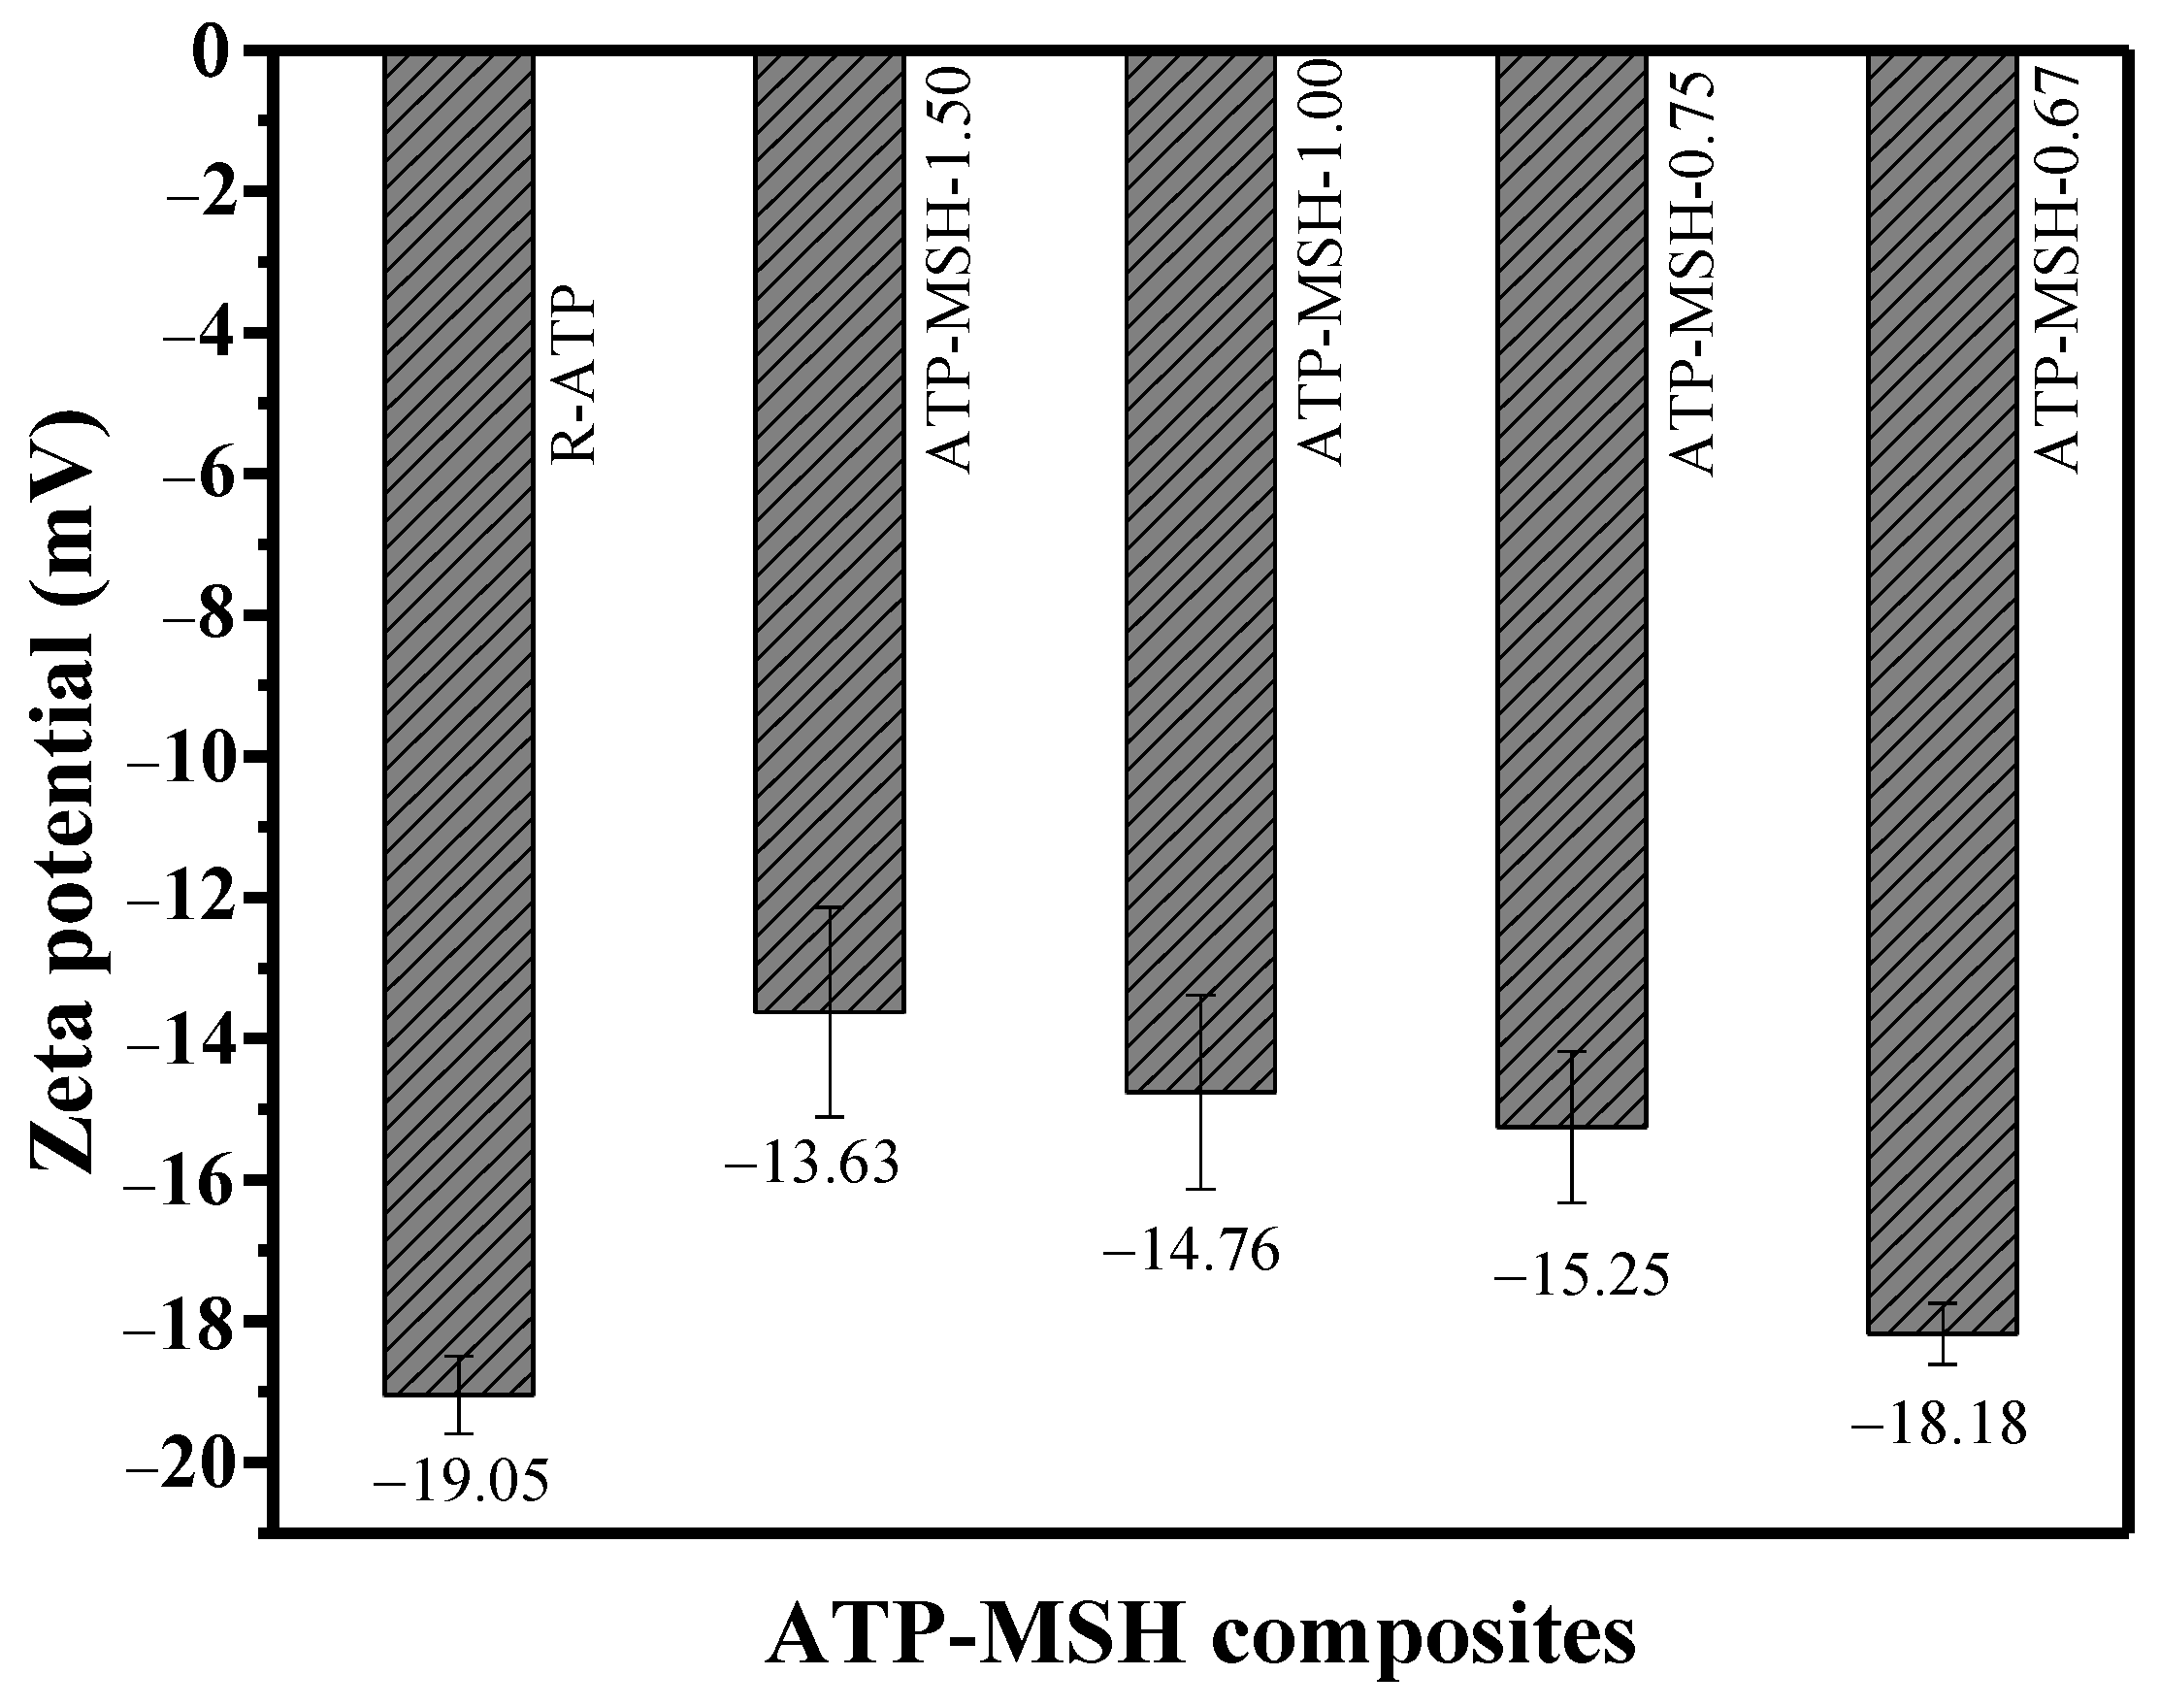
3.3. Zeta Potential Analysis

Figure 5 presents the obtained zeta potential data of R-ATP and composites. Considering the reaction system’s Mg and Si content, the samples with the lowest Mg/Si ratio exhibited a more negative zeta potential compared with the higher Mg/Si ratios [9]. For example, ATP-MSH-1.50 with Mg/Si = 1.50 had a lower zeta potential of −13.63 mV, while ATP-MSH-0.67 with Mg/Si = 0.67 showed a higher zeta potential of −18.18 mV. The higher silanol group was responsible for the material’s increased negative surface charge due to the higher amount of Si than Mg in composites exhibiting better adsorption toward cationic dyes [9]. The most negative charge (−18.18 mV) of ATP-MSH-0.67 with the highest Si content was still less than that (−19.05 mV) of raw ATP, even though the zeta potential of the composites behaved more negatively with higher Si. According to the observed adsorption data, the composite exhibited better MB adsorption results than raw ATP, which could result from the composites’ synergistic effect.

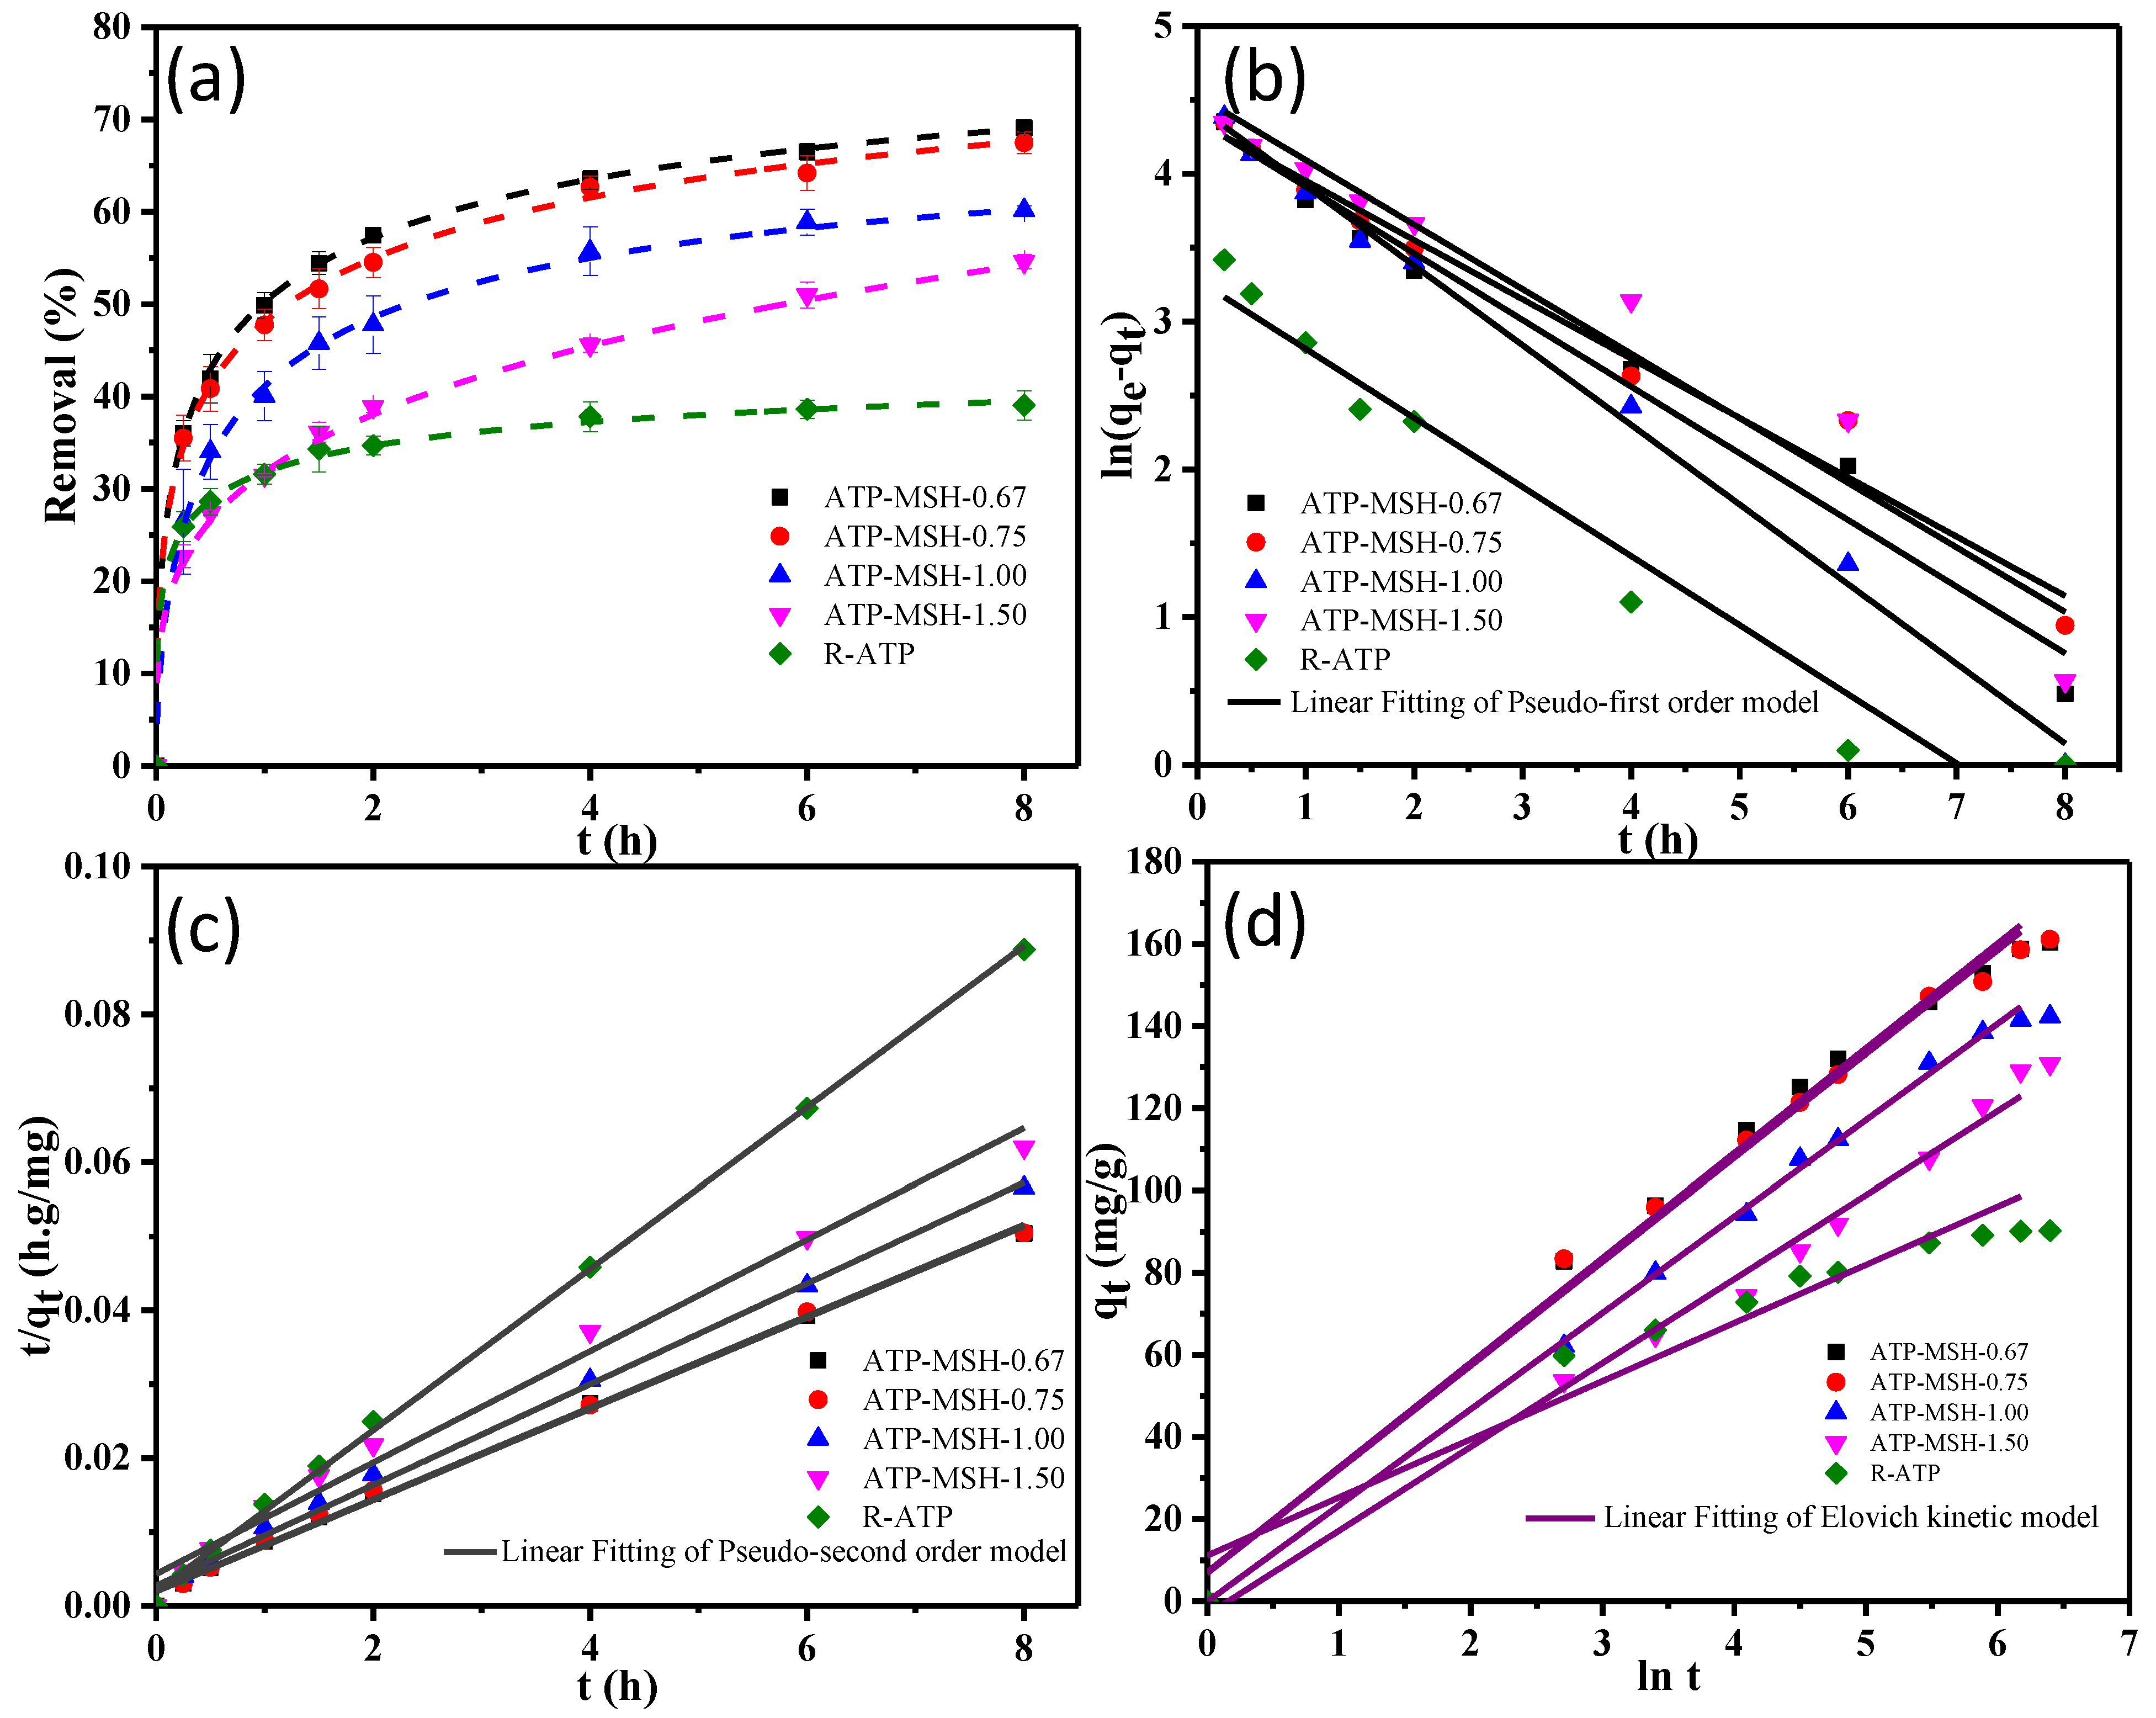
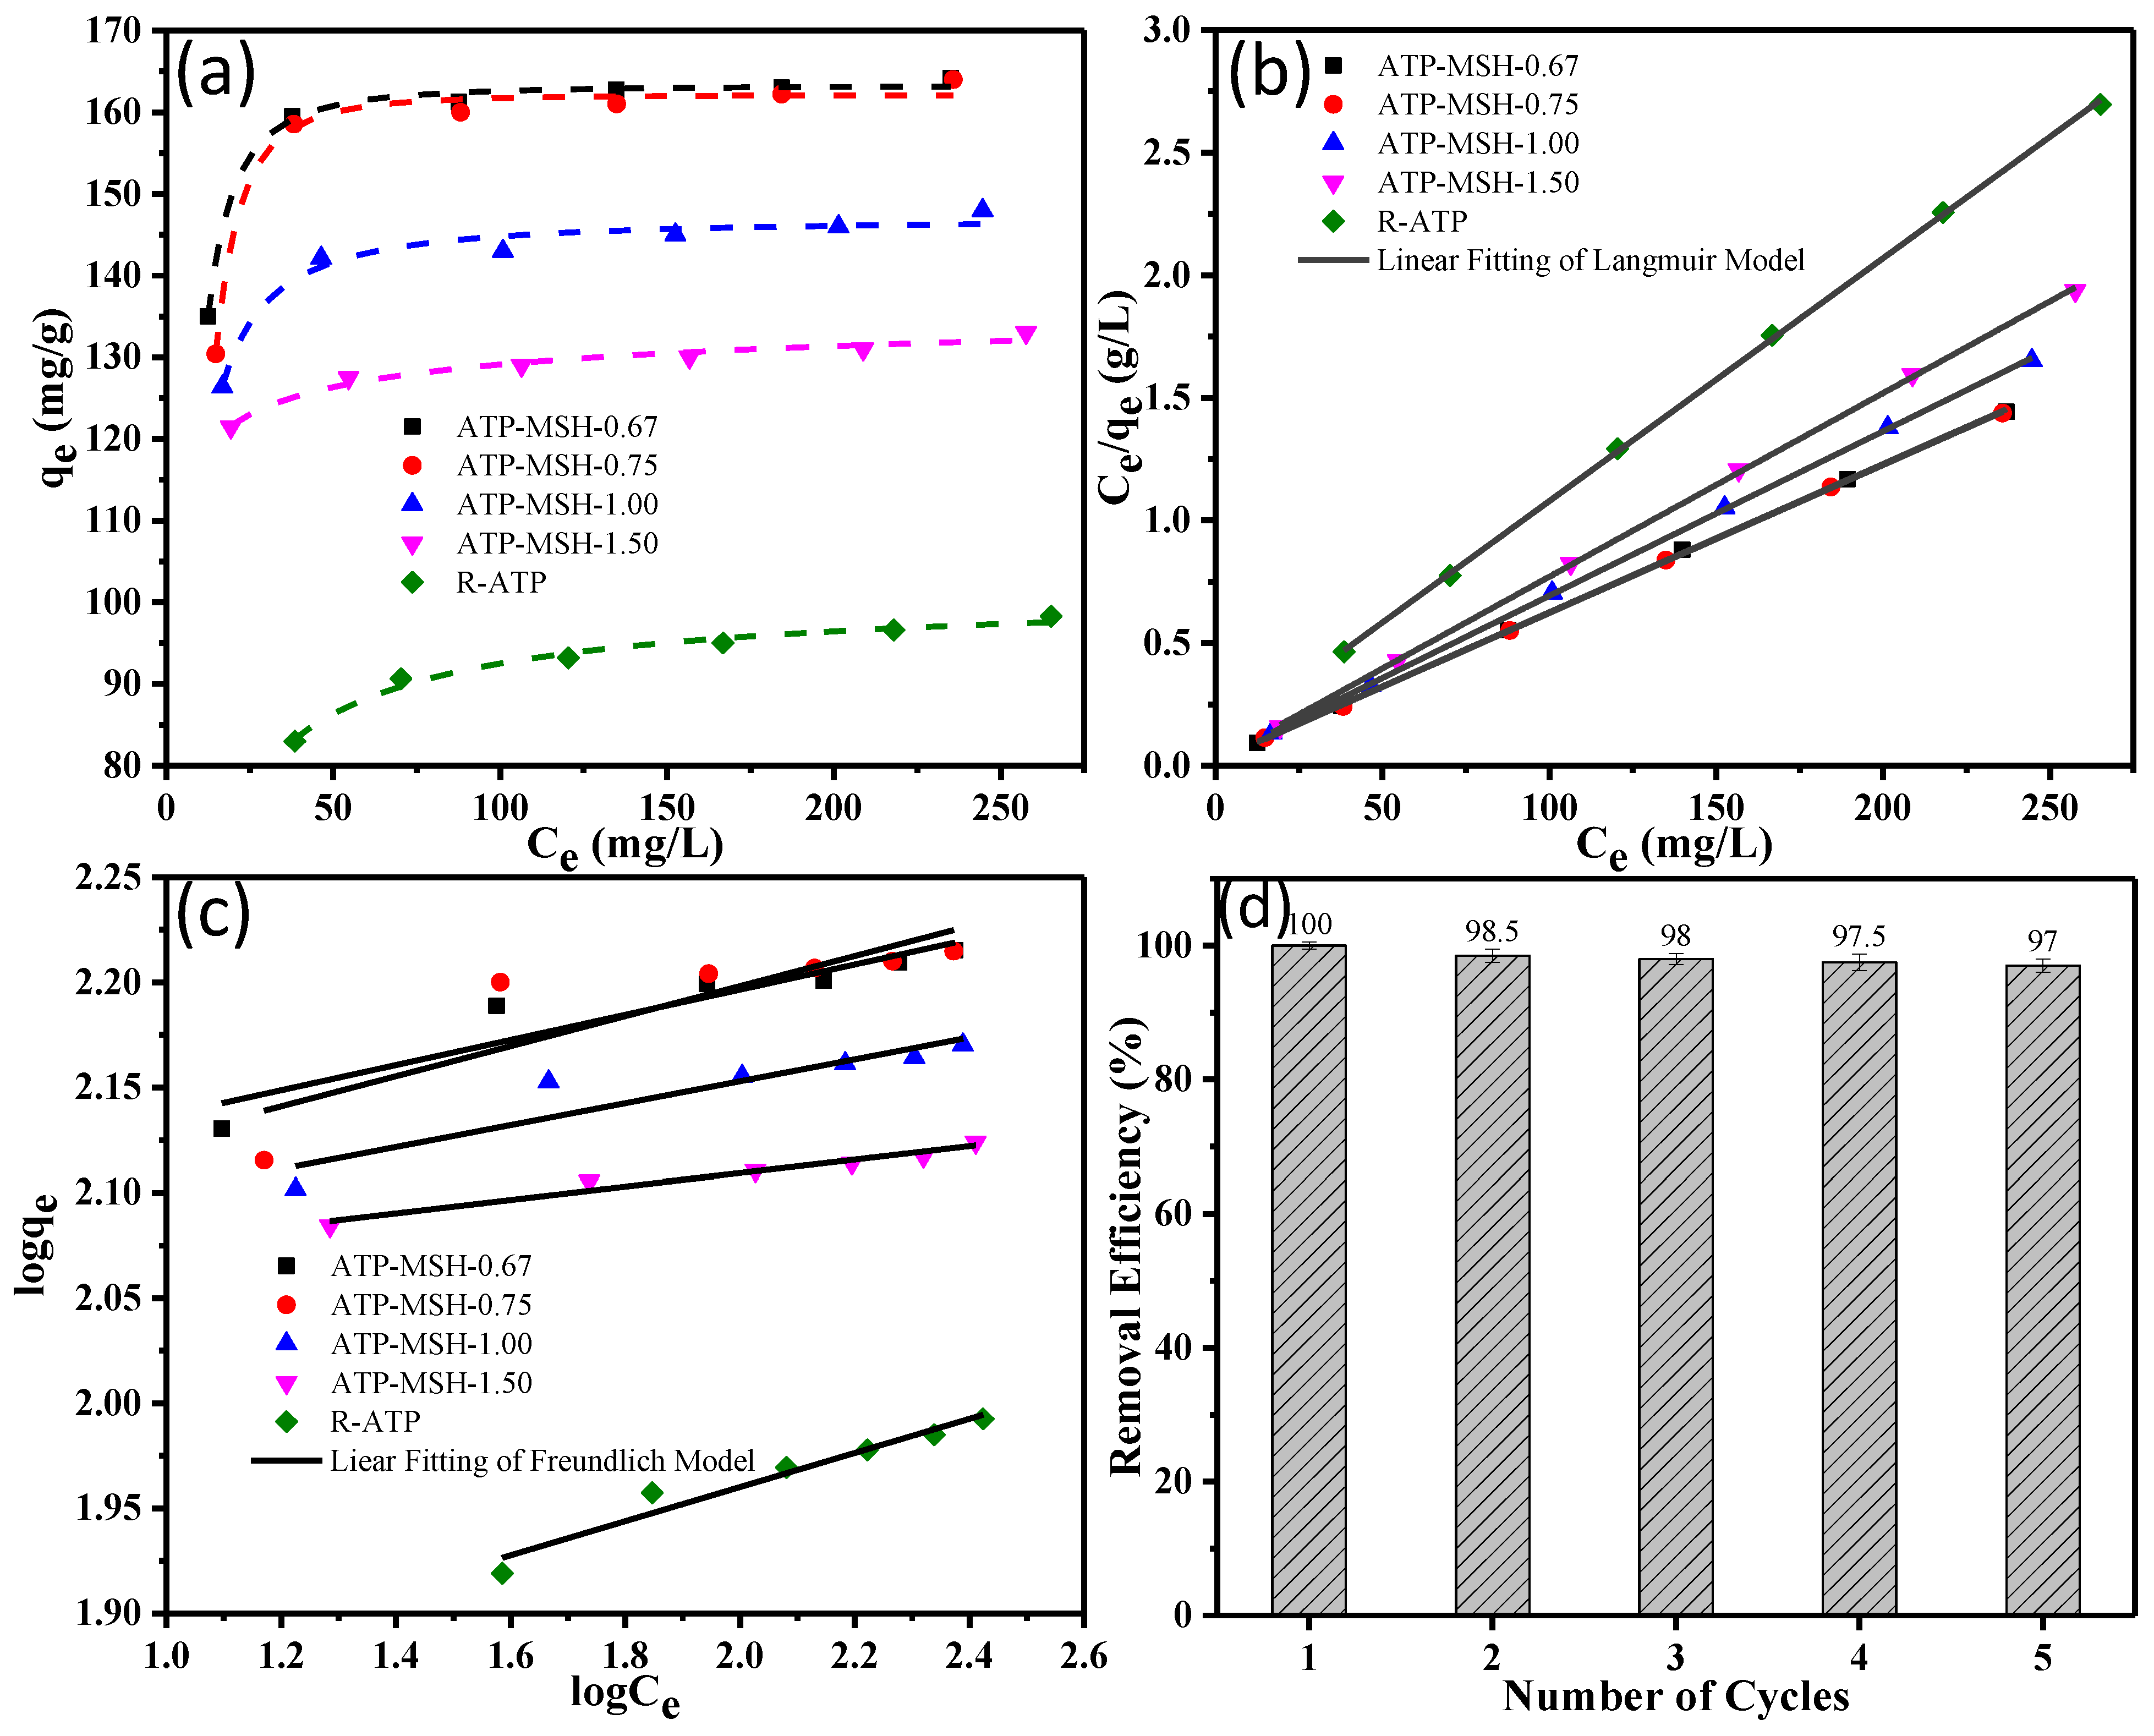
3.4. Adsorption of Methylene Blue

The experimental kinetic adsorption results for methylene blue on raw ATP and several composites are shown in Figure 6. Figure 6a displays the effect of contact time on the removal percentage for the adsorption of MB with an initial concentration of 100 mg/L and a 100 mL volume of dye solution on the composite adsorbents with a 0.5 g/L dosage. Although composites had a longer equilibrium time (6 h) compared with raw ATP (1.5 h), they showed better adsorption (54.9–69.1% of MB) than R-ATP (37.8% of MB) toward methylene blue based on the removal percentage, as observed in Figure 6a. Among the tested samples, the sample with the lowest Mg/Si ratio (ATP-MSH-0.67) showed the highest adsorption quantity because of the higher negative surface charge, which is in line with the zeta potential value in Figure 5. Compared with the pseudo-first-order model, the adsorption of MB matched the pseudo-second-order model well, with close values of calculated and experimental adsorption amounts and a relatively higher R2 value (Table 2), suggesting that the process was the chemisorption [41]. From Table 3 and Figure 6d, the high R2 (0.91–0.99) value in the Elovich kinetic model also revealed that the adsorption was a chemical process [42].
Figure 7a demonstrates how the adsorption process was affected by the initial concentration of dye to estimate the maximum adsorption capacity of prepared adsorbents. A strong driving force at higher concentrations caused an increase in adsorption quantity [11]. In Figure 7b,c, the collected adsorption data were linearly fitted to the Freundlich and Langmuir models. Table 4 lists the isotherm parameters. According to the experimental results and the higher linear relativity, the adsorption of MB matched the Langmuir isotherm model notably better than the Freundlich model. It suggests that the adsorption was the monolayer coverage on the surface of composites with equal energy of active sites [43,44]. From the observed data, the assessed maximum adsorption capacities for composites increased with higher Si content (135.14–166.67 mg/g), indicating the prepared composite (ATP-MSH-0.67 with MB adsorption capacity = 166.67 mg/g) showed a better adsorption capacity, 65% higher than that of R-ATP (101.01 mg/g). It was found that the prepared honeycomb composite showed a higher methylene blue adsorption than those documented in the literature (Table 5). Furthermore, the recyclability of ATP-MSH-0.67 was also investigated after regeneration of the adsorbent by calcination at 500 °C for 3 h. From Figure 7d, a removal efficiency of 97% until the fifth cycle revealed that the prepared adsorbent is one of the promising materials for the treatment of textile wastewater.

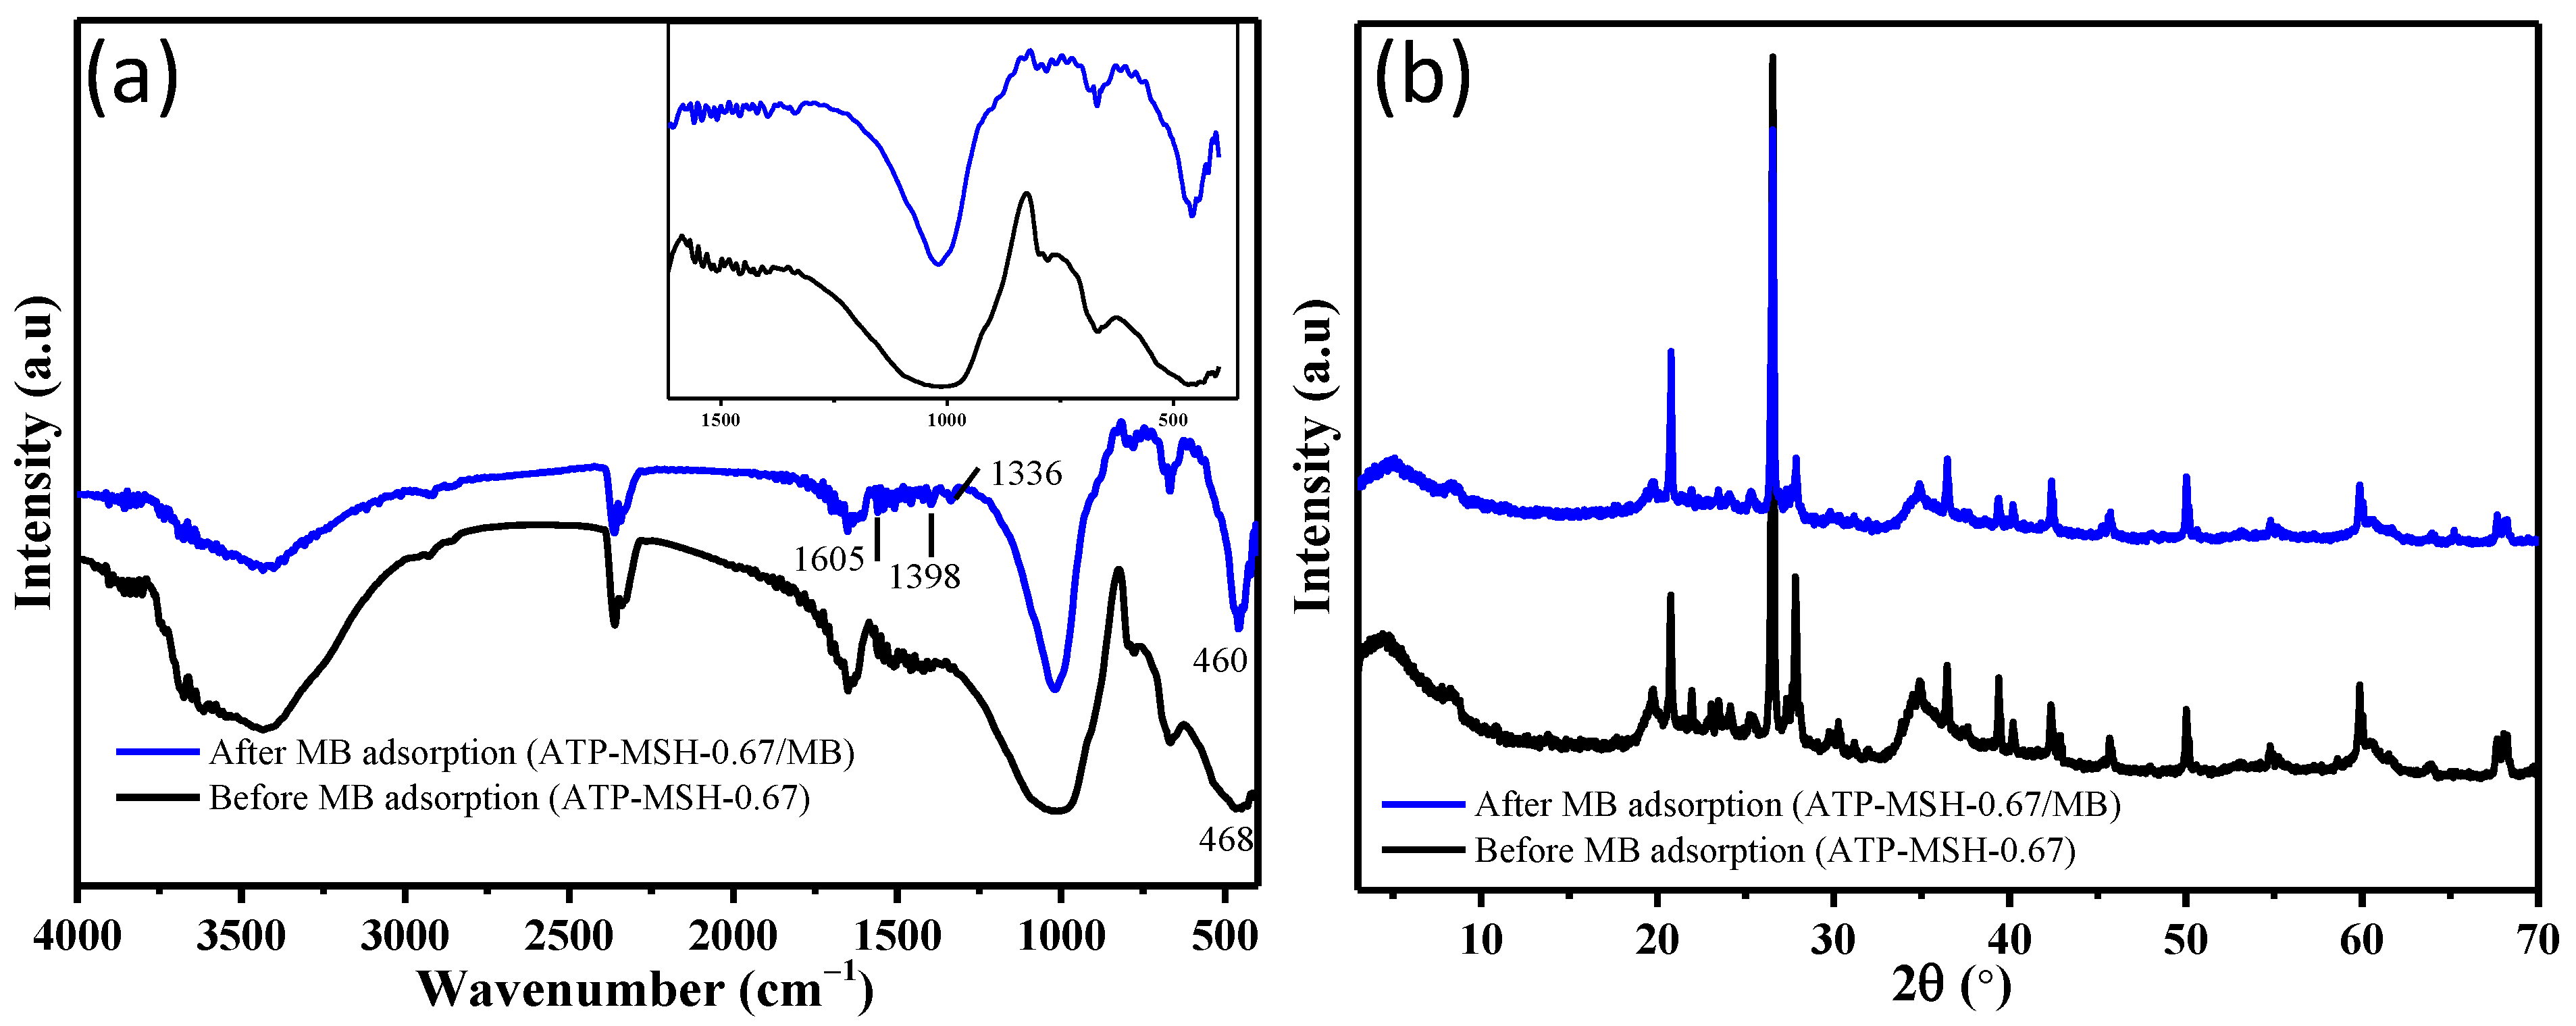
3.5. Adsorption Mechanism

Figure 8a compares FT-IR spectra before and after methylene blue adsorption. Before the adsorption of MB, the vibration bands appeared at 1022 cm−1 for the Si-O-Si bond and at 468 cm−1 for Mg-O vibration in the FT-IR spectrum of the unmodified composite. Following adsorption, these absorption peaks shifted to new positions. For instance, the Si-O-Si stretching and bending vibrations at 1022 cm−1 shifted to 1012 cm−1, while the Mg-O vibration band at 468 cm−1 moved to 460 cm−1, suggesting that the functional groups Mg-O and Si-O may serve as MB’s adsorption sites. After the adsorption of MB, FT-IR spectra displayed the characteristic aromatic ring absorption peak at 1605 cm−1 and the C-N stretching vibrations at 1336 and 1398 cm−1, indicating the successful adsorption of MB [9]. The adsorption of MB on the MSH composite was indicated by the appearance of broad diffraction peaks of hydrocarbon from MB between 2θ = 20 and 30 degrees, which caused the intensified diffraction peaks of the prepared composite before MB adsorption to decrease in intensity after MB adsorption (Figure 8b). The adsorption of MB suggested that cationic MB adsorbs on porous magnesium silicate through electrostatic attraction with Mg-OH and Si-OH [52].

4. Conclusions

Using naturally occurring one-dimensional porous attapulgite as the precursor and a silicon source template, a series of silica porous materials coated with magnesium silicate was prepared under hydrothermal conditions. This work involved the acid-leaching process of extracting silica from clay minerals and optimizing Mg/Si loadings. The composite material with the highest silicon content showed the thinnest interlaced MSH sheets along the rod. The surface area of attapulgite clay was improved by 6.7 times when the magnesium-to-silicon ratio was lowered. After composite formation, the clay’s negative zeta potential of −19.05 mV changed to −18.18 mV. The removal amount for methylene blue by the honeycomb composite was 166.67 mg/g, 65% higher than that of raw ATP clay. Attapulgite may serve as a rod-shaped template and source of silicon for the production of magnesium silicate, as only the surface of the silica was coated with porous magnesium silicate. The synergistic effect of the silica and surface-grown porous magnesium silicate was a main factor of the high removal. This novel approach contributes to the silica-self-templating fabrication of effective porous magnesium silicate adsorbents to remove cationic dye in wastewater treatment.

Author Contributions

Conceptualization, H.L.; Data curation, T.K. and C.J.; Formal analysis, T.K., T.W. and S.A.; Funding acquisition, H.L. and Y.F.; Investigation, T.K. and N.K.; Methodology, T.K., T.W., N.K., C.J. and S.A.; Project administration, Y.F.; Resources, Y.F.; Supervision, S.A. and Y.F.; Validation, T.W., N.K., C.J. and S.A.; Visualization, T.K.; Writing—original draft, T.K.; Writing—review & editing, S.A., H.L. and Y.F. All authors have read and agreed to the published version of the manuscript.

Funding

This research was funded by Beijing Engineering Center for Hierarchical Catalysts, and CSC scholarship program (2018GXZ021558, 2019GBJ004768).

Institutional Review Board Statement

Not applicable.

Informed Consent Statement

Not applicable.

Data Availability Statement

All data required to evaluate the conclusions of the dissertation are included in the paper. Additional relevant data supporting the findings of this study are available from the corresponding author, Y.J. Feng (yjfeng@mail.buct.edu.cn), upon reasonable request.

Conflicts of Interest

Tiefeng Wei was employed by Guangxi Petrochemical Company. The remaining authors declare that the research was conducted in the absence of any commercial or financial relationships that could be construed as a potential conflict of interest.

References

  1. Metivier-Pignon, H.; Faur, C.; Le Cloirec, P. Adsorption of dyes onto activated carbon cloth: Using QSPRs as tools to approach adsorption mechanisms. Chemosphere 2007, 66, 887–893. [Google Scholar] [CrossRef]
  2. Jiang, N.; Shang, R.; Heijman, S.G.J.; Rietveld, L.C. High-silica zeolites for adsorption of organic micro-pollutants in water treatment: A review. Water Res. 2018, 144, 145–161. [Google Scholar] [CrossRef] [PubMed]
  3. Sun, Z.; Huang, D.; Duan, X.; Hong, W.; Liang, J. Functionalized nanoflower-like hydroxyl magnesium silicate for effective adsorption of aflatoxin B1. J. Hazard. Mater. 2020, 387, 121792. [Google Scholar] [CrossRef]
  4. Zhang, Z.; Wang, W.; Wang, A. Highly effective removal of methylene blue using functionalized attapulgite via hydrothermal process. J. Environ. Sci. 2015, 33, 106–115. [Google Scholar] [CrossRef] [PubMed]
  5. Abu-Danso, E.; Peräniemi, S.; Leiviskä, T.; Kim, T.; Tripathi, K.M.; Bhatnagar, A. Synthesis of clay-cellulose biocomposite for the removal of toxic metal ions from aqueous medium. J. Hazard. Mater. 2020, 381, 120871. [Google Scholar] [CrossRef]
  6. Wilson, I. Applied clay mineralogy: Occurrences, processing, and application of kaolins, bentonites, palygorskite-sepiolite, and common clays. Clays Clay Miner. 2007, 55, 644–645. [Google Scholar] [CrossRef]
  7. Bernard, E.; Lothenbach, B.; Chlique, C.; Wyrzykowski, M.; Dauzères, A.; Pochard, I.; Cau-dit-Coumes, C. Characterization of magnesium silicate hydrate (M-S-H). Cem. Concr. Res. 2018, 116, 309–330. [Google Scholar] [CrossRef]
  8. Dong, G.; Tian, G.; Gong, L.; Tang, Q.; Li, M.; Meng, J.; Liang, J. Mesoporous zinc silicate composites derived from iron ore tailings for highly efficient dye removal: Structure and morphology evolution. Microporous Mesoporous Mater. 2020, 305, 110352. [Google Scholar] [CrossRef]
  9. Huang, R.; He, L.; Zhang, T.; Li, D.; Tang, P.; Zhao, Y.; Feng, Y. Fabrication and adsorption behavior of magnesium silicate hydrate nanoparticles towards methylene blue. Nanomaterials 2018, 8, 271. [Google Scholar] [CrossRef]
  10. Yang, F.; Weng, J.; Ding, J.; Zhao, Z.; Qin, L.; Xia, F. Effective conversion of saccharides into hydroxymethyl furfural catalyzed by a natural clay, attapulgite. Renew. Energy. 2020, 151, 829–836. [Google Scholar] [CrossRef]
  11. Zhang, T.; Wang, W.; Zhao, Y.; Bai, H.; Wen, T.; Kang, S.; Song, G.; Song, S.; Komarneni, S. Removal of heavy metals and dyes by clay-based adsorbents: From natural clays to 1D and 2D nano-composites. Chem. Eng. J. 2021, 420, 127574. [Google Scholar] [CrossRef]
  12. Chen, M.; Xu, H.; Zhang, Y.; Zhao, X.; Chen, Y.; Kong, X. Effective removal of heavy metal ions by attapulgite supported sulfidized nanoscale zerovalent iron from aqueous solution. Colloids Surf. A Physicochem. Eng. Asp. 2022, 640, 128192. [Google Scholar] [CrossRef]
  13. Zhang, Z.; Gui, W.; Wei, J.; Cui, Y.; Li, P.; Jia, Z.; Kong, P. Functionalized attapulgite for the adsorption of methylene blue: Synthesis, characterization, and adsorption mechanism. ACS Omega 2021, 6, 19586–19595. [Google Scholar] [CrossRef] [PubMed]
  14. Wang, G.; Xi, Y.; Lian, C.; Sun, Z.; Zheng, S. Simultaneous detoxification of polar aflatoxin B1 and weak polar zearalenone from simulated gastrointestinal tract by zwitterionic montmorillonites. J. Hazard. Mater. 2018, 364, 227–237. [Google Scholar] [CrossRef] [PubMed]
  15. Farhadirad, M.; Najafi, H.; Sharifian, S.; Ebrahimian Pirbazari, A.; Asasian-Kolur, N.; Harasek, M. Enhanced levofloxacin degradation through Fenton-like process using Fe-silica pillared clay catalyst. Appl. Catal. O Open. 2024, 190, 206931. [Google Scholar] [CrossRef]
  16. Ugochukwu, U.C.; Fialips, C.I. Crude oil polycyclic aromatic hydrocarbons removal via clay-microbe-oil interactions: Effect of acid activated clay minerals. Chemosphere 2017, 178, 65–72. [Google Scholar] [CrossRef]
  17. Roth, W.J.; Gil, B.; Makowski, W.; Marszalek, B.; Eliášová, P. Layer like porous materials with hierarchical structure. Chem. Soc. Rev. 2016, 45, 3400–3438. [Google Scholar] [CrossRef] [PubMed]
  18. Anirudhan, T.S.; Ramachandran, M. Adsorptive removal of basic dyes from aqueous solutions by surfactant modified bentonite clay (organoclay): Kinetic and competitive adsorption isotherm. Process Saf. Environ. Prot. 2015, 95, 215–225. [Google Scholar] [CrossRef]
  19. Li, Y.; Tian, G.; Chen, B.; Liang, J. Self-templating construction of flower-like mesoporous magnesium silicate composites from sepiolite for high-efficiency adsorption of aflatoxin B1. Sep. Purif. Technol. 2022, 291, 120953. [Google Scholar] [CrossRef]
  20. Wang, W.; Dong, W.; Tian, G.; Sun, L.; Wang, Q.; Hui, A.; Mu, B.; Wang, A. Highly efficient self-template synthesis of porous silica nanorods from natural palygorskite. Powder Technol. 2019, 354, 1–10. [Google Scholar] [CrossRef]
  21. Kyawoo, T.; Karim, N.; Jiang, C.; Ahmed, S.; Tian, W.; Li, H.; Feng, Y. Facile formation of hierarchical magnesium silicate hydrate microspheres as an adsorbent for the textile dyes. Particuology 2024, 93, 99–110. [Google Scholar] [CrossRef]
  22. Duan, L.; Wang, C.; Zhang, W.; Ma, B.; Deng, Y.; Li, W.; Zhao, D. Interfacial assembly and applications of functional mesoporous materials. Chem. Rev. 2021, 121, 14349–14429. [Google Scholar] [CrossRef] [PubMed]
  23. Ghaedi, H.; Zhao, M. Review on Template removal techniques for synthesis of mesoporous silica materials. Energy Fuels 2022, 36, 2424–2446. [Google Scholar] [CrossRef]
  24. Zhang, Q.; Wang, W.; Goebl, J.; Yin, Y. Self-templated synthesis of hollow nanostructures. Nano Today 2009, 4, 494–507. [Google Scholar] [CrossRef]
  25. Zhong, L.; Tang, A.; Yan, P.; Wang, J.; Wang, Q.; Wen, X.; Cui, Y. Palygorskite-template amorphous carbon nanotubes as a superior adsorbent for removal of dyes from aqueous solutions. J. Colloid. Interface Sci. 2019, 537, 450–457. [Google Scholar] [CrossRef]
  26. Gérardin, C.; Reboul, J.; Bonne, M.; Lebeau, B. Ecodesign of ordered mesoporous silica materials. Chem. Soc. Rev. 2013, 42, 4217–4255. [Google Scholar] [CrossRef] [PubMed]
  27. Liu, H.; Chen, T.; Chang, D.; Chen, D.; Qing, C.; Xie, J.; Frost, R. The difference of thermal stability between Fe-substituted palygorskite and Al-rich palygorskite. J. Therm. Anal. Calorim. 2013, 111, 409–415. [Google Scholar] [CrossRef]
  28. Li, X.; Yin, Y.; Yao, C.; Zuo, S.; Lu, X.; Luo, S.; Ni, C. La1−xCexMnO3/attapulgite nanocomposites as catalysts for NO reduction with NH3 at low temperature. Particuology 2016, 26, 66–72. [Google Scholar] [CrossRef]
  29. Karim, N.; Kyawoo, T.; Jiang, C.; Ahmed, S.; Tian, W.; Li, H.; Feng, Y. Fenton-like degradation of methylene blue on attapulgite clay composite by loading of iron–oxide: Eco-friendly preparation and its catalytic activity. Materials 2024, 17, 2615. [Google Scholar] [CrossRef]
  30. Orrico, M.; Pota, G.; Venezia, V.; de Gennaro, B.; Landi, G.; Tescione, F.; Pezzella, A.; Luciani, G.; Silvestri, B. Phenolic driven decoration of silica with Ag nanoparticles: Towards sustainable water remediation. J. Water Process Eng. 2024, 59, 105079. [Google Scholar] [CrossRef]
  31. Nakamoto, K. Infrared and Raman spectra of inorganic and coordination compounds. In Handbook of Vibrational Spectroscopy; John Wiley & Sons: Hoboken, NJ, USA, 2006; pp. 1872–1892. [Google Scholar] [CrossRef]
  32. Sun, T.-W.; Zhu, Y.-J.; Qi, C.; Chen, F.; Jiang, Y.-Y.; Zhang, Y.-G.; Wu, J.; Wu, C. Templated solvothermal synthesis of magnesium silicate hollow nanospheres with ultrahigh specific surface area and their application in high-performance protein adsorption and drug delivery. J. Mater. Chem. B 2016, 4, 3257–3268. [Google Scholar] [CrossRef] [PubMed]
  33. Liu, Y.; Sun, J.; Yuan, J.; Wang, S.; Ding, Y.; Wu, Y.; Gao, C. A type of thiophene-bridged silica aerogel with a high adsorption capacity for organic solvents and oil pollutants. Inorg. Chem. Front. 2018, 5, 1894–1901. [Google Scholar] [CrossRef]
  34. Yin, Y.L.; Yu, H.L.; Wang, H.M.; Ji, X.C.; Song, Z.Y.; Zhou, X.Y.; Wei, M.; Shi, P.J.; Zhang, W.; Zhao, C.F. Tribological behaviors of AZ91D magnesium alloy under the lubrication of oil suspended synthetic magnesium silicate hydroxide nanotubes. J. Magnes. Alloy. 2024, 13, 379–397. [Google Scholar] [CrossRef]
  35. Wang, W.; Tian, G.; Zong, L.; Zhou, Y.; Kang, Y.; Wang, Q.; Wang, A. From illite/smectite clay to mesoporous silicate adsorbent for efficient removal of chlortetracycline from water. J. Environ. Sci. 2017, 51, 31–43. [Google Scholar] [CrossRef]
  36. Pérez-Botella, E.; Valencia, S.; Rey, F. Zeolites in adsorption processes: State of the art and future prospects. Chem. Rev. 2022, 122, 17647–17695. [Google Scholar] [CrossRef] [PubMed]
  37. Bao, J.; Feng, Y.; Pan, Y.; Jiang, J. Adsorption of Co2+ and Cr3+ in industrial wastewater by magnesium silicate nanomaterials. Materials 2024, 17, 1946. [Google Scholar] [CrossRef] [PubMed]
  38. Ahmed, S.; Pan, J.; Ashiq, M.N.; Li, D.; Tang, P.; Feng, Y. Ethylene glycol-assisted fabrication and superb adsorption capacity of hierarchical porous flower-like magnesium oxide microspheres for phosphate. Inorg. Chem. Front. 2019, 6, 1952–1961. [Google Scholar] [CrossRef]
  39. Ahmed, S. CTAB-assisted fabrication of hierarchical flower-like magnesium oxide adsorbent for enhanced removal performance towards phosphate. J. Magnes. Alloy. 2023, 11, 3231–3240. [Google Scholar] [CrossRef]
  40. Sun, P.; Xu, L.; Jiang, X.; Zhang, H.; Zhu, W. Facile and Green one-pot hydrothermal formation of hierarchical porous magnesium silicate microspheres as excellent adsorbents for anionic organic dye removal. Ind. Eng. Chem. Res. 2019, 58, 2945–2957. [Google Scholar] [CrossRef]
  41. Li, Y.; Nie, K.; Tang, Q.; Tian, G.; Liang, J. In-situ synthesis of duster-like hollow mesoporous copper silicate composites for high-efficiency adsorption of aflatoxin B1 from water. Microporous Mesoporous Mater. 2022, 346, 112317. [Google Scholar] [CrossRef]
  42. Wu, F.-C.; Tseng, R.-L.; Juang, R.-S. Characteristics of Elovich equation used for the analysis of adsorption kinetics in dye-chitosan systems. Chem. Eng. J. 2009, 150, 366–373. [Google Scholar] [CrossRef]
  43. Pan, Y.; Liu, Z.; Wang, W.; Peng, C.; Shi, K. Highly efficient macroporous adsorbents for toxic metal ions in water system based on polyvinyl alcohol-formaldehyde sponges. J. Mater. Chem. A 2016, 4, 2537–2549. [Google Scholar] [CrossRef]
  44. Srivastava, V.; Sillanpää, M. Synthesis of malachite@clay nanocomposite for rapid scavenging of cationic and anionic dyes from synthetic wastewater. J. Environ. Sci. 2017, 51, 97–110. [Google Scholar] [CrossRef]
  45. Natrayan, L.; Niveditha, V.R.; Nadh, V.S.; Srinivas, C.; Dhanraj, J.A.; Saravanan, A. Application of response surface and artificial neural network optimization approaches for exploring methylene blue adsorption using luffa fiber treated with sodium chlorite. J. Water Process Eng. 2024, 58, 104778. [Google Scholar] [CrossRef]
  46. Abuhatab, S.; El-Qanni, A.; Marei, N.N.; Hmoudah, M.; El-Hamouz, A. Sustainable competitive adsorption of methylene blue and acid red 88 from synthetic wastewater using NiO and/or MgO silicate based nanosorbcats: Experimental and computational modeling studies. RSC Adv. 2019, 9, 35483–35498. [Google Scholar] [CrossRef] [PubMed]
  47. Wawrzaszek, B.; Charmas, B.; Jedynak, K.; Skwarek, E. Impact of mechanochemical activation (MChA) on characteristics and dye adsorption behavior of sawdust-based biocarbons. Materials 2024, 17, 4458. [Google Scholar] [CrossRef]
  48. Tong, D.; Wu, C.; Adebajo, M.; Jin, G.; Yu, W.; Ji, S.; Zhou, C. Adsorption of methylene blue from aqueous solution onto porous cellulose-derived carbon/montmorillonite nanocomposites. Appl. Clay Sci. 2018, 161, 256–264. [Google Scholar] [CrossRef]
  49. Gao, J.; Lin, Q.; Yang, T.; Bao, Y.c.; Liu, J. Preparation and characterization of ZSM-5 molecular sieve using coal gangue as a raw material via solvent-free method: Adsorption performance tests for heavy metal ions and methylene blue. Chemosphere 2023, 341, 139741. [Google Scholar] [CrossRef] [PubMed]
  50. Ferrero, F. Adsorption of methylene blue on magnesium silicate: Kinetics, equilibria and comparison with other adsorbents. J. Environ. Sci. 2010, 22, 467–473. [Google Scholar] [CrossRef] [PubMed]
  51. Zhang, L.-L.; Zaoui, A.; Sekkal, W. Adsorption efficiency of highly methylene blue dye concentrations with multilayer chitosan-modified clays for a precise nanofiltration performance of polluted water. J. Water Process Eng. 2024, 57, 104651. [Google Scholar] [CrossRef]
  52. Zhao, R.; Li, Y.; Sun, B.; Chao, S.; Li, X.; Wang, C.; Zhu, G. Highly flexible magnesium silicate nanofibrous membranes for effective removal of methylene blue from aqueous solution. Chem. Eng. J. 2019, 359, 1603–1616. [Google Scholar] [CrossRef]
Figure 1. Fabrication and adsorption behavior of synthesized honeycomb ATP-MSH composites.
Materials 18 00792 g001
Figure 2. (a) XRD patterns, (b) FT-IR spectra, (c) nitrogen adsorption–desorption isotherm, (d) pore size distributions, (e) TGA curves, and (f) DTG curves for thermal degradation of composites with different Mg/Si ratios.
Materials 18 00792 g002
Figure 3. SEM images of (a) R-ATP, (b) H-ATP, and composites with different Mg/Si ratios: (c) 1.50, (d) 1.00, (e) 0.75, and (f) 0.67.
Materials 18 00792 g003
Figure 4. EDS spectrum of the prepared composite (ATP-MSH-0.67).
Materials 18 00792 g004
Figure 5. Zeta potential of R-ATP and composites with different Mg/Si ratios.
Materials 18 00792 g005
Figure 6. MB adsorption on composites with different Mg/Si ratios and raw ATP for (a) removal percentage, (b) pseudo-first-order, (c) pseudo-second-order, and (d) Elovich kinetic models.
Materials 18 00792 g006
Figure 7. MB adsorption on composites with different Mg/Si ratios and raw ATP for the (a) effects of initial dye concentrations, (b) Langmuir, (c) Freundlich isotherms, and (d) recyclability of ATP-MSH-0.67.
Materials 18 00792 g007
Figure 8. FT-IR spectra (a) and XRD patterns (b) of the composite (Mg/Si = 0.67) before and after adsorption of methylene blue.
Materials 18 00792 g008
Table 1. Pore parameters of R-ATP and composites with different Mg/Si ratios.
SampleSurface Area (m2/g)Pore Volume (cm3/g)Average Pore Diameter (nm)
ATP-MSH-0.67310.410.293.74
ATP-MSH-0.75303.140.273.61
ATP-MSH-1.00322.480.273.54
ATP-MSH-1.50332.570.263.23
R-ATP46.150.1413.53
Table 2. Kinetic parameters for MB adsorption on composites with different Mg/Si ratios.
Samplesqe,exp (mg/g)Pseudo-First-OrderPseudo-Second-Order
qe,cal
(mg/g)
k1 (h−1)R2qe,cal
(mg/g)
k2 (h−1)R2
ATP-MSH-0.67161.3791.690.2090.956163.930.0180.997
ATP-MSH-0.75161.1091.100.1870.949163.930.0170.996
ATP-MSH-1.00142.3099.890.2630.985147.060.0170.996
ATP-MSH-1.50130.7689.510.1590.953136.990.0120.987
R-ATP90.2840.360.2760.96691.740.0590.999
Table 3. Elovich kinetic parameters for MB adsorption on composites with different Mg/Si ratios.
Samplesα (mgg−1min−1)β (g mg−1)R2
ATP-MSH-0.6735.3040.0400.986
ATP-MSH-0.7534.3250.0400.989
ATP-MSH-1.0024.1260.0440.996
ATP-MSH-1.5017.1520.0480.990
R-ATP5.1420.0740.914
Table 4. Isotherm parameters for MB adsorption on composites with different Mg/Si ratios.
SamplesLangmuir ModelFreundlich Model
qm (mg/g)b (L/mg)R2RLK (mg/g)nR2
ATP-MSH-0.67166.670.00010.9990.96–0.99119.3716.720.887
ATP-MSH-0.75166.670.00010.9990.96–0.99113.5513.990.747
ATP-MSH-1.00149.250.00010.9990.95–0.99111.8919.190.873
ATP-MSH-1.50133.330.00020.9990.95–0.98111.1231.450.963
R-ATP101.010.00090.9990.78–0.9362.77712.3150.952
Table 5. Comparison of MB adsorption for the honeycomb composite (Mg/Si = 0.67) with other adsorbents.
AdsorbentsAdsorption Capacity (mg/g)Refs.
Luffa fiber133.58[45]
NiO-MgO-SBNs94.7[46]
Sawdust-based biocarbon130.98[47]
Carbon/montmorillonite138.1[48]
ZSM-5 zeolite118.34[49]
Magnesium silicate149.3[50]
Chitosan/montmorillonite158.7[51]
ATP-MSH-0.67166.67This work
Disclaimer/Publisher’s Note: The statements, opinions and data contained in all publications are solely those of the individual author(s) and contributor(s) and not of MDPI and/or the editor(s). MDPI and/or the editor(s) disclaim responsibility for any injury to people or property resulting from any ideas, methods, instructions or products referred to in the content.

