Chitosan-Coated Alginate Matrices with Protein-Based Biostimulants: A Controlled-Release System for Sustainable Agriculture


Abstract
1. Introduction
2. Materials and Methods
2.1. Preparation of Hydrolysates
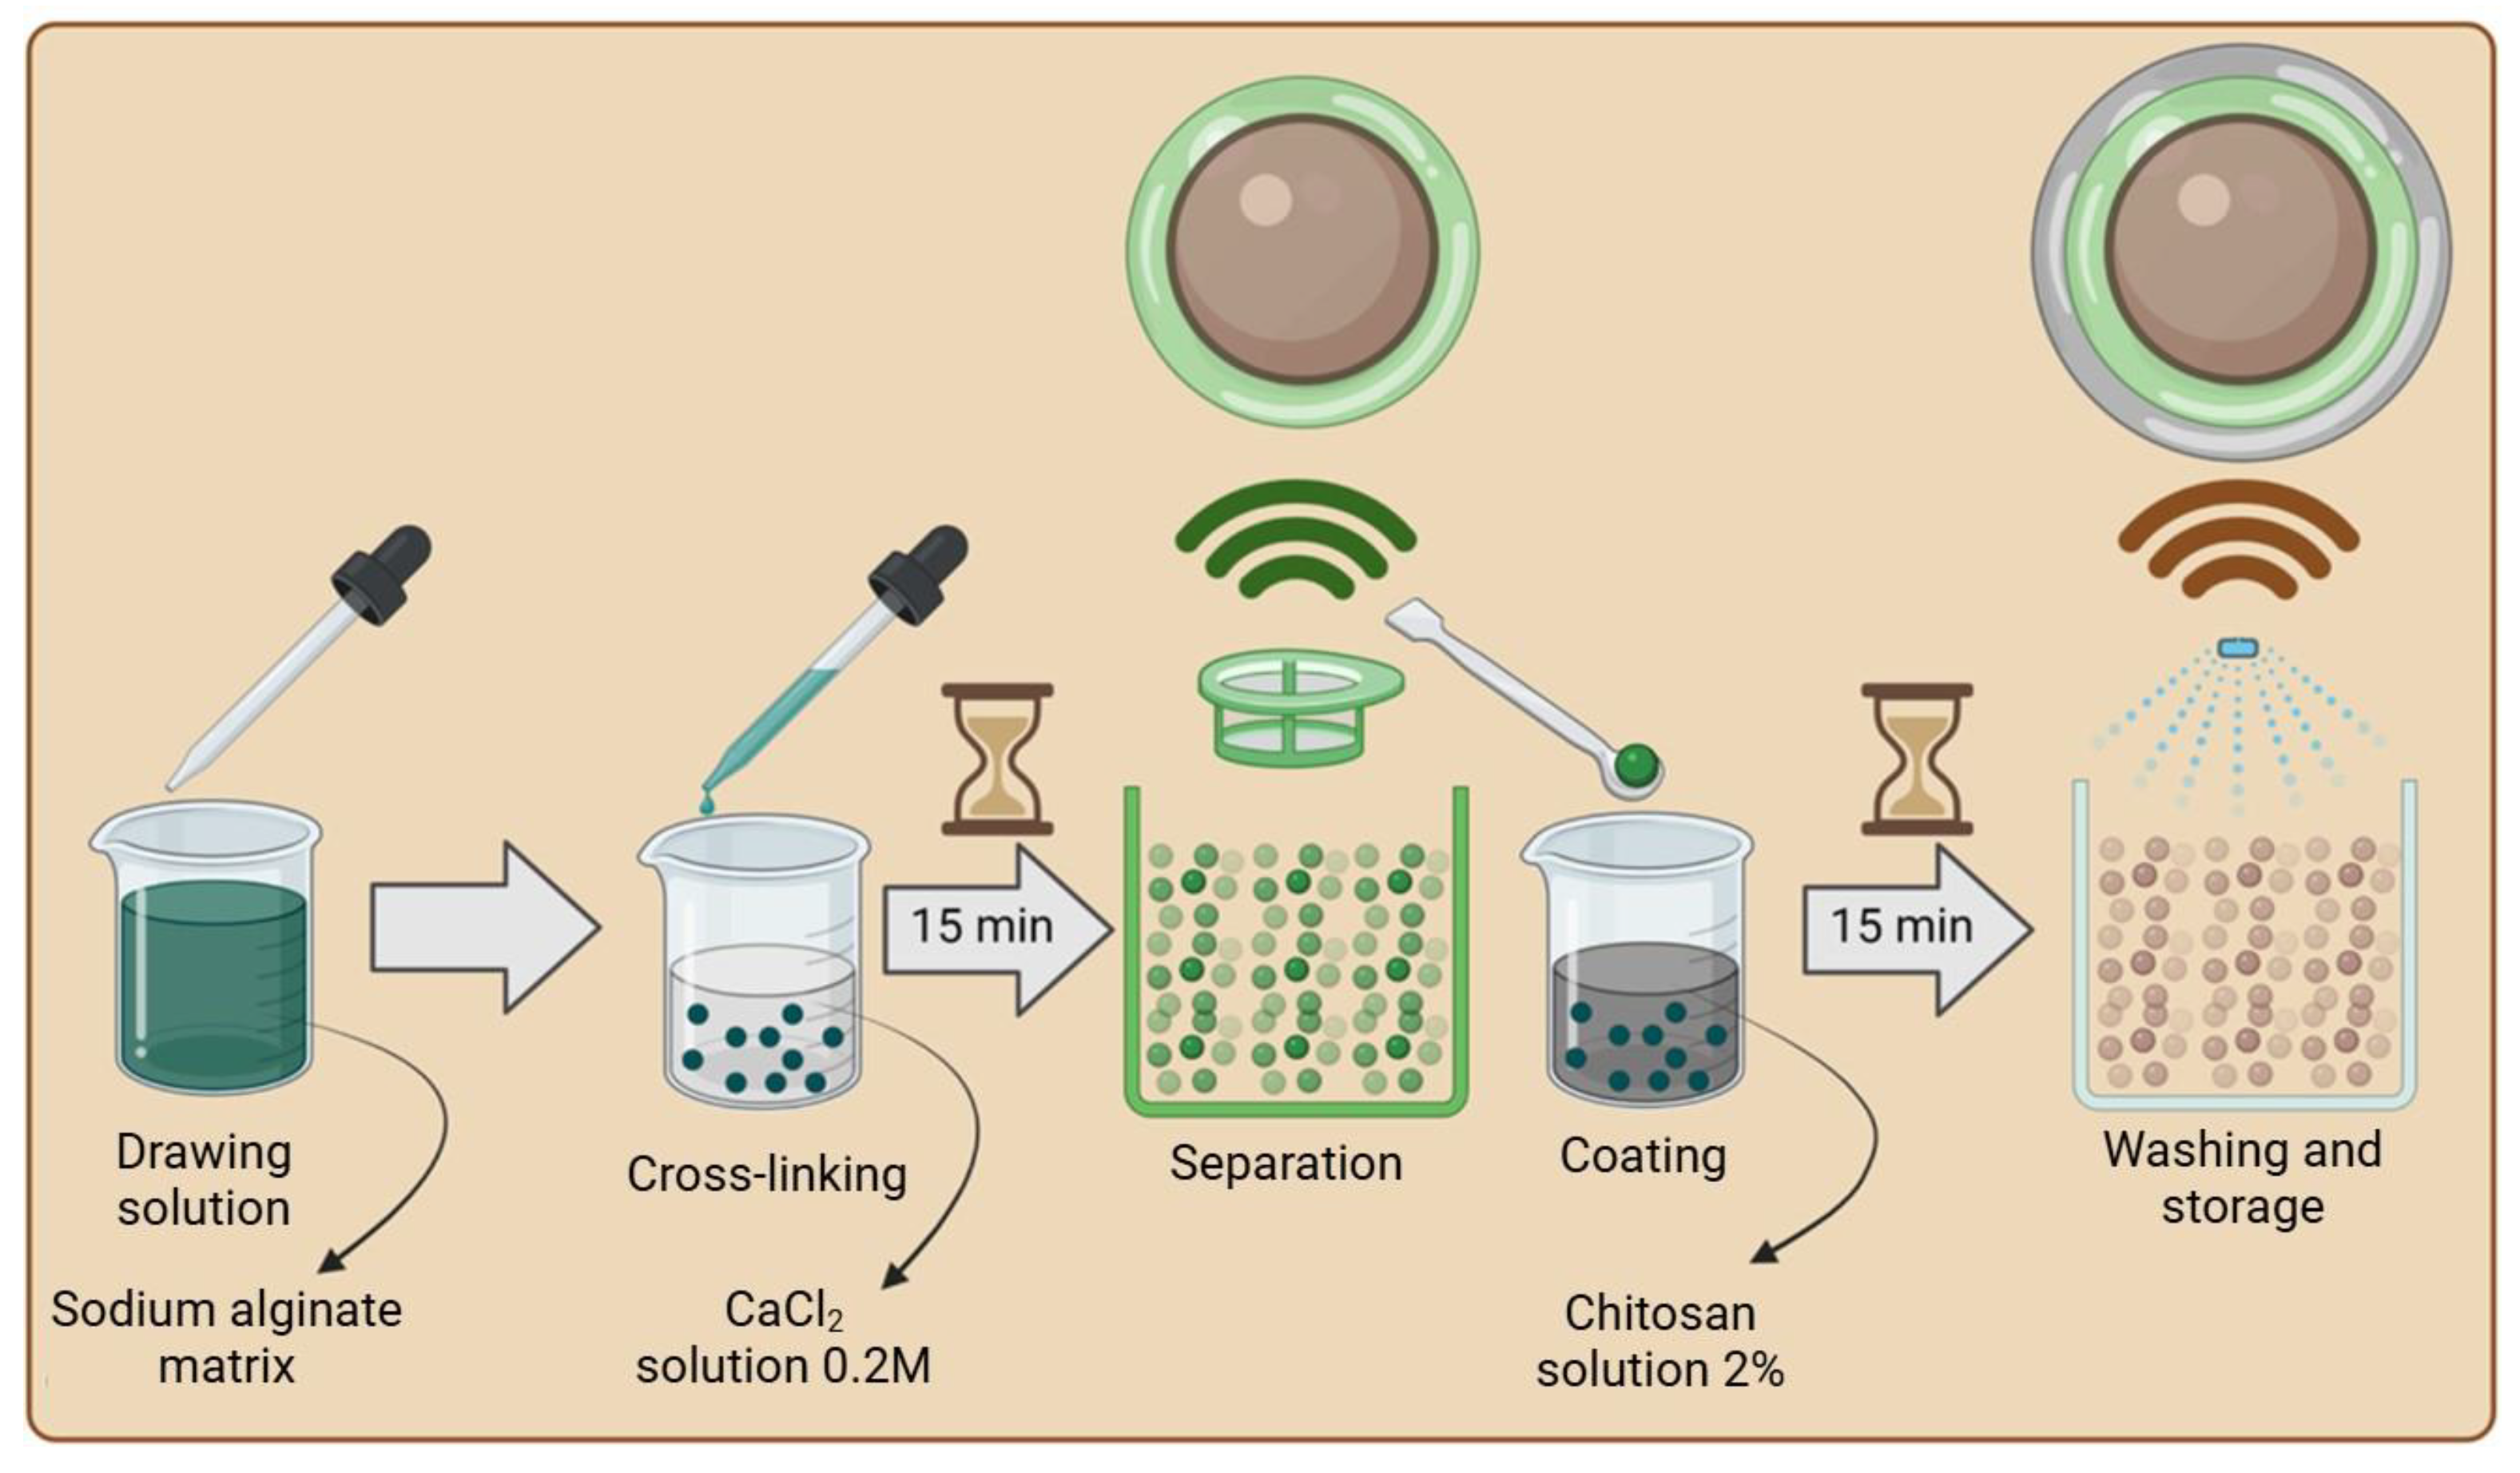
2.2. Preparation of Biopolymer Matrix
2.3. Swelling Properties
2.4. Leaching Properties
2.5. Biodegradability
2.6. ICP Analysis
2.7. XRD Analysis
2.8. TGA Analysis
2.9. FTIR Analysis
2.10. Germination Tests
3. Results and Discussion
3.1. Evaluation of the Coating Method
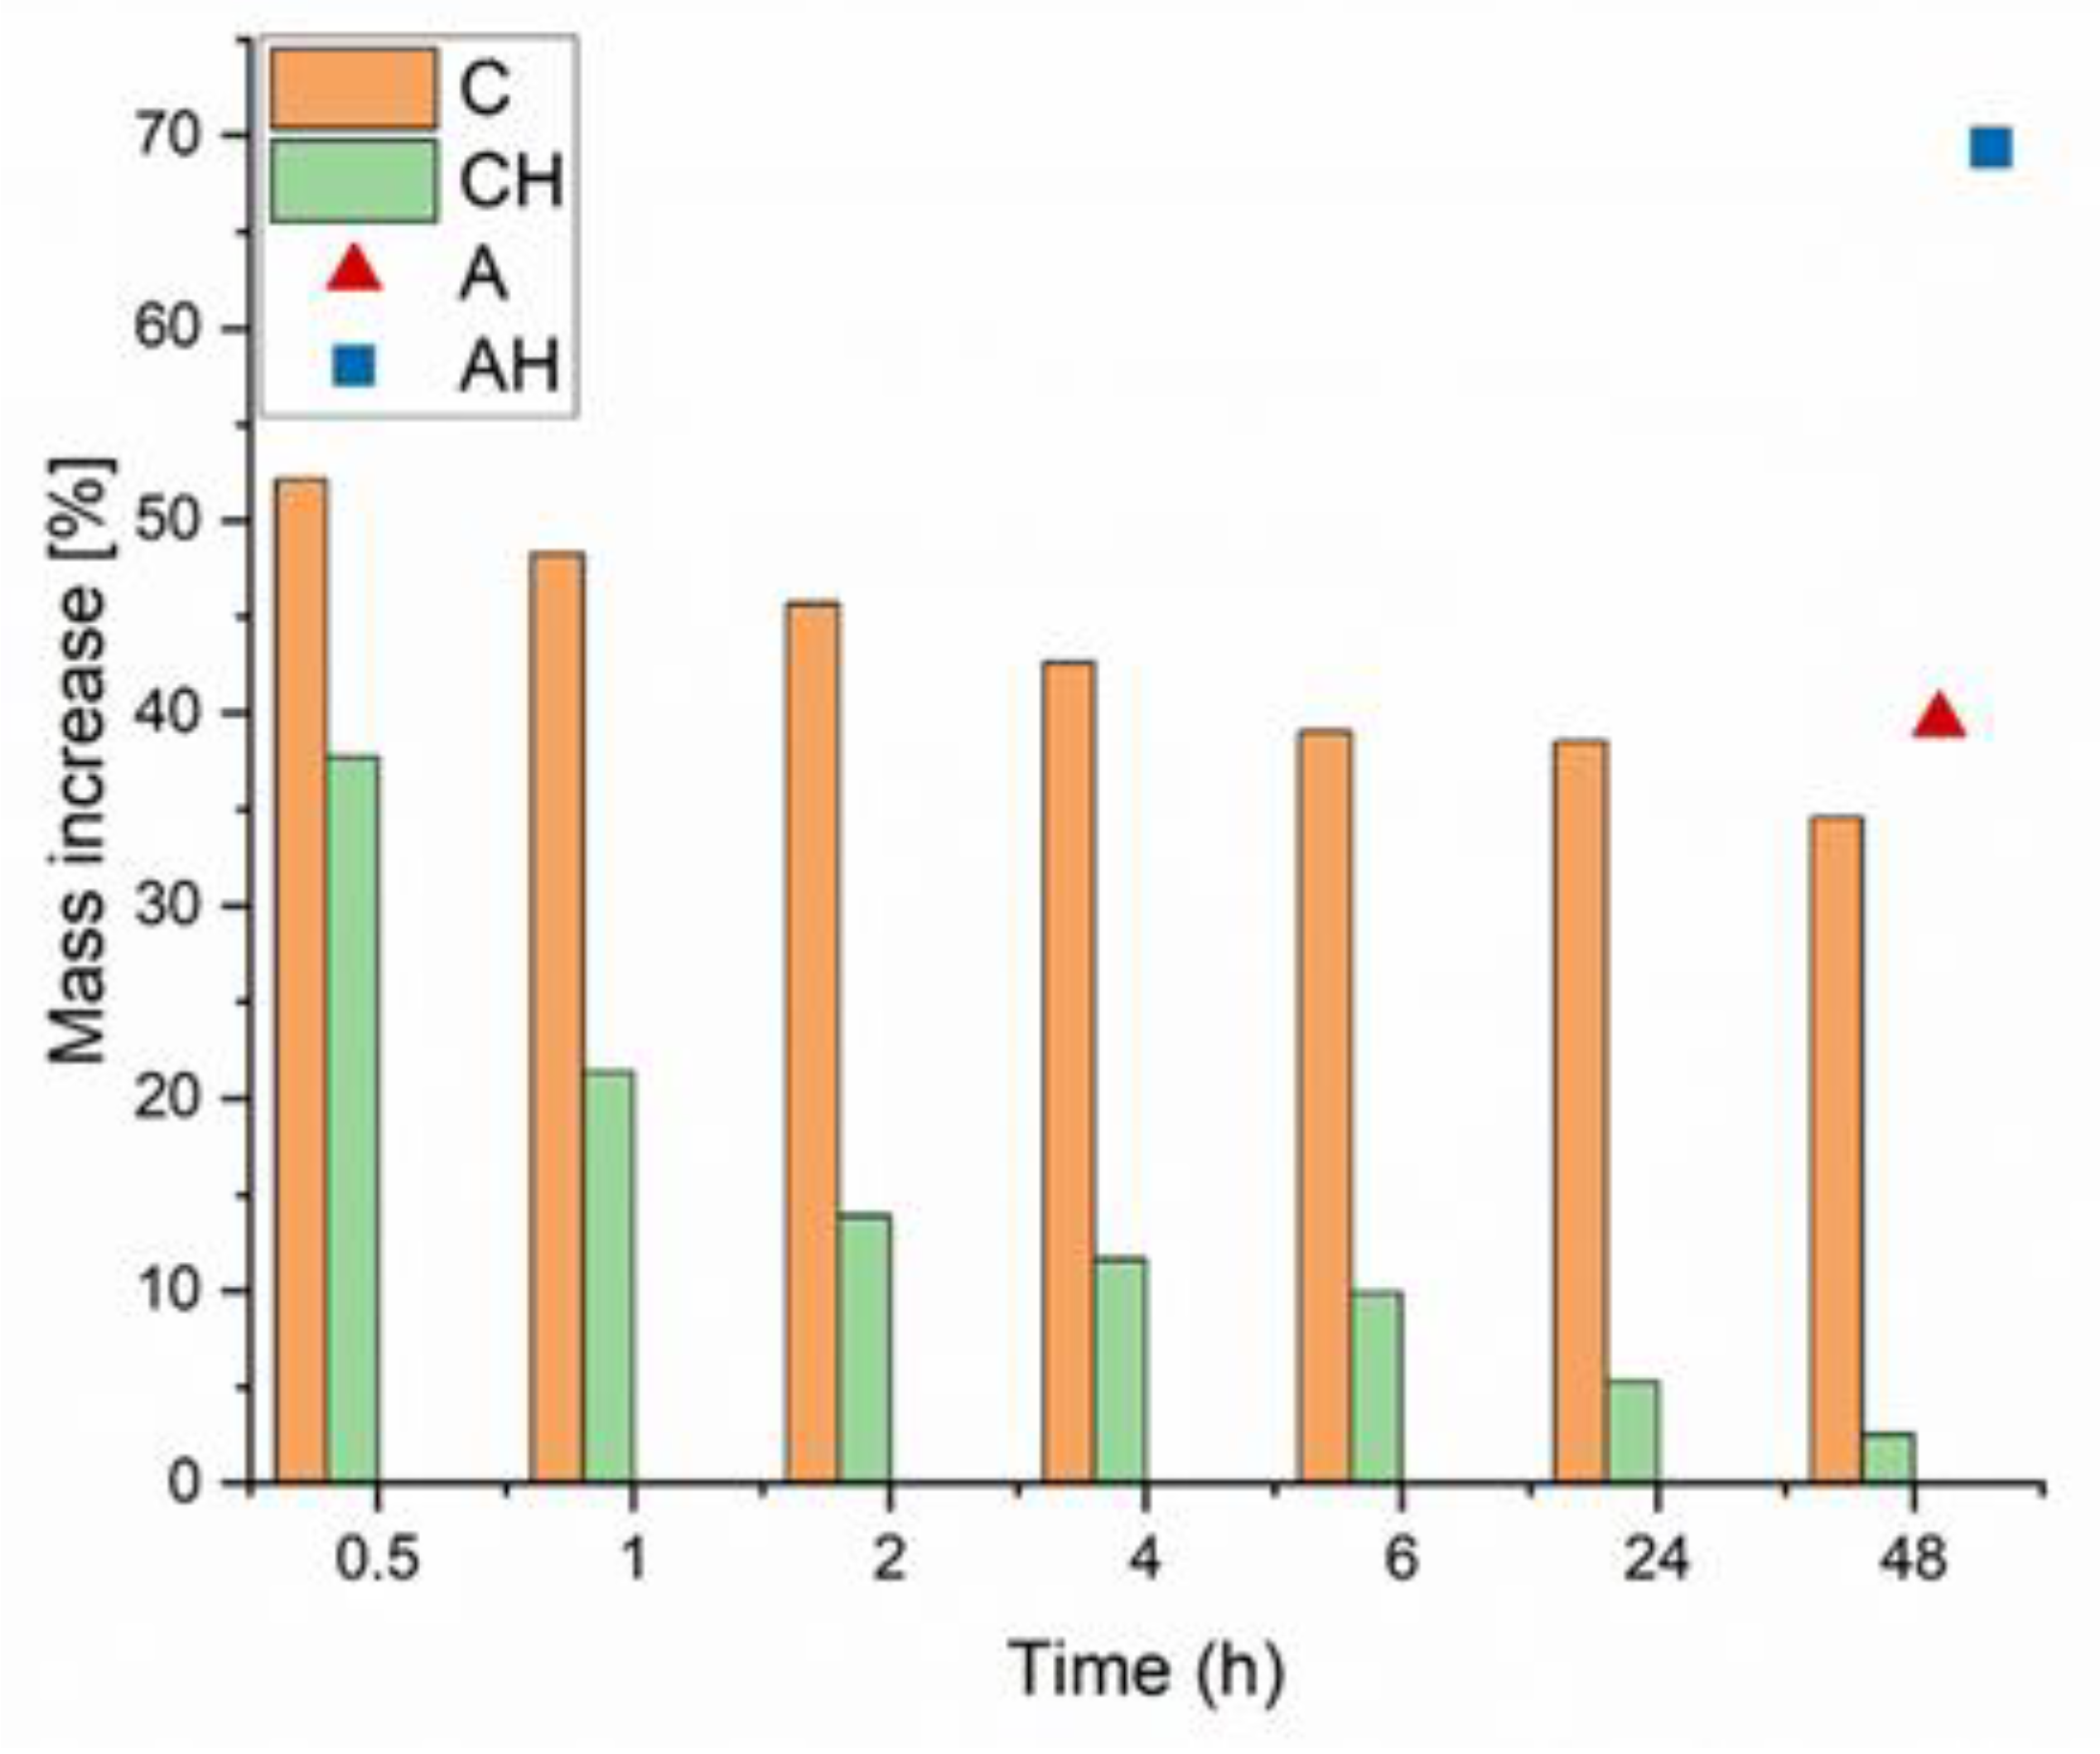
3.1.1. Swelling Properties
3.1.2. Leaching Properties
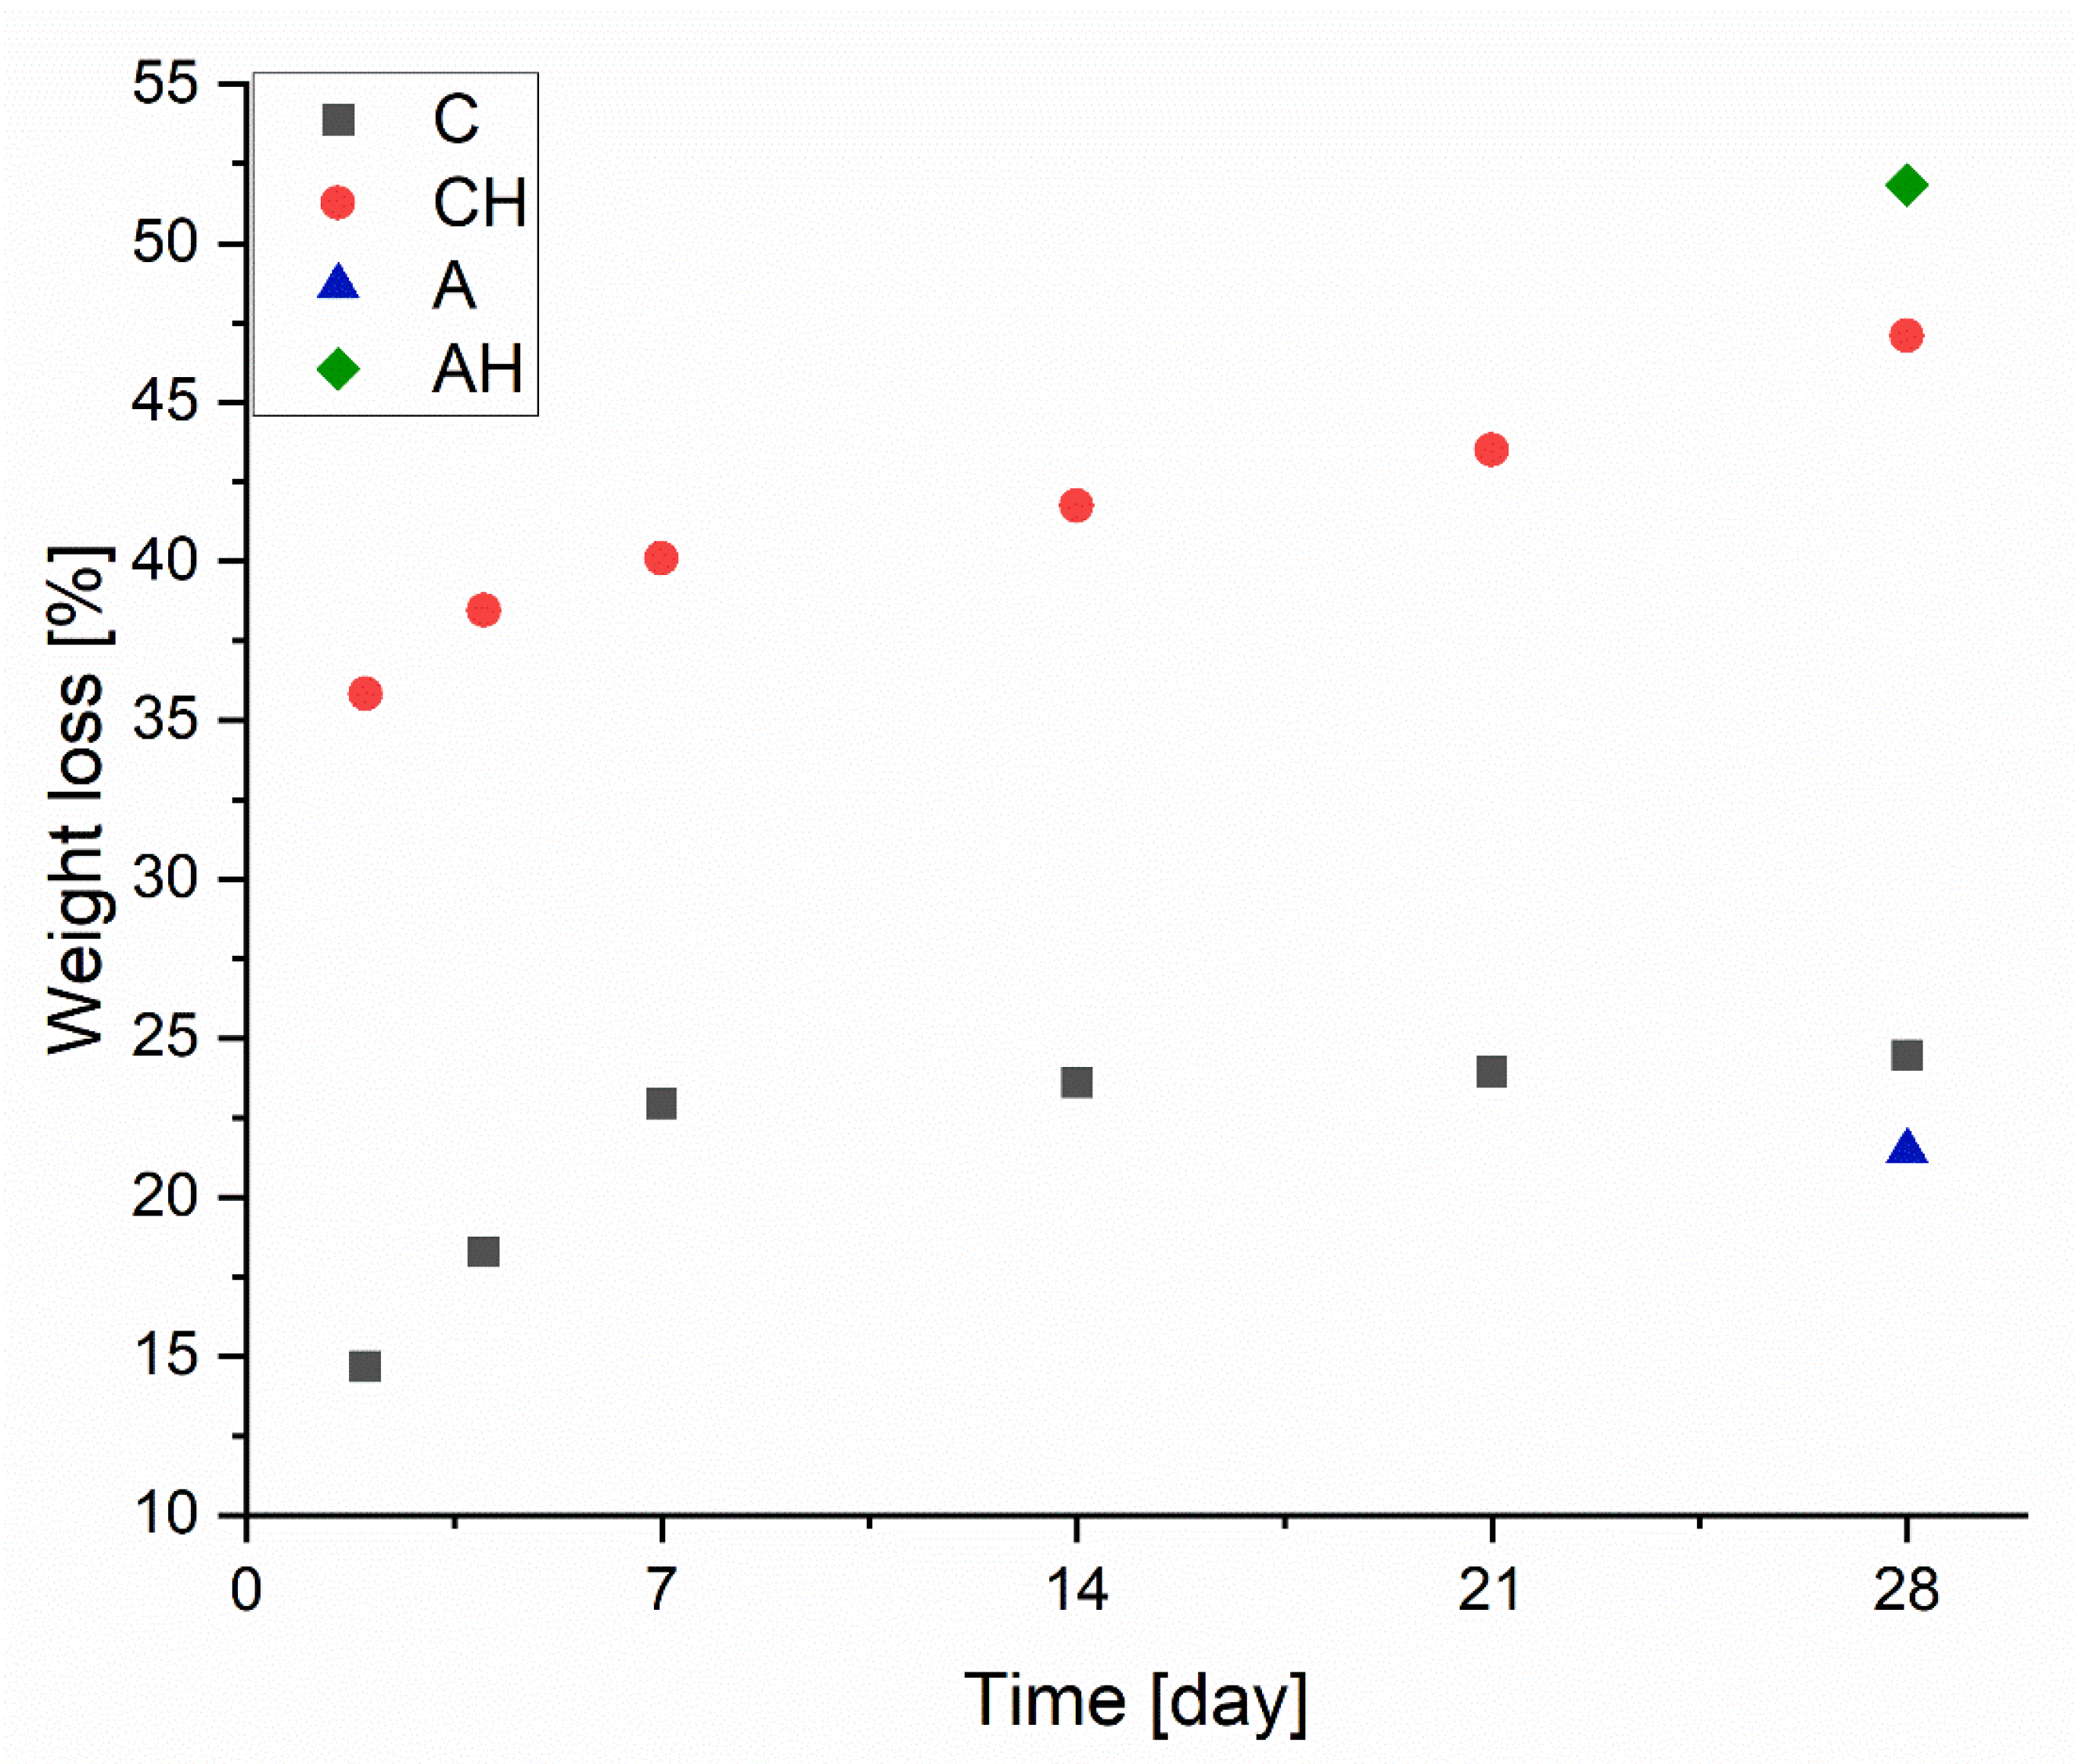
3.1.3. Biodegradability
3.2. Morphology
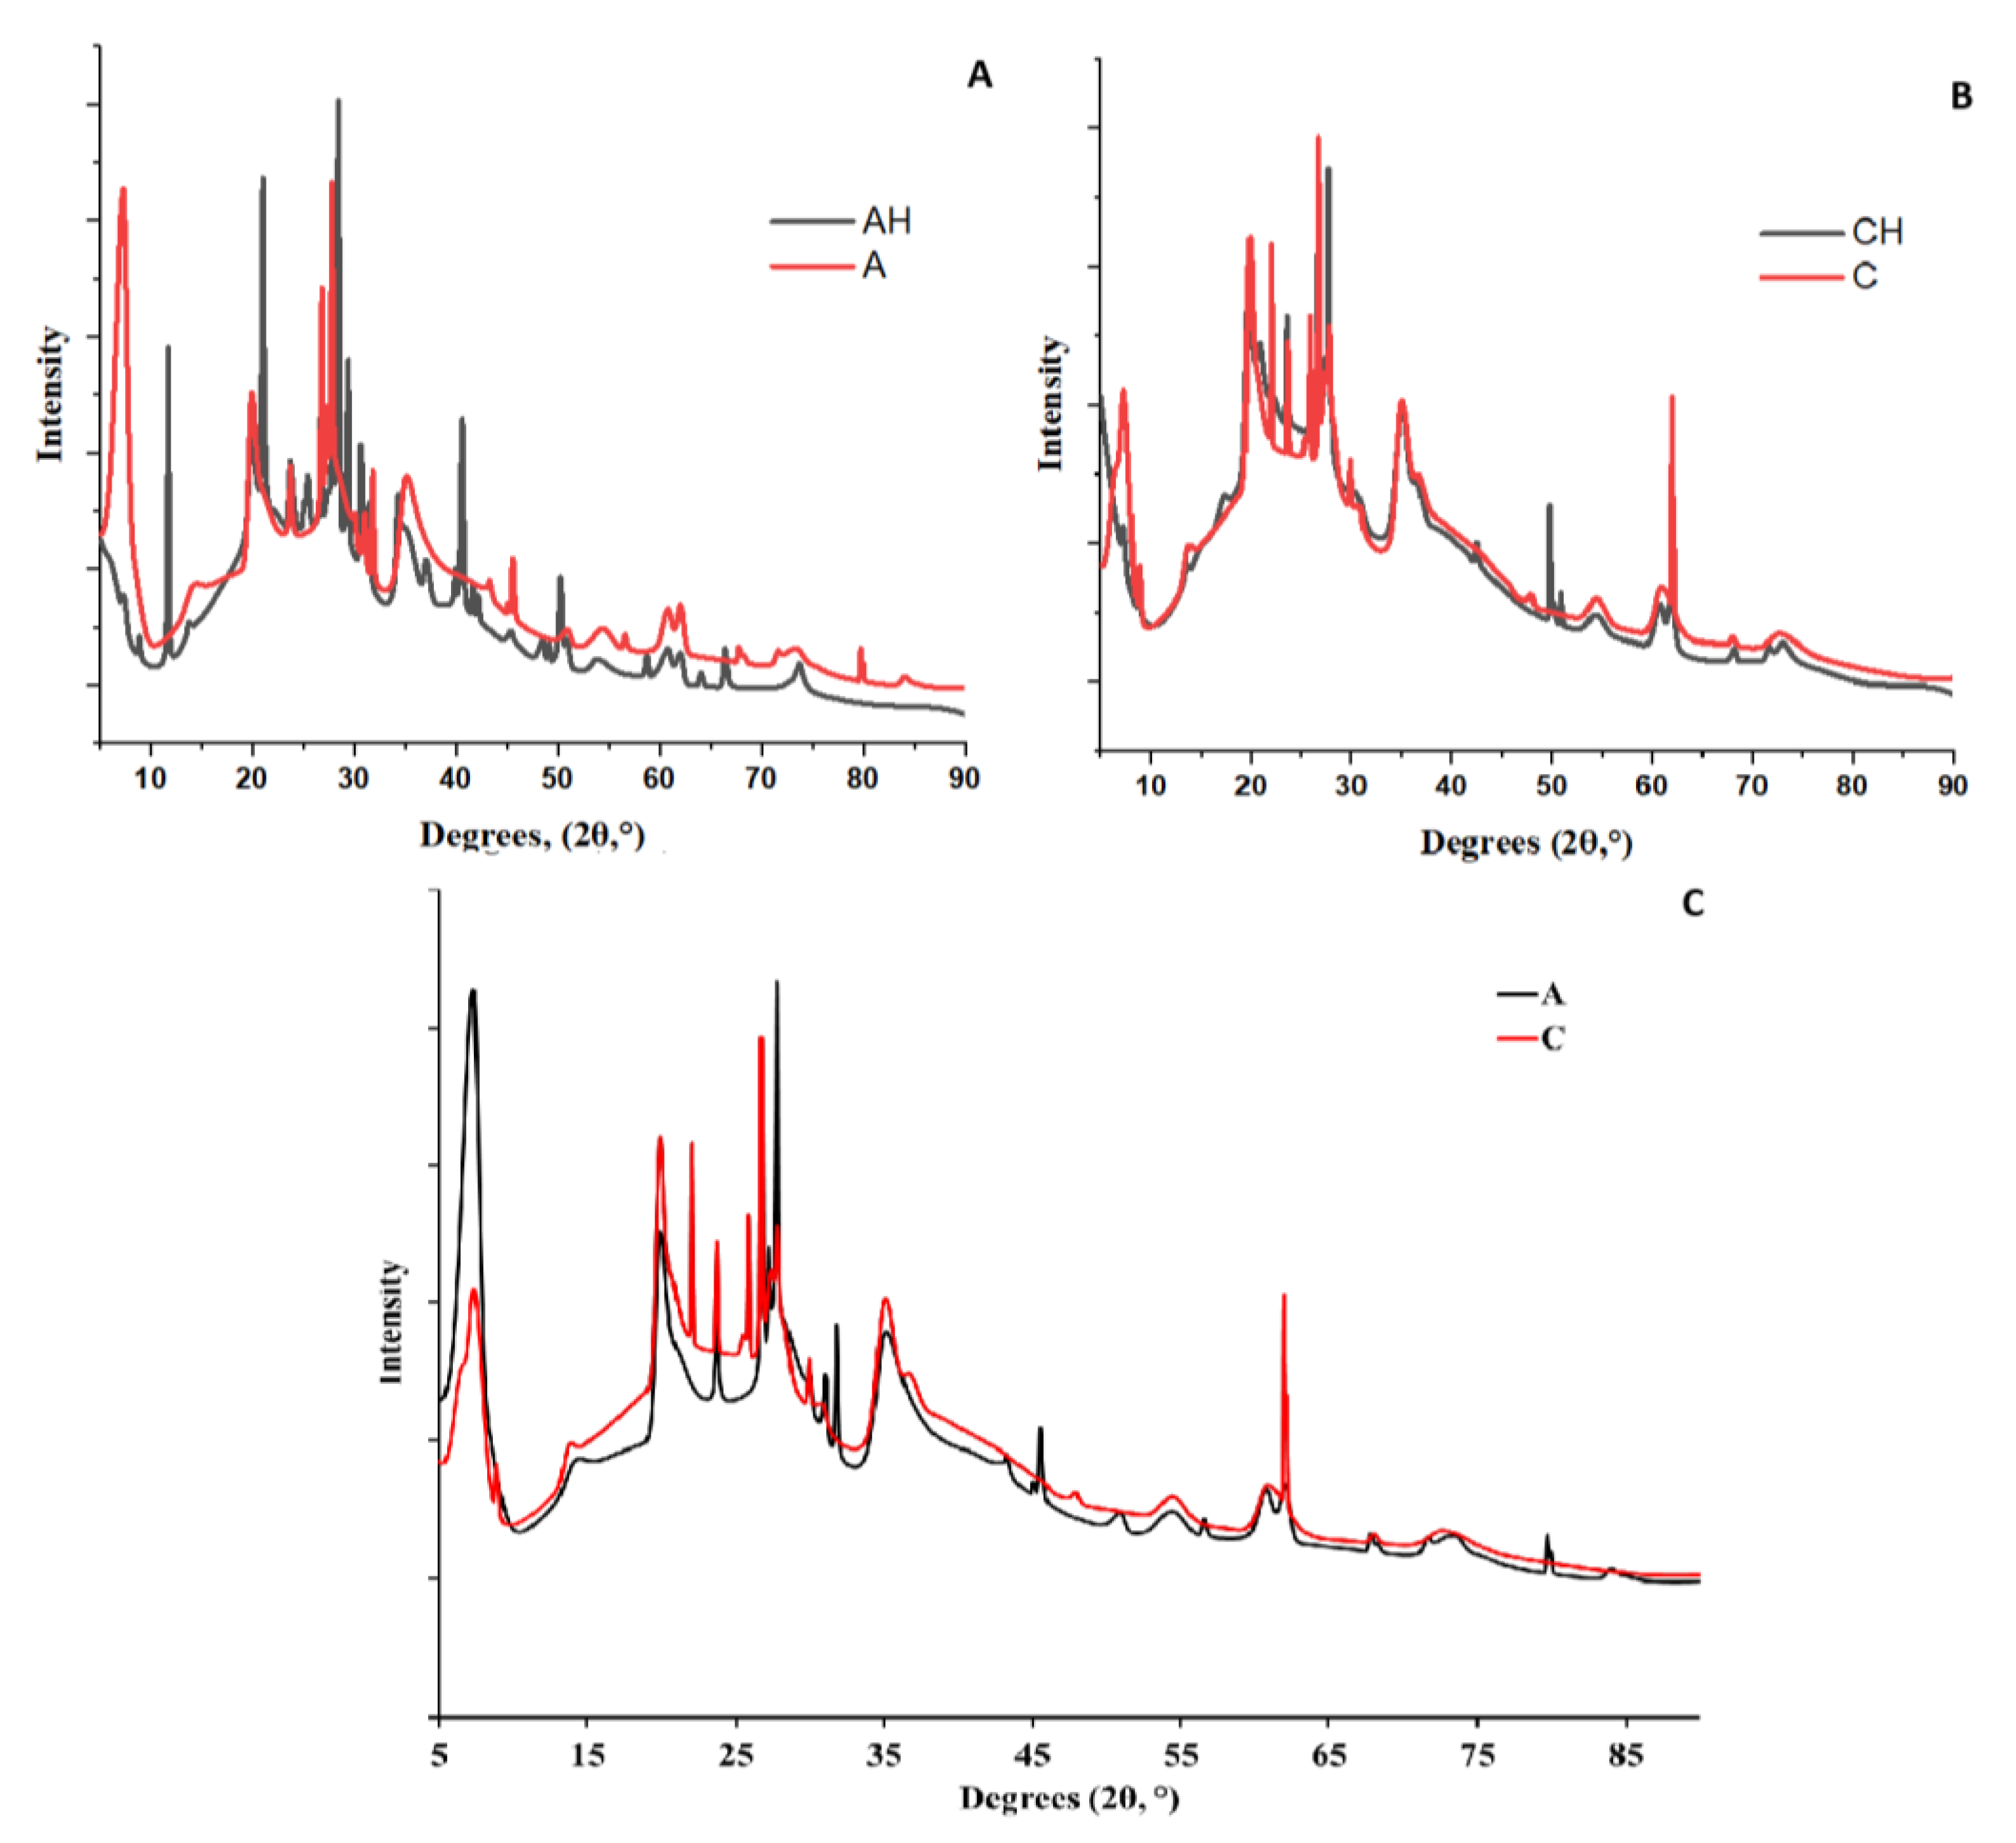
3.2.1. XRD Analysis
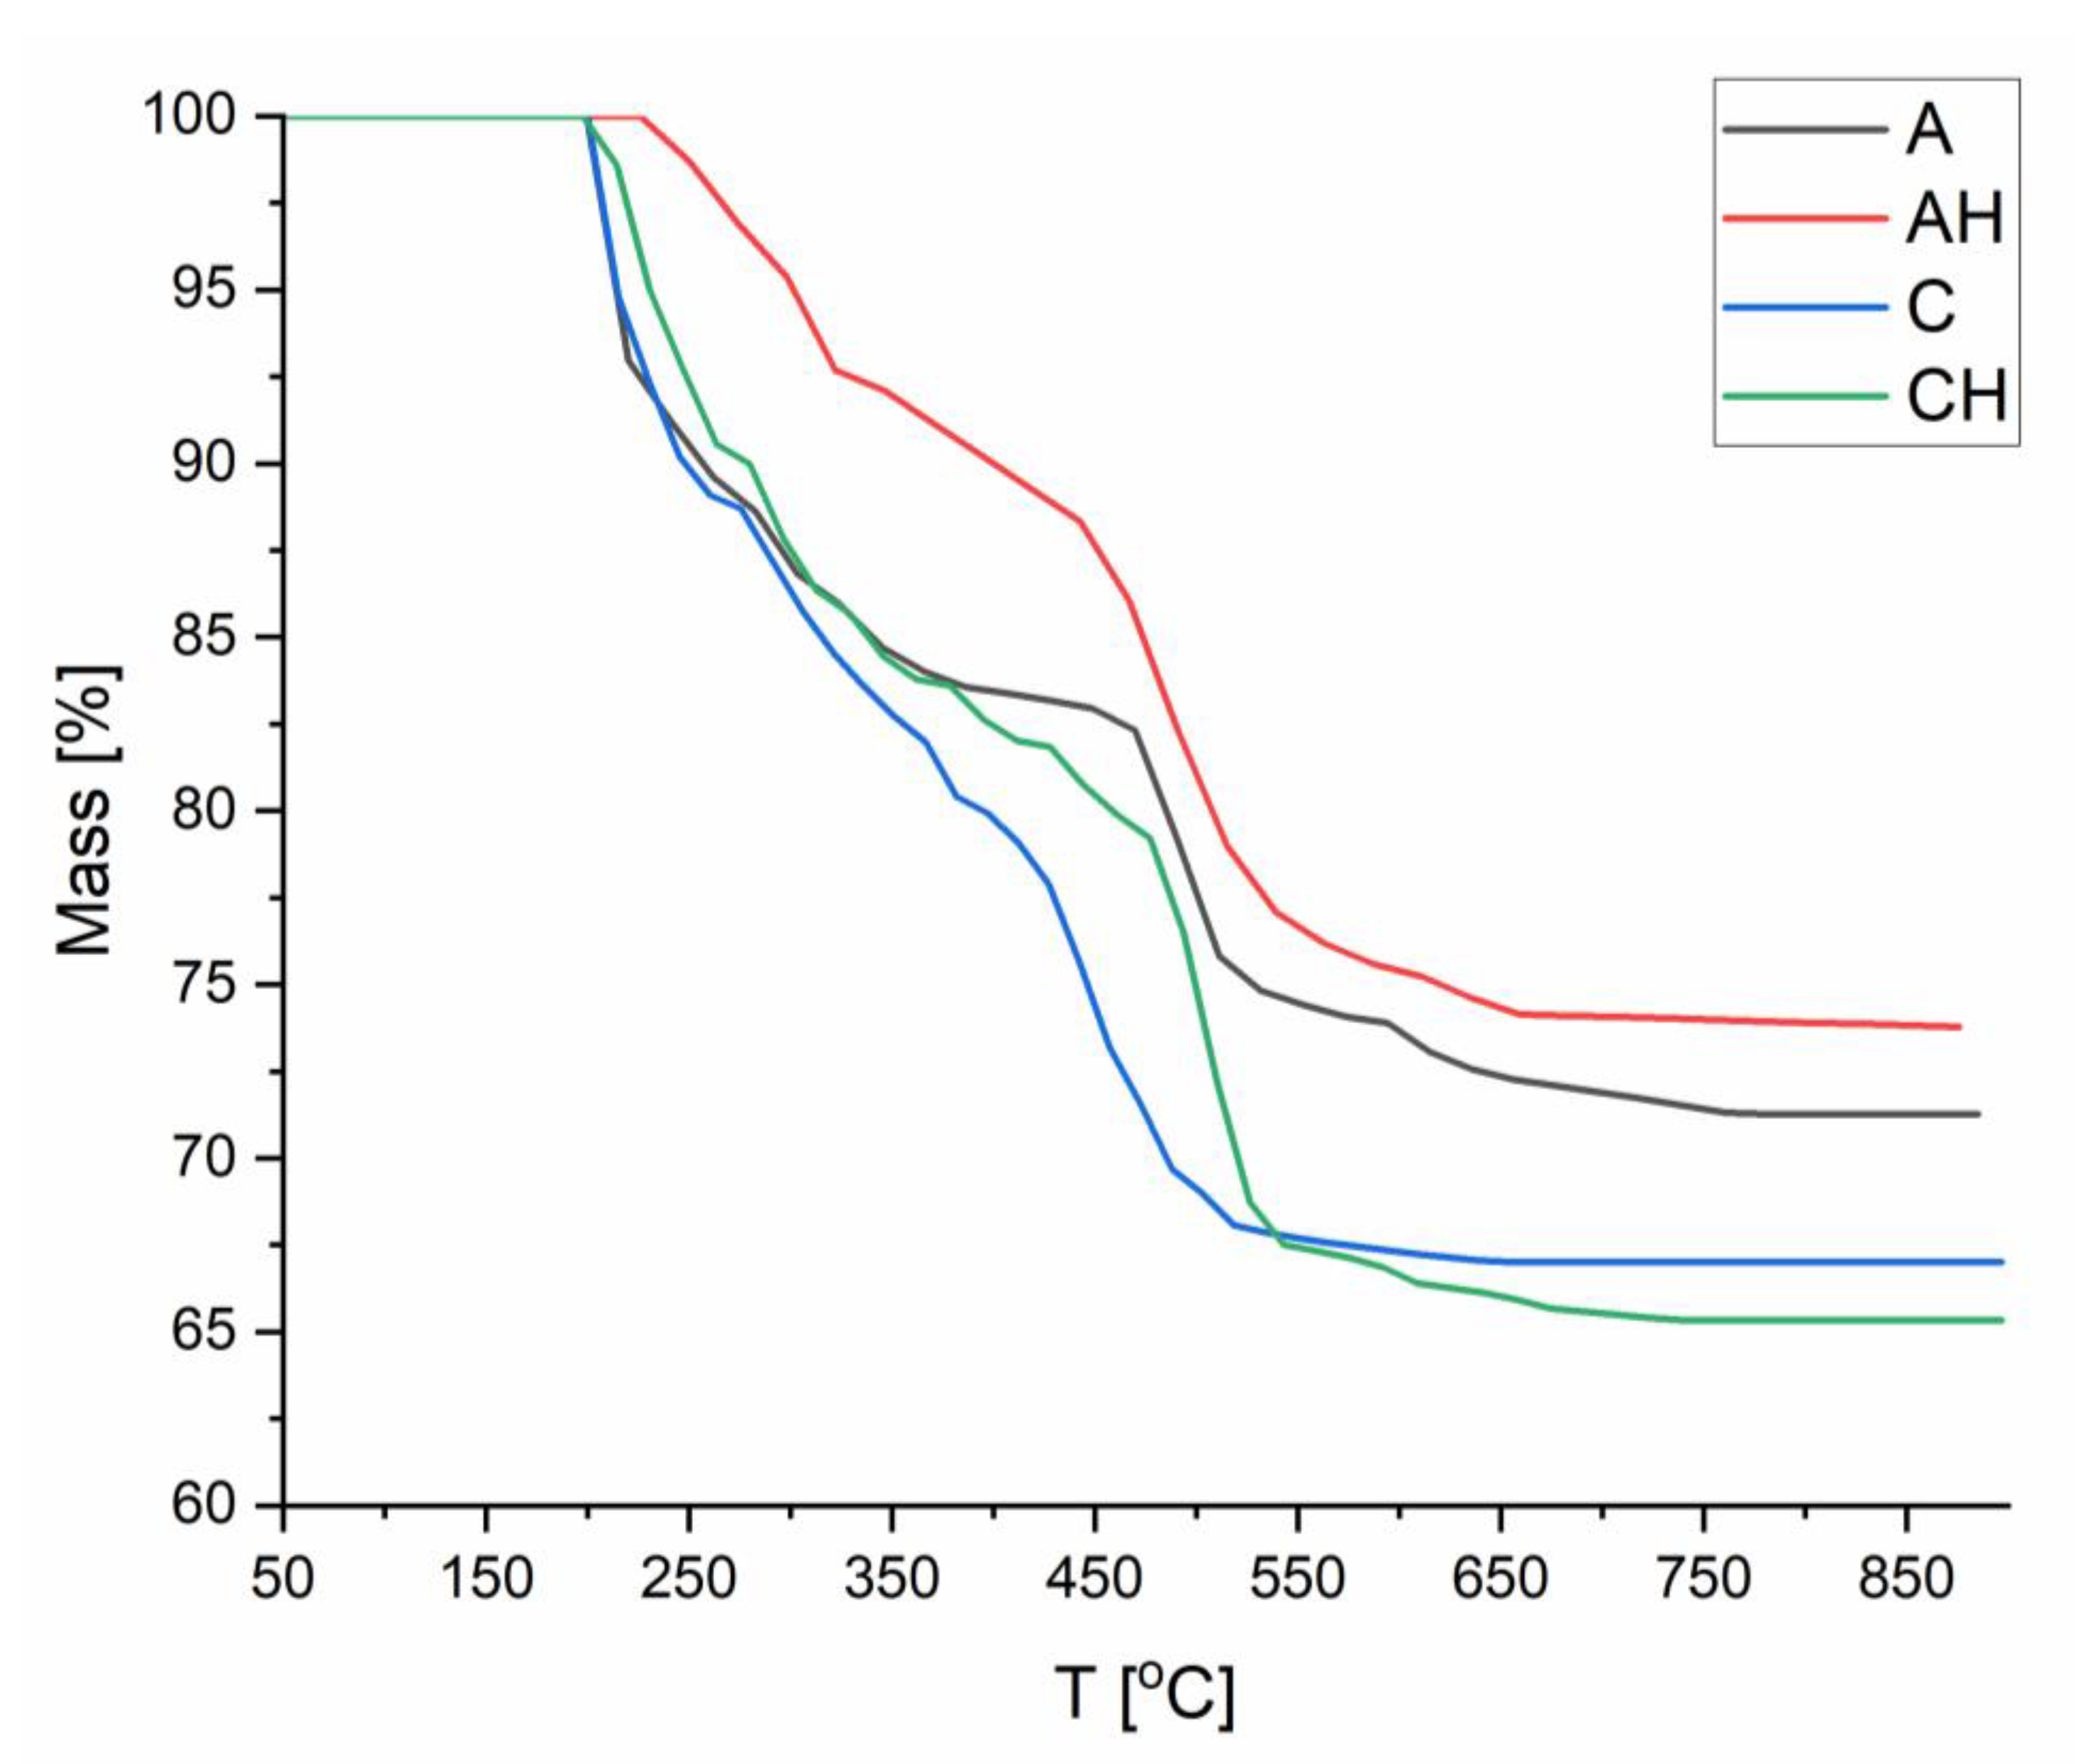
3.2.2. TGA Analysis
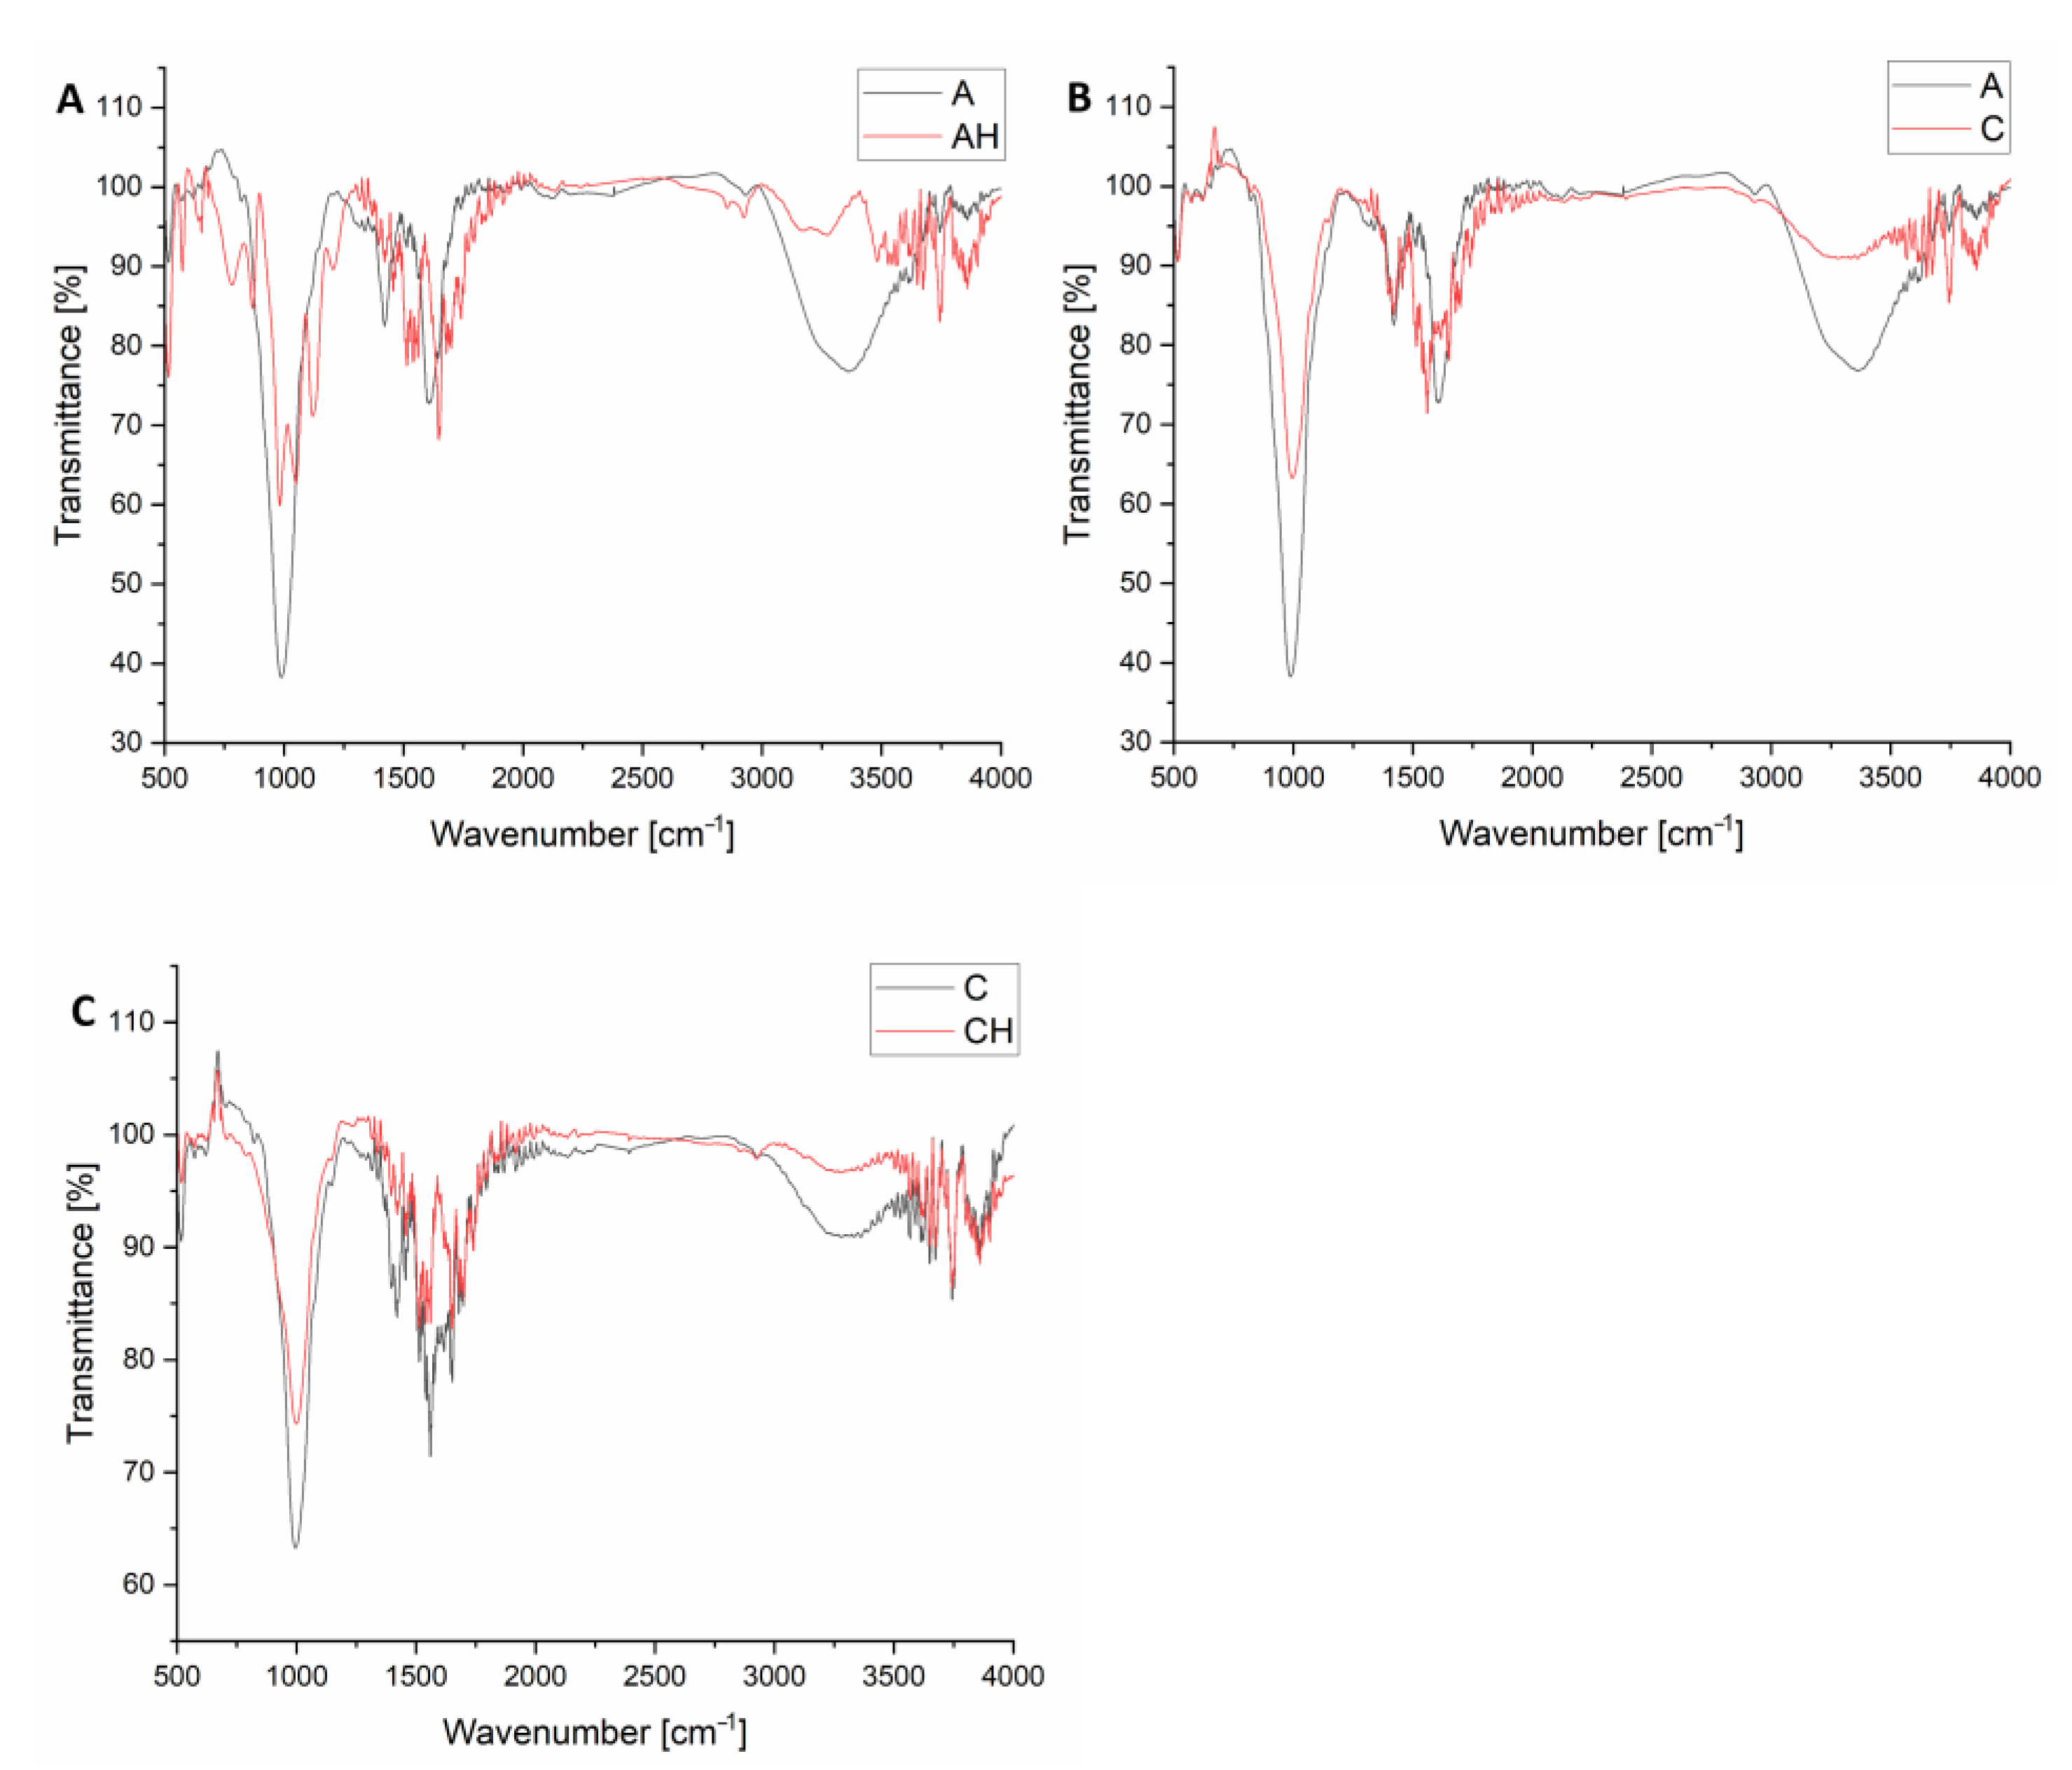
3.2.3. FTIR Analysis
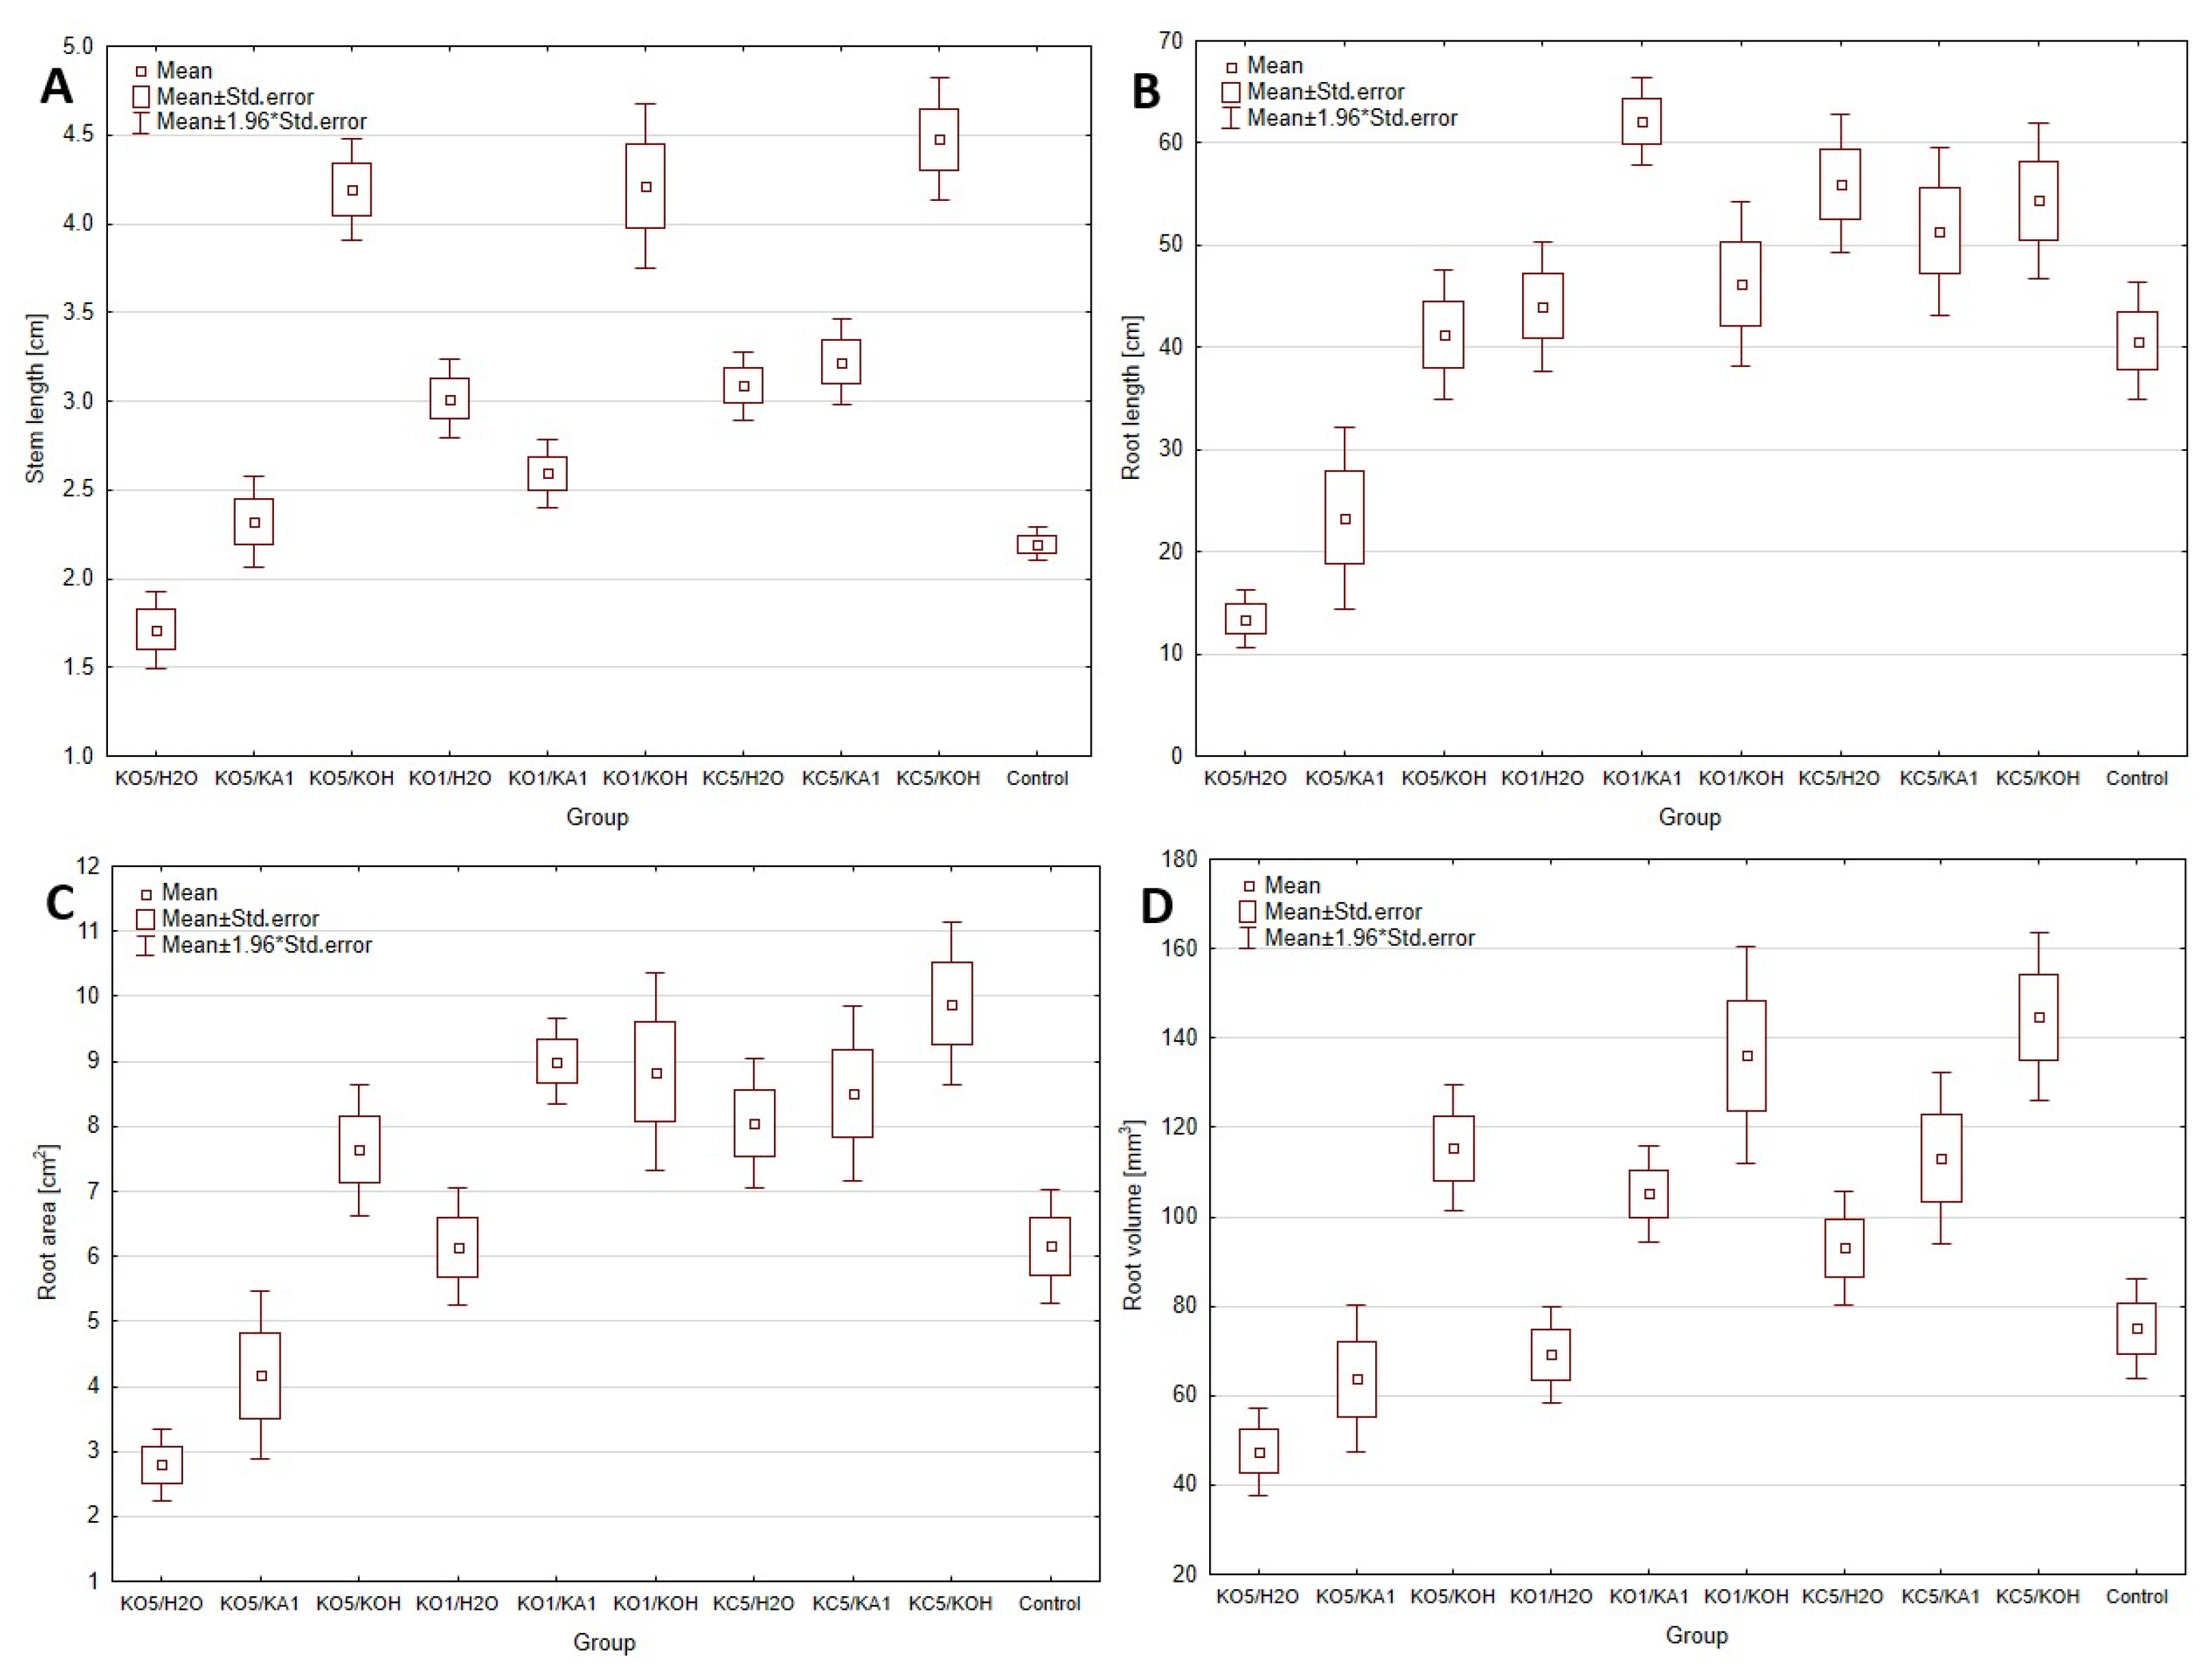
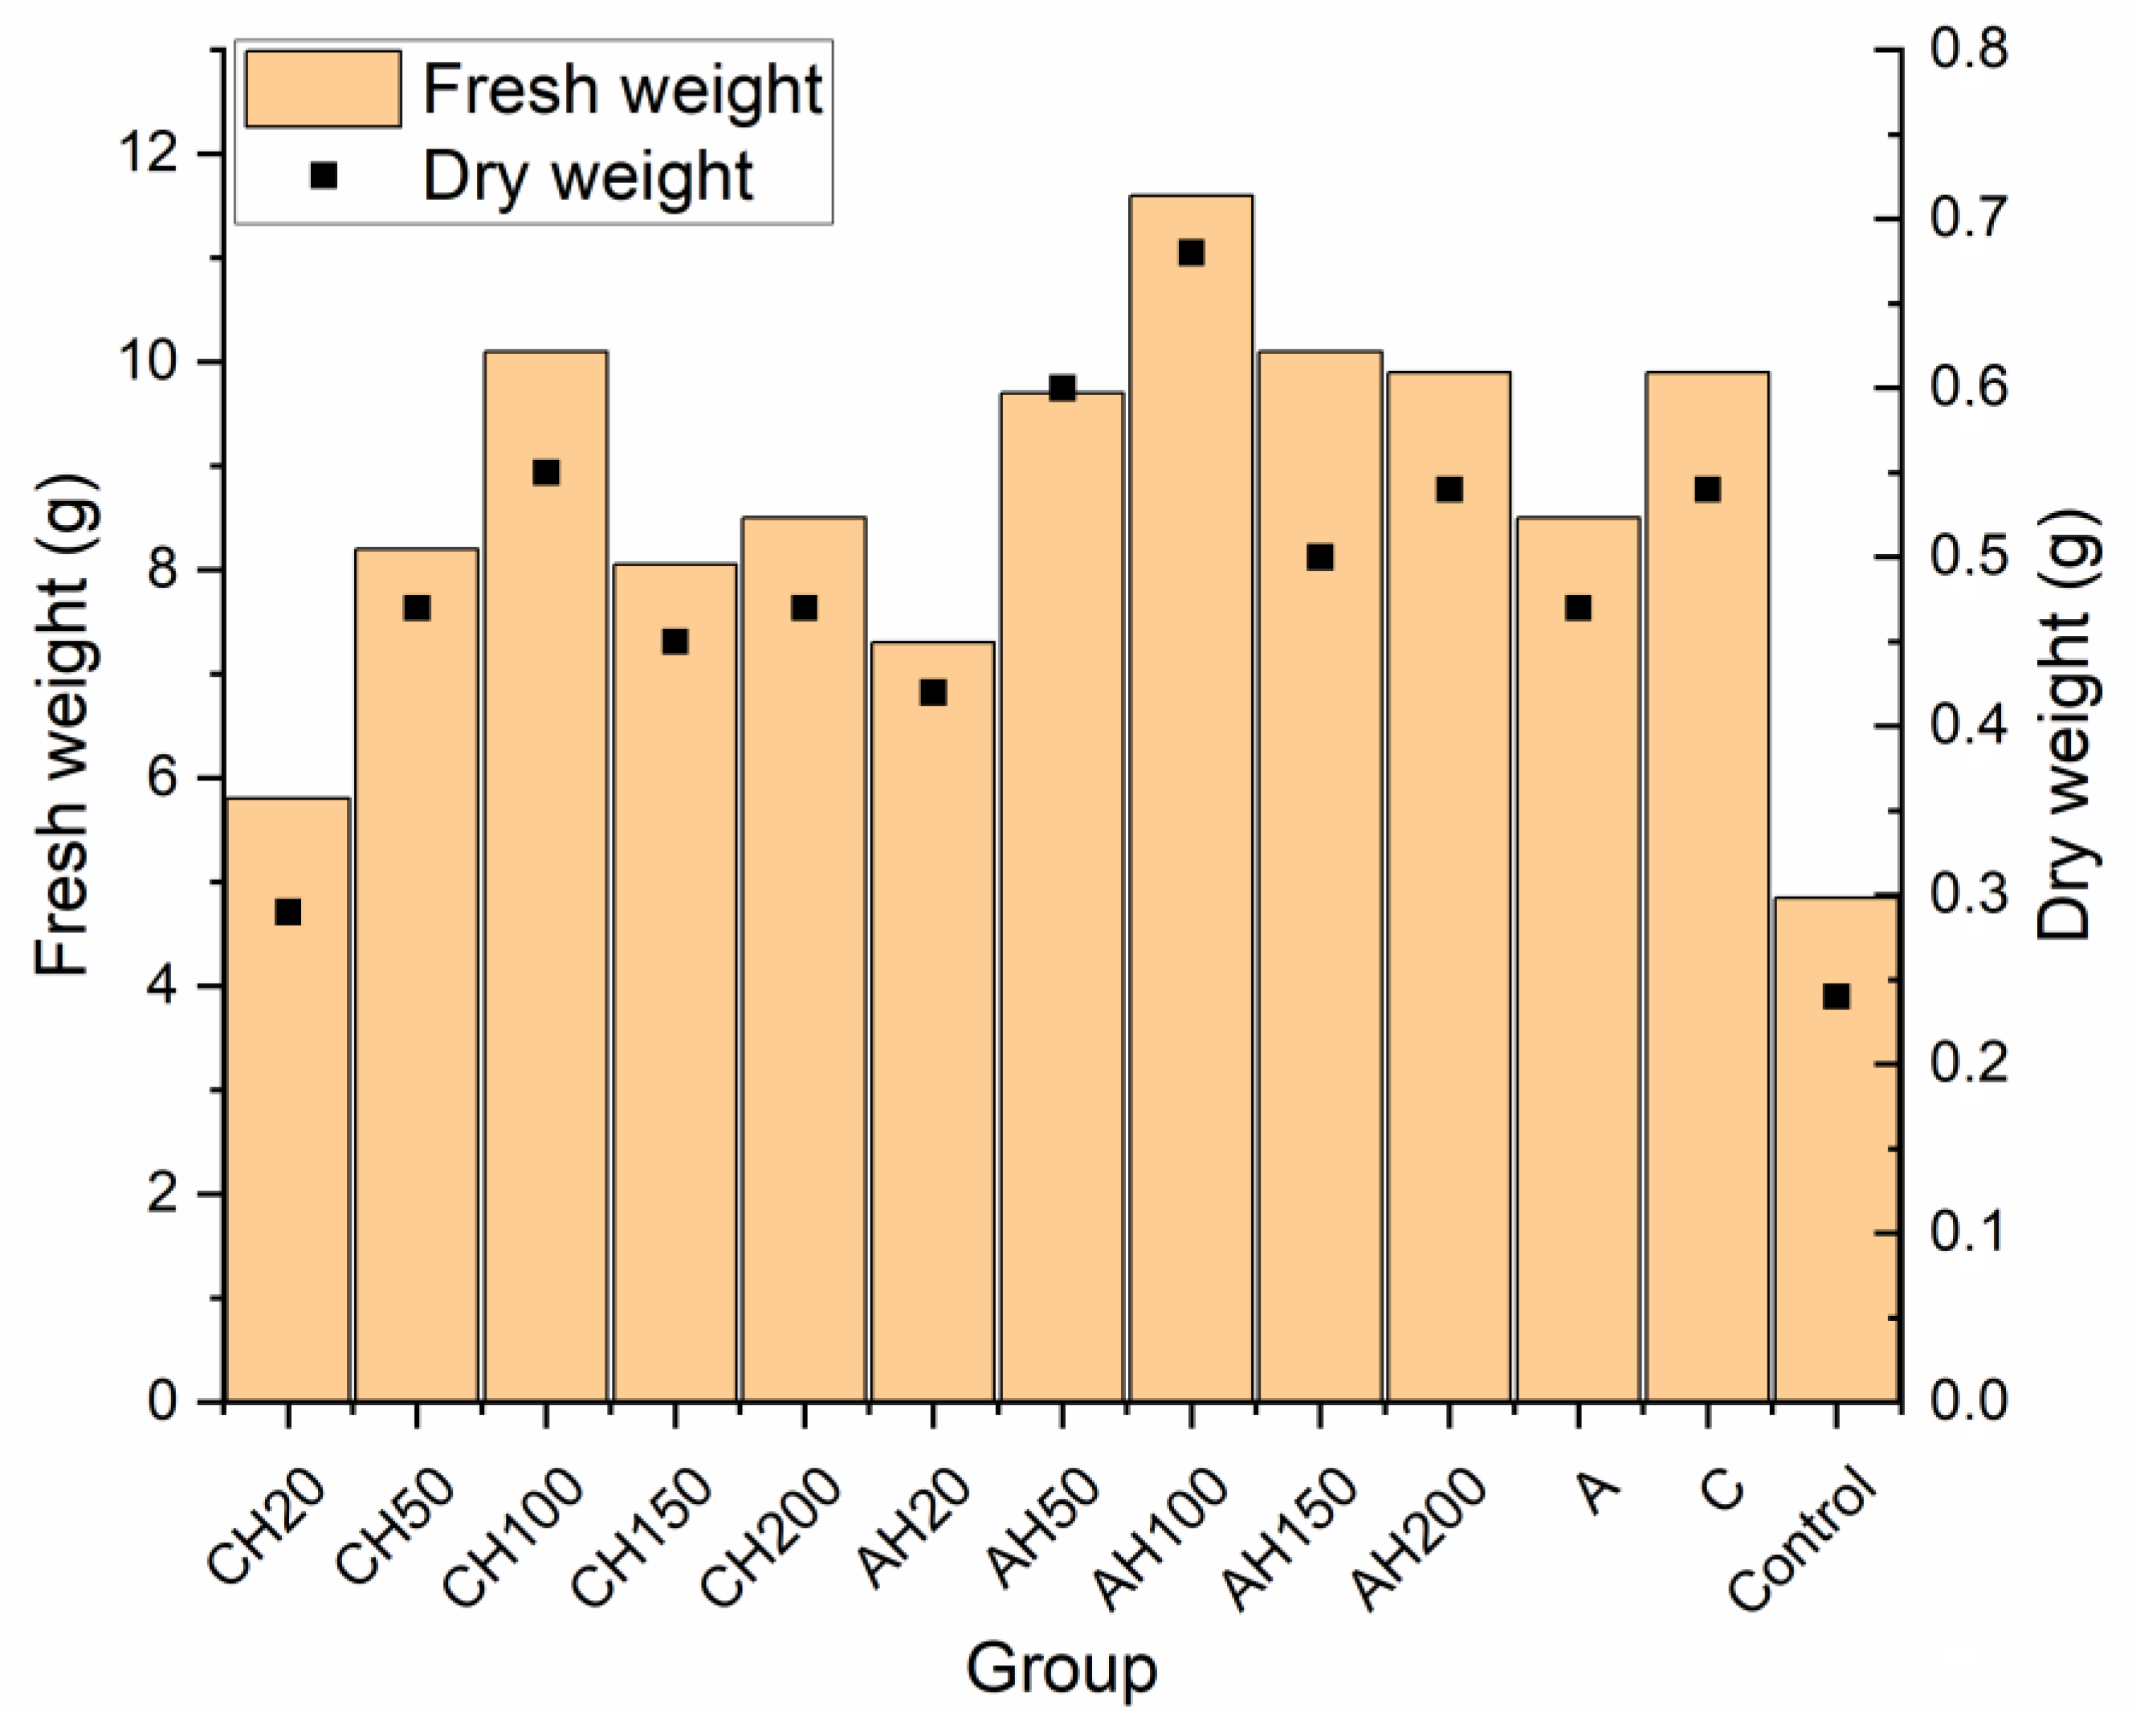
3.3. Germination Tests
3.4. Future Perspective
4. Conclusions
Author Contributions
Funding
Institutional Review Board Statement
Informed Consent Statement
Data Availability Statement
Acknowledgments
Conflicts of Interest
References
- Cross, L.; Gruère, A.; de Sousa, J.; Chtioui, H. Public Summary—Medium-Term Fertilizer Outlook 2024–2028—Fertilizer. Available online: https://www.fertilizer.org/resource/public-summary-medium-term-fertilizer-outlook-2024-2028/ (accessed on 17 December 2024).
- Song, Y.; Ma, L.; Duan, Q.; Xie, H.; Dong, X.; Zhang, H.; Yu, L. Development of Slow-Release Fertilizers with Function of Water Retention Using Eco-Friendly Starch Hydrogels. Molecules 2024, 29, 4835. [Google Scholar] [CrossRef] [PubMed]
- Mikhailidi, A.; Ungureanu, E.; Tofanica, B.M.; Ungureanu, O.C.; Fortună, M.E.; Belosinschi, D.; Volf, I. Agriculture 4.0: Polymer Hydrogels as Delivery Agents of Active Ingredients. Gels 2024, 10, 368. [Google Scholar] [CrossRef]
- Jiang, Y.; Yue, Y.; Wang, Z.; Lu, C.; Yin, Z.; Li, Y.; Ding, X. Plant Biostimulant as an Environmentally Friendly Alternative to Modern Agriculture. J. Agric. Food Chem. 2024, 72, 5107–5121. [Google Scholar] [CrossRef]
- Szopa, D.; Izydorczyk, G.; Chojnacka, K.; Witek-Krowiak, A. Evaluation of the Feasibility of Using Inorganic and Organic Acids for the Extraction of Amino Acids from High-Protein Material (Mealworm Larvae) by Chemical Hydrolysis. J. Environ. Manag. 2024, 349, 119479. [Google Scholar] [CrossRef]
- Szopa, D.; Skrzypczak, D.; Izydorczyk, G.; Chojnacka, K.; Korczyński, M.; Witek-Krowiak, A. Evaluation of Tenebrio Molitor Protein Hydrolysates as Biostimulants Improving Plants Growth and Root Architecture. J. Clean. Prod. 2023, 401, 136812. [Google Scholar] [CrossRef]
- Jíménez-Arias, D.; Morales-Sierra, S.; Silva, P.; Carrêlo, H.; Gonçalves, A.; Ganança, J.F.T.; Nunes, N.; Gouveia, C.S.S.; Alves, S.; Borges, J.P.; et al. Encapsulation with Natural Polymers to Improve the Properties of Biostimulants in Agriculture. Plants 2022, 12, 55. [Google Scholar] [CrossRef]
- Llive, L.M.; Perullini, M.; Santagapita, P.R.; Schneider-Teixeira, A.; Deladino, L. Controlled Release of Fertilizers from Ca(II)-Alginate Matrix Modified by Yerba Mate (Ilex paraguariensis) Waste. Eur. Polym. J. 2020, 138, 109955. [Google Scholar] [CrossRef]
- Mesias, V.S.D.; Agu, A.B.S.; Benablo, P.J.L.; Chen, C.H.; Penaloza, D.P. Coated NPK Fertilizer Based on Citric Acid-Crosslinked Chitosan/Alginate Encapsulant. J. Ecol. Eng. 2019, 20, 1–12. [Google Scholar] [CrossRef]
- Gumelar, M.D.; Hamzah, M.; Hidayat, A.S.; Saputra, D.A. Idvan Utilization of Chitosan as Coating Material in Making NPK Slow Release Fertilizer. Macromol. Symp. 2020, 391, 1900188. [Google Scholar] [CrossRef]
- Kusumastuti, Y.; Istiani, A.; Rochmadi; Purnomo, C.W. Chitosan-Based Polyion Multilayer Coating on NPK Fertilizer as Controlled Released Fertilizer. Adv. Mater. Sci. Eng. 2019, 2019, 2958021. [Google Scholar] [CrossRef]
- Kassem, I.; Ablouh, E.H.; El Bouchtaoui, F.Z.; Hannache, H.; Ghalfi, H.; Sehaqui, H.; El Achaby, M. Cellulose Nanofibers/Engineered Biochar Hybrid Materials as Biodegradable Coating for Slow-Release Phosphate Fertilizers. ACS Sustain. Chem. Eng. 2022, 10, 15250–15262. [Google Scholar] [CrossRef]
- El Assimi, T.; Blažic, R.; Vidović, E.; Raihane, M.; El Meziane, A.; Baouab, M.H.V.; Khouloud, M.; Beniazza, R.; Kricheldorf, H.; Lahcini, M. Polylactide/Cellulose Acetate Biocomposites as Potential Coating Membranes for Controlled and Slow Nutrients Release from Water-Soluble Fertilizers. Prog. Org. Coat. 2021, 156, 106255. [Google Scholar] [CrossRef]
- El Bouchtaoui, F.Z.; Ablouh, E.H.; Kassem, I.; Kassab, Z.; Sehaqui, H.; El Achaby, M. Slow-Release Fertilizers Based on Lignin–Sodium Alginate Biopolymeric Blend for Sustained N–P Nutrients Release. J. Coat. Technol. Res. 2022, 19, 1551–1565. [Google Scholar] [CrossRef]
- Terani, I.M. Encapsulation and Characterization of Slow-Release Microbial Fertilizer from the Composites of Bentonite and Alginate. Appl. Clay Sci. 2015, 109, 68–75. [Google Scholar]
- Molina-García, A.D.; Schneider-Teixeira, A. Calcium Alginate Capsules: Particularities of Fertilizer Systems from Agrofood By-Products. In Basic Protocols in Encapsulation of Food Ingredients; Humana: New York, NY, USA, 2025; pp. 1–9. [Google Scholar]
- Szopa, D.; Mielczarek, M.; Skrzypczak, D.; Izydorczyk, G.; Mikula, K.; Chojnacka, K.; Witek-Krowiak, A. Encapsulation Efficiency and Survival of Plant Growth-Promoting Microorganisms in an Alginate-Based Matrix—A Systematic Review and Protocol for a Practical Approach. Ind. Crops Prod. 2022, 181, 114846. [Google Scholar] [CrossRef]
- Rawat, J.; Pandey, N.; Saxena, J. Role of Potassium in Plant Photosynthesis, Transport, Growth and Yield. In Role Potassium in Abiotic Stress; Iqbal, N., Umar, S., Eds.; Springer: Singapore, 2022; pp. 1–14. [Google Scholar] [CrossRef]
- Bernal, R.A.O.; Olekhnovich, R.O.; Uspenskaya, M.V. Influence of Thermal Treatment and Acetic Acid Concentration on the Electroactive Properties of Chitosan/PVA-Based Micro- and Nanofibers. Polymers 2023, 15, 3719. [Google Scholar] [CrossRef]
- da Silva Alves, D.C.; Healy, B.; Pinto, L.A.d.A.; Cadaval, T.R.S.; Breslin, C.B. Recent Developments in Chitosan-Based Adsorbents for the Removal of Pollutants from Aqueous Environments. Molecules 2021, 26, 594. [Google Scholar] [CrossRef]
- Jiménez-Gómez, C.P.; Cecilia, J.A. Chitosan: A Natural Biopolymer with a Wide and Varied Range of Applications. Molecules 2020, 25, 3981. [Google Scholar] [CrossRef]
- Petroni, S.; Tagliaro, I.; Antonini, C.; D’Arienzo, M.; Orsini, S.F.; Mano, J.F.; Brancato, V.; Borges, J.; Cipolla, L. Chitosan-Based Biomaterials: Insights into Chemistry, Properties, Devices, and Their Biomedical Applications. Mar. Drugs 2023, 21, 147. [Google Scholar] [CrossRef]
- Noipitak, P.; Inphonlek, S.; Nillawong, M.; Sunintaboon, P.; Amornsakchai, T. Chitosan/Alginate Composite Porous Hydrogels Reinforced with PHEMA/PEI Core–Shell Particles and Pineapple-Leaf Cellulose Fibers: Their Physico-Mechanical Properties and Ability to Incorporate AgNP. J. Polym. Res. 2021, 28, 182. [Google Scholar] [CrossRef]
- Karimi, N.; Sani, A.M.; Pourahmad, R. Influence of Carboxy Methyl Cellulose (CMC) and Pectin on Rheological, Physical Stability and Sensory Properties of Milk and Concentrated Jujuba Mixture. J. Food Meas. Charact. 2016, 10, 396–404. [Google Scholar] [CrossRef]
- Ashok, N.; Pradeep, A.; Jayakumar, R. Synthesis-Structure Relationship of Chitosan Based Hydrogels. Adv. Polym. Sci. 2021, 287, 105–129. [Google Scholar] [CrossRef]
- Khatibi, N.; Naimi-Jamal, M.R.; Balalaie, S.; Shokoohmand, A. Development and Evaluation of a PH-Sensitive, Naturally Crosslinked Alginate-Chitosan Hydrogel for Drug Delivery Applications. Front. Biomater. Sci. 2024, 3, 1457540. [Google Scholar] [CrossRef]
- Szekalska, M.; Sosnowska, K.; Zakrzeska, A.; Kasacka, I.; Lewandowska, A.; Winnicka, K. The Influence of Chitosan Cross-Linking on the Properties of Alginate Microparticles with Metformin Hydrochloride—In Vitro and In Vivo Evaluation. Molecules 2017, 22, 182. [Google Scholar] [CrossRef]
- Habuka, A.; Yamada, T.; Nakashima, S. Interactions of Glycerol, Diglycerol, and Water Studied Using Attenuated Total Reflection Infrared Spectroscopy. Appl. Spectrosc. 2020, 74, 767–779. [Google Scholar] [CrossRef]
- Zárate-Ramírez, L.S.; Martínez, I.; Romero, A.; Partal, P.; Guerrero, A. Wheat Gluten-based Materials Plasticised with Glycerol and Water by Thermoplastic Mixing and Thermomoulding. J. Sci. Food Agric. 2011, 91, 625–633. [Google Scholar] [CrossRef]
- Friedman, S.P.; Mualem, Y. Diffusion of Fertilizers from Controlled-Release Sources Uniformly Distributed in Soil. Fertil. Res. 1994, 39, 19–30. [Google Scholar] [CrossRef]
- Schoeller, J.; Itel, F.; Wuertz-Kozak, K.; Gaiser, S.; Luisier, N.; Hegemann, D.; Ferguson, S.J.; Fortunato, G.; Rossi, R.M. PH-Responsive Chitosan/Alginate Polyelectrolyte Complexes on Electrospun PLGA Nanofibers for Controlled Drug Release. Nanomaterials 2021, 11, 1850. [Google Scholar] [CrossRef]
- Doulgeris, C.; Kypritidou, Z.; Kinigopoulou, V.; Hatzigiannakis, E. Simulation of Potassium Availability in the Application of Biochar in Agricultural Soil. Agronomy 2023, 13, 784. [Google Scholar] [CrossRef]
- Chen, L.; Jiang, F.; Xu, H.; Fan, Y.; Du, C. Improved Membrane Stability of Alginate-Chitosan Microcapsules by Crosslinking with Tannic Acid. Biotechnol. Lett. 2023, 45, 1039–1052. [Google Scholar] [CrossRef]
- Wang, J.; Yuan, Y.; Liu, Y.; Li, X.; Wu, S. Application of Chitosan in Fruit Preservation: A Review. Food Chem. X 2024, 23, 101589. [Google Scholar] [CrossRef] [PubMed]
- Wulandari, W.; Islami, D.M.; Wellia, D.V.; Emriadi, E.; Sisca, V.; Jamarun, N. The Effect of Alginate Concentration on Crystallinity, Morphology, and Thermal Stability Properties of Hydroxyapatite/Alginate Composite. Polymers 2023, 15, 614. [Google Scholar] [CrossRef]
- Malektaj, H.; Drozdov, A.D.; deClaville Christiansen, J. Mechanical Properties of Alginate Hydrogels Cross-Linked with Multivalent Cations. Polymers 2023, 15, 3012. [Google Scholar] [CrossRef]
- Pragya, A.; Mutalik, S.; Younas, M.W.; Pang, S.K.; So, P.K.; Wang, F.; Zheng, Z.; Noor, N. Dynamic Cross-Linking of an Alginate–Acrylamide Tough Hydrogel System: Time-Resolved in Situ Mapping of Gel Self-Assembly. RSC Adv. 2021, 11, 10710–10726. [Google Scholar] [CrossRef]
- Saberian, M.; Safari Roudsari, R.; Haghshenas, N.; Rousta, A.; Alizadeh, S. How the Combination of Alginate and Chitosan Can Fabricate a Hydrogel with Favorable Properties for Wound Healing. Heliyon 2024, 10, e32040. [Google Scholar] [CrossRef]
- Azha, S.F.; Shahadat, M.; Ismail, S.; Ali, S.W.; Ahammad, S.Z. Prospect of Clay-Based Flexible Adsorbent Coatings as Cleaner Production Technique in Wastewater Treatment, Challenges, and Issues: A Review. J. Taiwan. Inst. Chem. Eng. 2021, 120, 178–206. [Google Scholar] [CrossRef]
- Holme, H.K.; Lindmo, K.; Kristiansen, A.; Smidsrød, O. Thermal Depolymerization of Alginate in the Solid State. Carbohydr. Polym. 2003, 54, 431–438. [Google Scholar] [CrossRef]
- Bal, C.; Ocak, B. Impact of Cross-Linker Types and Concentrations on Physical, Mechanical, and Barrier Properties of Collagen Hydrolysate Obtained from Leather Industry Trimming Wastes and Sodium Alginate-Based Films. Polym. Bull. 2024, 81, 16077–16102. [Google Scholar] [CrossRef]
- Merenkova, S.; Zinina, O. Effect of Bioactive Packaging Materials Based on Sodium Alginate and Protein Hydrolysates on the Quality and Safety of Refrigerated Chicken Meat. Polymers 2024, 16, 3430. [Google Scholar] [CrossRef]
- Zhang, X.; Huang, C.; Jin, X. Influence of K+ and Na+ Ions on the Degradation of Wet-Spun Alginate Fibers for Tissue Engineering. J. Appl. Polym. Sci. 2017, 134, 44396. [Google Scholar] [CrossRef]
- Moussout, H.; Ahlafi, H.; Aazza, M.; Bourakhouadar, M. Kinetics and Mechanism of the Thermal Degradation of Biopolymers Chitin and Chitosan Using Thermogravimetric Analysis. Polym. Degrad. Stab. 2016, 130, 1–9. [Google Scholar] [CrossRef]
- Guerrero, P.; De La Caba, K. Thermal and Mechanical Properties of Soy Protein Films Processed at Different PH by Compression. J. Food Eng. 2010, 100, 261–269. [Google Scholar] [CrossRef]
- Gerlei, M.; Pierson, H.; Ponçot, M.; Kahn, C.J.F.; Linder, M. Chemical Composition and Crystallization Behavior of Oil and Fat Blends for Spreadable Fat Applications. Foods 2024, 13, 3305. [Google Scholar] [CrossRef]
- Pelton, J.T.; McLean, L.R. Spectroscopic Methods for Analysis of Protein Secondary Structure. Anal. Biochem. 2000, 277, 167–176. [Google Scholar] [CrossRef]
- Deshmukh, A.P.; Pacheco, C.; Hay, M.B.; Myneni, S.C.B. Structural Environments of Carboxyl Groups in Natural Organic Molecules from Terrestrial Systems. Part 2: 2D NMR Spectroscopy. Geochim. Cosmochim. Acta 2007, 71, 3533–3544. [Google Scholar] [CrossRef]
- da Silva, G.P.; Mack, M.; Contiero, J. Glycerol: A Promising and Abundant Carbon Source for Industrial Microbiology. Biotechnol. Adv. 2008, 27, 30–39. [Google Scholar] [CrossRef] [PubMed]
- Oh, T. Correlation between Potential Barrier and FTIR Spectra in SiOC Film with the C-O Bond of Sp3 Structure. Bull. Korean Chem. Soc. 2009, 30, 467–470. [Google Scholar] [CrossRef]
- Gartner, C.; Peláez, C.A.; López, B.L. Characterization of Chitin and Chitosan Extracted from Shrimp Shells by Two Methods. E-Polym. 2010, 10, 069. [Google Scholar] [CrossRef]
- Tahari, N.; de Hoyos-Martinez, P.L.; Izaguirre, N.; Houwaida, N.; Abderrabba, M.; Ayadi, S.; Labidi, J. Preparation of Chitosan/Tannin and Montmorillonite Films as Adsorbents for Methyl Orange Dye Removal. Int. J. Biol. Macromol. 2022, 210, 94–106. [Google Scholar] [CrossRef]
- Lawrie, G.; Keen, I.; Drew, B.; Chandler-Temple, A.; Rintoul, L.; Fredericks, P.; Grøndahl, L. Interactions between Alginate and Chitosan Biopolymers Characterized Using FTIR and XPS. Biomacromolecules 2007, 8, 2533–2541. [Google Scholar] [CrossRef]
- Dai, F.; Zhuang, Q.; Huang, G.; Deng, H.; Zhang, X. Infrared Spectrum Characteristics and Quantification of OH Groups in Coal. ACS Omega 2023, 8, 17064. [Google Scholar] [CrossRef] [PubMed]
- Juranville, J.F.; Pöschl, B.; Oesterhelt, G.; Schönfeld, H.J.; Fountoulakis, M. Glycerol Affects the Quantification of Aspartate and Glutamate in Acid-Hydrolyzed Proteins. Amino Acids 1998, 15, 253–262. [Google Scholar] [CrossRef]
- Mahmoudi, C.; Tahraoui Douma, N.; Mahmoudi, H.; Iurciuc, C.E.; Popa, M.; Hamcerencu, M.; Andrițoiu, C.V. Developing and Characterizing a Biocompatible Hydrogel Obtained by Cross-Linking Gelatin with Oxidized Sodium Alginate for Potential Biomedical Applications. Polymers 2024, 16, 3143. [Google Scholar] [CrossRef]
- Rojas-Pirela, M.; Carillo, P.; Lárez-Velásquez, C.; Romanazzi, G. Effects of Chitosan on Plant Growth under Stress Conditions: Similarities with Plant Growth Promoting Bacteria. Front. Plant Sci. 2024, 15, 1423949. [Google Scholar] [CrossRef] [PubMed]
- Mukarram, M.; Khan, M.M.A.; Choudhary, S.; Zehra, A.; Naeem, M.; Aftab, T. Natural Polysaccharides: Novel Plant Growth Regulators. In Plant Growth Regulators; Springer International Publishing: Cham, Switzerland, 2021; pp. 335–354. [Google Scholar]


| Group | Stem Length [cm] | Root Length [cm] | Root Area [cm2] | Root Volume [mm3] |
|---|---|---|---|---|
| CH20 | 2.81 ± 0.47 abcdefghij | 48.51 ± 16.20 abcd | 6.48 ± 2.31 | 69.96 ± 28.35 abcd |
| CH50 | 3.90 ± 0.70 aklmn | 53.58 ± 18.49 efghijk | 8.17 ± 2.61 abcde | 99.80 ± 31.76 e |
| CH100 | 4.55 ± 0.75 bopqrs | 36.63 ± 12.04 elmno | 7.14 ± 1.97 fg | 112.16 ± 29.40 afg |
| CH150 | 4.68 ± 1.50 ctuvw | 22.30 ± 5.74 aflpqrstu | 4.91 ± 1.43 afhijk | 88.92 ± 35.59 |
| CH200 | 4.63 ± 1.28 dxyzAB | 19.47 ± 6.13 bgmvwxyzA | 4.57 ± 1.27 bglmnop | 87.24 ± 28.45 h |
| AH20 | 3.96 ± 0.64 eCDEF | 44.98 ± 17.60 pvBC | 7.92 ± 2.76 hlqrs | 114.33 ± 46.21 bij |
| AH50 | 4.61 ± 1.07 fGHIJ | 47.17 ± 18.74 qwDE | 8.09 ± 2.80 imtuv | 112.14 ± 36.80 ckl |
| AH100 | 6.09 ± 0.88 gkotxCGKLMN | 38.92 ± 12.08 hrxFG | 7.61 ± 2.34 jnwxy | 120.21 ± 42.81 dhmno |
| AH150 | 5.55 ± 1.47 hlpyDOPQ | 26.53 ± 12.00 ciBDHI | 5.38 ± 2.12 cqtwz | 90.79 ± 38.96 |
| AH200 | 5.08 ± 1.30 imEKRST | 23.75 ± 10.38 djnCEFJKL | 5.19 ± 1.77 druxA | 93.00 ± 29.76 p |
| A | 3.52 ± 0.56 jquzHLORU | 44.60 ± 11.44 syHJ | 6.56 ± 1.70 o | 78.46 ± 26.07 fikm |
| C | 3.36 ± 0.45 rvAIMPSV | 54.30 ± 14.29 otzGIKM | 7.68 ± 2.13 kpzAB | 86.96 ± 27.06 n |
| Control | 2.13 ± 0.31 nswBFJNQTUV | 37.26 ± 10.38 kuALM | 5.38 ± 1.56 esvyB | 62.04 ± 19.99 egjlop |
Disclaimer/Publisher’s Note: The statements, opinions and data contained in all publications are solely those of the individual author(s) and contributor(s) and not of MDPI and/or the editor(s). MDPI and/or the editor(s) disclaim responsibility for any injury to people or property resulting from any ideas, methods, instructions or products referred to in the content. |
© 2025 by the authors. Licensee MDPI, Basel, Switzerland. This article is an open access article distributed under the terms and conditions of the Creative Commons Attribution (CC BY) license (https://creativecommons.org/licenses/by/4.0/).
Share and Cite
Szopa, D.; Pstrowska, K.; Witek-Krowiak, A. Chitosan-Coated Alginate Matrices with Protein-Based Biostimulants: A Controlled-Release System for Sustainable Agriculture. Materials 2025, 18, 591. https://doi.org/10.3390/ma18030591
Szopa D, Pstrowska K, Witek-Krowiak A. Chitosan-Coated Alginate Matrices with Protein-Based Biostimulants: A Controlled-Release System for Sustainable Agriculture. Materials. 2025; 18(3):591. https://doi.org/10.3390/ma18030591
Chicago/Turabian StyleSzopa, Daniel, Katarzyna Pstrowska, and Anna Witek-Krowiak. 2025. "Chitosan-Coated Alginate Matrices with Protein-Based Biostimulants: A Controlled-Release System for Sustainable Agriculture" Materials 18, no. 3: 591. https://doi.org/10.3390/ma18030591
APA StyleSzopa, D., Pstrowska, K., & Witek-Krowiak, A. (2025). Chitosan-Coated Alginate Matrices with Protein-Based Biostimulants: A Controlled-Release System for Sustainable Agriculture. Materials, 18(3), 591. https://doi.org/10.3390/ma18030591