Abstract
With the rapid development of communication technologies such as 5G, yttrium iron garnet (YIG) has been widely applied in microwave devices and other systems owing to its low ferromagnetic resonance linewidth. Loss reduction and effects of doping on performance have been important research areas for garnet ferrite. This study prepared Ca2+, In3+, and Sn4+ codoped YIG ferrite samples with the chemical formula Y3−xCaxFe5−x−yInySnxO12 (x = 0.05–0.3) (y = 0.2, 0.45) via solid-state reaction. The analyses of the crystal structure, micromorphology, and magnetic properties enabled the identification of the causes of variations in parameters, such as saturation magnetization and coercivity. Theoretical calculations of the anisotropy constants clarified the patterns upon substituting Fe3+ with In3+ and Sn4+, revealing a shift in the positions of Fe3+ substitution. Finally, the primary factors influencing loss were identified, and the key process parameters influencing performance were determined. The resulting polycrystalline garnet ferrite exhibited an extremely low ferromagnetic resonance linewidth parameter (ΔH = 29 Oe) and a high density (>5.2 g/cm3). This study provides specific guidance on process parameters and element selection for high-performance, low-loss YIG materials, as well as a detailed theoretical explanation of the performance changes resulting from co-doping YIG with In3+ and Sn4+.
1. Introduction
Yttrium iron garnet (Y3Fe5O12, YIG) has a small anisotropy constant and narrow ferromagnetic resonance linewidth, and electromagnetic waves can be transmitted and controlled with low loss in this material [1]. Therefore, it is widely used in devices for transmitting, receiving, and filtering microwave signals. The market for YIG-based devices is large, and includes wireless base stations, the automotive industry, aerospace, and other fields [2,3]. YIG has a body-centered cubic space group, Ia3d, featuring three types of cation sites: dodecahedral (c sites), tetrahedral (d sites), and octahedral (a sites). Each cell contains 24 c, 24 d, and 16 a sites for a total of 64 interstitial positions occupied by metal ions [4]. In yttrium–iron garnet (YIG) crystals, Y3+ and Fe3+ ions occupy the c- and d-sites, respectively, while the ratio of the Fe3+ at the d-sites to that at the a-sites is 3:2. Notably, the magnetic moment of YIG stems from the antiparallel arrangement of Fe3+ ions at the a- and d-sites [5].
Dastjerdi et al. studied the lattice distortion caused by the co-replacement of Ce, La, and Pr (rare earth) ions in YIG and the effect of these substitutions on the superexchange interaction of Fe3+ ions in the tetrahedral (d) and octahedral (a) positions [6]. Niyifar et al. synthesized a Y3InxFe5−xO12 ferrite material via a solid-phase method and found that In3+ addition caused the lattice constant to increase, and the saturation magnetization first decreased and then increased with increasing In3+ content [7]. Bouziane et al. found that when Cr3+ and Al3+ are co-doped in YIG, the preferential tendency of the ion substitution sites remains essentially the same as when YIG is doped with either Cr3+ or Al3+ alone [8]. Yang et al. found that Ca2+ and Sn4+ increased the saturation magnetization of the sample. A Ca2+ and Sn4+ substitution amount of 0.3 resulted in high performance: Ms = 2073 Gs and ΔH = 42 Oe [9]. Cao et al. synthesized Y3ZnxZrxFe5−2xO12 and reported that replacing Fe3+ with Zr4+ at the octahedral a-sites reduced the magnetic permeability, magnetic loss, and saturation magnetization of the material [10]. The introduction of In3+ into YIG can reduce its anisotropy constant [7,11], while the simultaneous introduction of In3+ and Sn4+ can change its magnetic properties [12]. Notwithstanding these studies, research on the magnetic properties of In3+ and Sn4+ ions co-substituting for Y3+ in YIG, and on the ferromagnetic resonance linewidth theory, remains incomplete. There is still room to improve YIG performance (loss reduction) through these elements. Furthermore, process improvements for YIG and reductions in sintering costs can be realized through optimizing the chemical composition of the material.
Achieving a small/narrow ferromagnetic resonance linewidth (ΔH) in garnet ferrites is crucial for communication equipment. In this study, we present an optimized synthesis route for a novel garnet, Y3−xCaxFe5−x−yInySnxO12. This material exhibits very low ferromagnetic resonance loss and high density, achieved with reduced sintering temperatures and low production complexity. This material offers a promising pathway for advancing research on garnet ferrites. Detailed theoretical calculations explain the saturation magnetization and anisotropy constant and identify the primary factors influencing the loss. Several complementary experimental methods were employed to comprehensively analyze the variations and trends in the Ca–In–Sn ternary ion occupancy. The proposed research approach demonstrates considerable advantages, particularly the comprehensive theoretical treatment of microwave loss mechanisms, which is more extensive than previous studies. This paper not only proposes a solution for low-loss YIG but also provides a comprehensive performance-optimization strategy, enabling improved performance of this material.
2. Materials and Methods
2.1. Sample Preparation
In this study, we used Y2O3 (99.9% purity), Fe2O3 (99.9% purity), CaCO3 (99.9% purity), In2O3 (99.99% purity), and SnO2 (99.9% purity) as the raw oxide materials. All raw materials were purchased from Macklin, Shanghai, China. Each raw material was weighed according to its chemical formula mass ratio. The amount of Fe2O3 was reduced by 1% of its calculated mass to compensate for the additional Fe produced by steel balls and steel cans during ball milling [13]. The raw materials were mixed in the following proportions: Mmaterial:Mball:Mwater = 1:4.2:1.4; they were ground by a planetary ball mill at 230 rpm for 6 h. After ball milling, the mixture was dried at 90 °C to form a presintering mixture powder. To this powder, 0.1 wt.% of Bi2O3 was added as a melting agent. The powder was then presintered at 1100 °C in air for 2 h at a temperature ramp rate of 5 °C/min, and the ball milling steps were repeated. The final slurry was dried at 90 °C, and 8% polyvinyl alcohol was added as a binder for the subsequent pressing and mixing steps. The final powder was sieved through a 60-mesh sieve three times to obtain granulated powder, and the mixture was then pressed to form a fixed-size primary embryo block. The block was placed in a muffle furnace and heated from room temperature to 900 °C at 5 °C/min. After holding at 900 °C for 30 min, the temperature was increased to 1400 °C at 2 °C/min and sintered at 1400 °C in air for 8 h. The prepared sample was a small black cylinder weighing approximately 10 g.
2.2. Sample Characterization
A density calculator (MDJ-300 A, Xiongfa, Shenzhen, China) was used to calculate the true density of the sample. The data were read by placing the sample block on a weighing table and a suspension table in water. The sample was crushed within an agate container, and small particles with a mass of ≤20 mg were selected. The surface was cleaned and gold-sprayed, and the sample morphology was observed by scanning electron microscopy (SEM, Regulus 8230, Hitachi, Tokyo, Japan) at 2000×. The crystal structure of the sintered sample was determined by X-ray diffractometry (SmartLab 9 KW, Rikagaku, Tokyo, Japan) at a scanning speed of 5°/min and scanning angle of 20–70°. Small particles with a mass of ≤20 mg were selected, and the M-H hysteresis line of the sample was measured at 26 °C using a Magnetic Properties Measurement System (MPMS3, Quantum Design, San Diego, CA, USA). The sample was polished into smooth beads with a diameter of ~1 mm, and the ferromagnetic resonance linewidth of the sample at 9.37 GHz was measured using a micro-ferromagnetic resonance system (DH811B, Beijing, China, DaHua Radio Instrument) [14].
3. Results and Discussion
3.1. Phase Analysis
Figure 1 shows the XRD patterns of Y3−xCaxFe5−x−yInySnxO12. The x range (for Ca2+ and Sn4+) is 0.05–0.3, whereas the y values (for In3+) are 0.2 and 0.45. In all samples, only a single YIG phase was formed, consistent with PDF#71-2150. Upon varying the doping concentrations of Ca2+ and Sn4+ from x = 0.05 to 0.3 and maintaining a fixed In3+ doping ratio at y = 0.45, the main diffraction peak (420) in the obtained pattern shifts from 32.18° to 32.10°. Conversely, upon changing the In3+ doping ratio from 0.2 to 0.45 and maintaining a fixed Ca2+ and Sn4+ doping ratio of 0.2, the main diffraction peak (420) in the obtained pattern shifts from 32.22° to 32.12°. The raw XRD profiles were fitted using Jade 6.5 to determine the lattice constants (Figure 1) [15,16].
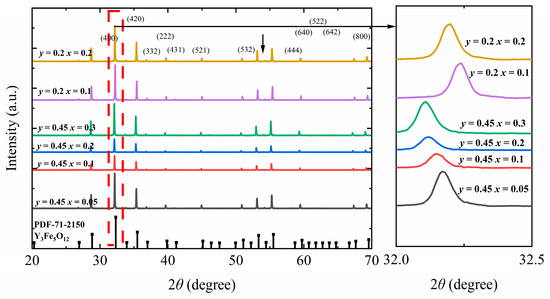
Figure 1.
XRD pattern of Y3−xCaxFe5−x−yInySnxO12 ferrite.
Figure 2 shows that the lattice constants of the samples gradually increased with increasing In3+ and Ca2+–Sn4+ contents [7,9,12]. The ionic radii of the introduced Ca2+ (1.120 Å), In3+ (0.790 Å), and Sn4+ (0.690 Å) ions were larger than those of Fe3+ (0.645 Å) and Y3+ (1.015 Å), leading to an increase in the overall size and deformation of the lattice. In addition, the introduction of In3+ ions significantly affects the lattice constant [17], consistent with the trend of lattice constants obtained upon pure-phase doping.
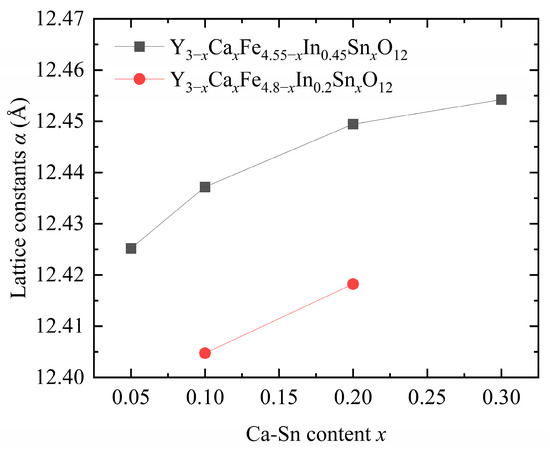
Figure 2.
Lattice constants of Y3−xCaxFe5−x−yInySnxO12.
3.2. Microstructure and Density
Figure 3 shows the grain morphologies of the samples observed through SEM. D80 denotes the average of most grain sizes, reflecting material uniformity, whereas D100 corresponds to the largest grain size observed, allowing the identification of abnormally large grains. Our samples showed large grain sizes with extremely thin grain boundaries; therefore, grain distribution is not clearly visible under an electron microscope. This result suggests that the samples have extremely high densities, which are conducive to various applications. Y2.9Ca0.1Fe4.45In0.45Sn0.1O12 and Y2.8Ca0.2Fe4.35In0.45Sn0.2O12 exhibited the smallest pores and grain sizes, indicating that highly compact samples can be obtained under the sintering conditions employed in this study. Although all samples were sintered at 1400 °C, their optimal sintering temperatures were inversely proportional to the doping concentration; that is, as the doping concentration increased, the optimal sintering temperature decreased. The sintering temperature reportedly significantly affects crystal size and homogeneity [18].
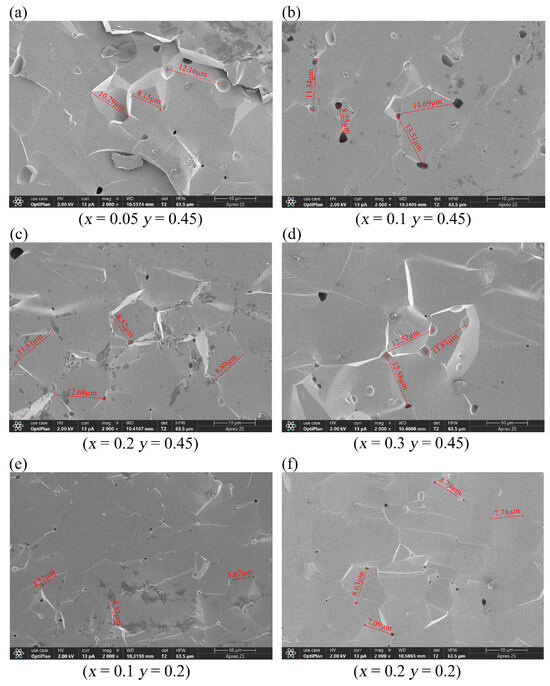
Figure 3.
SEM images of (a–d) Y3−xCaxFe4.55−xIn0.45SnxO12 (x = 0.05–0.3) and (e,f) Y3−xCaxFe4.8−xIn0.2SnxO12 (x = 0.1, 0.2).
The theoretical density is calculated using Equation (1) [19]:
where = 6.02 × 10²³ is Avogadro’s constant, a is the lattice constant obtained from XRD data (specific data are presented in Table 1 and Table 2), Z is the number of ions per unit cell, the number of YIG molecules is fixed at eight, and is the molecular weight of the samples determined from their individual chemical compositions (formulas). The actual densities of the samples were measured using a density-testing apparatus. Equation (2) is used to calculate the porosity of the samples [9]:
where and denote the apparent and theoretical densities, respectively.

Table 1.
Density, lattice constant (a), porosity (P), and grain size of Y3−xCaxFe4.55−xIn0.45SnxO12.
Table 2.
Density, lattice constant (a), porosity (P), and grain size of Y3−xCaxFe4.8−xIn0.2SnxO12.
The Ca2+, In3+, and Sn4+ ions introduced into YIG increase its lattice constant and molecular weight [7,9]. At a sintering temperature of 1400 °C, the actual density of Y3−xCaxFe4.55−xIn0.45SnxO12 is >5.2 g/cm3, which indicates that regulating the concentration of doped In3+ is conducive to synthesizing high-density garnet ferrites with large lattice constants [7,12].
In the case of the Y3−xCaxFe4.55−xIn0.45SnxO12 (x = 0.1) sample, the porosity was minimized because the sample was sintered at a uniform temperature, and when x = 0.1 and x = 0.2, the optimal sintering temperature of the corresponding sample was ~1400 °C. An excessively low sintering temperature leads to an incomplete reaction, and unreacted oxides and intermediate perovskite products remain in the sample. In contrast, sintering at an extremely high temperature leads to excessive grain growth and shrinkage, and the porosity increases rather than decreases, which is unfavorable for improving the properties of ferrites [12]. Therefore, although the Ca2+–Sn4+ doping of YIG lowers the sintering temperature and increases its compactness, the porosity does not always decrease. The actual densities of Y3−xCaxFe4.55−xIn0.45SnxO12 and Y3−xCaxFe4.8−xIn0.2SnxO12 were limited by the effects of sintering and the number of ions introduced. In addition, while In3+ doping increases the theoretical and actual densities [7], the actual density does not increase linearly with the theoretical density. These observations indicate that the porosity of the samples is collectively influenced by the parameters used in the ferrite preparation.
3.3. Magnetic Properties
Figure 4 shows the hysteresis curve of Y3−xCaxFe5−x−yInySnxO12. The M-H hysteresis line of the sample was measured at 26 °C. As a soft magnetic material, the garnet ferrite exhibits a fast magnetization response and an overall narrow hysteresis curve. Once the curve stabilizes, the saturation magnetization () decreases as x increases.
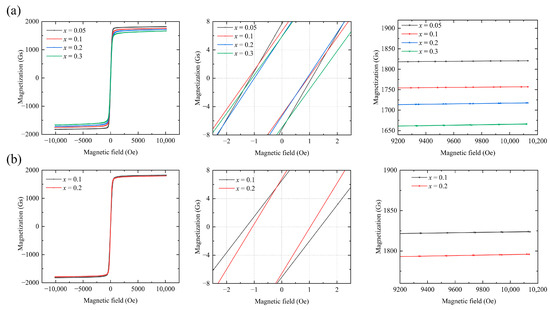
Figure 4.
Hysteresis curves of (a) Y3−xCaxFe4.55−xIn0.45SnxO12 and (b) Y3−xCaxFe4.8−xIn0.2SnxO12.
At 26 °C (where the saturation value of the theoretical magnetization strength of the soft magnetic material cannot be achieved by merely increasing the magnetic field strength H), the actual saturation magnetization is estimated from the M–H curve of the material. When the applied magnetic field H is relatively large, the magnetization strength tends to saturate. In this state, the polycrystalline magnetization curve can be described by the law of approach to saturation [12,20]:
where a is the magnetic hardness coefficient, b is the constant related to the rotation process of the magnetization vector, Ms is the saturation magnetization, is the paramagnetization rate, and is the effect of the paramagnetization process on the magnetization under extremely strong magnetic fields and therefore can be neglected. Equation (3) can be simplified as
The actual saturation magnetization is calculated from data in the strong-magnetic-field region of the M–H curve. H−2 in Equation (4) is small and can be neglected. Within the range of strong magnetic fields, M approaches Ms; thus, we obtain the following [20]:
We plotted M on the horizontal axis and on the vertical axis. Data points where M exceeds 1700 Gs (the strong-magnetic-field region) were fitted to a straight line (Equation (5)). This allowed us to directly obtain the slope and data from this line. Finally, by calculating the intersection point of this curve with the horizontal axis, we derived the theoretical saturation magnetization of the sample [20]. The fitting results are presented in Table 3 and Figure 5.
Table 3.
fitted data for Y3−xCaxFe5−x−yInySnxO12: Slope , Constant , Fitting Error Summary.
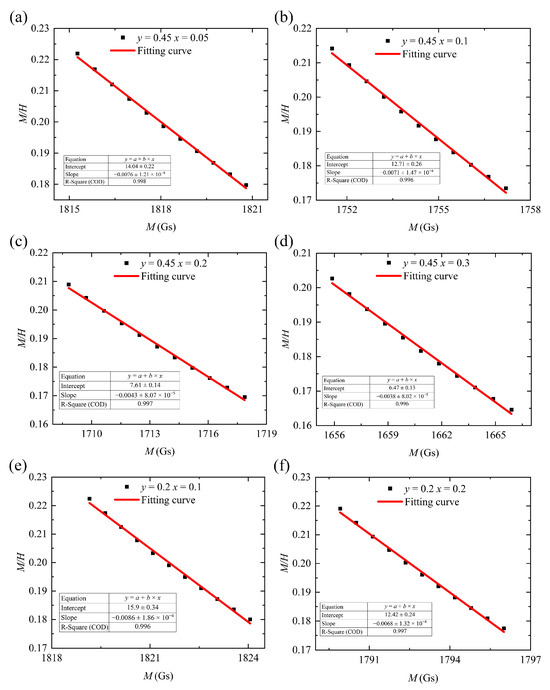
Figure 5.
M/H and M fitting curves for (a–d) Y3−xCaxFe4.55−xIn0.45SnxO12 and (e,f) Y3−xCaxFe4.8−xIn0.2SnxO12.
The saturation magnetization and coercive force are presented in Figure 6 and Table 4 and Table 5, respectively.
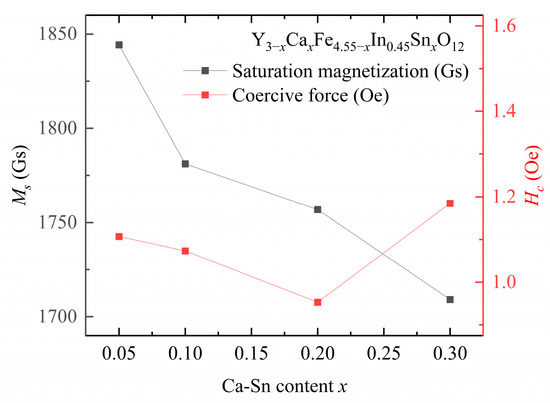
Figure 6.
Saturation magnetization () and coercive force () of Y3−xCaxFe4.55−xIn0.45SnxO12.
Table 4.
Saturation magnetization () and coercive force () of Y2.9Ca0.1Fe4.9−yInySn0.1O12 with different doped In3+ amounts (y).
Table 5.
Saturation magnetization () and coercive force () of Y2.8Ca0.2Fe4.8−yInySn0.2O12 with different doped In3+ amounts (y).
At a fixed In3+ doping concentration, the coercive force of the samples first decreases and then increases with increasing Sn4+ content. The lowest coercive force of the sample, i.e., = 0.95 Oe, is observed at y = 0.45, x = 0.2. The coercive force shown by the Ca–In–Sn YIG samples is lower than that of other ion-substituted YIG samples [7,15]. Moreover, the coercive force is positively correlated with grain size, and the correlation between coercivity and grain size reported in the present study is consistent with that in a previous study [12].
The magnetocrystalline anisotropy energy predominantly hinders magnetic moment rotation. The stress impediment model states that the decrease in coercive force is associated with the decrease in anisotropy due to the introduction of In3+ and Sn4+ [21]. Owing to the density reduction caused by the mismatch in the sintering temperature, the coercivity of the sample increased at x = 3 instead of decreasing; this trend was verified by the determined anisotropy constant. The coercive force is influenced by the magnetic anisotropy, saturation magnetization, impurity concentrations, porosity, stress, and other defects of the material, which depend on the synthesis conditions of the material [22].
The saturation magnetization values of the samples decreased with increasing In3+ and Sn4+ contents. Previous studies have indicated that as the In3+ content of a sample increases, the saturation magnetization increases at low temperatures, whereas it decreases at room temperature [11]. This phenomenon explains the results obtained in our study: increasing the In3+ dopant content from y = 0.2 to y = 0.45 at a fixed Ca2+–Sn4+ content reduces the saturation magnetization at room temperature.
The saturation magnetization of YIG mainly stems from the exchange of a–d sites [11,23,24]. The directions of the magnetic moments of the 16a and 24d ions were opposite, whereas those of the magnetic moments of the 24c and 24d ions were identical. The magnetization intensity is calculated as the difference in magnetic moment generated by the amount of Fe3+ remaining at the a and d sites in the crystal after the introduction of α and β amounts of nonmagnetic ions, respectively, as shown in Equation (6):
The substituted In3+ and Sn4+ ions preferentially occupy the octahedral sites (a site); consequently, the concentration of Fe3+ in these octahedral sites decreases, while the total net magnetic moment increases. This result is consistent with the observed increase in saturation magnetization upon In3+ and Sn4+ doping [7,25]. Upon further increasing the In3+ and Sn4+ contents, the saturation magnetization of the samples first increases and then decreases [10,12].
These results are obtained primarily because, as the concentration of substituted ions increases, these ions, which initially only substitute the Fe3+ ions at the octahedral a-site, gradually substitute those at both the octahedral a- and tetrahedral d-sites. Subsequently, once the introduced amounts of Sn4+ and In3+ exceed a certain threshold, these ions will tend to enter the tetrahedral d sites [12]. According to Equation (6), this phenomenon reduces the saturation magnetization. The inflection point of this change in ion-substitution behavior occurs at x ≈ 0.3 [12], indicating that the decrease in the saturation magnetization of the sample is reasonable after the total substituted amounts of In3+ and Sn4+ exceed 0.3. This substitution behavior of the codoped In3+ and Sn4+ ions is consistent with the substitution rule applicable to both ions. [8]. Consequently, as shown in Figure 6, the saturation magnetization value decreases with increasing In3+ and Ca2+–Sn4+ contents.
3.4. Anisotropy Constant
In this study, we observed that when polycrystalline magnetic materials approach saturation during magnetization under strong external magnetic fields, domain wall motion ceases, and magnetic moment rotation dominates the magnetization process [12]. Upon further increasing the external field strength, wide-range magnetocrystalline anisotropy occurs, and with a subsequent increase in the field strength, the effect of defects on rotation diminishes, and eventually, the paramagnetization state dominates at excessively high external magnetic field intensities. The empirical equation, shown as Equation (3), reflecting the near-saturation stage of magnetization, can be solved by differentiation using the Origin software (Version Number: Originpro 2024 10.1.0.178) [12,20]:
where is the paramagnetization rate. The data required for the calculation of the anisotropy constant corresponds to magnetic field intensity H of at least 1000 Oe. Under these conditions, H is sufficiently low such that in the fitting equation 2b >> aH, and Equation (7) simplifies to
The functional relationship between differential susceptibility and is approximately a straight line near the origin. Applying in Equation (8) for curve fitting yields 2bMs as the slope of the fitted straight line, with b reflecting the inhibiting effect of magnetocrystalline anisotropy on domain-reversal magnetization under a strong magnetic field. Equation (9) demonstrates the relationship between the coefficient b and the magnetocrystalline anisotropy constant :
where μ0 is a constant term called the vacuum permeability, and its value is 4π × 10−7. The overall fitted curve shown in Figure 7 indicates that within the applied outer field range from 1500 Oe to the maximum value (6000 Oe), the fitted curve well approximates the trend of the measured values, with <3% error. To ensure the reliability of the fitted data, all samples were selected based on the same H values. We have included the H ranges corresponding to the data points in the fitted curve in Figure 7 for reference. When calculating using Equations (8) and (9), the units of M and H are converted to CGS units of Gs and Oe; the coefficient b, obtained from the fitted slope, has units of Oe3/Gs; and the unit of the anisotropy constant is kJ/m3.
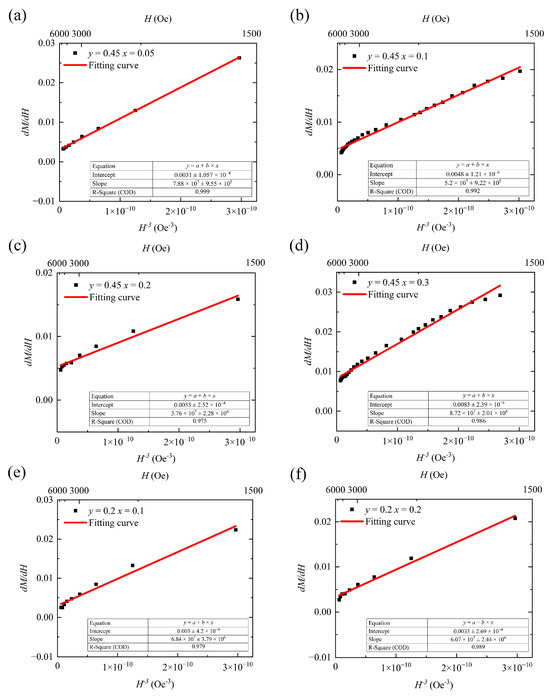
Figure 7.
dM/dH and H−3 fitting curves for (a–d) Y3−xCaxFe4.55−xIn0.45SnxO12 and (e,f) Y3−xCaxFe4.8−xIn0.2SnxO12.
Figure 8 displays the calculated anisotropy constants. As shown in Figure 6 above, as the x increases, Hc first decreases and then increases. This trend is consistent with the calculated anisotropy constant. We observed that the anisotropy constant of our samples decreased significantly with increasing In3+ content, indicating a strong effect of In3+ substitution on the anisotropy constant.
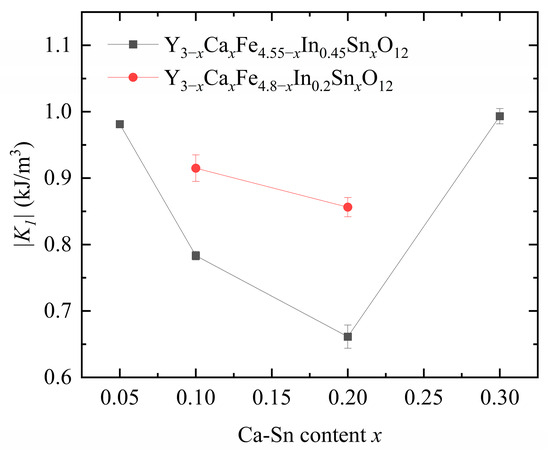
Figure 8.
Anisotropy constants of Y3−xCaxFe4.55−xIn0.45SnxO12 and Y3−xCaxFe4.8−xIn0.2SnxO12.
Upon increasing the Ca2+–Sn4+ doping concentration at a fixed In3+ content, the anisotropy constant first decreased and then increased owing to the change in the position of Fe3+ in YIG caused by the substituted Sn4+ and In3+ ions. The nonmagnetic Sn4+ and In3+ ions preferentially enter the a-sites in YIG when their concentration is low and begin entering the d-sites as their concentration increases.
Because of the a–d coupling effect, the substitution of Sn4+ ions at the a-sites reduces the anisotropy constant, whereas their substitution at the d-sites increases it [21]. The introduction of In3+ decreases the anisotropy constant of magnetocrystalline materials [12]. The total dopant amounts of In3+ and Sn4+ in each of the six samples exceed the turning point of In3+ and Sn4+ ion substitution from position a to position d (the total amount of the substituted ions is >0.3). The Sn4+ ionic radius is larger than that of In3+, indicating that Sn4+ substitution is favored over that of In3+ at the tetrahedral d sites.
Therefore, when the In3+ content is controlled at 0.2 and 0.45, the introduced Sn4+ ions are more likely to occupy the d-sites, and In is partially substituted at the a- and d-sites; this phenomenon eventually leads to an increase in the anisotropy constant. Therefore, when the amounts of Sn4+ and In3+ substituted in YIG are low, the substitution rules of these ions for YIG are similar. However, as the substitution amount increases, the rules governing Sn4+ and In3+ substitution in YIG differ, and the substitution amounts and trends of these ions show an interdependence [6].
3.5. Ferromagnetic Resonance Linewidth (FMR)
Because the samples prepared and investigated in this study are polycrystalline, other factors that influence single-crystal properties were also analyzed. An analysis of the ferromagnetic relaxation process revealed that the stray field around the pores and anisotropic fluctuations caused by disordered crystal orientations primarily cause the inhomogeneity of the two-magnon scattering field [26,27,28]. The ferromagnetic resonance linewidth of the polycrystalline garnet ferrite is equivalent to the sum of the following linewidth effects:
where is the garnet ferrite single-crystal linewidth; its value is 1 Oe, which only negligibly influences the properties of the garnet ferrite. Because our sample was not doped with rare-earth ions (characterized by strong spin–lattice coupling effects), was negligible in this study. In addition, to reduce the measurement error in , which is affected by the roughness of the polycrystalline surface, the tested samples were subjected to a surface polishing treatment. Prior to measuring the experimental linewidth of the sample, its surface was smoothed and polished via machining; thus, was negligible in our case. Therefore, for our samples, Equation (10) can be simplified to
reflects the effect of the ferromagnetic resonance linewidth caused by the pores in the polycrystalline garnet ferrite. Under an applied magnetic field, the pores inside the sample and nonmagnetic alternative phase surfaces can appear as magnetic charges generating a localized demagnetization field, which increases [29,30]. To calculate the magnetization rate of the direct-current component of the additional field arising from nonmagnetic impurities and free magnetic poles on the surface of the pores, all pores in the sample were equated to a spherical pore located at the center of the pore surface. We averaged the weights of the magnetization rates to account for the fluctuations in the demagnetizing field around the pores or other nonmagnetic alternative phases, which are the sources of coupling between the coherent feed and spin wave. This approach was used to derive the pore-induced broadening equation (CGS system) [12]:
originates from fluctuations in the anisotropic field (), arising from the random distribution of magnetocrystalline anisotropy fields among individual grains. Magnetic crystal anisotropy induces direction-dependent equivalent fields along different crystal axes, causing anisotropic dissipation of magnetic moment precession energy. This broadens the resonance peak, with specifically reflecting this phenomenon [12,31,32]. When the angular frequency of the applied external magnetic field is the same as the frequency of the electron precession in the sample, the resonant magnetic field exhibits dispersion. The degree of broadening is directly correlated with the anisotropic magnetocrystalline field. Moreover, a magnetic coupling interaction occurs between the grains, and the magnetic distances are parallel, that is, synchronous precession occurs in this system. This effect becomes noticeable at , which indicates the narrowing of due to the magnetic coupling interaction. At this , is expressed as
where is a factor related to the frequency of the external field, and at a frequency of 9.25 GHz, G ≈ 1. The actual ferromagnetic resonance linewidth () of the samples was measured using a microwave ferromagnetic resonance system. The derived and values are used to calculate the ferromagnetic resonance linewidth () of the samples, and the results are compared with
(Figure 9; Table 6 and Table 7).
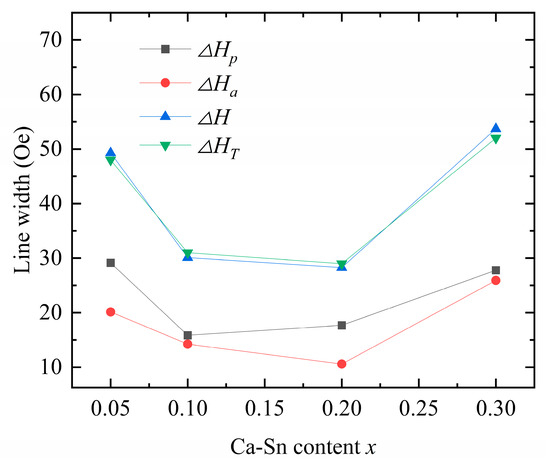
Figure 9.
Calculated ,, and values and test results of for Y3−xCaxFe4.55−xIn0.45SnxO12.
Table 6.
Calculated () and measured () linewidths of Y2.9Ca0.1Fe4.9−yInySn0.1O12 with different In3+ doping amounts (y).
Table 7.
Calculated () and measured () linewidths of Y2.8Ca0.2Fe4.8−yInySn0.2O12 with different In3+ doping amounts (y).
The theoretically calculated values are consistent with the experimental data, underscoring the dual effects of the anisotropic and porosity linewidths as the origin of the ferromagnetic resonance linewidth caused by the Ca–In–Sn doping. Upon increasing the concentration of Sn4+ while maintaining a fixed In3+ doping concentration, both and first decreased and then increased. Because porosity is affected by variations in grain size and sintering temperature [18], we can conclude that both excessive and insufficient sintering increase the porosity.
According to Equation (13), the anisotropic linewidth is a function of the anisotropy constant and saturation magnetization; that is, it is proportional to the anisotropy constant and inversely proportional to the saturation magnetization. Our results show that both In3+ and Sn4+ reduce the ferromagnetic resonance linewidth [33], whereas the introduction of In3+ drastically reduces the anisotropy constant. However, when the saturation magnetization of the samples decreased, the observed decreasing trend in the ferromagnetic resonance linewidth was disrupted. In the case of Ca2+–Sn4+ substitution (x = 0.3), the anisotropy of the samples initially increased, leading to an increase in the anisotropic linewidth. Y2.8Ca0.2Fe4.35In0.45Sn0.2O12 exhibits the smallest measured ferromagnetic resonance linewidth of = 29 Oe, showing the potential for application in various fields.
Figure 10 shows the measured ferromagnetic resonance linewidths of the Y3−xCaxFe5−x−yInySnxO12 samples sintered at different temperatures. With increasing concentrations of Ca2+, In3+, and Sn4+ dopants, the temperature corresponding to the smallest ferromagnetic resonance linewidth of each sample tends to decrease. This observation indirectly indicates that the introduction of Ca–In–Sn results in a decrease in the required sintering temperature. Upon lowering the sintering temperature to 1360–1380 °C, the ferromagnetic resonance linewidths of the two groups of the samples doped with Ca2+–Sn4+ (x = 0.2 and 0.3) decrease further, while the samples become more compact. These results demonstrate that the observed changes in the ferromagnetic resonance linewidth of the YIG samples with the sintering temperature stem from the porosity linewidth.
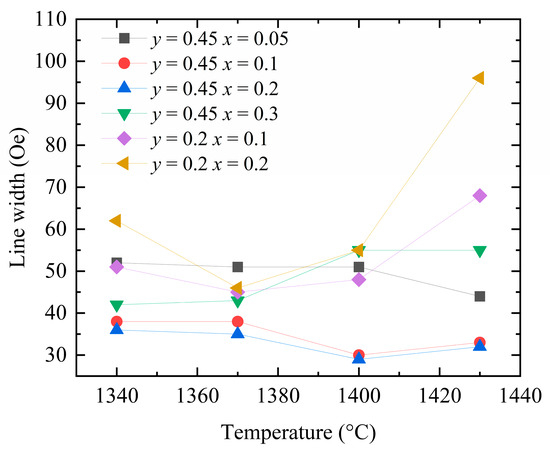
Figure 10.
Ferromagnetic resonance linewidth of Y3−xCaxFe5−x−yInySnxO12 at different preparation temperatures.
4. Conclusions
In this study, we successfully synthesized YIG ferrites doped with Ca2+, In3+, and Sn4+ using a solid-phase reaction method and investigated the magnetic properties of the ferromagnetic resonance linewidth of Y3−xCaxFe5−x−yInySnxO12 and the mechanism underlying the linewidth variations. The substitution of In3+ and Sn4+ usually occurred at the octahedral a-sites; however, when the ionic codopant concentration was >0.3, the saturation magnetization reduced, suggesting a shift in the tendency of In3+ and Sn4+ to substitute Fe3+. The measured and values confirmed that substituting appropriate amounts of In3+ and Sn4+ significantly reduced the anisotropy constant. We analyzed various factors that could affect the ferromagnetic resonance linewidth and performed theoretical calculations to determine the mechanism underlying the linewidth variations shown by the samples. Evidently, the ferromagnetic resonance linewidth first decreased and then increased because of dual effects: negative correlation of the linewidth with the saturation magnetization and positive correlation of the same with the anisotropy constant. This result demonstrated that the sample synthesis process plays a crucial role in linewidth variation. Upon sintering at 1400 °C, Y2.8Ca0.2Fe4.35In0.45Sn0.2O12 exhibited the lowest coercive force ( = 0.95 Oe) and the smallest measured linewidth ( = 29 Oe). These results indicated that elements such as Ca, In, and Sn play a vital role in regulating the ferromagnetic resonance linewidth of YIG. This process minimizes resonance loss and enables efficient sample fabrication and sintering without significantly reducing the saturation magnetization intensity.
Author Contributions
Conceptualization, X.L. and S.F.; Methodology, Y.H. and S.F.; Validation, Y.H.; Formal analysis, S.F.; Investigation, Y.H.; Resources, X.L.; Writing—original draft preparation, Y.H.; Writing—review and editing, Y.H.; Supervision, X.L. All authors have read and agreed to the published version of the manuscript.
Funding
This work was supported by the National Key R&D Program of China (grant numbers 2022YFB3504800 and 2021YFB3502400), Key Research and Development Plan of Anhui Province (grant number 202304a05020036), and Education Department of Anhui Province (grant number 2022AH050081).
Institutional Review Board Statement
Not applicable.
Informed Consent Statement
Not applicable.
Data Availability Statement
The raw data supporting the conclusions of this article will be made available by the authors on request.
Acknowledgments
We appreciate the support of Li Zen at Anhui One Magnet Electronic Co., Ltd., Lujiang County Economic Development Zone, Hefei, Anhui Province, China.
Conflicts of Interest
The authors declare no conflicts of interest. The funders had no role in the design of the study; in the collection, analyses, or interpretation of data; in the writing of the manuscript; or in the decision to publish the results.
References
- Harris, V.G.; Geiler, A.; Chen, Y.; Yoon, S.D.; Wu, M.; Yang, A.; Chen, Z.; He, P.; Parimi, P.V.; Zuo, X.; et al. Recent advances in processing and applications of microwave ferrites. J. Magn. Magn. Mater. 2009, 321, 2035–2047. [Google Scholar] [CrossRef]
- Harris, V.G. Modern microwave ferrites. IEEE Trans. Magn. 2012, 48, 1075–1104. [Google Scholar] [CrossRef]
- Nazlan, R.; Hashim, M.; Ibrahim, I.R.; Idris, F.M.; Ismail, I.; Ab Rahman, W.N.W.; Abdullah, N.H.; Zulkimi, M.M.M.; Mustaffa, M.S. Indium-substitution and indium-less case effects on structural and magnetic properties of yttrium-iron garnet. J. Phys. Chem. Solids 2015, 85, 1–12. [Google Scholar] [CrossRef]
- Wickersheim, K.A.; Buchanan, R.A. Optical studies of exchange in substituted garnets. J. Appl. Phys. 1967, 38, 1048–1049. [Google Scholar] [CrossRef]
- Wan, D.F.; Ma, X.L. Magnetic Physics; University of Electronic Science and Technology Press: Beijing, China, 1994. [Google Scholar]
- Dastjerdi, O.D.; Shokrollahi, H.; Raad, N.A. Magnetic behavior and characterization of La, Pr, and Bi substituted yttrium iron garnet. Mater. Chem. Phys. 2021, 259, 124067. [Google Scholar] [CrossRef]
- Niyaifar, M.; Beitollahi, A.; Shiri, N.; Mozaffari, M.; Amighian, J. Effect of indium addition on the structure and magnetic properties of YIG. J. Magn. Magn. Mater. 2010, 322, 777–779. [Google Scholar] [CrossRef]
- Bouziane, K.; Yousif, A.; Widatallah, H.M.; Amighian, J. Site occupancy and magnetic study of Al3+ and Cr3+ co-substituted Y3Fe5O12. J. Magn. Magn. Mater. 2008, 320, 2330–2334. [Google Scholar] [CrossRef]
- Yang, Y.; Yu, Z.; Guo, Q.; Sun, K.; Guo, R.; Jiang, X.; Liu, Y.; Liu, H.; Wu, G.; Lan, Z. Thermomagnetization characteristics and ferromagnetic resonance line width broadening mechanism for Ca-Sn Co-substituted YIG ferrites. Ceram. Int. 2018, 44, 11718–11723. [Google Scholar] [CrossRef]
- Cao, H.; Zheng, H.; Fan, L.; Cheng, Z.; Zhou, J.; Wu, Q.; Zheng, P.; Zheng, L.; Zhang, Y. Structural, morphological, dielectric and magnetic properties of Zn-Zr co-doping yttrium iron garnet. Int. J. Applied. Ceram. Technol. 2020, 17, 813–822. [Google Scholar] [CrossRef]
- Huang, Y.J. Magnetic Material; Electronic Industry Press: Beijing, China, 1996. [Google Scholar]
- Han, Z.Q. Ferrite and Its Magnetic Physics; Aviation Industry Press: Beijing, China, 2010. [Google Scholar]
- Yi, P.H. Development of Low Loss YIG Material and Its Application in Circulator. Master’s Thesis, University of Electronic Science and Technology of China, Chengdu, China, 2021. [Google Scholar]
- Beijing Dahua Radio Instrument Factory. DH811 Microwave Ferromagnetic Resonance Experimental System Manual; Beijing Dahua Radio Instrument Factory: Beijing, China, 2013; pp. 10–14. [Google Scholar]
- Gao, F.; Li, J.; Su, H.; Sun, Y.; Yang, Y.; Wang, G.; Han, X.; Li, Q. Low dielectric loss and narrow FMR linewidth of Ca-Ge co-substituted YInIG ferrites for microwave device application. J. Alloys Compd. 2021, 885, 160965. [Google Scholar] [CrossRef]
- Strocka, B.; Holst, P.; Tolksdorf, W. An empirical formula for the calculation of lattice constants of oxide garnets based on substituted yttrium- and gadolinium-iron garnets. Philips J. Res. 1978, 33, 166–202. [Google Scholar]
- Sadhana, K.; Ramana Murthy, S.; Praveena, K. Structural and magnetic properties of Dy3+ doped Y3Fe5O12 for microwave devices. Mater. Sci. Semicond. Process. 2015, 34, 305–311. [Google Scholar] [CrossRef]
- Von Aulock, W.H. Handbook of Microwave Ferrite Materials; Academic Press: London, UK, 1965. [Google Scholar]
- Mao, T.C.; Chen, J.C. Influence of the addition of CeO2 on the microstructure and the magnetic properties of yttrium iron garnet ceramic. J. Magn. Magn. Mater. 2006, 302, 74–81. [Google Scholar] [CrossRef]
- Lu, Q.R.; Huang, J.W.; Feng, S.J. Application of approaching saturation law in the study of magnetic properties of nano-permanent magnetic materials. Coll. Phys. 2022, 41, 37–46. [Google Scholar]
- Pu, Z.Y. Preparation and Application of Garnet Ferrite for S/C Band Circulator. Master’s Thesis, University of Electronic Science and Technology, Chengdu, China, 2018. [Google Scholar]
- Yang, W.; Wang, L.; Ding, Y.; Zhang, Q. Narrowing of ferromagnetic resonance linewidth in calcium substituted YIG powders by Zr4+/Sn4+ substitution. J. Mater. Sci. Mater. Electron. 2014, 25, 4517–4523. [Google Scholar] [CrossRef]
- Sekijima, T.; Kishimoto, H.; Fujii, T.; Wakino, K.; Okada, M. Magnetic, optical and microwave properties of rare-earth-substituted fibrous yttrium iron garnet single crystals grown by floating zone method. Jpn. J. Appl. Phys. 1999, 38, 5874–5878. [Google Scholar] [CrossRef]
- Hench, L.L.; West, J.K. Principles of Electronic Ceramics; John Wiley & Sons: London, UK, 1989. [Google Scholar]
- Xu, Q.M.; Liu, W.B.; Hao, L.J.; Gao, C.J.; Lu, X.G.; Wang, Y.A.; Zhou, J.S. Effects of In-substitution on the microstructure and magnetic properties of Bi-CVG ferrite with low temperature sintering. J. Magn. Magn. Mater. 2010, 322, 2276–2280. [Google Scholar] [CrossRef]
- Dai, D.S. Magnetic Basis of Matter; Peking University Press: Beijing, China, 2016. [Google Scholar]
- Patton, C.E. Magnetic Oxides Part 2; John Wiley & Sons: London, UK, 1975. [Google Scholar]
- Kaelberer, R.E.; Patton, C.E. Temperature dependence of the effective linewidth in porous and fine grain polycrystalline yttrium iron garnet. IEEE Trans. Magn. 1977, 13, 1230–1232. [Google Scholar] [CrossRef]
- Llabrés, J.; Nicolas, J.; Sroussi, R. Effect of the vanadium substitution on the magnetic properties of cobalt doped yttrium-gadolinium iron garnets. Appl. Phys. 1977, 12, 87–91. [Google Scholar] [CrossRef]
- Wohlfarth, P.E. Ferromagnetic Materials; North-Holland: Amsterdam, The Netherlands, 1980. [Google Scholar]
- Schlömann, E. Spin-wave analysis of ferromagnetic resonance in polycrystalline ferrites. J. Phys. Chem. Solids 1958, 6, 242–256. [Google Scholar] [CrossRef]
- Van Hook, H.J.; Euler, F. Anisotropy linebroadening in polycrystalline V–In substituted YIG. J. Appl. Phys. 1969, 40, 4001–4005. [Google Scholar] [CrossRef]
- Patton, C.E. Effect of grain size on the microwave properties of polycrystalline yttrium iron garnet. J. Appl. Phys. 1970, 41, 1637–1641. [Google Scholar] [CrossRef]


Disclaimer/Publisher’s Note: The statements, opinions and data contained in all publications are solely those of the individual author(s) and contributor(s) and not of MDPI and/or the editor(s). MDPI and/or the editor(s) disclaim responsibility for any injury to people or property resulting from any ideas, methods, instructions or products referred to in the content. |
© 2025 by the authors. Licensee MDPI, Basel, Switzerland. This article is an open access article distributed under the terms and conditions of the Creative Commons Attribution (CC BY) license (https://creativecommons.org/licenses/by/4.0/).