Abstract
Modifying lubricants with hard material particles improves lubricant performance by allowing the particles to penetrate the contact area and separate the contacting surfaces. The use of solid particles as additives in fluid lubricants presents a promising avenue for providing effective lubrication under high loads in sheet metal forming. This article presents the results of friction tests using the bending under tension friction tribotester. Low-carbon DC01 steel sheets were used as the test material. The main goal of the study was to determine the effect of lubricant modification by adding MoS2 and SiO2 particles and the modification of 145Cr6 steel countersamples on the coefficient of friction (CoF), changes in friction-induced surface roughness and friction mechanisms. The surfaces of the countersamples were modified using electron beam melting and the ion implantation of lead (IPb). It was found that increasing the SiO2 and MoS2 content in DC01/145Cr6 and DC01/IPb contacts under base oil lubrication conditions resulted in a decrease in the CoF value. For the countersample subjected to electron beam melting, considering all friction conditions, the CoF decreased between 31.9% and 37.5%.
1. Introduction
1.1. Friction in Sheet Metal Forming
Friction is one of the main limitations of sheet metal forming processes [1,2]. Friction causes excessive tool wear [3,4] and deterioration of the surface quality of drawpieces [5]. For decades, oils derived from fossil fuels were traditionally used in sheet metal forming processes. However, in the last two decades, research has been undertaken on the use of natural lubricants [6,7,8]. Numerous tribological tests have been developed to determine the coefficient of friction (CoF) in sheet metal forming processes: strip drawing tests, drawbead simulator tests and bending under tension (BUT) friction tests [9]. The BUT test considered in this paper has been the subject of scientific research and industrial testing in recent years. Andreasen et al. [10] proposed BUT equipment for testing the influence of the sliding speed and normal pressure on the limits of lubrication in DIN 1.3344 PM/DIN 17441 steel contacts. Normal pressure was found to have a significant effect on the limits of lubrication. Wiklund et al. [11] evaluated an advanced friction model for BUT testing which takes into account the properties of the lubricant, material and surface topography of the sheet metal. It was concluded that when the strain rates are increased, mixed lubrication is observed. Folle and Schaeffer [12] proposed an equation for the calculation of the CoF from the BUT test based on the radius of the pin and pin torque. It was found that the CoF value remained similarly close for the various equations. Trzepieciński and Lemu [13] investigated the effect of the surface roughness of the countersamples and lubrication condition on the CoF in deep drawing quality (DDQ)/145Cr6 steel contacts. The effectiveness of the lubricant increased with increasing roughness of the countersamples. Oliveira et al. [14] investigated the effect of countersample’s surface and pin diameter on the CoF in En AW-1100 aluminium alloy/AISI 430 steel contacts. They found that CoF increased with a decrease in the pin radius.
1.2. Why Is It Good to Use Solid Lubricant Additives
Modifying lubricants with hard powder particles improves anti-friction and anti-wear properties through different mechanisms [15]. Hard and brittle particles offer enhanced performance through polishing and rolling effects, where the particles create a smoother surface and act as ball bearings between the moving parts [16]. Moreover, additional particles in oils provide high-load lubrication by forming protective tribofilms through its layered structure [17,18]. The most universal additives with a wide range of applications, include molybdenum disulphide (MoS2) and silicon dioxide (SiO2) [19,20,21]. The effect of several additive lubricants such as SiO2 and MoS2, on coefficient of friction has been widely researched [22,23]. Xie et al. [24] used SiO2 and MoS2 nanoparticles as lubricant additives for AZ31 magnesium alloy/steel contacts. It was found that the MoS2-modified lubricant showed better lubricating properties in terms of the lubrication film stability and the load carrying capacity. Xie et al. [25] investigated the synergistic effect of SiO2 and MoS2 nano-additives in EOT5# mineral oil. The high lubrication performance of the oil tested was explained by the micro-cooperation of different nanoparticles with disparate morphologies. Mosleh et al. [26] dispersed MoS2 in commercial sheet metal forming fluids and evaluated their lubrication performance in a 440C steel/titanium sliding pair by using laboratory tribotesting. Modified lubricant reduced wear by 55–65% compared to unmodified fluid. Trzepieciński et al. [27] analysed the effect of SiO2 additives in rapeseed oil and sunflower oil on friction in HCT600X + Z/145Cr6 steel contacts. It was found that the lubricant with 5 wt.% of SiO2 particles was more effective in reducing CoF than the vegetable oils with an additional 1 wt.% of SiO2. Pang et al. [28] investigated the lubrication properties of SiO2/vegetable oil lubricant for metal forming applications. The modified lubricant exhibited better tribological performance than of base oil.
1.3. Motivation and Structure of the Paper
Despite the many advantages of natural lubricants, the automotive industry, which is the largest beneficiary of sheet metal components, still uses traditional petroleum-based oils. Modifying these oils with hard material powders is believed to improve their lubrication performance. The use of hard material particles as additives in lubricants demonstrates the potential for providing effective lubrication under high loads in sheet metal forming. The main aim of this study was to determine the effect of lubricant modification (by adding MoS2 and SiO2 particles) and modifying the surface of countersamples on the CoF and the friction-induced surface roughness sample changes in different contact pairs. Three types of 145Cr6 tool steel countersamples were used, differing in surface treatment methods. The surfaces of the countersamples were modified using electron beam melting (EBM), the ion implantation of lead, and combined EBM and ion implantation of lead. Friction test results for these samples were compared with the results for a countersample with an unmodified surface. To the best of the authors’ knowledge, similar BUT tests involving lubricants modified with powder particles and surface-modified countersamples manufactured by EBM, with the and ion implantation of lead, have not been performed previously. Section 2 of this paper presents the characteristics of the tested material and the test stand. The methods used to modify the countersample surface and the research plan are presented. Section 3 is divided into separate sub-sections devoted to the tribological analyses conducted. Section 3.1 presents the results and a discussion of the effect of countersample type and SiO2 and MoS2 particle content on the coefficient of friction. The effect of countersample type and lubrication conditions on the change in selected sheet metal surface roughness parameters is presented in Section 3.2. The main conclusions and interpretations are given in Section 4.
2. Materials and Methods
2.1. Test Material
The research involved the use of 0.8 mm thick low-carbon DC01 steel sheet (ArcelorMittal Poland S.A., Dąbrowa Górnicza, Poland). This steel material is widely used in many industries, such as the automotive (car) industry (where it is used to produce various body parts) and the manufacturing sector (where deep drawn housings are produced).
The widespread application of the test material is primarily related to its mechanical properties, which result from its chemical composition. The carbon content in this material reaches 0.06%, which increases its hardness and mechanical strength. The presence of manganese (up to 0.35%) improves plastic properties and facilitates sheet metal forming. Elements such as phosphorus and sulphur (in concentrations up to 0.025%) are important for corrosion resistance and weld quality during the welding process [29]. Low-carbon DC01 steel sheet has high formability at room temperature and, because of its high susceptibility to work-hardening, low-carbon sheets are formed under cold forming conditions. Because low-carbon steel is inherently soft and ductile, it can withstand large plastic deformations at room temperature without cracking, allowing the production of complex shapes for the automotive and other industries.
The basic mechanical properties of DC01 steel were determined in a uniaxial tensile test using a Zwick/Roell Z100 tensile testing machine (Zwick/Roell, Ulm, Germany) in accordance with the EN ISO 6892-1:2020 standard [30]. The surface topography of the DC01 steel sheet was measured in the as-received state and after friction testing. Surface roughness measurements were performed using a stationary T8000RC profilometer manufactured by Jenoptik AG (Jena, Germany).
2.2. Friction Testing Method
The friction tests were performed using a self-designed bending under tension friction tester, as shown in Figure 1. The detailed design of this tribotester was previously described in [31]. The test samples were DC01 steel strips cut from a 0.8 mm thick sheet in the rolling direction. Each sample was 18 mm wide and 400 mm long.
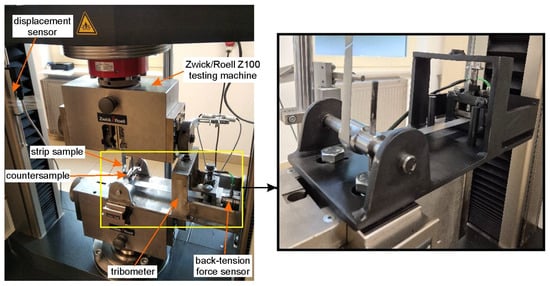
Figure 1.
View of test stand.
The test involves stretching a strip of sheet metal around a 145Cr6 tool steel countersample with a diameter of 30 mm. The tests were conducted on the test stand shown in Figure 1, where one end of the sample was fixed in a specially constructed holder. The other end of the sample was mounted in the upper holder of a Zwick/Roell Z100 testing machine. The movement of this holder caused sample elongation whilst simultaneously bending it around the cylindrical countersample. The sample was stretched until it broke. The tests were carried out at an ambient temperature (21 °C). The testing machine was responsible for recording the front-tension force (FTF), while the back-tension force (BTF) was measured using a Kistler 9345B piezoelectric force sensor (Kistler, Winterthur, Switzerland). Based on both the FTF and BTH forces, the change in the friction coefficient μ value during the BUT test was determined according to Equation (1) [32]:
The schematic of the BUT test shown in Figure 2 reflects the geometry of the rounded tool edges in sheet metal forming [9,11,13]. One of the main goals of the study was to determine the effect of modifying the countersample surface on the coefficient of friction and changes in strip sample topography during the BUT test.
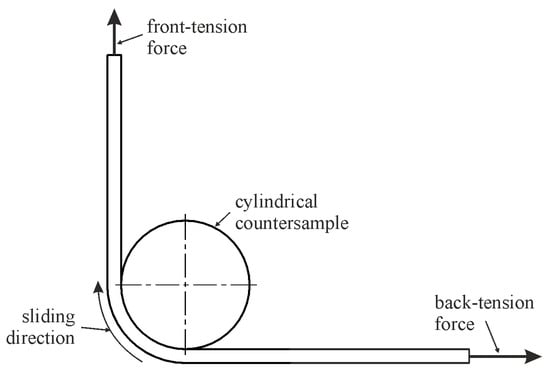
Figure 2.
Schematic of bending under tension test.
As part of the investigations, three different variants of countersample surface modification were considered. The friction test results obtained for the modified countersamples were compared with the results of the tests conducted using unmodified (UM) countersamples. The countersample surface modification was performed using three methods: electron beam melting (sample denotation—EBM), ion implantation of lead (sample denotation—IPb) and combined ion implantation of Pb and EBM (sample denotation—IPb + EBM). A detailed description of the countersample surface modification procedures was already provided in a recent article [33].
During the tests, the effect of different lubrication conditions on the friction process was analysed. S100 Plus oil (Naftochem sp. z o.o., Kraków, Poland), characterised by a kinematic viscosity of 110 mm2/s, was used in the BUT tests. This oil is specifically designed for use in deep drawing operations. Additionally, S100 Plus oil was modified by adding SiO2 and MoS2 powders in three different mass concentrations: 1%, 5%, and 10%.
In order to precisely determine the influence of individual parameters on the material behaviour during the BUT test, a series of tests was carried out according to the research plan presented in Table 1.

Table 1.
Research plan.
3. Results and Discussion
3.1. Characteristics of Test Materials
The average values of the basic mechanical parameters of DC01 sheet metal are presented in Table 2. The parameter values are supplemented with standard deviations.

Table 2.
Selected mechanical properties of DC01 steel.
The average surface roughness Sa for the as-received sheet metal is Sa = 1.25 μm and a view of the sheet’s surface topography is shown in Figure 3.
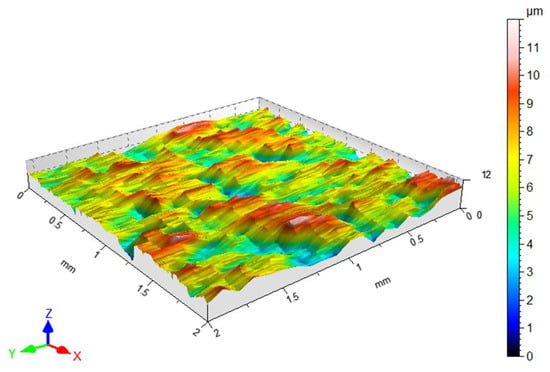
Figure 3.
Surface topography view of the DC01 sheet metal in the as-received state.
Values of basic surface roughness parameters of the countersamples are presented in Figure 4. The surfaces of the countersamples were characterised by the average surface roughness Sa [34]. The average roughness values varied between 0.742 μm and 1.810 μm depending on the type of countersample used.
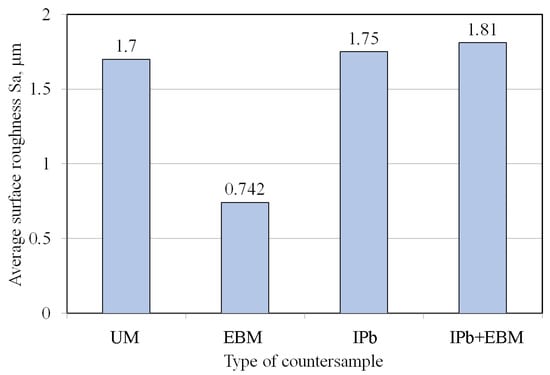
Figure 4.
Average surface roughness of countersamples.
The powders used in the study were examined for particle size and chemical composition. A TESCAN MIRA3 scanning electron microscope (SEM) was used for the microstructural analysis. Figure 5 shows SEM images of the powders used. The size of the major fraction of SiO2 particles was between 5 and 18 μm. The size of the major fraction of MoS2 particles was between 5 and 15 μm; however, smaller and larger particles were also observed. The results of the analysis of the powder’s chemical composition are presented in Figure 6.
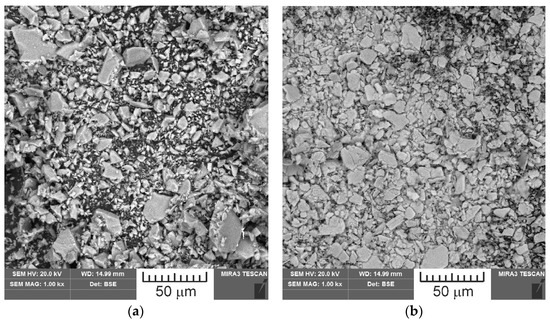
Figure 5.
SEM images of powder materials: (a) SiO2, (b) MoS2.
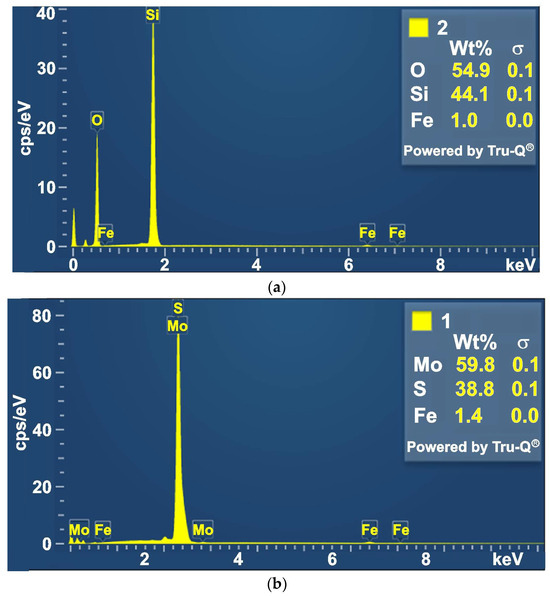
Figure 6.
The content of elements in the powder: (a) SiO2, (b) MoS2.
3.2. Coefficient of Friction
Figure 7 shows the changes in the FTF and BTF during the BUT test and the corresponding change in the CoF value for the EBM countersample. Due to the continuous change in surface topography associated with sample stretching and the change in the sheet’s mechanical properties resulting from the work-hardening phenomenon, the CoF value is subject to continuous change [33]. Therefore, for comparison purposes, the maximum value of the coefficient of friction determined for sample elongation greater than 6% was adopted (Figure 8). Initially, the value of the force parameters increases rapidly as a result of overcoming the material’s resistance to deformation in the elastic strain range. Subsequently, the sample undergoes plastic deformations associated with the strain hardening. The strength of the strip sample is limited and at a certain point, there is a localised reduction in a specimen’s cross-sectional area, which corresponds to the maximum FTF; a subsequent reduction in the force parameters was observed.
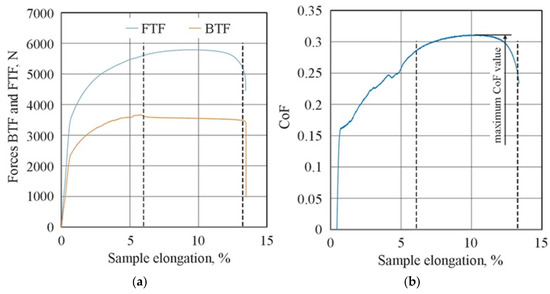
Figure 7.
Changes in (a) force parameters and (b) CoF during BUT test under friction conditions with EBM countersample (dotted lines indicate the range of determining the maximum CoF value).
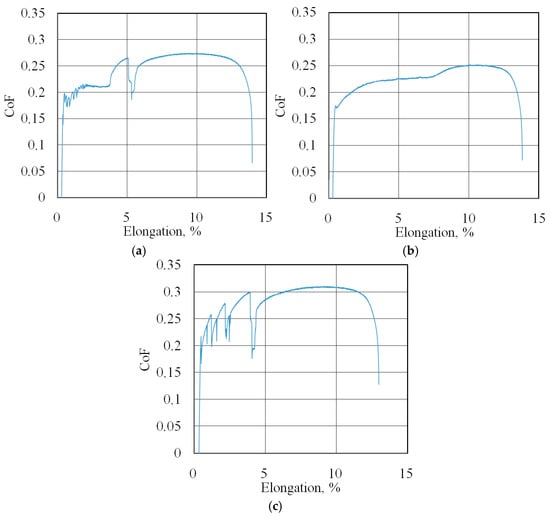
Figure 8.
Changes in CoF (blue lines) during BUT test under dry friction conditions with the following countersamples: (a) UM, (b) IPb + EBM and (c) IPb.
The friction coefficient evolution curves (friction history) for all of the test conditions are presented in Figure 7b, Figure 8, Figure 9, Figure 10, Figure 11, Figure 12 and Figure 13.
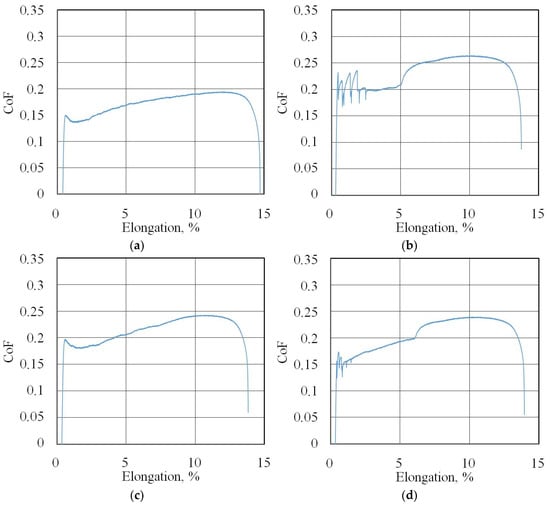
Figure 9.
Changes in CoF (blue lines) during BUT test under lubrication with base S100 Plus oil with the following countersamples: (a) EBM, (b) UM, (c) IPb + EBM and (d) IPb.
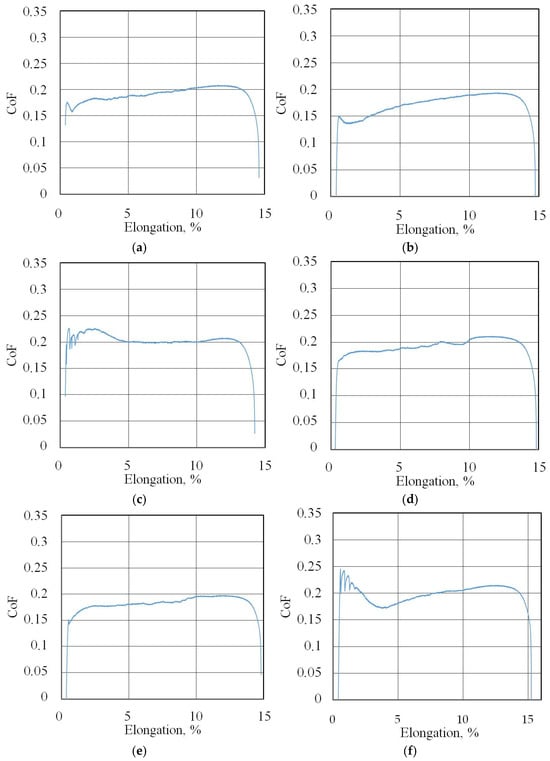
Figure 10.
Changes in CoF (blue lines) during BUT test (EBM countersample) under lubrication with S100 Plus oil modified with (a) 1% SiO2, (b) 5% SiO2, (c) 10% SiO2, (d) 1% MoS2, (e) 5% MoS2, and (f) 10% MoS2.
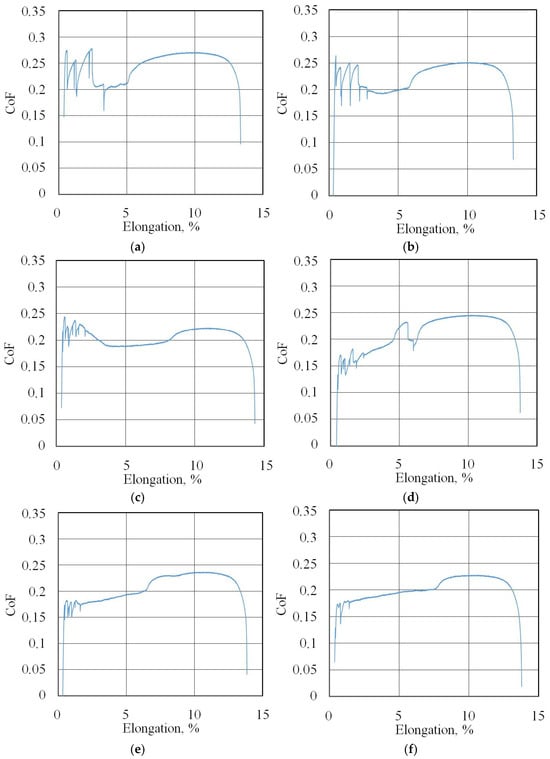
Figure 11.
Changes in CoF (blue lines) during BUT test (UM countersample) under lubrication with S100 Plus oil modified with (a) 1% SiO2, (b) 5% SiO2, (c) 10% SiO2, (d) 1% MoS2, (e) 5% MoS2, and (f) 10% MoS2.
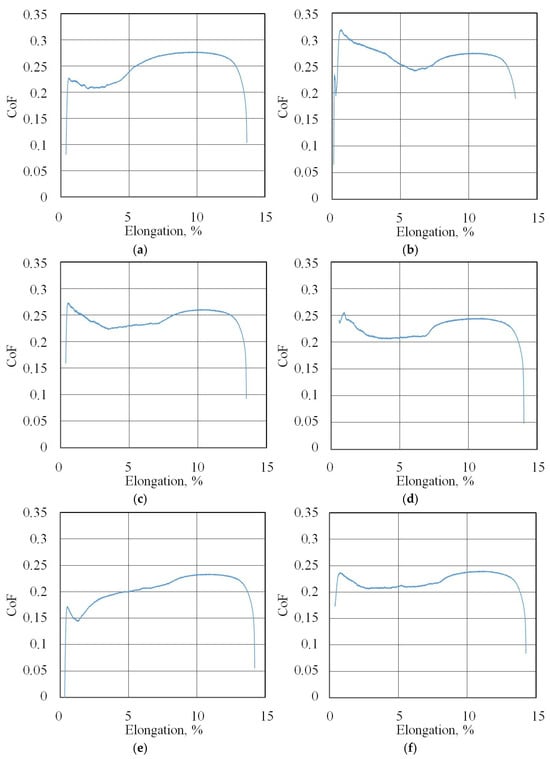
Figure 12.
Changes in CoF (blue lines) during BUT test (IPb + EBM countersample) under lubrication with S100 Plus oil modified with (a) 1% SiO2, (b) 5% SiO2, (c) 10% SiO2, (d) 1% MoS2, (e) 5% MoS2, and (f) 10% MoS2.
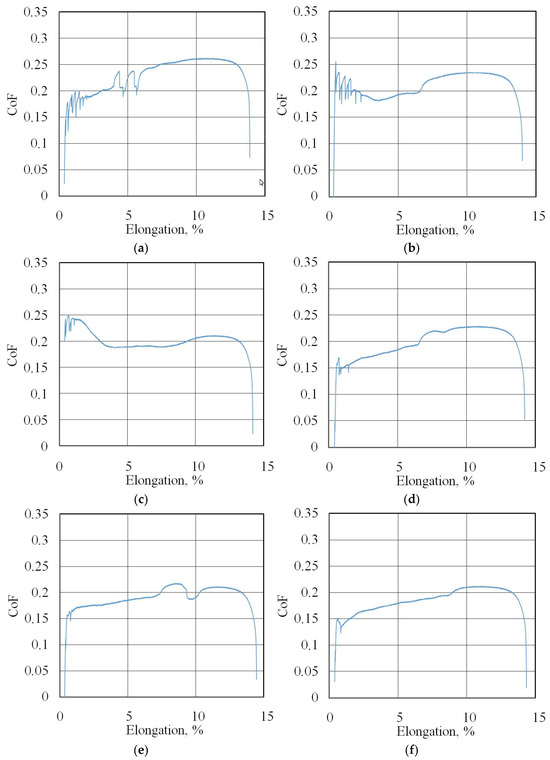
Figure 13.
Changes in CoF (blue lines) during BUT test (IPb countersample) under lubrication with S100 Plus oil modified with (a) 1% SiO2, (b) 5% SiO2, (c) 10% SiO2, (d) 1% MoS2, (e) 5% MoS2, and (f) 10% MoS2.
A comparison of the maximum CoF values for all friction conditions specified in Table 1 is presented in Figure 14. In general, the expected relationship was observed, i.e., lubrication reduced the CoF value compared to dry friction conditions. Dry friction with UM and EBM countersamples provided a similar CoF value of approximately 0.31. The use of lubricant dramatically changed the coefficient of friction value. In the case of the UM countersample, its value depended on the content of SiO2 and MoS2 additives in the oil, and ranging between 0.223 (SiO2-10) and 0.271 (SiO2-1); this corresponds to a CoF reduction between 11.41 and 27.10%. In the case of the electron beam melted countersample, all friction conditions provided a CoF reduction between 31.9% (MoS2-1 and MoS2-10) and 37.5% (S100 Plus lubrication). For the UM and IPb countersamples, increasing the MoS2 and SiO2 content in S100 Plus oil resulted in a decrease in the coefficient of friction. During friction with the EBM and IPb + EBM countersamples, the lowest friction coefficient values were determined; modified oils were observed for oils containing 5 wt.% additives. This may be explained by the different topography of the countersamples, which determines the share of oil pockets and the distribution of asperity summits in the countersample surfaces.
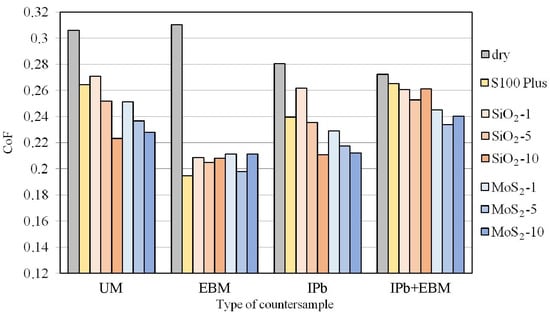
Figure 14.
The influence of BUT test conditions on CoF.
The combination of high surface roughness and a low CoF for the countersamples does not have to be a contradiction. In sheet metal forming, a hard tool contacts a relatively soft sheet metal. High tool roughness, with appropriate lubrication, can provide large oil spaces which are capable of accommodating lubricant. Furthermore, high tool roughness reduces the actual contact area, limiting the metallic interaction of the friction pairs’ peaks. However, when the surface roughness is higher, surface asperities are embedded with each other, which will hinder friction pairs from sliding easily [35].
The UM and IPb countersamples reduced the CoF with increasing MoS2 content in the lubricant (Figure 15). The largest reduction in CoF with the modified oil (by 19.5%) was observed for the IPb countersample and with oil containing SiO2 additive (Figure 15a). Only the EBM and IPb + EBM countersamples showed a similar effect on CoF for both powder additives. In the case of the EBM countersample, the SiO2 and MoS2 additives increased the friction coefficient compared to the lubrication conditions with pure S100 Plus oil. The opposite relationship was observed for the IPb + EBM countersample. The use of SiO2 (Figure 15a) and MoS2 (Figure 15b) additives reduced the CoF compared to the base oil.
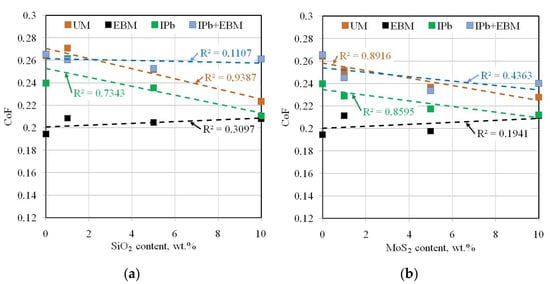
Figure 15.
Effect of the addition of (a) SiO2 and (b) MoS2 to S100 Plus oil on the CoF.
In Figure 15, the COF of the UM and IPb countersamples decreases with the increase in the additional SiO2 and MoS2 content. For the EBM and IPb + EBM countersamples, the COF shows a trend of first decreasing and then increasing with the increase in the amount of SiO2 and MoS2, and reaches the minimum when the amount of SiO2 and MoS2 is 5 wt.%. These differences can be attributed to the higher peak–valley surface roughness Sz for the EBM (13.9 μm) and IPb + EBM (15.3 μm) countersamples compared to the remaining countersamples (10.2 μm for UM, 9.06 μm for IPb). According to the studies by Kong et al. [36] and Reeves et al. [37], lubrication effectiveness results from the interaction of particle size and surface roughness. High surface roughness in the countersamples causes faster lubricant film rupture due to the more concentrated interaction of surface roughness compared to surfaces with low asperities. Under these conditions, the number of particles has a decisive influence on the moment of lubricant film rupture. With a small number of particles, the effect of their addition to the base oil can be negligible. However, a large number of particles can increase friction by interfering with the surfaces and act as abrasive contaminants. As suggested by Xie et al. [25] and Zakani et al. [38], for a given surface roughness of the friction pair and contact pressures, there is an optimal concentration of particles for which a significant friction-reduction effect is obtained.
It is also important to note the effect of particle size on lubrication efficiency. For SiO2/MoS2 lubrication, smaller particle sizes are generally better, as they increase the surface area for more uniform lubricant film formation and better adhesion to contact surfaces, leading to reduced friction. However, extremely small nano-sized particles can agglomerate, hindering their ability to form a stable, continuous lubricating layer and negatively impacting performance. For the BUT test where deformation-induced surface roughness increases, larger particles are more effective in filling surface valleys as a result of the mending effect. Particles fill surface valleys and grooves, reducing surface roughness and diminishing the direct metal-to-metal contact.
3.3. Surface Roughness
The change in the topography of strip samples during the BUT test is related to sample elongation and the work-hardening phenomenon, which influences friction-induced contact mechanisms. Strain hardening influences the mechanical properties of the sheet metal: the sheet strength increases while the plastic properties decrease. Contact mechanisms primarily depend on the surface roughness of the contacting bodies but the sheet metal surface topography is subject to continuous evolution, while the tool surface topography remains constant or only changes to a small extent, ensuring stable conditions for the forming process of a series of products.
In order to analyse changes in the sheet metal topography, the basic parameters identified in the literature as being important in sheet metal forming were selected. Average roughness Sa is the most universal and basic parameter used in industry [39,40].
Figure 16a,b shows the effect of countersample surface treatment on the average surface roughness of strip samples for dry friction and lubricated conditions with pure S100 Plus oil, respectively. The average roughness Sa value under dry friction conditions (Figure 16a) and lubrication with oil without additives (Figure 16b) does not show significant changes induced by friction. The value of this parameter varies by approximately 11–20% depending on the friction conditions.
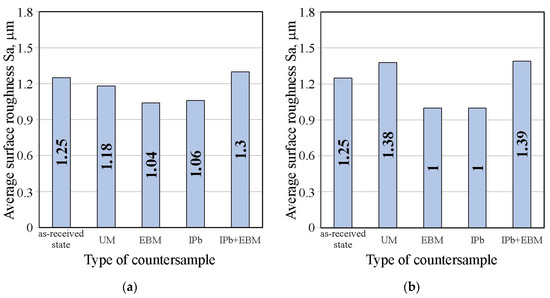
Figure 16.
Influence of countersample surface treatment on basic surface roughness parameters of strip samples for (a) dry friction and (b) lubricated conditions with pure S100 Plus oil.
Figure 17 shows the effect of countersample surface treatment on average surface roughness of strip samples tested with S100 Plus oil with an SiO2 additive. In the case of oil with 1 wt.% SiO2, all countersamples with a modified surface provided a reduction in average surface roughness compared to the UM countersample. The largest increase in the Sa parameter under friction conditions with SiO2-modified oil was observed for the unmodified countersample (Sa = 1.66 μm). In friction conditions with oil containing 5 wt.% SiO2 (Figure 17b), a reduction in the Sa parameter value in EBM countersample was observed for all countersamples (up to 13.6%). Similarly, during friction with oil containing 10 wt.% SiO2, the friction process caused a reduction in average roughness between 4.8% (UM countersample) and 29.8% (EBM countersample).
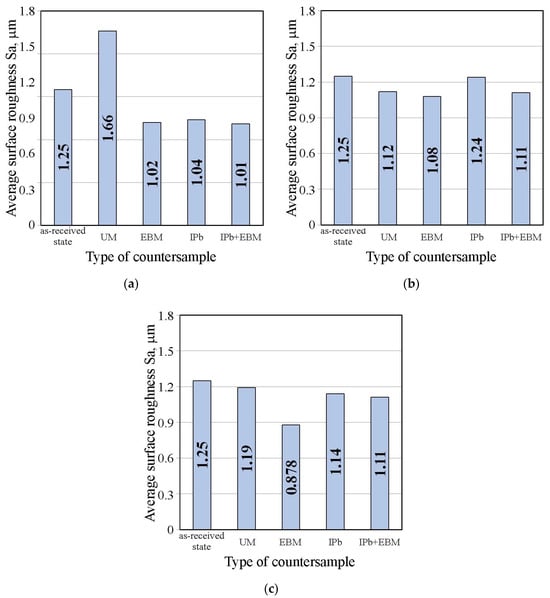
Figure 17.
Influence of countersample surface treatment on basic surface roughness parameters of strip samples tested with S100 Plus oil with SiO2 added at (a) 1 wt.%, (b) 5 wt.%, and (c) 10 wt.%.
SEM images of the sample which was surface tested under dry friction conditions with EBM, UM and IPb countersamples are presented in Figure 18. Figure 19 presents SEM images of the sample surface tested under lubrication with base S100 Plus oil with the EBM, UM and IPb countersamples. SEM images of sample surfaces tested under lubrication with oil containing SiO2 and MoS2 particles are presented in Figure 20, Figure 21, Figure 22 and Figure 23. In general, the sheet metal surface contains valleys created by the sheet metal manufacturing process and subject to deformation-induced evolution, as well as areas with flattened asperities. Scratches can be observed at the highest asperities, resulting from the interaction of tool asperities and sheet asperities. Deep grooves are the result of ploughing friction, which is defined as the contribution to friction force that occurs when a hard asperity in the countersample penetrates a softer sheet of metal.
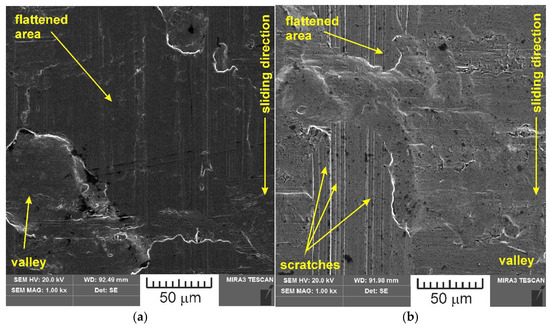
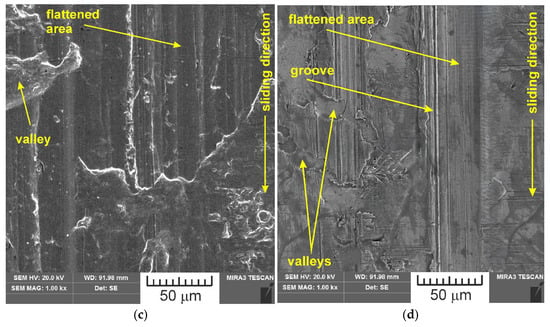
Figure 18.
SEM images of the sample surface tested under dry friction conditions with the following countersamples: (a) EBM, (b) UM, (c) IPb + EBM and (d) IPb.
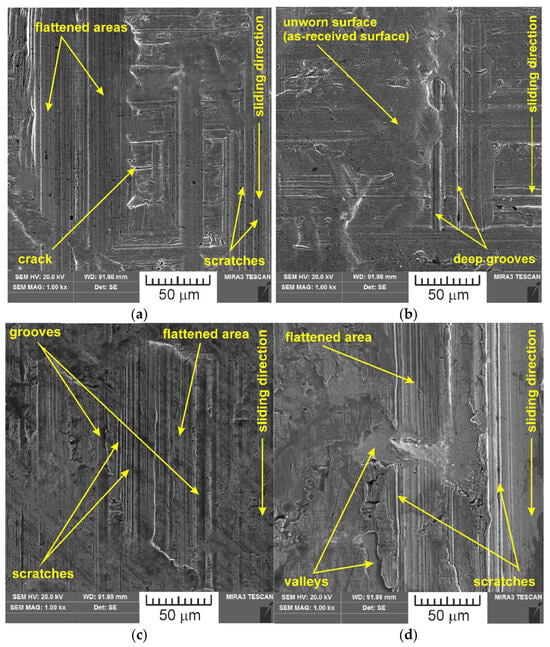
Figure 19.
SEM images of the sample surface tested under lubrication with base S100 Plus oil with the following countersamples: (a) EBM, (b) UM, (c) IPb + EBM and (d) IPb.
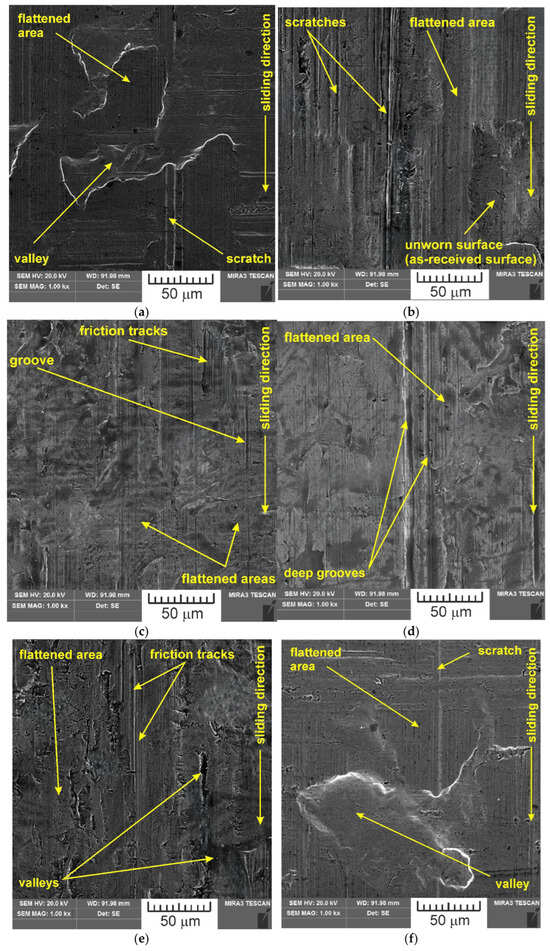
Figure 20.
SEM images of the sample surface contacted with EBM countersample under lubrication with S100 Plus oil modified with (a) 1% SiO2, (b) 5% SiO2, (c) 10% SiO2, (d) 1% MoS2, (e) 5% MoS2 and (f) 10% MoS2.
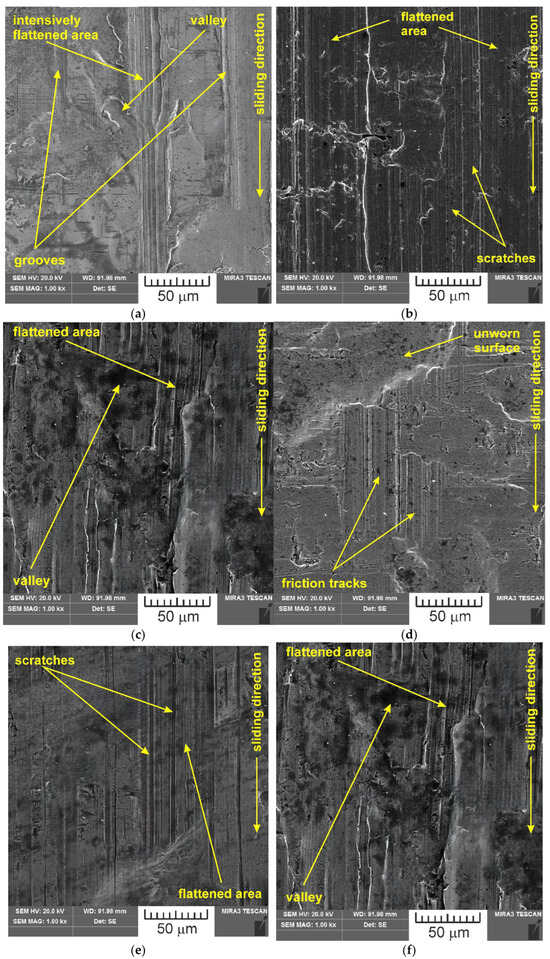
Figure 21.
SEM images of the sample surface contacted with UM countersample under lubrication with S100 Plus oil modified with (a) 1% SiO2, (b) 5% SiO2, (c) 10% SiO2, (d) 1% MoS2, (e) 5% MoS2, and (f) 10% MoS2.
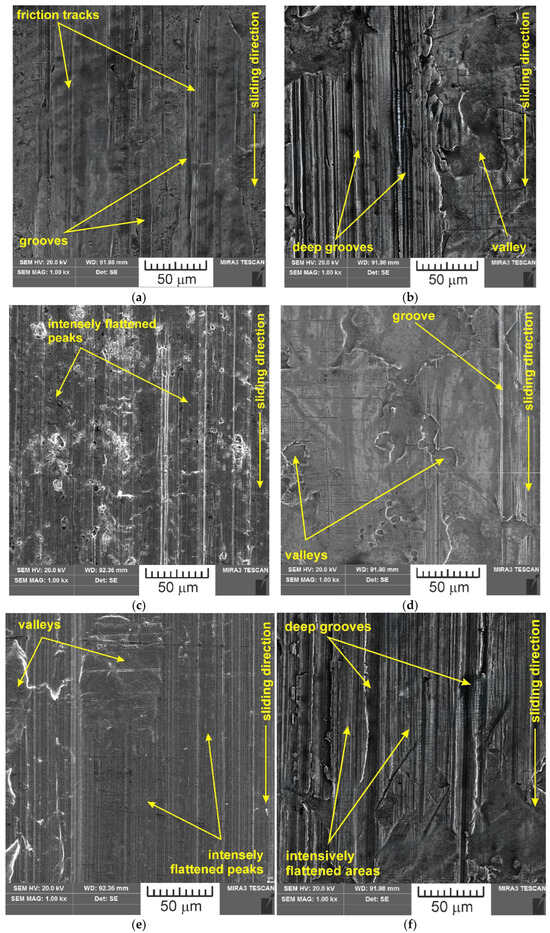
Figure 22.
SEM images of the sample surface contacted with IPb + EBM countersample under lubrication with S100 Plus oil modified with (a) 1% SiO2, (b) 5% SiO2, (c) 10% SiO2, (d) 1% MoS2, (e) 5% MoS2, and (f) 10% MoS2.
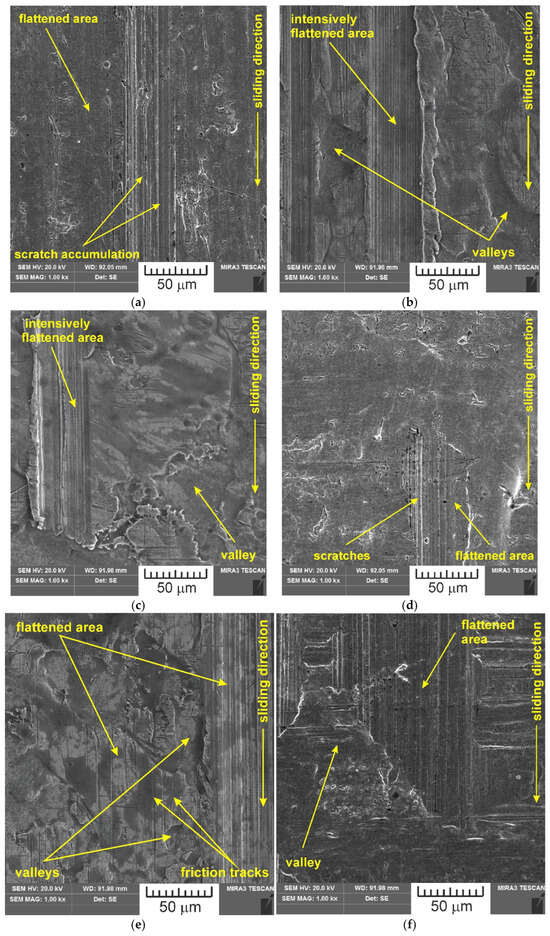
Figure 23.
SEM images of the sample surface contacted with IPb countersample under lubrication with S100 Plus oil modified with (a) 1% SiO2, (b) 5% SiO2, (c) 10% SiO2, (d) 1% MoS2, (e) 5% MoS2, and (f) 10% MoS2.
The effect of surface treating the countersample on the average surface roughness of the strip samples tested with S100 Plus oil with the addition of MoS2, is shown in Figure 24. The average roughness Sa is the least sensitive to changes in surface topography after friction. During friction with oil containing 5 wt.% MoS2 (Figure 24a), the average roughness value varied between 0.8% (IPB) and 24.6% (EBM). During friction with oil containing 5 wt.% MoS2, the average roughness value varied between 12.8% (UM) and 20.8% (EBM). The change in average roughness observed for friction with the presence of oil containing 10 wt.% MoS2 (Figure 24c) was between 3.2% (IPb) and 24.2% (EBM).
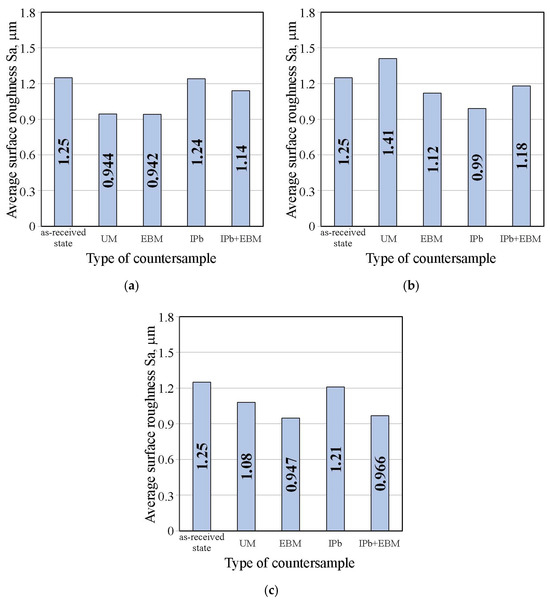
Figure 24.
Influence of countersample surface treatment on basic surface roughness parameters of strip samples tested with S100 Plus oil with MoS2 added at (a) 1 wt.%, (b) 5 wt.% and (c) 10 wt.%.
In the case of the IPb and EBM countersamples, the friction process resulted in a reduction in the average roughness value (Figure 25). Friction involving the unmodified countersamples was most sensitive to the SiO2 content (Figure 25a) and the addition of MoS2 (Figure 25b). In the absence of particles (or just a small amount: 1 wt.%), friction resulted in an increase in average roughness (Figure 25a). Under the conditions of lubrication with oil with the addition of 5–10 wt% SiO2 (Figure 25a), due to the frictional interaction of the strip sample with the countersamples, the average roughness Sa decreased, compared to the as-received surface.
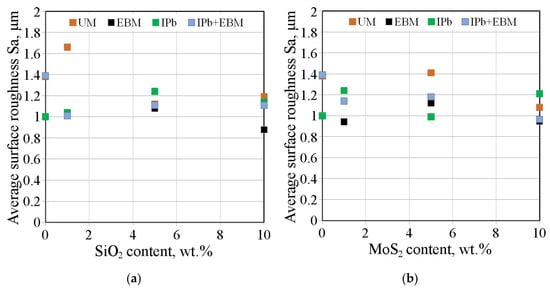
Figure 25.
Influence of (a) SiO2 and (b) MoS2 content in S100 Plus oil on the average roughness Sa of strip samples after friction tests.
Although interpreting the effect of friction conditions on topography changes is generally difficult, due to the synergistic interdependence of many factors, the indicated differences can be related to different particle properties. MoS2 exhibits a layered structure similar to graphite, while SiO2 exhibits a network structure. This makes MoS2 soft and cleavable, while SiO2 is hard (Mohs scale of 7 [41]) and its density is about half that of MoS2. Due to their high degree of hardness, SiO2 particles tend to embed themselves into the sheet surface (Figure 26).
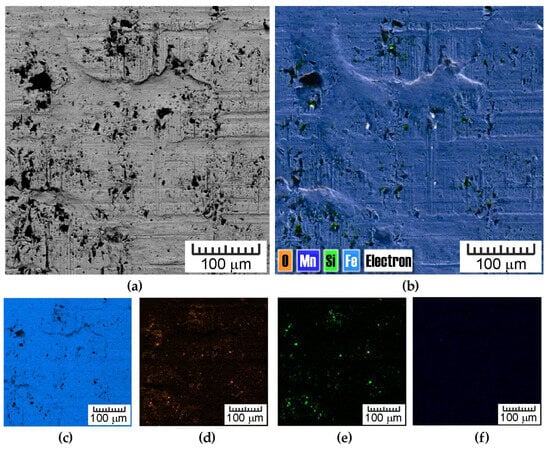
Figure 26.
(a) SEM image (back-scattered electron detector mode) of strip sample after BUT test with oil containing SiO2 particles, (b) energy dispersive spectroscopy (EDS) layered image and EDS maps of the (c) Fe, (d) O, (e) Si and (f) Mn distribution.
4. Conclusions
The results of our research, presented in this paper, focused on determining the effect of lubricant modification (by adding MoS2 and SiO2 particles) and modifying the surface of countersamples on the CoF and changes in friction-induced surface roughness in the BUT friction test. The main research results are as follows:
- the expected relationship was observed, i.e., lubrication with pure and modified S100 Plus oil reduced the CoF value compared to dry friction conditions;
- in the case of the UM countersamples, the CoF value depended on the SiO2 and MoS2 additive content in the oil and ranged between 0.223 (SiO2-10) and 0.271 (SiO2-1);
- for the countersample modified by electron beam melting, considering all friction conditions, the CoF decreased between 31.9% (MoS2-1 and MoS2-10) and 37.5% (S100 Plus oil lubrication);
- increasing the SiO2 and MoS2 content when testing DC01/UM and DC01/IPb contacts under base oil lubrication conditions resulted in a decrease in the CoF value;
- in relation to the as-received surface, the value of the Sa parameter, in conditions of dry friction and lubrication with pure oil, varied in the range of 11–20%, depending on the friction conditions; for DC01/EBM and DC01/IPb contacts, the average roughness value decreased as a result of the friction process;
- SEM analysis of the countersamples surfaces identified adhesion, flattening, and ploughing as the main friction mechanisms.
Author Contributions
Conceptualization, K.S., T.T. and M.S.; methodology, K.S. and T.T.; validation, K.S., T.T., J.Z.-S. and M.S.; investigation, K.S., T.T., J.Z.-S. and M.S.; data curation, K.S., T.T., J.Z.-S. and M.S.; writing—original draft preparation, K.S., T.T., J.Z.-S. and M.S.; writing—review and editing, K.S., T.T., J.Z.-S. and M.S.; supervision, K.S., T.T. and J.Z.-S. All authors have read and agreed to the published version of the manuscript.
Funding
This research received no external funding.
Institutional Review Board Statement
Not applicable.
Informed Consent Statement
Not applicable.
Data Availability Statement
The original contributions presented in this study are included in the article. Further inquiries can be directed to the corresponding author.
Conflicts of Interest
The authors declare no conflicts of interest.
References
- Luiz, V.D.; de Matos Rodrigues, P.C. Design of a Tribo-Simulator for Investigation of the Tribological Behavior of Stainless-Steel Sheets Under Different Contact Conditions. Mater. Res. 2022, 25, e20210220. [Google Scholar] [CrossRef]
- Trzepieciński, T.; Szwajka, K.; Szewczyk, M.; Zielińska-Szwajka, J.; Barlak, M.; Nowakowska-Langier, K.; Okrasa, S. Analysis of Influence of Coating Type on Friction Behaviour and Surface Topography of DC04/1.0338 Steel Sheet in Bending Under Tension Friction Test. Materials 2024, 17, 5650. [Google Scholar] [CrossRef] [PubMed]
- Balyts’kyi, O.I.; Kolesnikov, V.O. Investigation of wear products of high-nitrogen manganese steels. Mater. Sci. 2009, 45, 576–581. [Google Scholar] [CrossRef]
- Balyts’kyi, O.I.; Kolesnikov, V.O.; Kawiak, P. Triboengineering properties of austenitic manganese steels and cast irons under the conditions of sliding friction. Mater. Sci. 2005, 41, 624–630. [Google Scholar] [CrossRef]
- Folle, L.F.; Schaeffer, L. Effect of surface roughness and lubrication on the friction coefficient in deep drawing processes of aluminum alloy aa1100 with fem analysis. Rev. Matéria 2019, 24, e-12298. [Google Scholar] [CrossRef]
- Adamus, J.; Więckowski, W.; Lacki, P. Analysis of the Effectiveness of Technological Lubricants with the Addition of Boric Acid in Sheet Metal Forming. Materials 2023, 16, 5125. [Google Scholar] [CrossRef]
- Antonicelli, M.; Piccininni, A.; Palumbo, G. Eco-friendly lubricants for improving performance and environmental impact in cold rolling. Procedia CIRP 2024, 125, 196–200. [Google Scholar] [CrossRef]
- Trzepieciński, T.; Szewczyk, M.; Szwajka, K. The Use of Non-Edible Green Oils to Lubricate DC04 Steel Sheets in Sheet Metal Forming Process. Lubricants 2022, 10, 210. [Google Scholar] [CrossRef]
- Bay, N.; Olsson, D.D.; Andreasen, J.L. Lubricant test methods for sheet metal forming. Tribol. Int. 2008, 41, 844–853. [Google Scholar] [CrossRef]
- Andreasen, J.L.; Olsson, D.D.; Chodnikiewicz, K.; Bay, N. Bending Under Tension Test with Direct Friction Measurement. Proc. Inst. Mech. Eng. Part B J. Eng. Manuf. 2006, 220, 73–80. [Google Scholar] [CrossRef]
- Wiklund, D.; Rosén, B.G.; Wihlborg, A. A friction model evaluated with results from a bending-under-tension test. Tribol. Int. 2009, 42, 1448–1452. [Google Scholar] [CrossRef]
- Folle, L.; Schaeffer, L. New Proposal to Calculate the Friction in Sheet Metal Forming Through Bending Under Tension Test. Mater. Res. 2019, 22, e20190523. [Google Scholar] [CrossRef]
- Trzepiecinski, T.; Lemu, H.G. Determination of Frictional Resistances of Deep Drawing Quality Steel Sheets in Bending Under Tension Test. Acta Metall. Slovaca 2018, 22, 12–17. [Google Scholar] [CrossRef]
- Oliveira, E.S.; Damasceno, J.R.; Neto, A.S.; Amaral, E.C.; Gonçalves, K.A.M.B.; Luiz, V.D. The Effect of the Drawing Die Radius in the Bending Under Tension Test on the Frictional Behaviour of AISI 430 Steel and AW-1100 Aluminium Alloy Sheets. Adv. Mech. Mater. Eng. 2024, 41, 183–193. [Google Scholar] [CrossRef]
- Chang, H.; Lan, C.W.; Chen, C.H.; Kao, M.J.; Guo, J.B. Anti-wear and friction properties of nanoparticles as additives in the lithium grease. Int. J. Precis. Eng. Manuf. 2014, 15, 2059–2063. [Google Scholar] [CrossRef]
- Ma, F.; Pham, S.T.; Wan, S.; Guo, L.; Yi, G.; Xia, Y.; Qi, S.; Zhu, H.; Ta, T.D. Evaluation of tribological performance of oxide nanoparticles in fully formulated engine oil and possible interacting mechanism at sliding contacts. Surf. Interfaces 2021, 24, 101127. [Google Scholar] [CrossRef]
- Hao, L.; Wang, Z.; Zhang, G.; Zhao, Y.; Duan, Q.; Wang, Z.; Chen, Y.; Li, T. Tribological evaluation and lubrication mechanisms of nanoparticles en-hanced lubricants in cold rolling. Mech. Ind. 2020, 21, 108. [Google Scholar] [CrossRef]
- Singh, A.; Chauhan, P.; Mamatha, T.G. A review on tribological performance of lubricants with nanoparticles additives. Mater. Today Proc. 2020, 25, 586–591. [Google Scholar] [CrossRef]
- Trzepieciński, T. Tarcie i Smarowanie w Procesach Kształtowania Blach; Wydawnictwo Naukowe PWN: Warszawa, Poland, 2023. [Google Scholar]
- Taşkin, A.; Şahin, F.; Dengiz, C.G.; Demirbaş, T.C. Numerical and Experimental Investigation of Nano-Particle-Added Waste Oils on Lubrication Performance. OMU J. Eng. Sci. Technol. 2023, 3, 29–45. [Google Scholar]
- Liu, C.; Yin, Y.; Tong, B.; Zhang, G. Tribological properties of MoS2 powder-lubricated interface. Ind. Lubr. Technol. 2021, 73, 839–845. [Google Scholar] [CrossRef]
- Lovell, M.; Higgs, C.F.; Deshmukh, P.; Mobley, A. Increasing formability in sheet metal stamping operations using environmentally friendly lubricants. J. Mater. Process. Technol. 2006, 177, 87–90. [Google Scholar] [CrossRef]
- Mezher, M.T.; Saad, M.L.; Barrak, O.S.; Shakir, R.A. Finite Element Simulation and Experimental Analysis of Nano Powder Additives Effect in the Deep Drawing Process. Int. J. Mech. Mechatron. Eng. IJMME-IJENS 2020, 20, 166–180. [Google Scholar]
- Xie, H.; Jiang, B.; He, J.; Xia, X.; Pan, F. Lubrication performance of MoS2 and SiO2 nanoparticles as lubricant additives in magnesium alloy-steel contacts. Tribol. Int. 2016, 93, 63–70. [Google Scholar] [CrossRef]
- Xie, H.; Jiang, B.; Hu, X.; Peng, C.; Guo, H.; Pan, F. Synergistic Effect of MoS2 and SiO2 Nanoparticles as Lubricant Additives for Magnesium Alloy–Steel Contacts. Nanomaterials 2017, 7, 154. [Google Scholar] [CrossRef]
- Mosleh, M.; Atnafu, N.D.; Belk, J.H.; Nables, O.M. Modification of sheet metal forming fluids with dispersed nanoparticles for improved lubrication. Wear 2009, 267, 1220–1225. [Google Scholar] [CrossRef]
- Trzepieciński, T.; Szwajka, K.; Szewczyk, M.; Zielińska-Szwajka, J.; Slota, J.; Kaščák, Ľ. The Effect of the Addition of Silicon Dioxide Particles on the Tribological Performance of Vegetable Oils in HCT600X+Z/145Cr46 Steel Contacts in the Deep-Drawing Process. Materials 2025, 18, 73. [Google Scholar] [CrossRef] [PubMed]
- Pang, H.; Ngaile, G. Formulation of SiO2/oil nanolubricant for metal forming using hydrodynamic cavitation. Proc. Inst. Mech. Eng. Part B J. Eng. Manuf. 2020, 234, 1549–1558. [Google Scholar] [CrossRef]
- EN 10130:2009; Cold Rolled Low Carbon Steel Flat Products for Cold Forming. Technical Delivery Conditions. European Committee for Standardization: Brussels, Belgium, 2009.
- EN ISO 6892-1:2020; Metallic Materials—Tensile Testing—Part 1: Method of Test at Room Temperature. International Organization for Standardization: Geneva, Switzerland, 2020.
- Trzepieciński, T.; Szwajka, K.; Szewczyk, M.; Barlak, M.; Zielińska-Szwajka, J. Effect of Countersample Coatings on the Friction Behaviour of DC01 Steel Sheets in Bending-under-Tension Friction Tests. Materials 2024, 17, 3631. [Google Scholar] [CrossRef]
- Duncan, J.L.; Shabel, B.S.; Filho, J.G. A tensile strip test for evaluating friction in sheet metal forming. SAE Tech. Pap. 1978, 780391, 1–12. [Google Scholar] [CrossRef]
- Szwajka, K.; Trzepieciński, T.; Szewczyk, M.; Zielińska-Szwajka, J.; Barlak, M. Investigating Resulting Surface Topography and Residual Stresses in Bending DC01 Sheet Under Tension Friction Test. Lubricants 2025, 13, 255. [Google Scholar] [CrossRef]
- ISO 25178-2:2012; Geometrical Product Specifications (GPS)—Surface Texture: Areal—Part 2: Terms, Definitions and Surface Texture Parameters. International Organization for Standardization: Geneva, Switzerland, 2012.
- Rahaman, M.L.; Zhang, L.; Liu, M.; Liu, W. Surface roughness effect on the friction and wear of bulk metallic glasses. Wear 2015, 332–333, 1231–1237. [Google Scholar] [CrossRef]
- Kong, L.; Zhang, L.; Bao, Y.; Liu, D.; Liu, S. Effect of Surface Roughness and Particle Size on Lubrication Mechanisms of SiO2 Nanoparticles. Adv. Mater. Sci. Eng. 2022, 2022, 7051650. [Google Scholar] [CrossRef]
- Reeves, C.J.; Menezes, P.L.; Lovell, M.R.; Jen, T.C. The influence of surface roughness and particulate size on the tribological performance of bio-based multi-functional hybrid lubricants. Tribol. Int. 2015, 88, 40–55. [Google Scholar] [CrossRef]
- Zakani, B.; Salem, H.; Entezami, S.; Sedaghat, A.; Grecov, D. Effect of particle concentration on lubrication performance of cellulose nanocrystalline (CNC) water-based lubricants: Mixed lubrication regime. Cellulose 2022, 29, 3963–3984. [Google Scholar] [CrossRef]
- Todhunter, L.D.; Leach, R.K.; Lawes, S.D.A.; Blateyron, F. Industrial survey of ISO surface texture parameters. CIRP J. Manuf. Sci. Technol. 2017, 19, 84–92. [Google Scholar] [CrossRef]
- Zabala, A.; Sáenz-De-Argandoña, E.; Cañizares, D.; Llavori, I.; Otegi, N.; Mendiguren, J. Numerical study of advanced friction modelling for sheet metal forming: Influence of the die local roughness. Tribol. Int. 2022, 165, 107259. [Google Scholar] [CrossRef]
- Kuo, M.C.; Tsai, C.M.; Huang, J.C.; Chen, M. PEEK composites reinforced by nano-sized SiO2 and Al2O3 particulates. Mater. Chem. Phys. 2005, 90, 185–195. [Google Scholar] [CrossRef]
Disclaimer/Publisher’s Note: The statements, opinions and data contained in all publications are solely those of the individual author(s) and contributor(s) and not of MDPI and/or the editor(s). MDPI and/or the editor(s) disclaim responsibility for any injury to people or property resulting from any ideas, methods, instructions or products referred to in the content. |
© 2025 by the authors. Licensee MDPI, Basel, Switzerland. This article is an open access article distributed under the terms and conditions of the Creative Commons Attribution (CC BY) license (https://creativecommons.org/licenses/by/4.0/).