Article

Tribological Aspects of Slide Friction Diamond Burnishing Process

by
Gyula Varga
1,* and
Angelos P. Markopoulos
2
1
Faculty of Mechanical Engineering and Informatics, University of Miskolc, H-3515 Miskolc, Hungary
2
Laboratory of Manufacturing Technology, School of Mechanical Engineering, National Technical University of Athens, 15780 Athens, Greece
*
Author to whom correspondence should be addressed.
Materials 2025, 18(19), 4500; https://doi.org/10.3390/ma18194500 (registering DOI)
Submission received: 27 August 2025 / Revised: 19 September 2025 / Accepted: 23 September 2025 / Published: 27 September 2025
(This article belongs to the Section Manufacturing Processes and Systems)

Abstract

Even though the foundations of diamond burnishing as a research topic were laid long ago, numerous scientific papers still deal with examining various aspects of the burnishing process today. One such aspect is the investigation of the 3D roughness parameters related to the tribological characteristics of the machined surface, which is detailed in the present study. In this study, the positive properties of slide friction diamond burnishing are presented through the examination of surface quality, which plays a key role in tribological assessment. This study analyzed the surface layer condition of X5CrNi18-10 stainless austenitic chromium–nickel steel test pieces after burnishing. Among the finishing operations, burnishing is an economical and low-environmental impact process. The study includes a description of the technological characteristics of turning and diamond burnishing processes. The main characteristics of the Abbott–Firestone curve are described, and parameter improvement factors are introduced. The experimental results and their evaluations are presented by analyzing the values of the Abbott–Firestone surface curves. The study concludes that the best improvement ratios of Sa (arithmetical mean height), Sq (root mean square height), Sz (maximum height) ISa, ISq, and ISz roughness improvements were achieved when using the parameter combination v2 = 55.578 m/min, f2 = 0.050 mm/rev and F4 = 50 N.

1. Introduction

With the advancement of the Fourth Industrial Revolution, ensuring the surface quality of precision-machined components is gaining increasing importance [1]. According to the literature, from a tribological perspective, the reliability and service life of machine elements largely depends on the outcome of the manufacturing process and the microstructure of the component’s surface [2]. The resulting surface texture has a significant impact on the wear resistance and fatigue strength of the components [3]. Conventional machining methods—such as turning and milling—are often insufficient to achieve the required surface quality; therefore, additional finishing operations, such as grinding or burnishing, are often necessary.
Meng et al. [4] reviewed the early 2020s developments in the field of tribology. Out of the 3450 articles published during this period, approximately 1000 peer-reviewed papers were selected and evaluated as key contributions to tribological research worldwide. The survey highlights advances in lubrication, wear and surface engineering, biotribology, high-temperature tribology, and computational tribology, presenting the latest findings in both fundamental and applied research. In this paper, we present the results of surface topography investigations related to tribology obtained through sliding burnishing. However, prior to that, we provide an overview of some characteristic features of selected tribological studies.

2. Literature Review

Burnishing is a surface improvement process based on the principle of plastic de-formation, in which the tool loads the surface irregularities to the plasticity limit and then greatly reduces the surface irregularities. Burnishing can therefore reduce surface roughness and increase hardness and residual stress, which has a positive effect on the fatigue limit [5,6]. Burnishing can be performed with ball, roller, or diamond-tipped tools, on both CNC and conventional machines [7]. Diamond burnishing in particular has proven to be an effective chip-free process that is suitable for treating flat, cylindrical, and complex surfaces [8]. However, the effect of the process parameters (force, feed rate, speed) has not yet been accurately modelled in all cases.
Several comprehensive studies have been published in recent years. A previous re-view paper by Maximov and Duncheva [9] summarized the research on diamond burnishing from 2019 to 2023. The study presents in detail the different processes that can be applied to both external and internal cylindrical surfaces, as well as to flat and complex surfaces. The main goal of the method is to increase wear resistance and fatigue strength, which is confirmed by both theoretical models and practical tests. The directions of the research are clear, but the exact definition of the parameters for industrial application remains an open question. In a 2024 study [10], Maximov and Duncheva investigated the effects of cryogenic and cold burnishing on the surface integrity and operational performance of metals. Temperatures below −180 °C induce structural transformations that have a beneficial effect on lifetime. Cryogenic treatment can be used as a stand-alone or additional operation and is an environmentally friendly alternative. The review pays special attention to hybrid processes, where burnishing is performed under cryogenic conditions. Although the results are encouraging, the cost and technological barriers of the method currently limit its widespread adoption.
In a 2025 study [11], Maximov and Duncheva reviewed the development of diamond burnishing between 1962 and 2025. They discussed traditional, ultrasonic, minimum quantity lubrication (MQL), and combined processes, as well as the application of finite element simulations. The review highlighted that although FEM models help us to understand the processes, they often do not accurately reflect real tribological behavior. Although the development directions are clear, the discrepancies between simulations and experimental results require further research.
Various investigations have focused on treatments improving wear. In the analysis of tribological effects, Korzynski et al. [12] investigated the effect of diamond coating on valve stems, where both hardness and residual stress developed favorably. According to their results, surface improvement also increased the service life of engine components. Sedlaček et al. [13] demonstrated the predictability of friction behavior based on the Ssk (skewness) and Sku (kurtosis) parameters of surface roughness. Shuster et al. [14] used 17 surface texture parameters to evaluate density and wear during alternating motion. Prajapati and Tiwari [15] emphasized the role of the Sq (root mean square height), Sdq (root mean square slope), and Vvv (dale void volume) parameters. Sedlaček et al. [16] reported that the Sku (kurtosis) and Ssk (skewness) parameters showed a strong correlation with the tribological properties of mating surfaces. According to Reddy et al. [17], there is a close correlation between the Vvv (dale void volume) and Sq (root mean square height) parameters and the degree of wear. Similarly, a study by Shi et al. [18] found a close correlation between the Vvv (dale void volume) and Vvc (core void volume) parameters and the degree of wear. Although the multitude of parameters allows for more accurate characterization, their validation and standardization in industrial practice is still lacking.
Lavrys et al. [19] demonstrated on porous titanium materials that ball peening in-creases wear resistance, while Dzierwa et al. [20] examined roll peening on steel test specimens. According to the results of Dzierwa et al, load is the most important factor directly influencing surface roughness and hardness. However, these studies are based on short-term wear tests, so long-term durability is less well documented.
Swirad [21] demonstrated a significant reduction in roughness and wear during ball rolling of Ti6Al4V titanium alloy, while other studies reported a friction reduction of more than 40% in steel samples. However, the improvement was not always clear in high-temperature tests. This indicates that the effect of heat is a key factor that requires further detailed investigation.
Grudzien’s study [22] pointed out that not only residual stress but also the geometry of the surface topography determines tribological performance. Dzierwa and Markopoulos [23] investigated ball peening of hardened steel in a CNC environment and emphasized that appropriate feed rate and force significantly improve surface roughness. However, the optimal parameters are still not uniformly defined at the industrial level.
Varga et al. [24] investigated the treatment of titanium alloys produced by selective laser melting (SLM) using sliding friction burnishing. According to their results, burnishing significantly improved surface integrity, but the effect was highly dependent on the parameters of 3D printing using selective laser melting. This highlights the strong interaction between selective laser melting and surface treatment, which has not yet been fully explored at the industrial level.
Swirad and Pawlus [25,26,27,28] conducted several studies comparing dry and lubricated ball bearings. They found that when lubrication was applied, friction and wear were reduced by more than 40%. However, in high-temperature tests, a positive effect was not always observed. This suggests that the interaction between lubrication and heat effects is a key issue for future research.
Torres et al. [29] studied the effect of microstructure on stainless steels and concluded that changes in the friction coefficient are more significant than changes in material structure. Velázquez-Corral et al. [30] used ultrasonic assistance to strengthen residual stresses, while Kuznetsov et al. [31] increased the hardness of AISI 304 steel using nanostructured burnishing. These processes are promising, but their complexity limits their application in industrial settings.
Bednarski et al. [32] conducted friction burnishing experiments on composite materials, confirming a significant increase in microhardness. The results showed that the degree of improvement depends largely on the composition of the material. However, the long-term behavior of heterogeneous composites has yet to be fully explored.
Abbott–Firestone curves are widely used to describe surface roughness, especially after cutting [33,34,35] and burnishing operations [36,37]. Tomov et al. [33] and Molnár and Sztankovics [35] investigated the tribological significance of the parameters, while Skoczylas and Kłonica [36] highlighted the effect of lubricants. Kubatova and Melichar [37] confirmed that the parameters of the curve are independent of software filters. Although the method is reliable, it is not yet uniformly applied in industrial quality control between manufacturing processes.
Overall, the literature clearly shows that burnishing processes have a positive effect on surface integrity, reduce wear, and increase fatigue life. However, several factors—such as heat effects, lubrication, parameter optimization, and the long-term tribological behavior of different materials—require further research. The challenge for the future is to develop cost-effective burnishing processes that can be applied stably on an industrial scale.
Figure 1 shows the structure of this paper.

3. Materials and Methods

Burnishing is a cold plastic deformation technique commonly applied for the finishing of external cylindrical surfaces. The process offers several benefits, such as reduced surface roughness, enhanced microhardness, the introduction of compressive residual stress, improved dimensional precision, and environmental advantages, as it requires minimal use of lubricants [38].
Figure 2 [39] illustrates the principle of diamond burnishing, where a spherical-tipped diamond tool is pressed against the surface of a rotating workpiece under controlled parameters and force.
The aim of our research is to investigate the surface roughness produced by the diamond burnishing process. To ensure comparable results, uniform test specimens were prepared on machine tools located in the workshop of the Institute of Manufacturing Science of the University of Miskolc. The geometric characteristics of the test specimens used for the burnishing experiments were as follows: five consecutive cylindrical surfaces with a diameter of Ø47.20 mm and a length of 26 mm. There was 5 mm wide grooving between the cylindrical parts. The turning technological parameters were kept uniform across all specimens:
v c   t u r n i n g = 82.8   m / m i n ;   f t u r n i n g = 0.05   m m / r e v
This uniformity allowed us not only to examine the roughness of the surface after diamond burnishing but also to quantify the extent of surface improvements specifically, the enhancement in surface quality compared to the original turned surface. This comparison is particularly important, as identical turning parameters do not always yield identical surface roughness outcomes.
The material of the specimen is X5CrNi18-10 (PROFILINOX S.p.A., Parma, Italy) austenitic stainless chromium–nickel steel alloy. This material grade is one of the most widely utilized stainless steels due to its exceptional corrosion resistance, excellent cold formability, and good weldability. It exhibits notable resistance to dilute acids, freshwater, and atmospheric moisture, making it suitable for a broad range of industrial applications. This material is commonly employed in the automotive industry, particularly in vehicle manufacturing, as well as in mechanical and equipment engineering, where it is used for components such as machine parts and pump elements. A key advantage of X5CrNi18-10 is its high resistance to intergranular corrosion, a property that can be further enhanced through surface modification techniques such as diamond burnishing. The chemical composition of X5CrNi18-10 is provided in Table 1 [40], while its mechanical properties are listed in Table 2 [40].
The physical properties of X5CrNi18-10 stainless steel at 20 °C are as follows [40]: density—7.9 g/cm3, specific heat capacity—500 J/kg·K, thermal conductivity—15 W/m·K, and electrical resistivity—0.73 Ω·mm2/m.
The burnishing experiments were carried out on a refurbished and structurally rigid EU-400/01 SZIM lathe (Machine Tool Works, Budapest, Hungary). A polycrystalline diamond (PCD) burnishing tool with a tip radius of R = 3.5 mm was employed. Lubrication was applied manually using SAE 15W-40 oil (Motorex, Bützberg, Switzerland) in a quantity of Qₒ = (5 ± 1) × 10−6 m3.
The technological parameters of diamond burnishing were combined using two feed rates, two spindle speeds, and four burnishing forces. The independent parameter combinations are given in Table 3.
Feed rate:
f 1 = 0.0125   m m / r e v ;   f 2 = 0.05   m m / r e v ;   f 3 = 0.1   m m / r e v
Workpiece RPM:
n 1 = 265 × 1 / m i n ;   n 2 = 375 × 1 / m i n
Burnishing force (the force set directly on the machine tool via spring preload):
F 1 = 20   N ;   F 2 = 30   N ;   F 3 = 40   N ;   F 4 = 50   N
The burnishing speed can be calculated by Equation (1):
v = D · π · n   m / m i n
where D is the diameter of the specimen.
In this work, surface roughness was evaluated through multiple metrics, including three-dimensional roughness parameters. The measurements were performed using an AltiSurf 520 surface metrology system, with data processing carried out in AltiMap software (version 6.2) supplied with the instrument. Detailed technical specifications for the AltiSurf 520 are available in [41]. The system operates on a non-contact, optical measurement principle, incorporating confocal chromatic, interferometric, and other techniques. Its measurement range extends from 100 µm to 25 mm, with a vertical (Z) resolution of up to 2 nm and a lateral resolution of 0.7 µm. Step-height accuracy for a 1 µm standard is 0.005%. The lowest measurable roughness (Ra/Sa) is 20 nm/20 nm, in compliance with ISO 21920-2 [42] and ISO 25178 [43]. All measurements were conducted in the metrology laboratory of the Institute of Manufacturing Science at the University of Miskolc, under consistent laboratory conditions and identical instrument settings. Environmental factors such as temperature and humidity were controlled to reduce measurement uncertainty and ensure reproducibility of results.

4. Measurement Results

This chapter contains the results of the examination of 3D Surface Roughness Parameters, the use of full Factorial Experiment Design analysis for the examination of functional volume area roughness parameters, and the examination of functional volume area roughness parameters for the case when workpiece feed is constant.

4.1. Examination of 3D Surface Roughness Parameters

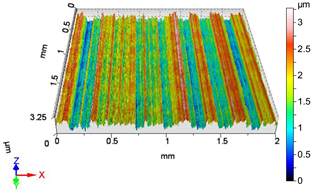
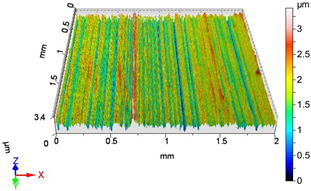
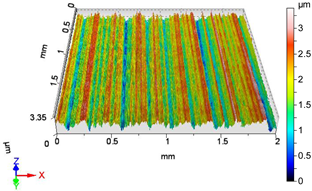
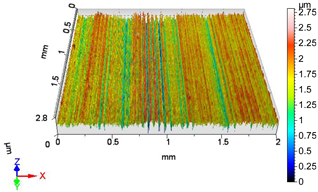
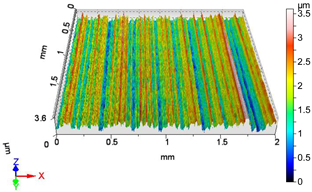
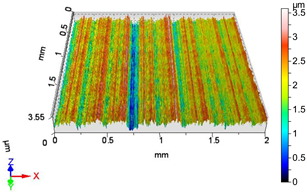
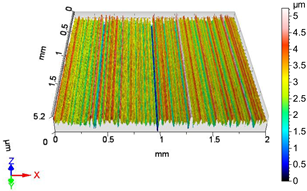
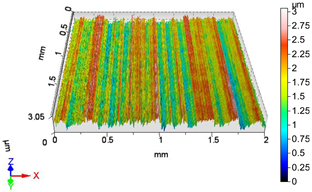
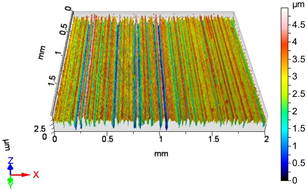
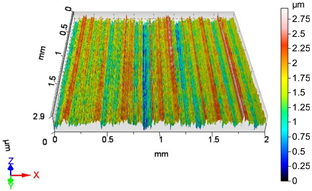
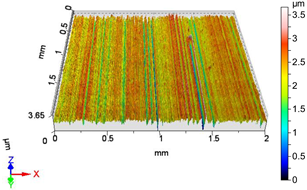
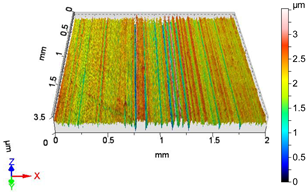
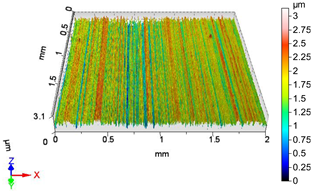
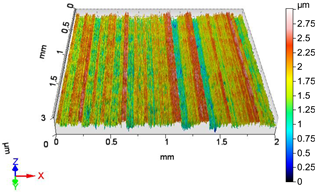
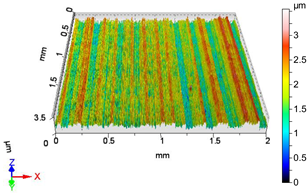
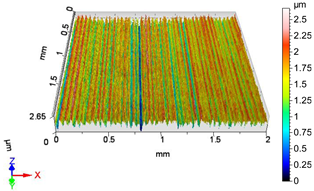
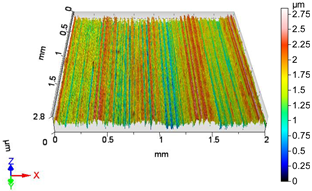
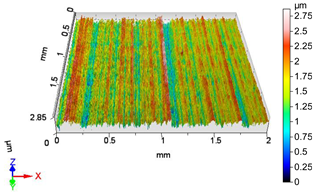
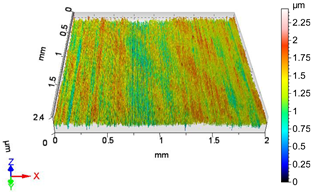
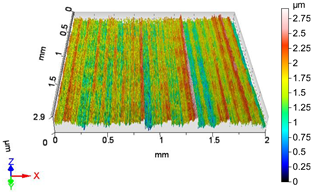
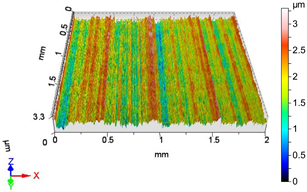
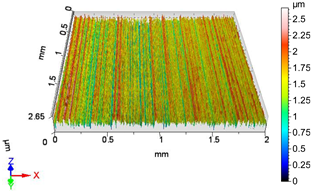
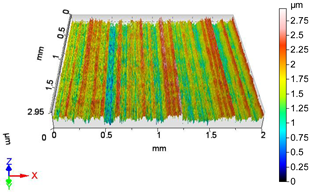
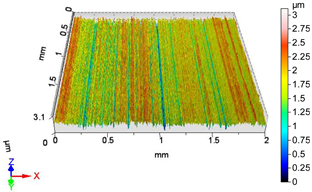
After executing the experiments and measuring the 3D surface roughness parameters we summarized the measured data to Table 4. Table 4 contains the measured 3D surface roughness parameters (arithmetical mean height (Sa), root mean square height (Sq), maximum height (Sz), maximum peak height (Sp), maximum pit depth (Sv), skewness (Ssk), kurtosis (Sku)) for parameter variations V1–V16, before and after burnishing.
The enhancement of surface roughness achieved through diamond burnishing was evaluated using so-called improvement factors. Since the surface condition and corresponding roughness parameters after turning (i.e., prior to diamond burnishing) can vary, establishing the initial state is essential for accurately assessing the effect of the burnishing process. The improvement factor was determined according to Equation (2). This equation represents a general formulation that can be applied to various surface roughness parameters, where “I” denotes the improvement, “X” corresponds to “S” for 3D parameters, and “y” serves as a placeholder for different types of roughness metrics (e.g.: y can be “a”, “q” and “z”).
I X y = X y ; a f t e r   b u r n i s h i n g X y ; b e f o r e   b u r n i s h i n g X y ; b e f o r e   b u r n i s h i n g · 100   %
The measured 3D surface roughness parameters and the calculated improvement ratios for the F1F4; F2F4, and F3F4 burnishing force variants are contained in Table A1.
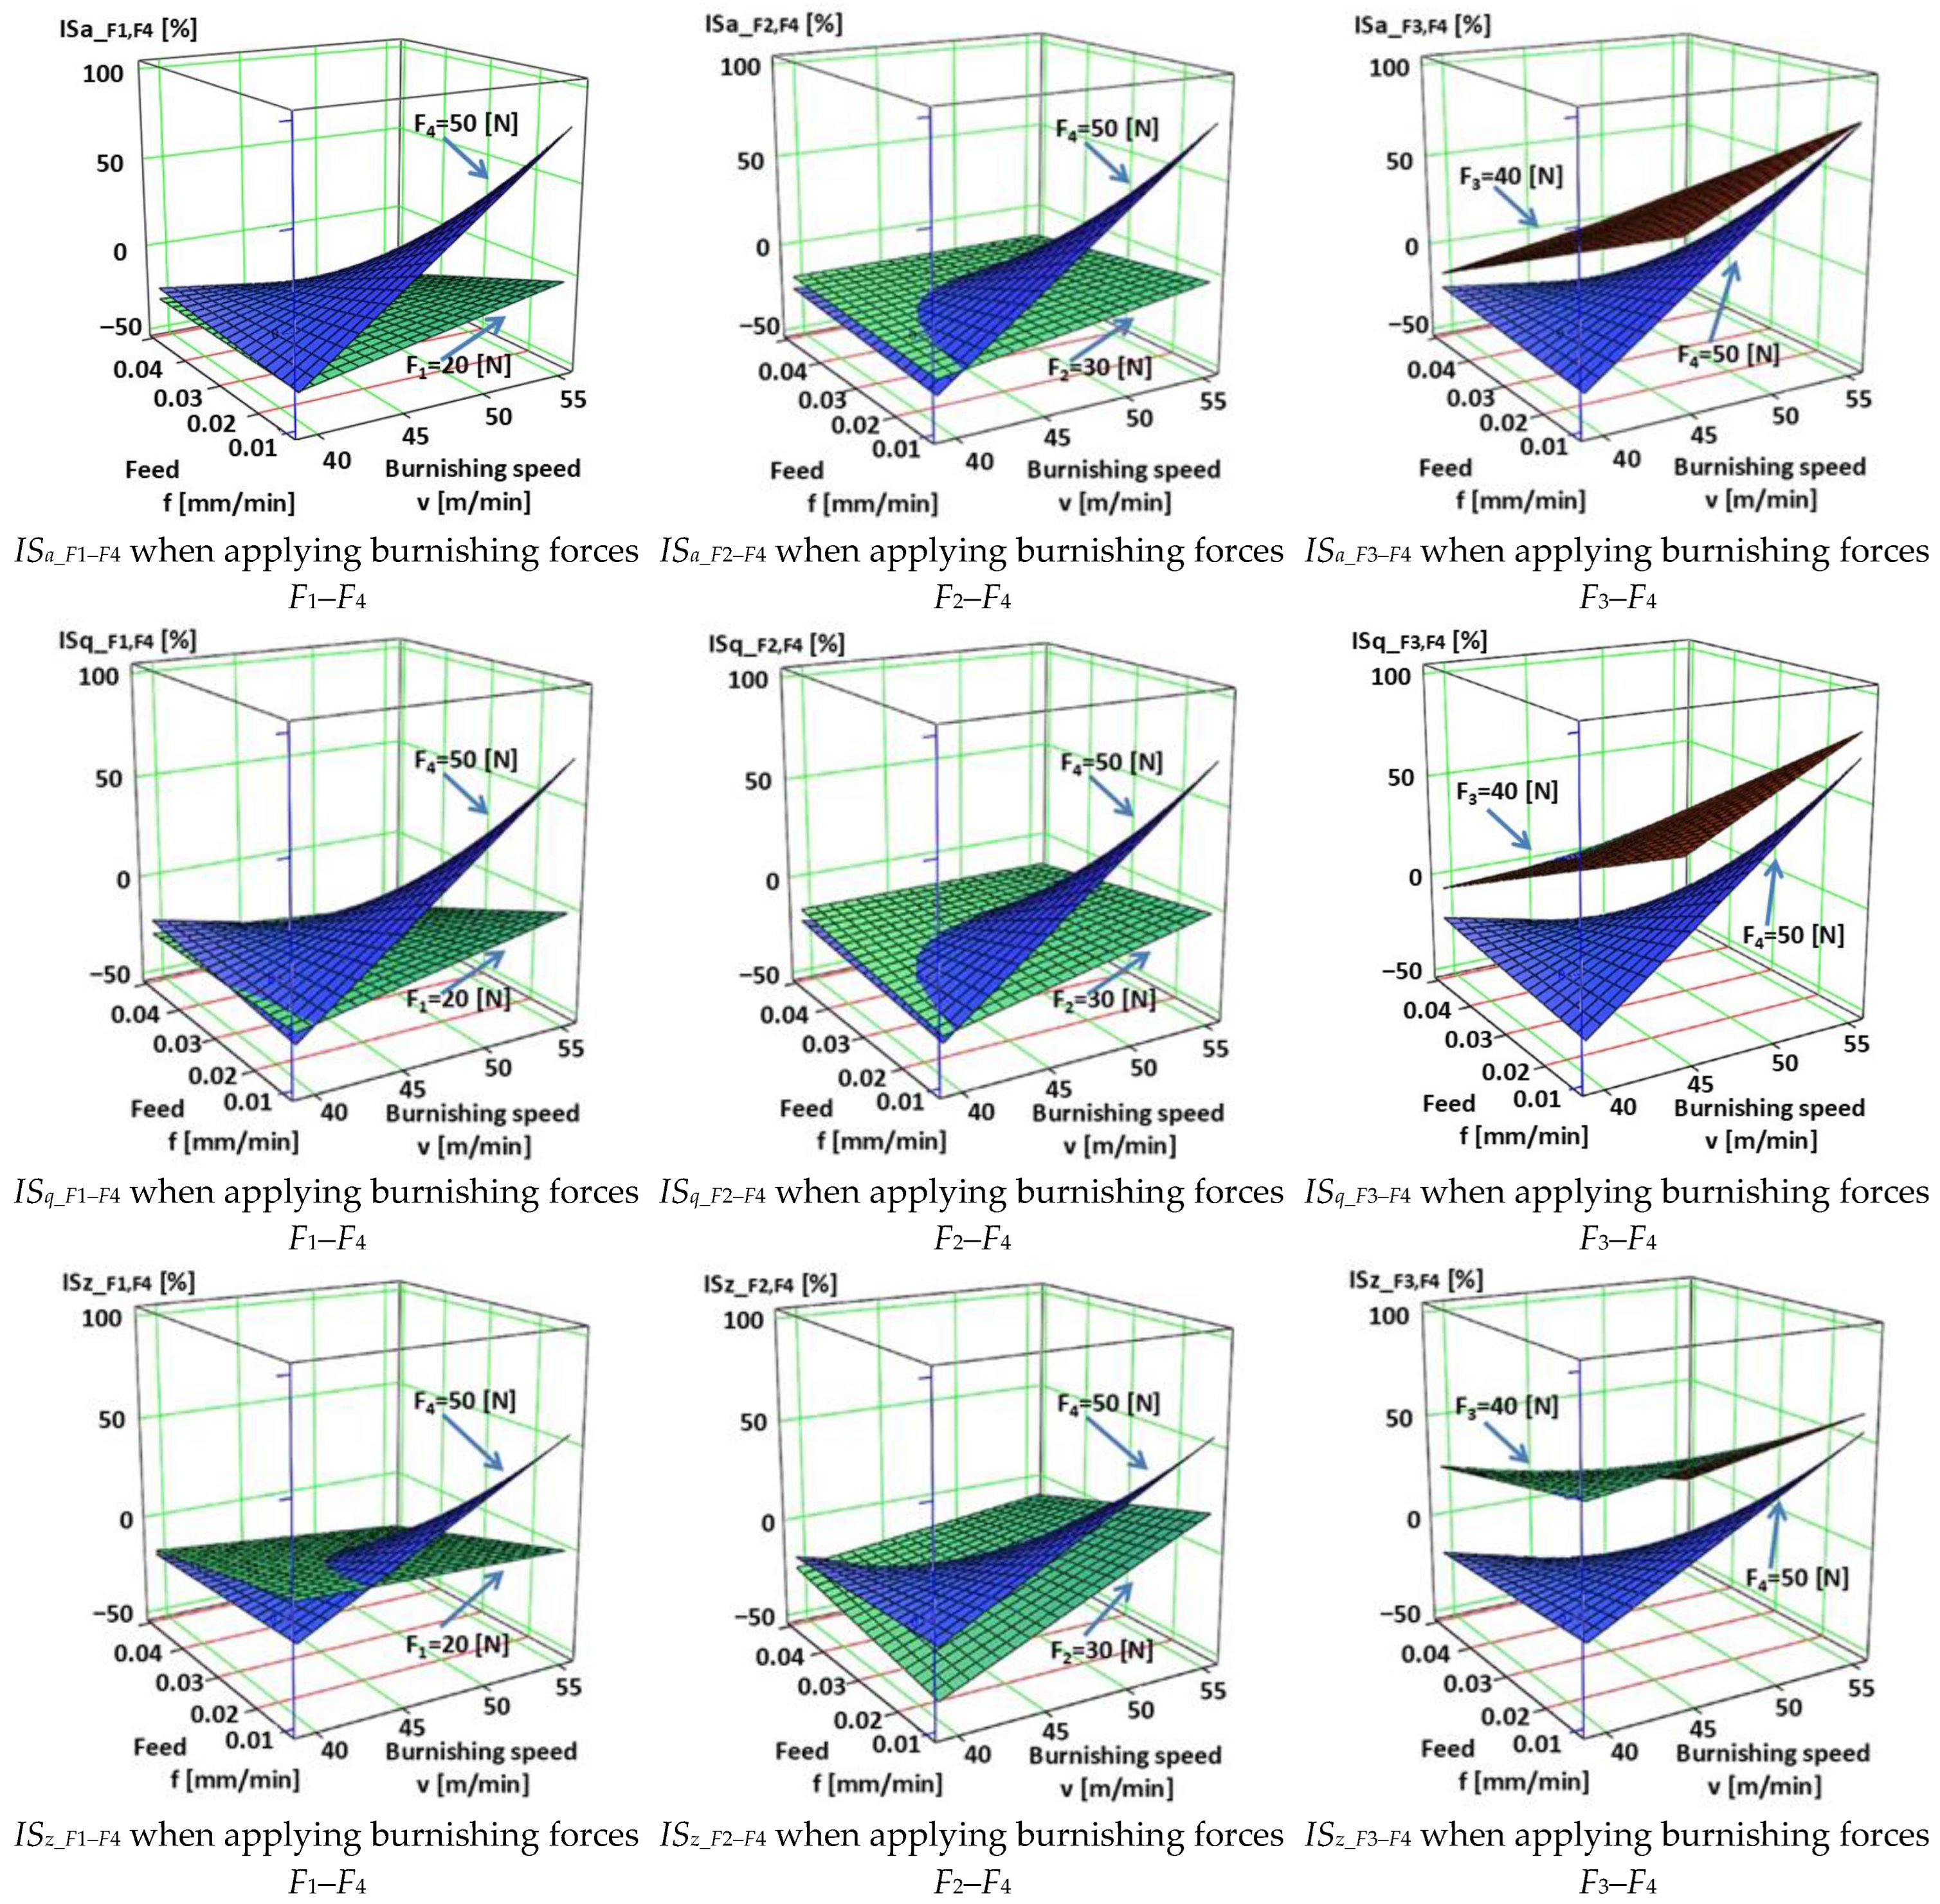
The empirical Equations (3)–(11) relate to ISa, ISq, and ISz when comparing the results belonging to F1F4, F2F4, and F3F4 burnishing forces. They were determined on the base of Factorial Experiment Design [44] with MathCAD 15 and are illustrated in Figure 3.
I S a _ F 1 F 4 = 53.7326 2.151 v 1.554 × 10 3 f 9.325 F + 37.016 v · f + 0.235 v · F + 204.671 f · F 5.051 v · f · F
I S a _ F 1 F 4   R 2 = 0.999954264
I S a _ F 2 F 4 = 385.721 10.175 v 9.33 × 10 3 f 15.965 F + 240.683 v · f + 0.395 v · F + 360.19 f · F 9.124 v · f · F
I S a _ F 2 F 4   R 2 = 0.999659502
I S a _ F 3 F 4 = 1.464 × 10 3 24.84 v 3.212 × 10 4 f 37.52 F + 577.362 v · f + 0.689 v · F + 816.0 f · F 15.858 v · f · F
I S a _ F 3 F 4   R 2 = 0.999257148
I S q _ F 1 F 4 = 64.7205 2.154 v 1.958 × 10 3 f 9.098 F + 42.969 v · f + 0.224 v · F + 214.553 f · F 5.191 v · f · F
I S q _ F 1 F 4   R 2 = 0.999752488
I S q _ F 2 F 4 = 284.083 7.986 v 8.013 × 10 3 f 13.485 F + 215.248 v · f + 0.34 v · F + 335.654 f · F 8.636 v · f · F
I S q _ F 2 F 4   R 2 = 0.999681126
I S q _ F 3 F 4 = 1.317 × 10 3 21.39 v 2.928 × 10 4 f 34.144 F + 530.51 v · f + 0.608 v · F + 760.9 f · F 14.942 v · f · F
I S q _ F 3 F 4   R 2 = 0.999493478
I S z _ F 1 F 4 = 202.772 4.458 v 4.501 × 10 3 f 9.317 F + 92.363 v · f + 0.216 v · F + 220.154 f · F 5.218 v · f · F
I S z _ F 1 F 4   R 2 = 0.99945485
I S z _ F 2 F 4 = 149.581 + 1.524 v 1.887 × 10 3 f 2.27 F + 77.096 v · f + 0.097 v · F + 167.975 f · F 4.913 v · f · F
I S z _ F 2 F 4   R 2 = 0.999594253
I S z _ F 3 F 4 = 930.79 15.58 v 1.416 × 10 4 f 23.877 F + 300.075 v · f + 0.439 v · F + 413.318 f · F 9.372 v · f · F
I S z _ F 3 F 4   R 2 = 0.999882163

4.2. Full Factorial Experiment Design Analysis of Functional Volume Area Roughness Parameters

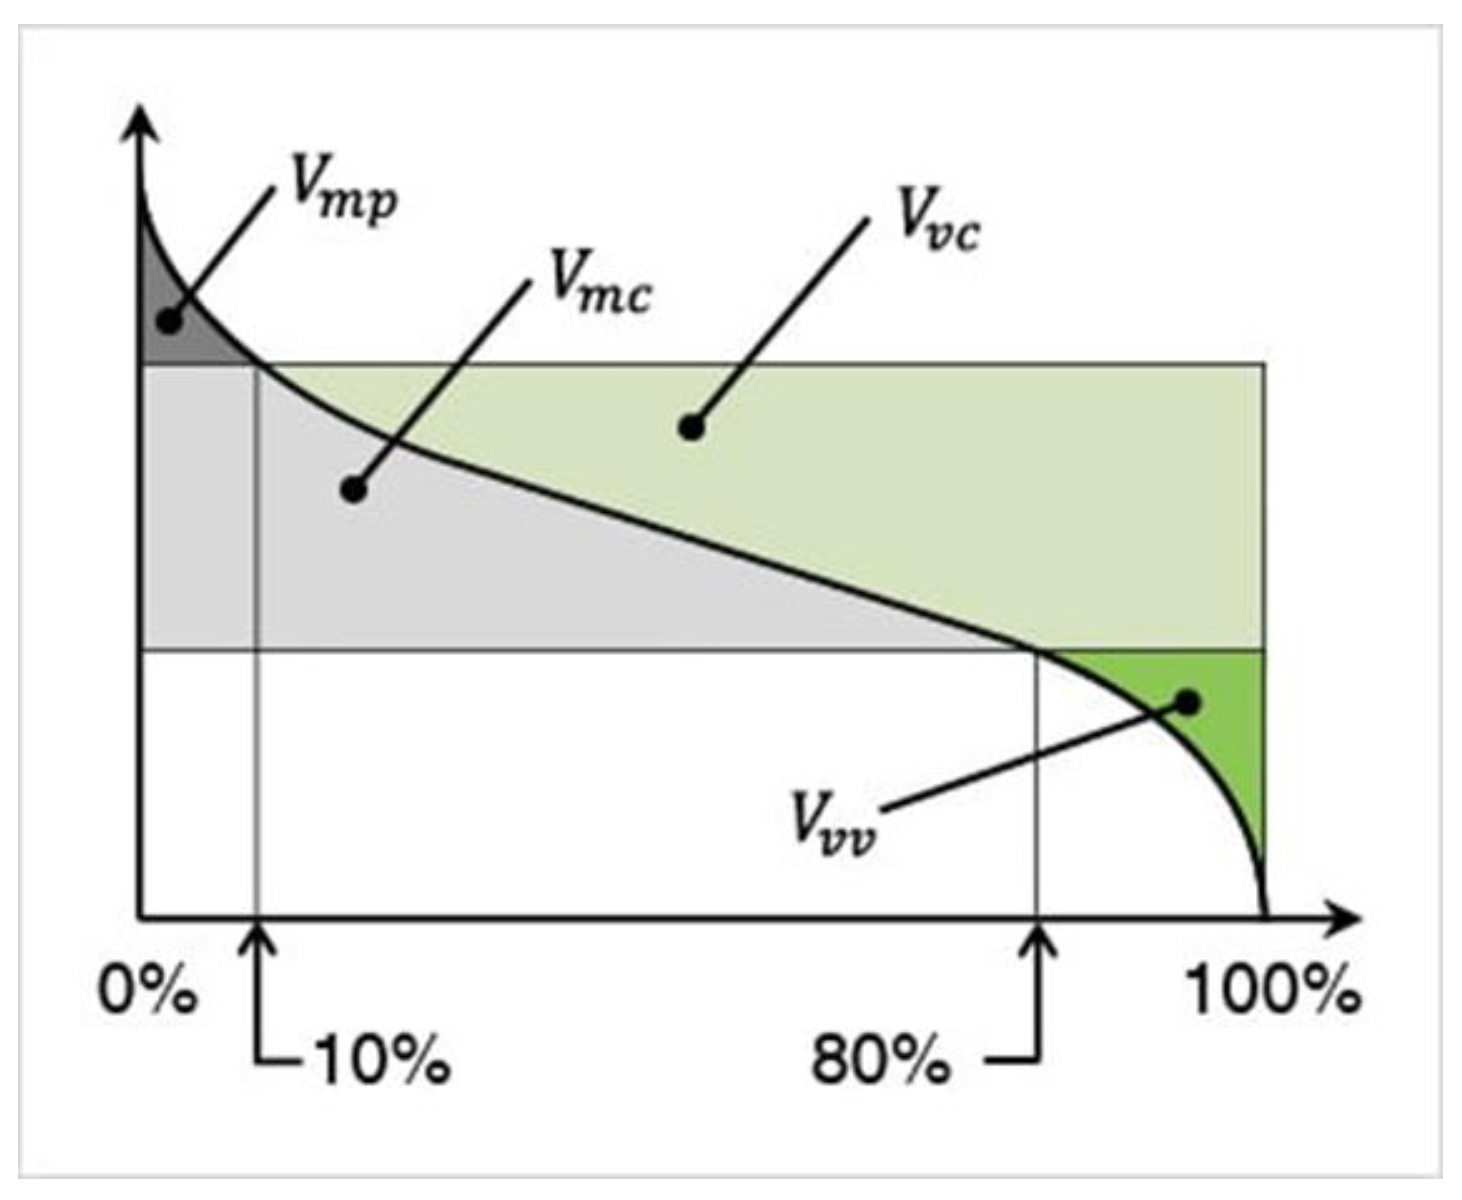
The Abbott–Firestone curve (Figure 4) can also be used for characterization of “surface structure”. In this case, four main volumetric characteristics can be distinguished: Vmp (peak material volume), Vmc (core material volume), Vvc (core void volume), and Vvv (dale void volume). To use volume parameters, it is necessary to specify the material ratio values that separate the reduced peaks and reduced dales from the core surface. By default, p = 10% and q = 80% values are used. Vmc (core material volume) is the volume of material contained within the “core” layer, i.e., between the 10% and 80% levels of the cumulative height distribution. In other words, if all measured points are sorted by height, Vmc is the volume of the “core” mass of the surface. Vmp (peak material volume) refers to the material volume at a p% material ratio. Vvc (core void volume) is the difference between the void volume corresponding to the p% surface material ratio and the void volume corresponding to the q% surface material ratio. Vvv (dale void volume) refers to the dale void volume at a p% surface material ratio [43].
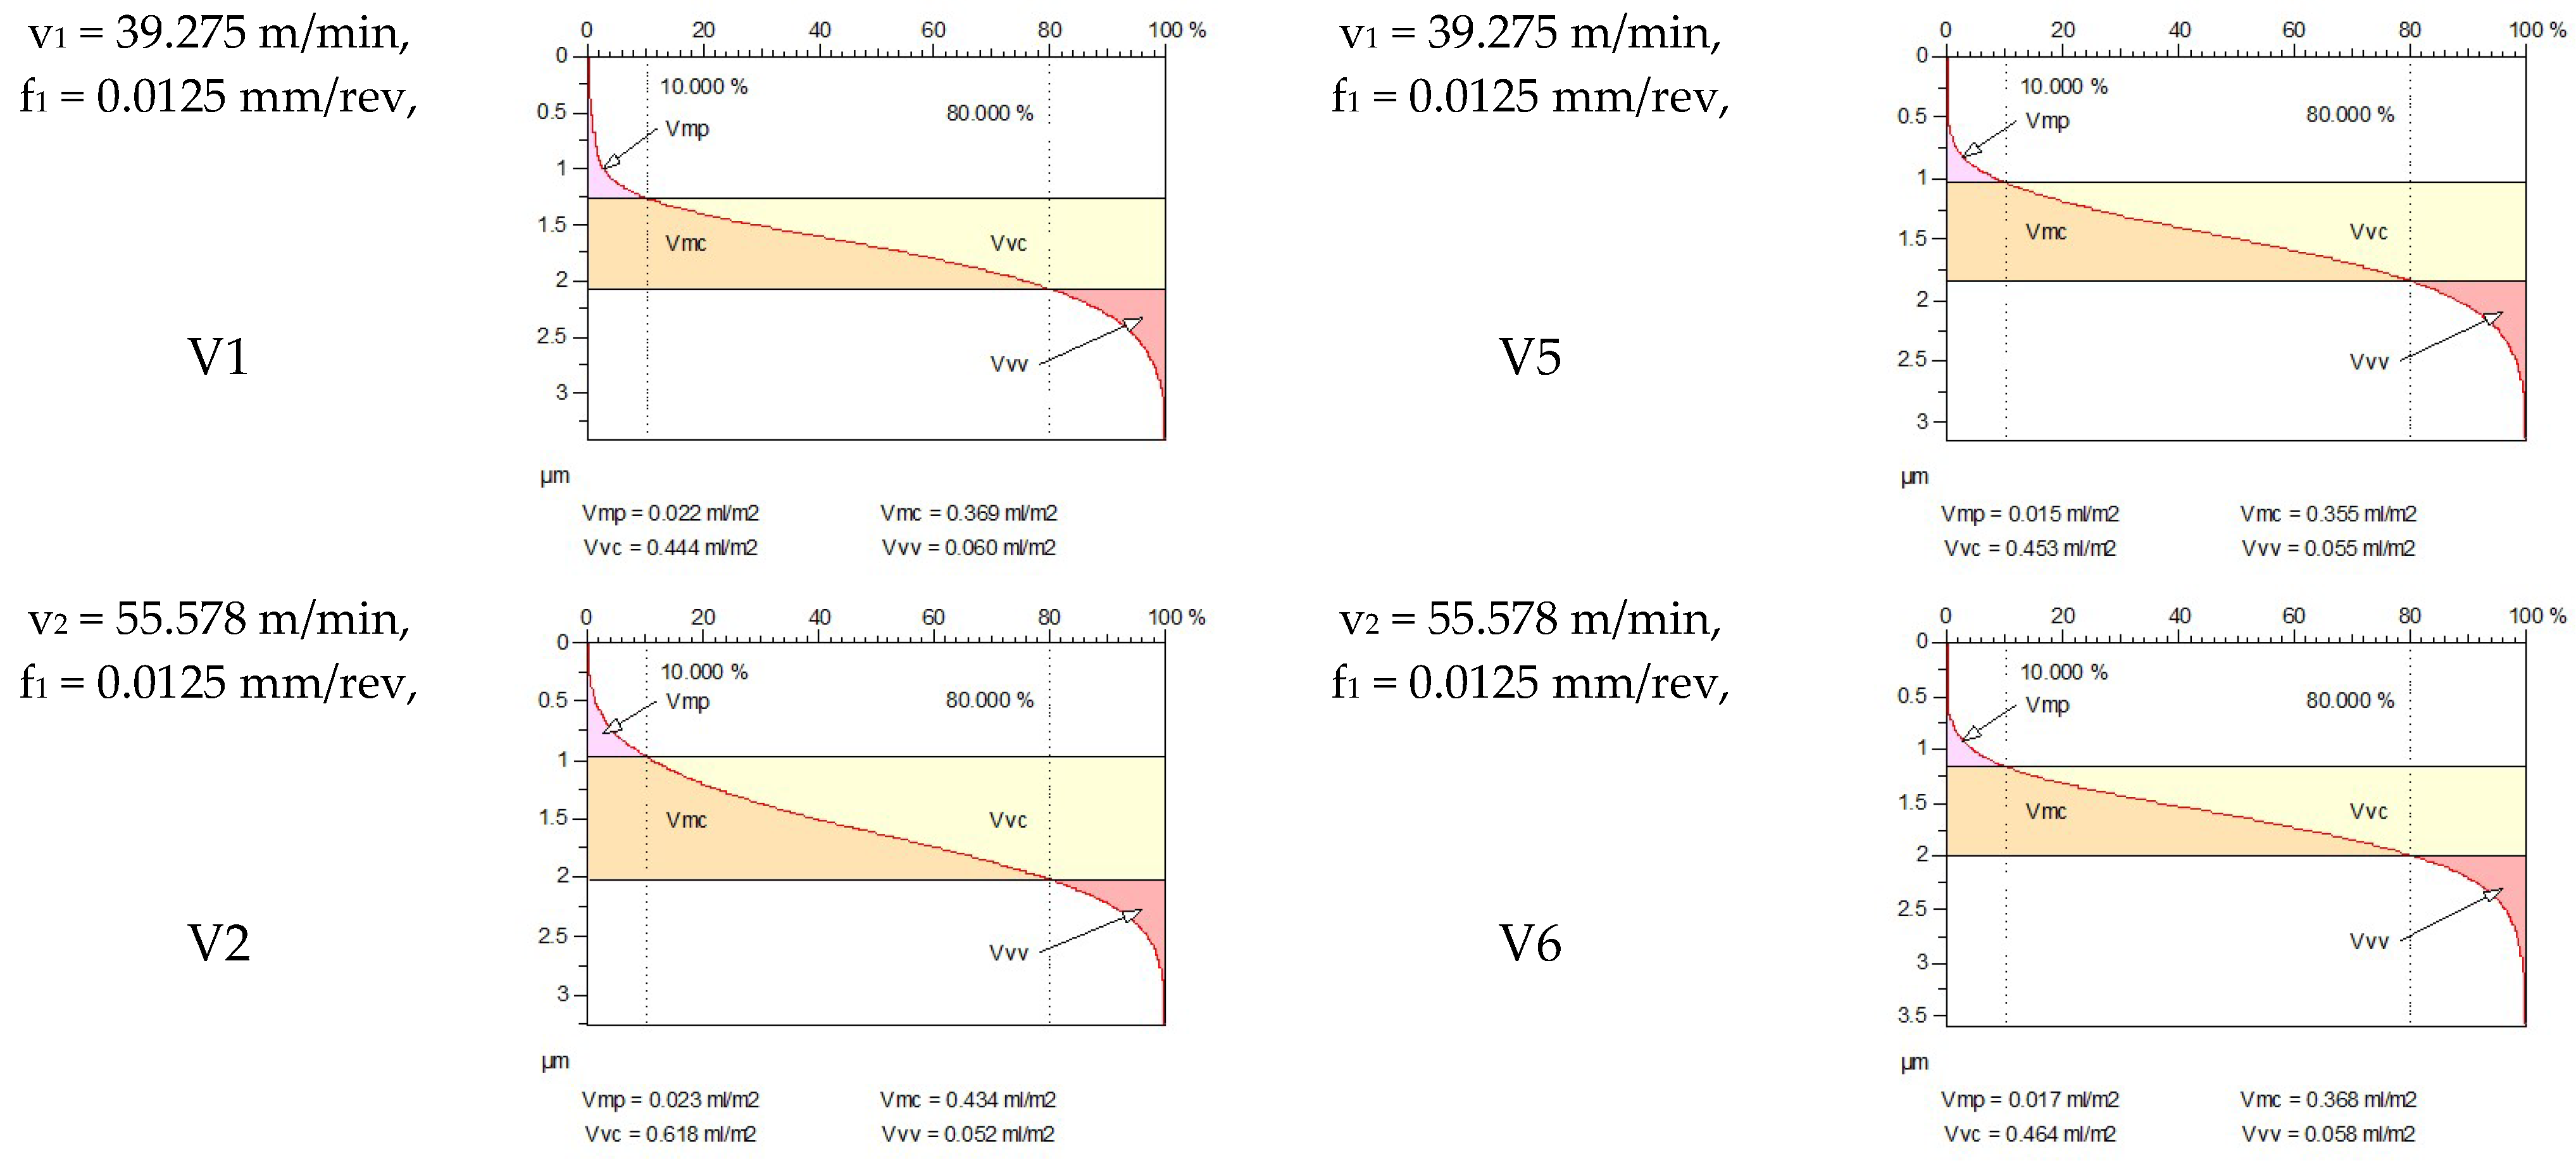
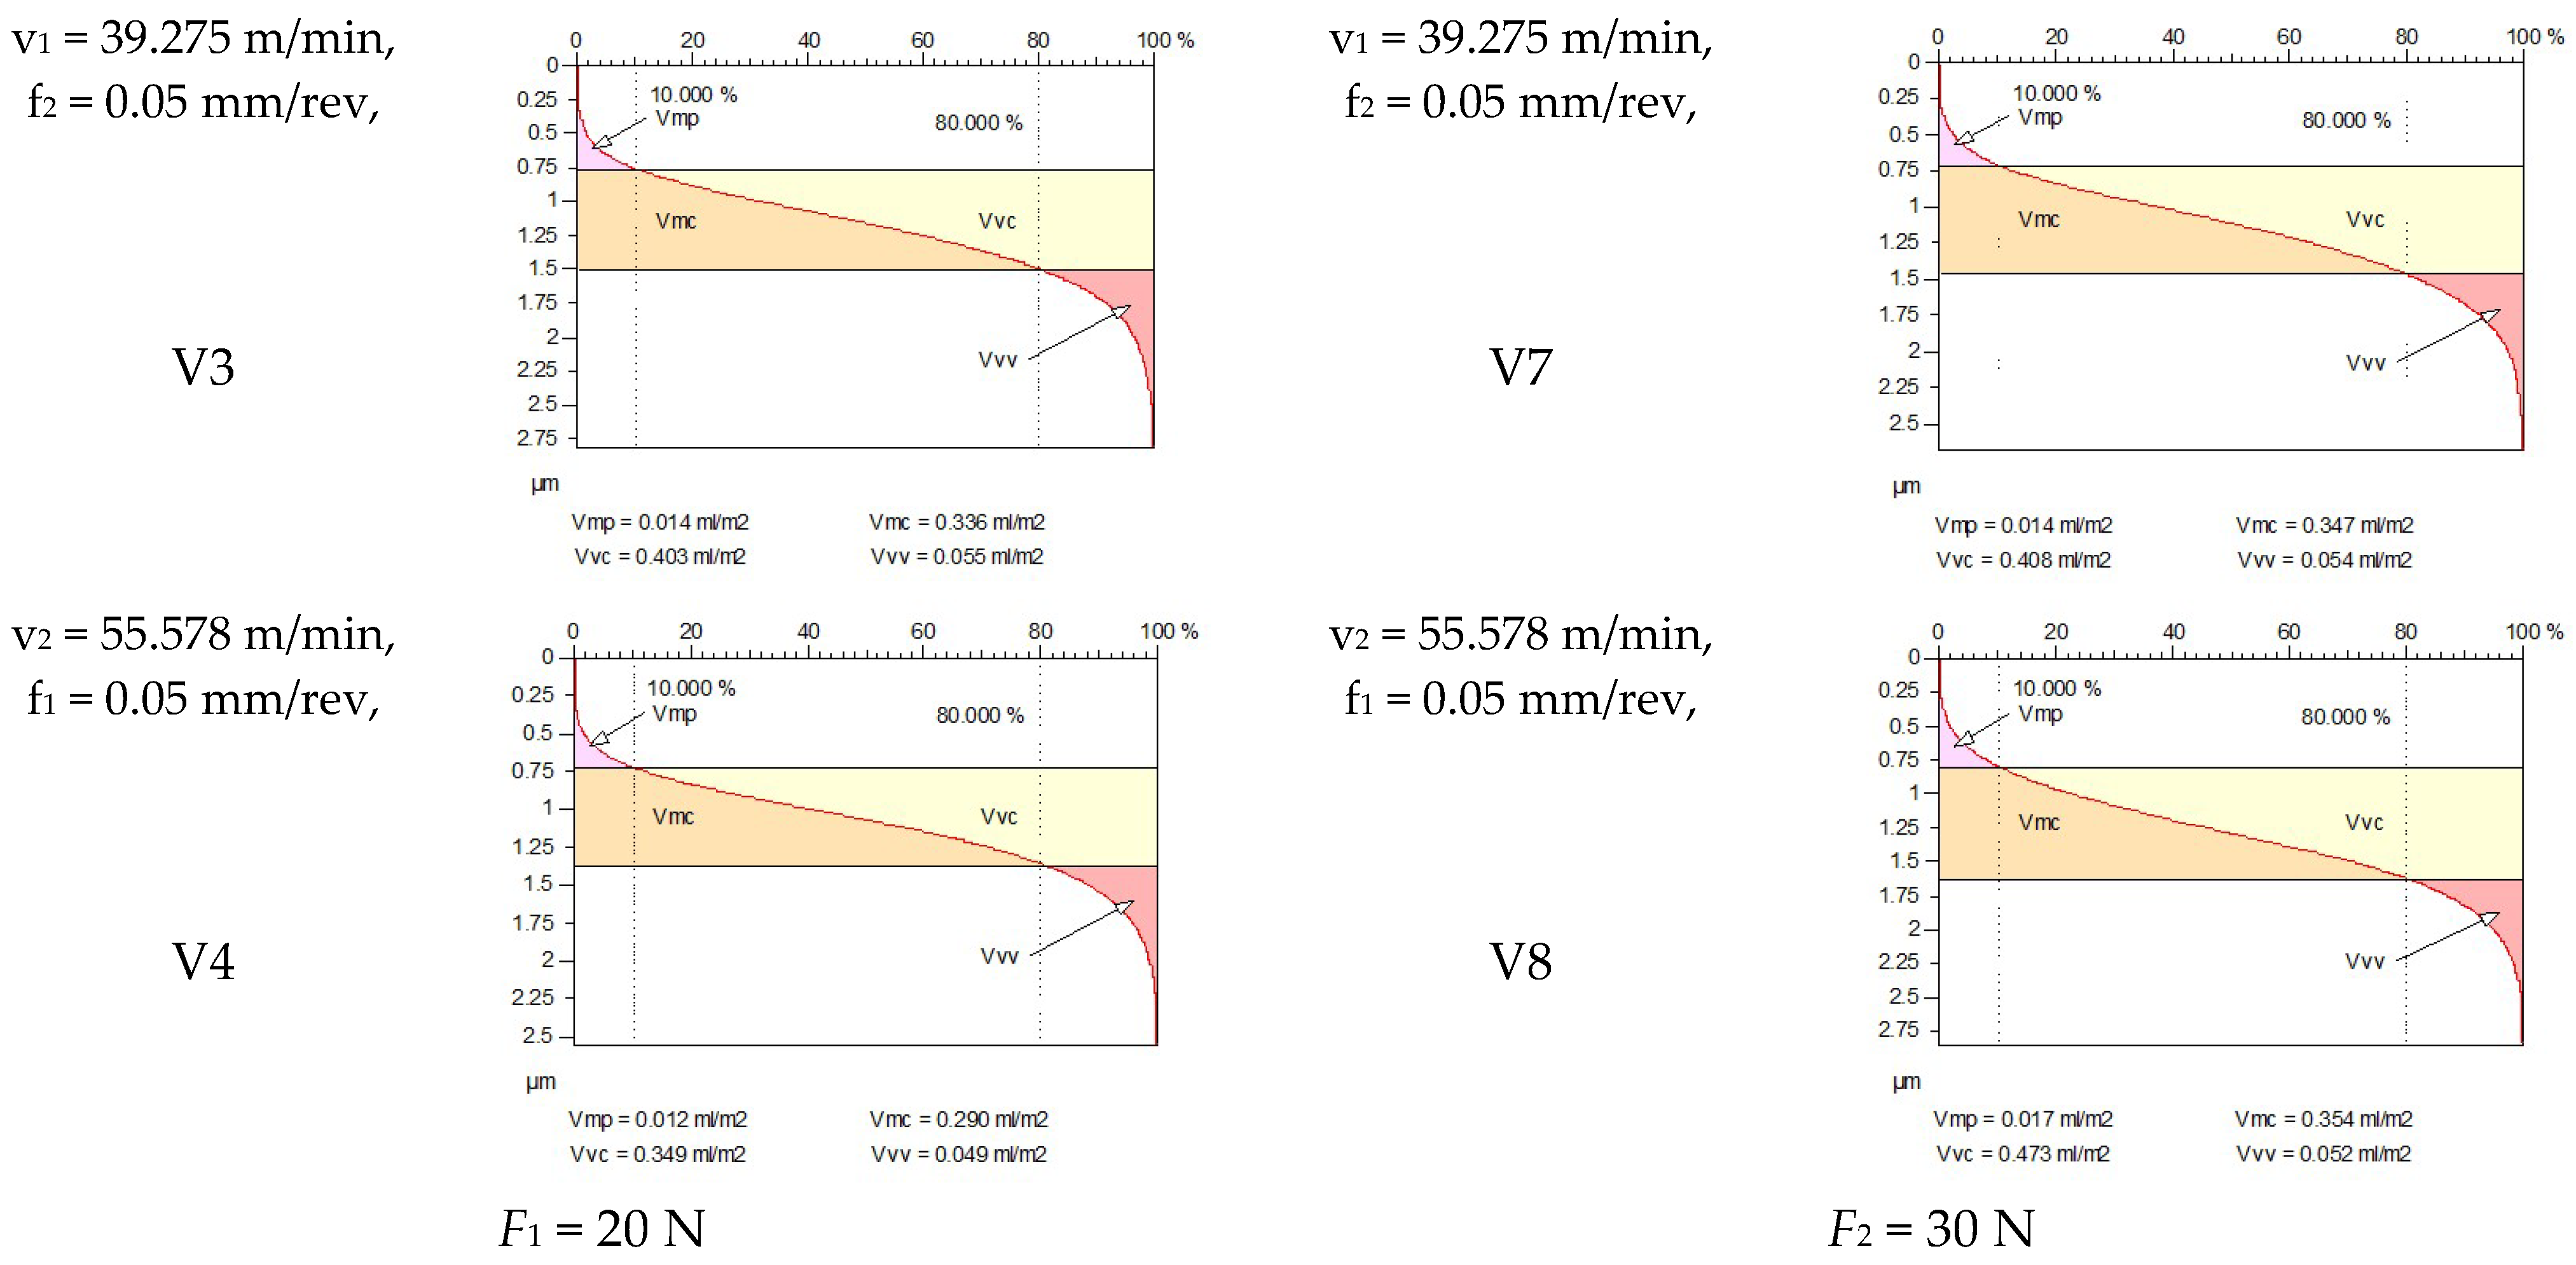
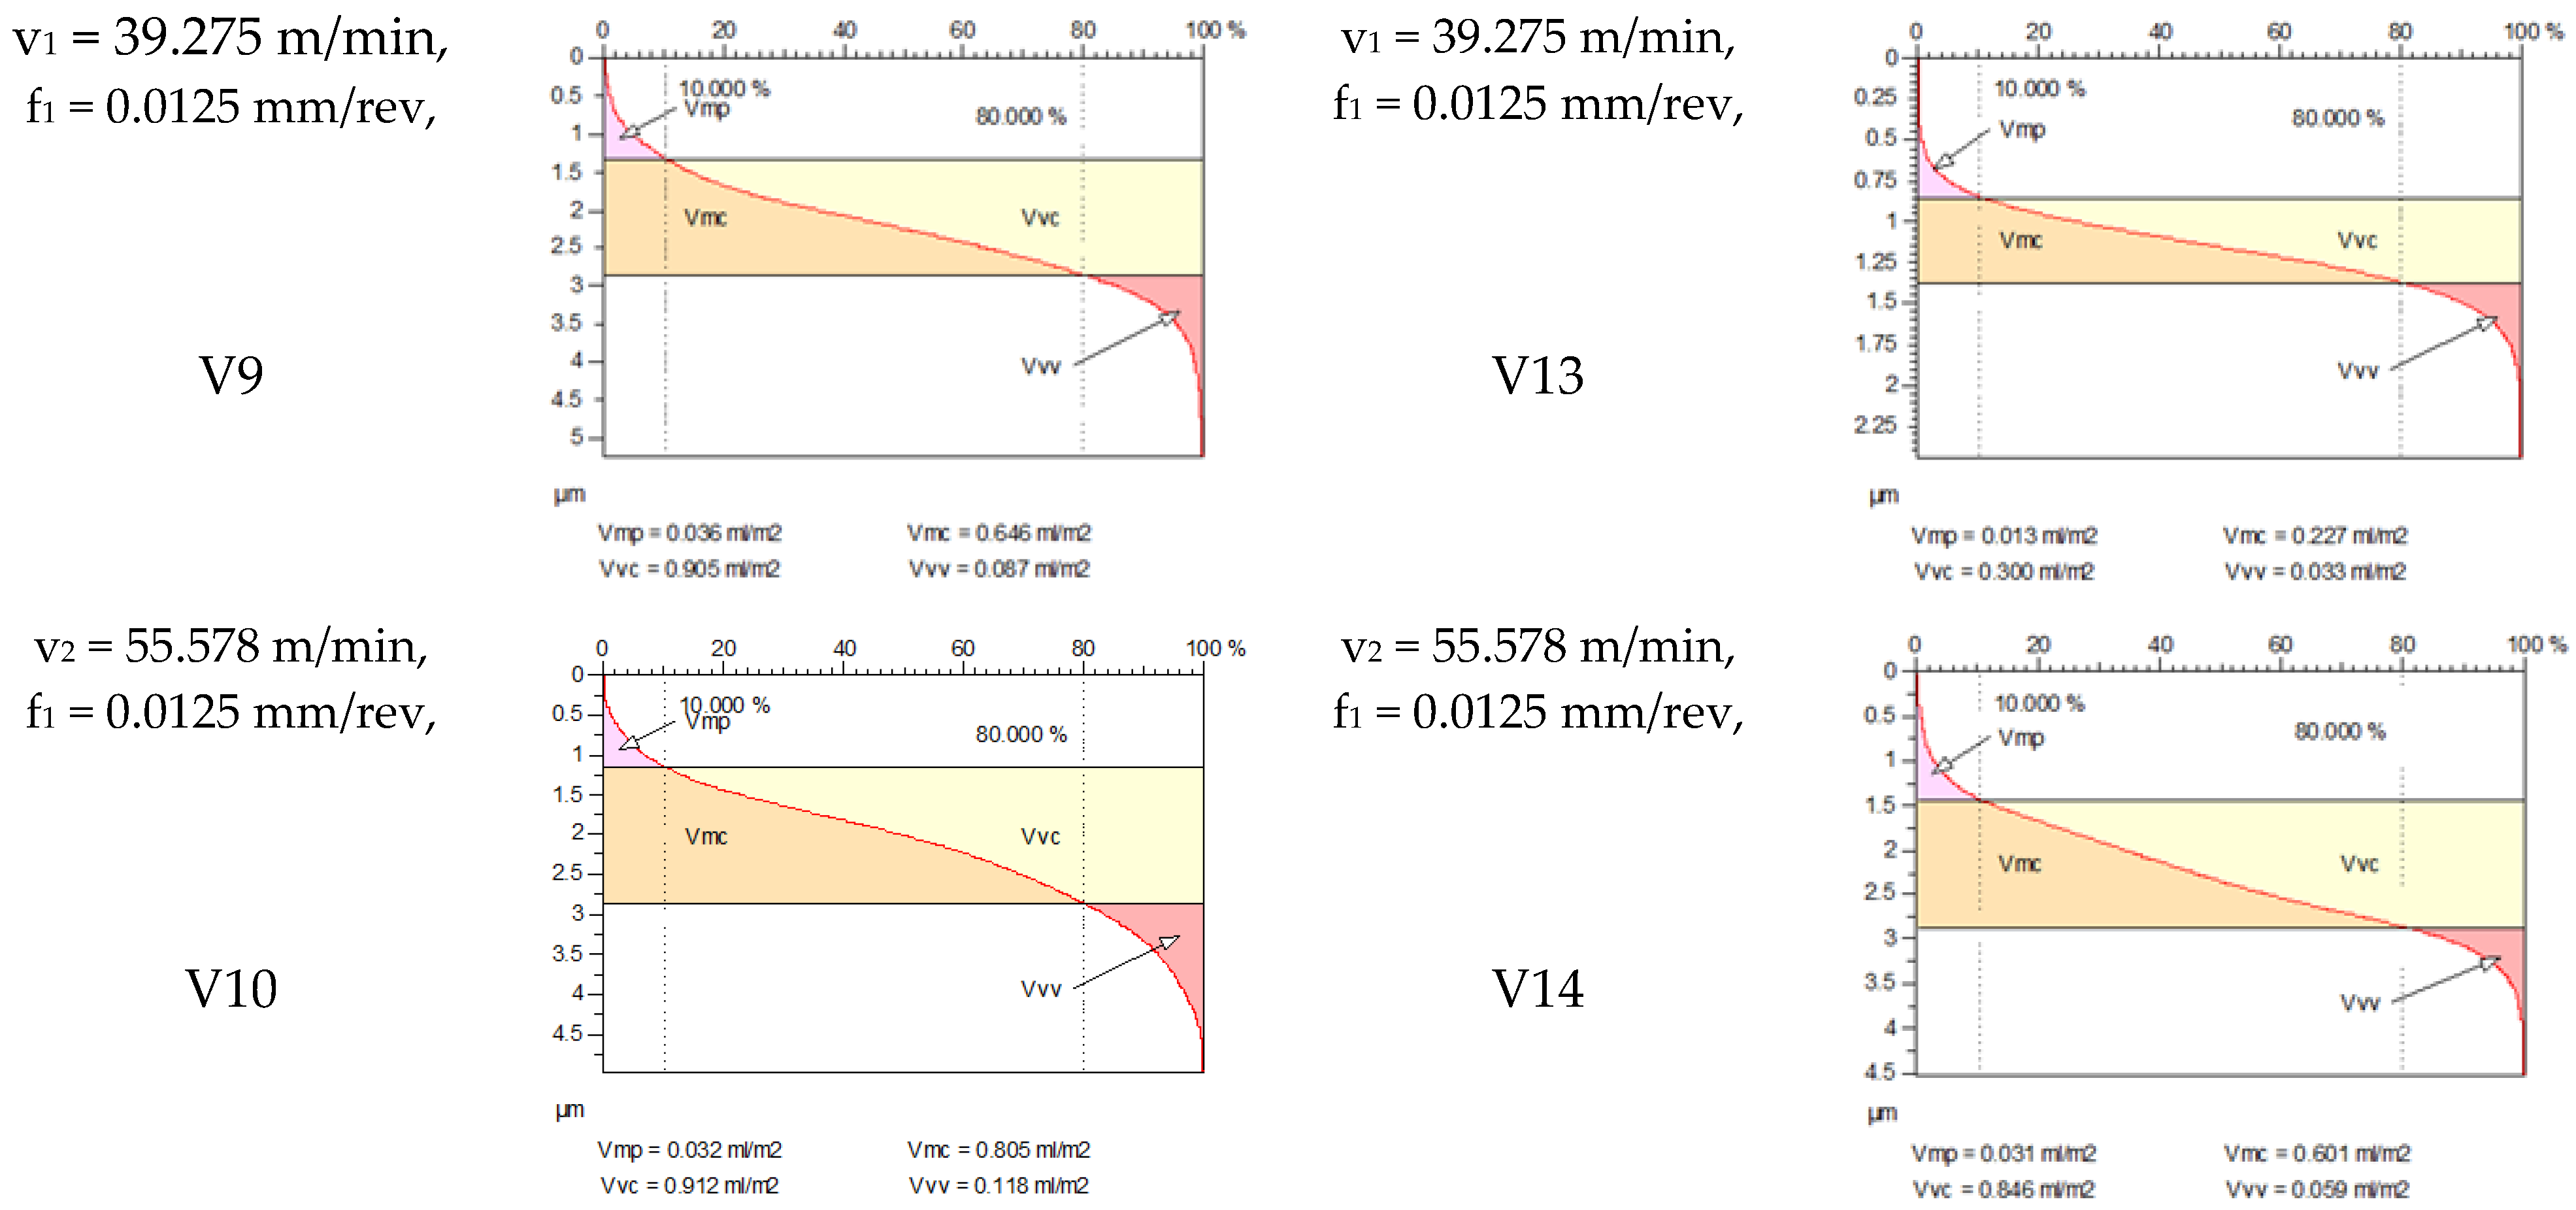
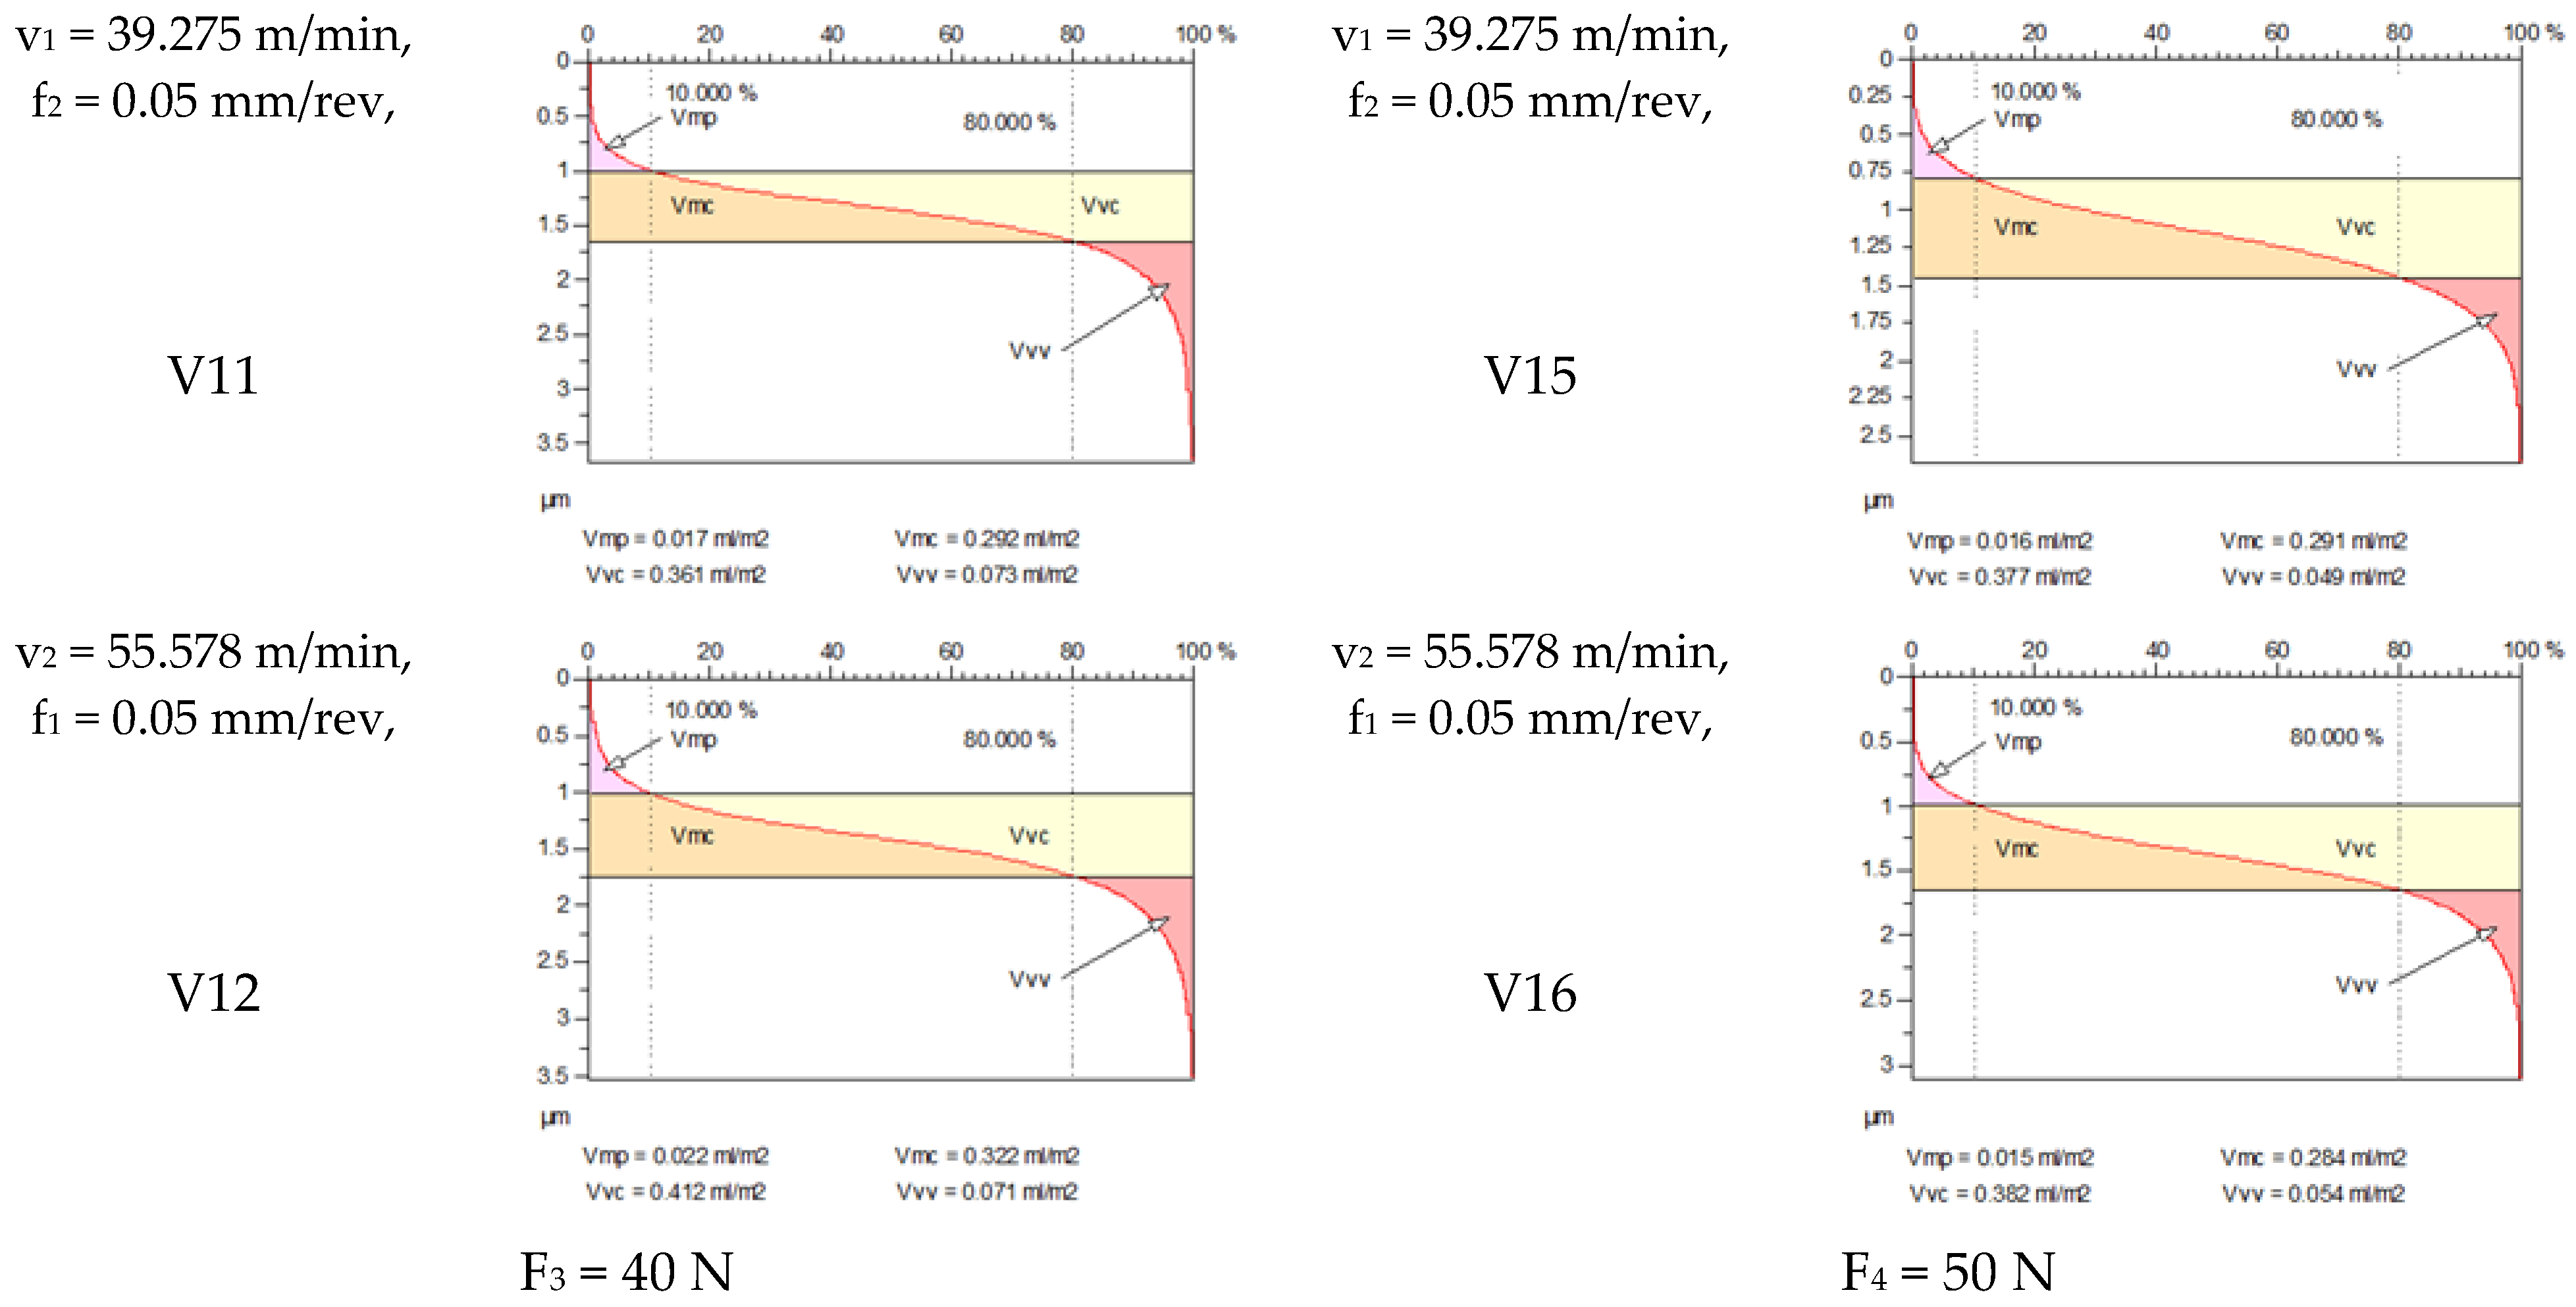
Figure 5 shows the volume parameters calculated on the areal material curve and using default material threshold (10% and 80%) when F1 = 20 N and F2 = 30 N burnishing forces were applied. Figure 5 shows the same when F3 = 40 N and F4 = 50 N burnishing forces were applied. The V1–V16 signs in Figure 4 and Figure 5 relate to the applied technological parameters in Table 3.
Figure 5 and Figure 6 contain the values of the volume parameters, which values are summarized in Table A2. Tribological evaluation of the values in Table A2 are as follows. We create a ratio, Equation (12) which has tribological meaning.
D V m c D V v c = V m c V m c V v c V v c
where DVmc is the difference between the value of core material volume after and before burnishing and DVvc is the difference between the value of core void volume after and before burnishing
The DVmc/DVvc ratio gives the ratio of the surface area to its “core void”/“void capacity”, i.e., how much (core) material (load-bearing zone) is available compared to the volume of the core cavity (lubricant storage). Tribologically, this is an important indicator of the compromise between load capacity, lubricant storage, and mixed/hydrodynamic operation. High DVmc/DVvc a lot of material in the core zone, little void capacity which indicates good dry/asperity load capacity, less lubricant storage. This is advantageous if the primary goal is load-bearing and minimal slip, but is disadvantageous due to weaker oil film formation and faster wear if lubrication is insufficient. Low DVmc/DVvc means relatively high void capacity: good lubricant storage and debris collection, favorable for the development of hydrodynamic/in-field lubrication, but with the disadvantages of lower initial load capacity and higher asperity local stress. This illustrates the rationale for examining the DVmc/DVvc ratio.
The empirical Equations (13)–(15) relating to DVmc/DVvc for F1F4, F2F4, and F3F4 burnishing forces were determined on the base of Factorial Experiment Design [44] with MathCAD 15 and are illustrated in Figure 7.
D V m c / D V v c _ F 1 F 4 = 11.046 0.26 v 208.118 f 0.2 F + 5.224 v · f + 5.051 × 10 3 v · F + 3.979 f · F 0.101 v · f · F
D V m c / D V v c _ F 1 F 4   R 2 = 0.999410262
D V m c / D V v c _ F 2 F 4 = 0.4661 0.01 v 15.483 f 0.012 F + 0.51 v · f + 0.0001 v · F + 0.1258 f · F 6.87 × 10 3 v · f · F
D V m c / D V v c _ F 2 F 4   R 2 = 1.0
D V m c / D V v c _ F 3 F 4 = 10.48 + 0.259 v + 223.7 f + 0.231 F 5.401 v · f 5.411 × 10 3 v · F 4.66 f · F + 0.1116 v · f · F
D V m c / D V v c _ F 3 F 4   R 2 = 1.0

4.3. Examination of Functional Volume Area Roughness Parameters When Workpiece Feed Is Constant

Table A3 contains the measured values of functional volume area roughness parameters Vmp (peak material volume), Vmc (core material volume), Vvc (core void volume), and (Vvv (dale void volume) for parameter variations F1–F8, before and after burnishing. In these examinations the burnishing feed was constant (f3 = 0.1 mm/rev). Other technological parameters can be seen in Table A3.
Similarly to the improvement factors for the 3D roughness parameters presented in Equation (2), the formula can also be written for the improvement of functional volume area roughness parameters (Vmp, Vmc, Vvc, and Vvv). The improvement factor was determined (similarly to Equation (1)) according to Equation (16). This equation represents a general formulation that can be applied to various surface roughness parameters, where “I” denotes the improvement, “Y” corresponds to “ V (different functional volume area roughness parameters)”, and “y” serves as a placeholder for different types of roughness metrics (e.g.,: y can be “mp”, “mc”, “vc” or “vv”).
I Y y = Y b e f o r e   b u r n i s h i n g Y a f t e r   b u r n i s h i n g Y b e f o r e   b u r n i s h i n g · 100   %
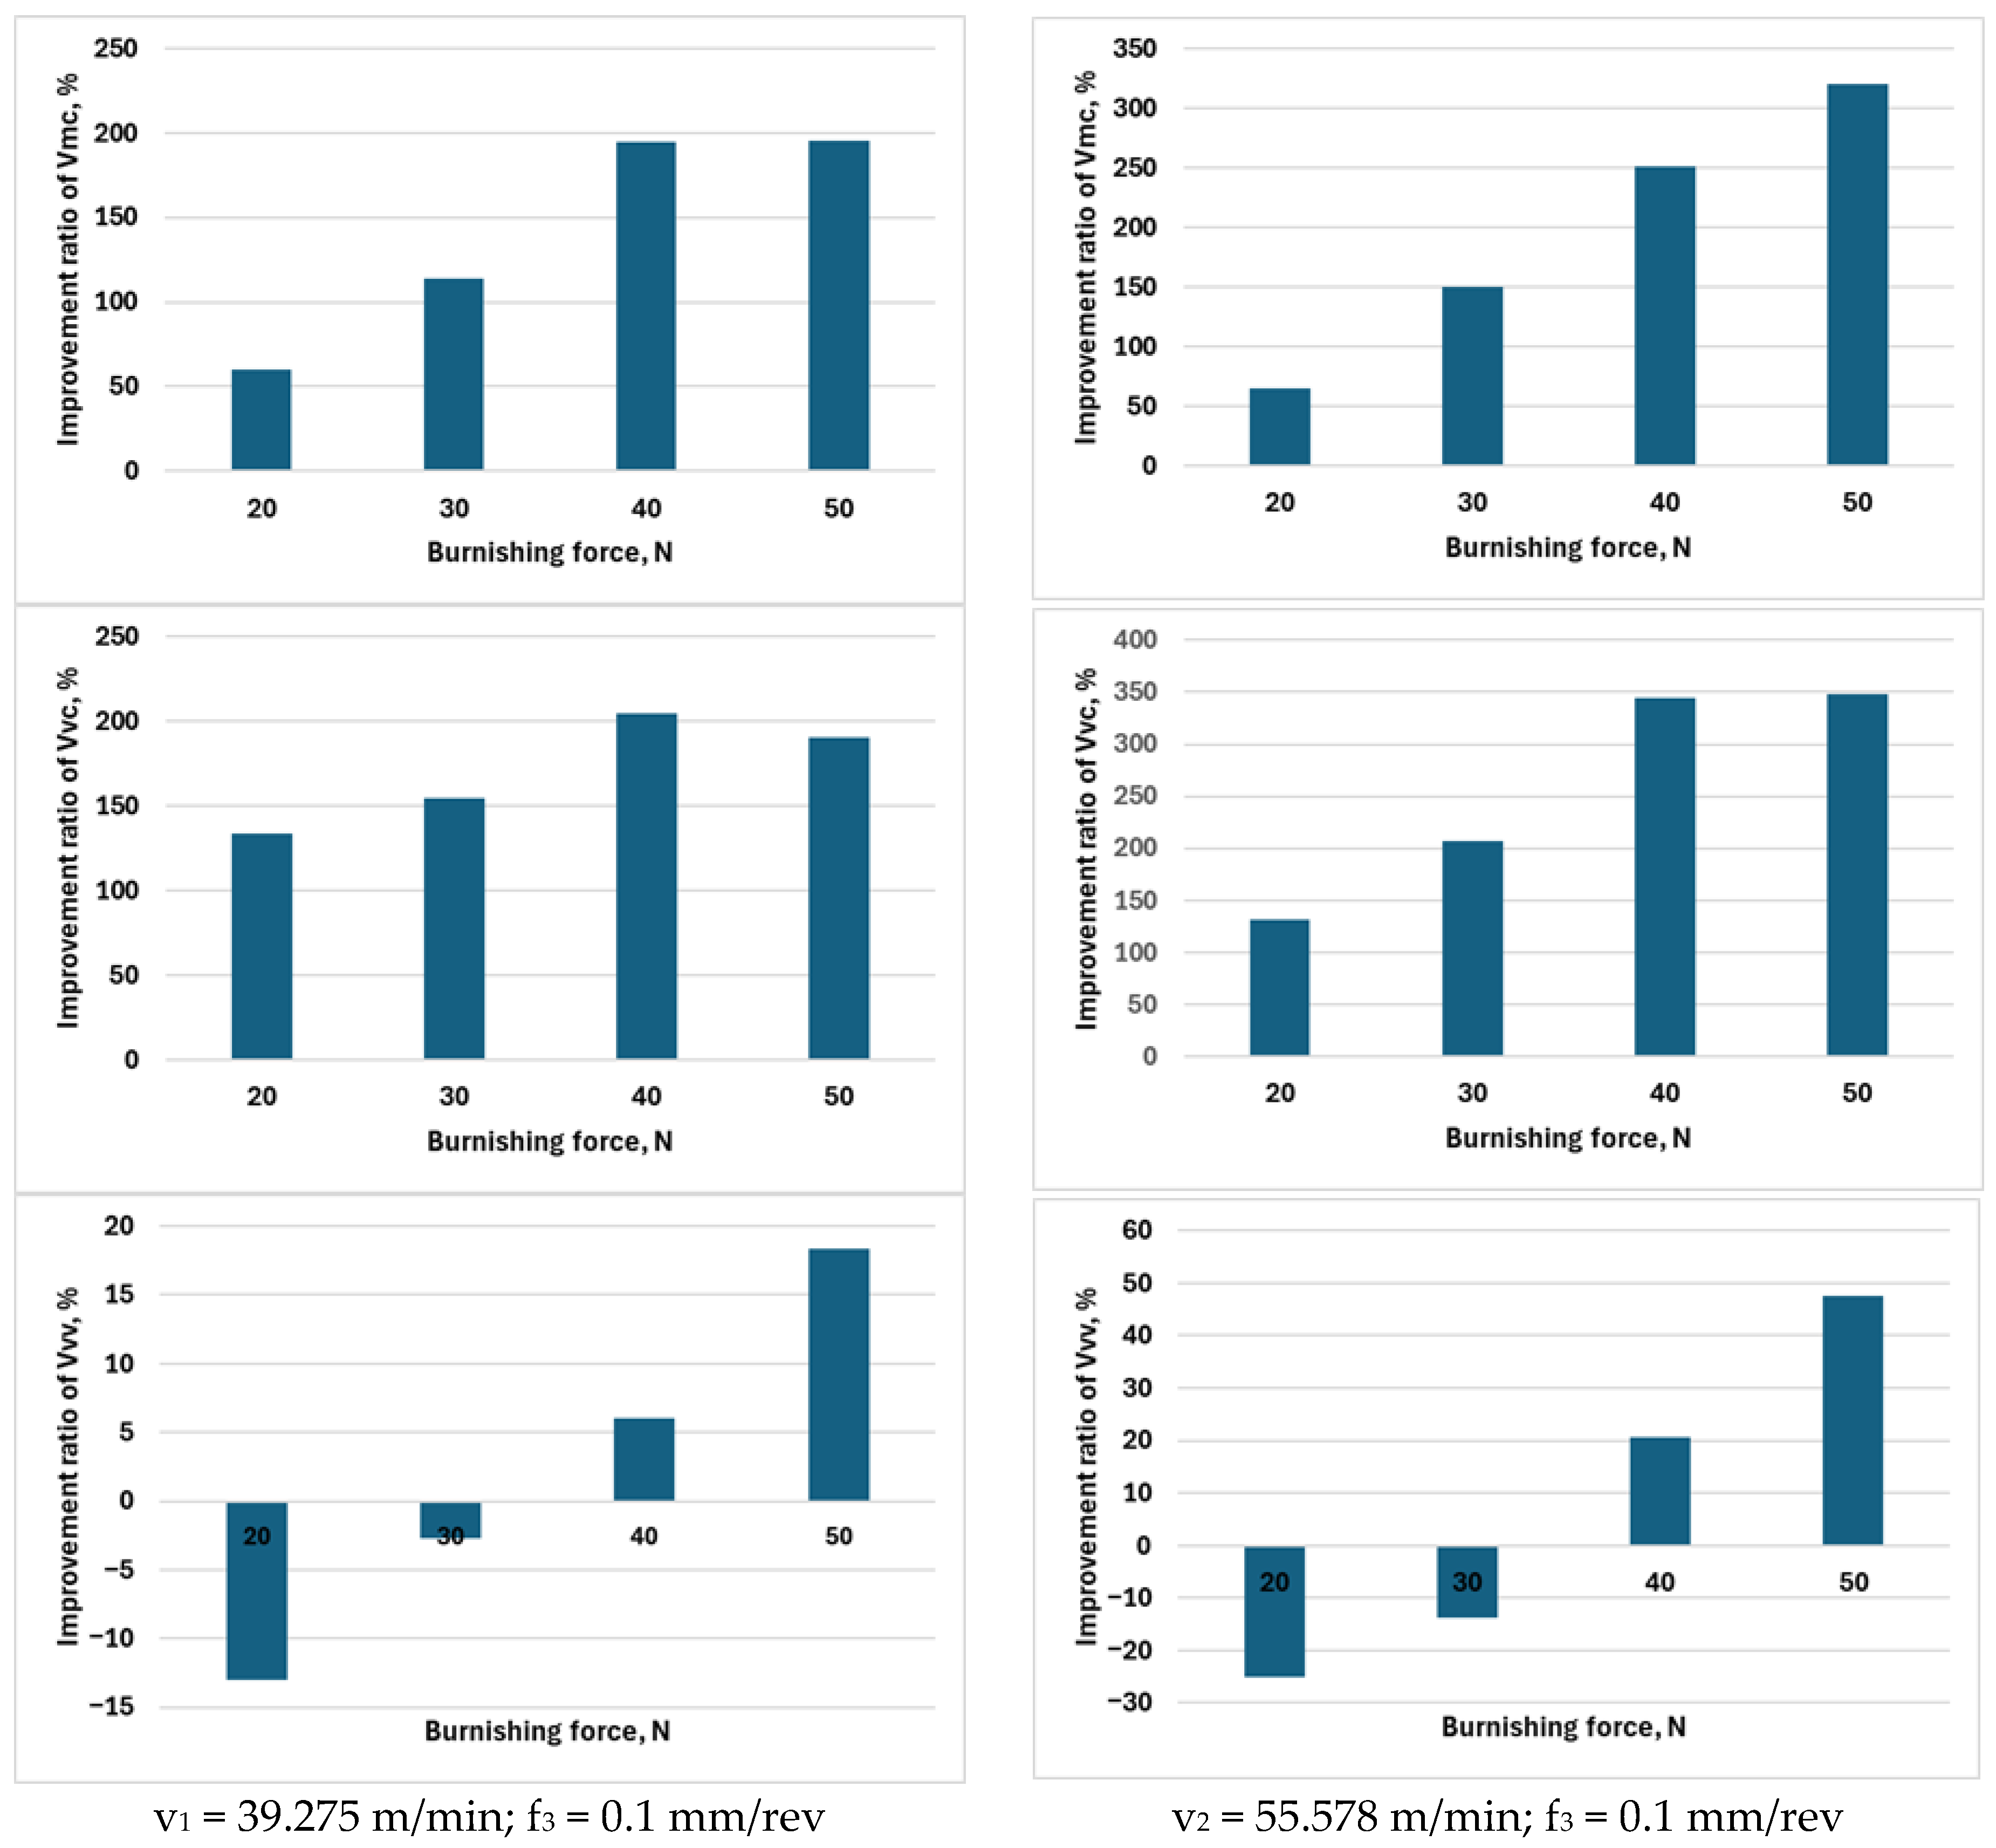
Figure 8 displays the improved ratios of the measured values of functional volume area roughness parameters Vmp (peak material volume), Vmc (core material volume), Vvc (core void volume), and (Vvv (dale void volume) for parameter variations F1–F8, before and after burnishing for F1F4 burnishing forces and v1v2 burnishing speeds.

5. Discussion

After examining the results of the research, it can be stated that Figure 3 shows the improvement factors of the 3D roughness parameters Sa, Sq, and Sz due to burnishing, considering the burnishing force pairs F1F4, F2F4, and F3F4. After studying Table A1 and Figure 3, the following can be observed. When applying a burnishing force of F1 = 20 N, the greatest improvement in terms of the improvement parameters ISa, ISq, and ISz is achieved at higher speed (v2 = 55.578 m/min) and higher feed (f2 = 0.050 mm/rev). Interestingly, when applying a burnishing force of F2 = 30 N, the lower speed (v1 = 39.275 m/min) and lower feed (f1 = 0.0125 mm/rev) parameter pair provides greater roughness improvement for all the three examined 3D roughness parameters. It should be noted that when applying a burnishing force of F2 = 30 N, the ISz improvement factor changes sign, i.e., the surface does not improve due to burnishing, but deteriorates compared to before burnishing when applying higher speed (v2 = 55.578 m/min) and lower feed (f1 = 0.0125 mm/rev) values. In the case when the burnishing force is F3 = 40 N, the higher burnishing speed (v2 = 55.578 m/min) and the higher feed (f2 = 0.050 mm/rev) also provided the highest improvement ratio values. It can also be noticed that at the lower feed (f1 = 0.0125 mm/rev) both speeds already showed surface roughness deterioration. When applying the lower speed (v1 = 39.275 m/min) and the higher feed (f2 = 0.050 mm/rev), there was still an improvement in the ISa and ISq values, but a deterioration in the ISz value. When applying the burnishing force of F4 = 50 N, the higher feed (f2 = 0.050 mm/rev) and both speeds caused roughness improvement in terms of ISa, ISq, and ISz. This was observed even when using lower speed (v1 = 39.275 m/min) and lower feed (f1 = 0.0125 mm/rev).
Table A2 and Figure 7 deal with the analysis of the DVmc/DVvc ratio. Figure 7 shows the change in the DVmc/DVvc ratios due to burnishing, considering the burnishing force pairs F1F4, F2F4, and F3F4. The DVmc/DVvc ratio shows how much the volume of material in the core zone is compared to the volume of the voids. If DVmc is large, there is a lot of material in the core zone (more compact surface, less lubricant storage capacity). If DVvc is large, there are many voids in the core zone (more lubricant storage capacity, but less carrier surface). According to Figure 7, when the chosen technological parameters are applied, the DVmc/DVvc ratio is predominantly (with one exception) less than 1. This indicates that the core zone is cavity-dominant, i.e., the surface is characterized from a tribological point of view by the fact that the surface can store a relatively large amount of lubricant. Its advantage is good lubrication retention and friction and wear reduction. The disadvantage is that as the actual bearing surface is smaller, the pressure can be concentrated on the remaining material surfaces, which can lead to microplastic deformation.
Table A3 and the corresponding Figure 8 show changes in the improvement factors of the various parameters of the Abbott–Firestone curve due to burnishing change depending on the burnishing. Figure 8 contains the values for the lower speed (v1 = 39.275 m/min) and the higher speed (v2 = 55.578 m/min) in a separate column. The IVmc value related to the core zone at the lower speed (v1 = 39.275 m/min) when F1 = 20 N, F2 = 30 N, and F3 = 40 N are applied increases almost linearly from 60.21% to 194.72%; however, when F4 = 50 N is applied, the further increase is minimal, i.e., the improvement value is 195.5%. Therefore, in the investigated burnishing force range, it is not worth increasing it towards F3 = 40 N. When using a higher speed (v2 = 55.578 m/min), the IVmc improvement factor increases in line with the previous trend even when setting the burnishing force F4 = 50 N. When examining the IVvc improvement factor related to the lubricant retention ability, very similar conclusions can be drawn to the previous ones. When using a lower burnishing speed (v1 = 39.275 m/min), it is also advisable to increase the burnishing force up to a value of F3 = 40 N, while at a higher burnishing speed (v2 = 55.578 m/min), the burnishing force can be increased up to a value of F4 = 50 N. It is true that the difference in the improvement factor is minimal when using the burnishing forces F3 = 40 N and F4 = 50 N.
Since the numerical values of four additional 3D surface roughness parameters (maximum peak height (Sp), maximum pit depth (Sv), skewness (Ssk), kurtosis (Sku)) have been determined (Table 4), our future goal is to examine how these parameters depend on the burnishing technological parameters. Furthermore, we intend to measure and document the surface roughness of the diamond burnishing tool before, during and after the execution of the diamond burnishing experiments. Our further goal is to expand the ranges of burnishing technological parameters, such as feed and burnishing speed.

6. Conclusions

Based on the conducted investigations, it can be stated that the burnishing force, as well as the other two parameters (speed and feed), have a significant effect on the improvement of the 3D roughness characteristics (ISa, ISq, ISz). The most favorable surface quality improvement was generally observed at higher feed and speed values; however, in certain parameter combinations—particularly at higher speed and lower feed—surface deterioration also occurred. The results highlight that the optimal parameters of burnishing depend not only on the magnitude of the force but also on the interaction between speed and feed. Overall, selecting the appropriate parameter pairs is essential for effectively reducing surface roughness. The best ISa, ISq, and ISz surface roughness improvements were obtained with the following parameter combination:
v2 = 55.578 m/min, f2 = 0.050 mm/rev, and F4 = 50 N.
According to the results, the value of the DVmc/DVvc ratio was predominantly below 1, which indicates a cavity-dominant core zone. From a tribological point of view, this is advantageous due to good lubricant retention capacity and reduced friction, but the smaller actual bearing surface may lead to increased pressure concentration and microplastic deformation. An exception was observed with the combination of F3 = 40 N force, higher speed (v2 = 55.578 m/min), and lower feed (f1 = 0.0125 mm/rev), where the ratio exceeded 1, while under certain conditions vibrations occurred during the experiment, making the measurement results invalid. Overall, the technological parameters of burnishing fundamentally determine the tribological properties of the surface.
The improvement factors of the Abbott–Firestone curve parameters showed that at lower speed (v1 = 39.275 m/min), it is advisable to increase the burnishing force only up to F3 = 40 N, since further increase results in negligible improvement. At higher speed (v2 = 55.578 m/min), improvement continues even at F4 = 50 N, although the difference between F3 = 40 N and F4 = 50 N is minimal. This indicates that the optimal force limit depends on the applied speed, but excessive force increase does not lead to proportional surface quality improvement. In summary, the efficiency of burnishing can be economically maximized by selecting the proper combination of speed and force.

Author Contributions

Conceptualization, G.V.; methodology, G.V. and A.P.M.; software, G.V.; formal analysis, G.V. and A.P.M.; investigation, A.P.M.; resources, G.V. and A.P.M.; data curation, G.V. and A.P.M.; writing—original draft preparation, G.V.; writing—review and editing, G.V. and A.P.M.; visualization, A.P.M.; supervision, A.P.M.; project administration, G.V. All authors have read and agreed to the published version of the manuscript.

Funding

This research received no external funding.

Data Availability Statement

The original contributions presented in this study are included in the article. Further inquiries can be directed to the corresponding author.

Acknowledgments

The creation of this scientific communication was supported by the University of Miskolc with funding granted to the author Gyula Varga within the framework of the institution’s Scientific Excellence Support Program. (Project identifier: ME-TKTP-2025-055).

Conflicts of Interest

The authors declare no conflicts of interest.

Appendix A. Measurement Data and Improvement

In this appendix, measurement data of arithmetical mean height (Sa), root mean square height (Sq), and maximum height (Sz) are reported for each test specimens before burnishing signed with ’ ((Sa), (Sq’), and (Sz’)) and after burnishing signed without ’ ((Sa), (Sq), and (Sz)). Table A1 contains the improvement ratios ISa, ISq and ISz. The improvement ratios are calculated according to the description given in Equation (1).
Table A1. Measured 3D surface roughness parameters for parameter variations V1–V16 before and after burnishing, with calculated improvement ratios.
Techn. ParametersSurface Roughness
Parameters Before
Burnishing
Surface Roughness
Parameters After
Burnishing
Improvements
SpeedFeedForce
v,
m/min
f,
mm/rev
F,
N
Sa’,
µm
Sq’,
µm
Sz’,
µm
Sa,
µm
Sq,
µm
Sz,
µm
ISa
[%]
ISq
[%]
ISz
[%]
V139.2750.0125200.4900.5853.2770.3310.4283.414−32.449−26.8384.181
V255.5780.0125200.4020.4933.2780.3860.4863.265−3.980−1.420−0.397
V339.2750.0500200.4350.5353.4000.2980.3802.817−31.494−28.972−17.147
V455.5780.0500200.4460.5573.6030.2580.3302.556−42.152−40.754−29.059
V539.2750.0125300.4190.5635.1530.3150.4003.144−24.821−28.952−38.987
V655.5780.0125300.3430.4283.0190.3290.4213.588−4.082−1.63618.847
V739.2750.0500300.3690.4573.5420.3020.3822.678−18.157−16.411−24.393
V855.5780.0500300.3860.4783.1490.3180.4022.849−17.617−15.900−9.527
V939.2750.0125400.3920.4993.5880.5780.7415.24247.44948.49746.098
V1055.5780.0125400.3790.4663.0600.6820.8524.98879.94782.83363.007
V1139.2750.0500400.3480.4352.9360.2890.4053.668−16.954−6.89724.932
V1255.5780.0500400.3840.4923.6690.3100.4253.526−19.271−13.618−3.898
V1339.2750.0125500.3050.3852.8680.2040.2612.447−33.115−32.208−14.679
V1455.5780.0125500.3050.3882.9230.5470.6634.52179.34470.87654.670
V1539.2750.0500500.3510.4393.3040.2630.3412.680−25.071−22.323−18.886
V1655.5780.0500500.4800.7306.5680.2670.3533.115−44.375−51.644−52.573
Table A2. Measured volume parameters for parameter variations V1–V16 before and after burnishing.
Before Burnishing, [ml/m2]After Burnishing, [ml/m2]
v,
m/min
f, mm/revF,
N
Vmc
[ml/m2]
Vvc’,
[ml/m2]
Vmc,
[ml/m2]
Vvc,
[ml/m2]
DVmc
[ml/m2]
DVvc
[ml/m2]
DVmc/DVvc
V139.2750.0125200.5860.7220.3690.444−0.217−0.2780.781
V255.5780.0125200.4710.5860.4340.618−0.0370.032−1.156
V339.2750.0500200.5000.6460.3360.403−0.164−0.2430.675
V455.5780.0500200.5130.6700.2900.349−0.223−0.3210.695
V539.2750.0125300.4480.6200.3650.453−0.083−0.1670.497
V655.5780.0125300.3920.5210.3680.464−0.024−0.0570.421
V739.2750.0500300.4270.5660.3470.408−0.080−0.1580.506
V855.5780.0500300.4390.6110.3540.473−0.085−0.1380.616
V939.2750.0125400.4410.5450.6460.9050.2050.3600.569
V1055.5780.0125400.4400.5880.8050.9120.3650.3241.127
V1139.2750.0500400.3930.5370.2920.361−0.101−0.1760.574
V1255.5780.0500400.4220.5930.3220.412−0.100−0.1810.552
V1339.2750.0125500.3420.4540.2270.300−0.115−0.1540.747
V1455.5780.0125500.3410.4530.6010.8460.2600.3930.662
V1539.2750.0500500.3960.5390.2910.377−0.105−0.1620.648
V1655.5780.0500500.4510.6330.2840.382−0.167−0.2510.665
Table A3. Measured volume parameters for parameter variations F1–F8 before and after burnishing.
Before Burnishing [mL/m2]After Burnishing [mL/m2]
v,
m/min
f,
mm/rev
F,
N
Vmp,
[ml/m2]
Vmc,
[ml/m2]
Vvc,
[ml/m2]
Vvv,
[ml/m2]
Vmp,
[ml/m2]
Vmc,
[ml/m2]
Vvc,
[ml/m2]
Vvv,
[ml/m2]
F139.2750.1200.0581.3651.8360.1340.0200.8520.7860.154
F239.2750.1300.0511.3591.7450.1420.0170.6360.6860.146
F339.2750.1400.0591.3411.7470.1230.0200.4550.5730.116
F439.2750.1500.0511.2471.6570.1160.0200.4220.5700.098
F555.5780.1200.0471.2661.7760.1100.0220.7670.7660.147
F655.5780.1300.0651.4011.8550.1200.0200.5600.6040.139
F755.5780.1400.0641.3081.8600.1350.0150.3720.4180.112
F855.5780.1500.0641.2741.7360.1150.0160.3030.3870.078

Appendix B

An ANOVA analysis is presented for final models in the case of the improvement ratios of ISa, ISq, and ISz (Table A4, Table A5, and Table A6, respectively) and data.log normalization (Table A7, Table A8 and Table A9).
Table A4. Dependent variable: ISa, ANOVA output.
SourcedfMean SquareFSigPartial Eta Squared
Corrected Model52751.962.7720.080.581
Intercept1712.8630.7180.4170.067
v m/min11648.8881.6610.2270.142
f mm/rev16536.0766.5830.0280.397
F N31858.2791.8720.1980.360
Error10992.907
Total16
Corrected Total15
R Squared = 0.581 (Adjusted R Squared = 0.371).
The model explains 58.1% of the variance in ISa. The only statistically significant factor is feed (f); speed (v) and force (F) show meaningful effect sizes.
Table A5. Dependent variable: ISq ANOVA output.
SourcedfMean SquareFSigPartial Eta Squared
Corrected Model52701.3752.9060.0710.592
Intercept1455.4700.4900.5000.047
v m/min11275.2221.3720.2690.121
f mm/rev15916.3406.3650.0300.389
F N32105.1042.2650.1430.405
Error10929.571
Total16
Corrected Total15
R Squared = 0.592 (Adjusted R Squared = 0.371).
The model explains 58.1% of the variance in ISq. Similarly, the feed is dominating ISq; however, speed and force have a minor effect.
Table A6. Dependent variable: ISz ANOVA output.
SourcedfMean SquareFSigPartial Eta Squared
Corrected Model520793.2590.0530.620
Intercept10.29900.9830
v m/min1399.50.6260.4470.059
f mm/rev143336.7920.0260.404
F N318872.9580.0840.470
Error10637.9
Total16
Corrected Total15
R Squared = 0.620 (Adjusted R Squared = 0.430).
The model explains 62% of the variance in ISz, and the feed is dominating factor.
The data was transformed using logarithmic transformation to reduce the skewness. ANOVA analysis was performed for each variable before and after burnishing. Table A7 presents the ANOVA analysis for the arithmetical mean height surface roughness parameter before (Sa) and after (Sa) burnishing and the effect of the machining parameter to define the significance of the burnishing. Similarly, Table A8 presents the ANOVA analysis for root mean square height surface roughness parameter before (Sq) and after (Sq) burnishing and the effect of the machining parameter to define the significance of the burnishing. Furthermore, Table A9 relates to using logarithmic transformation of maximum height before (Sz) and after (Sz) burnishing.
Table A7. ANOVA results after normalization of data: Sa, Sa.
Dependent Variable: SaDependent Variable: Sa
SourcedfMean SquareFSigSourcedfMean SquareFSig
Corrected Model50.0041.3250.329Corrected Model50.1185.6610.01
Intercept12.429901.1360Intercept123.0151100.3470
v m/min11.60 × 10−50.0060.940v m/min10.0331.5810.237
f mm/rev10.0020.6240.448f mm/rev10.2069.8280.011
F N30.0051.9980.178F N30.1185.6330.016
Error100.003 Error100.021
Total16 Total16
Corrected Total15 Corrected Total15
R Squared = 0.398 (Adjusted R Squared = 0.098)R Squared = 0.739 (Adjusted R Squared = 0.608)
Sa before burnishing the model is not significant; after burnishing, the model is significant and R2 is strong. After burnishing, feed and force strongly influence Sa.
Table A8. ANOVA results after normalization of data: Sq, Sq.
Dependent Variable: SqDependent Variable: Sq
SourcedfMean SquareFSigSourcedfMean SquareFSig
Corrected Model50.0040.4250.821Corrected Model50.0483.3520.049
Intercept13.930430.2200Intercept13.303231.2010
v m/min10.0010.1230.733v m/min10.0221.5430.242
f mm/rev10.0060.6830.428f mm/rev10.0956.6610.027
F N30.0040.4390.730F N30.0412.8520.091
Error100.009 Error100.014
Total16 Total16
Corrected Total15 Corrected Total15
R Squared = 0.175 (Adjusted R Squared = −0.237)R Squared = 0.626 (Adjusted R Squared = 0.439)
Similarly, for Sq, the model is significant after burnishing, and feed rate is the most dominating factor influencing Sq.
Table A9. ANOVA results after normalization of data: Sz, Sz.
Dependent Variable: SzDependent Variable: Sz
SourcedfMean SquareFSigSourcedfMean SquareFSig
Corrected Model50.3220.2630.923Corrected Model51.6075.8980.009
Intercept1205.471168.1530Intercept1185.627681.0650
v m/min10.090.0740.791v m/min10.3361.2320.293
f mm/rev10.5640.4620.512f mm/rev12.82210.3550.009
F N30.3180.2600.852F N31.6265.9670.013
Error101.222 Error100.273
Total16 Total16
Corrected Total15 Corrected Total15
R Squared = 0.116 (Adjusted R Squared = −0.325)R Squared = 0.747 (Adjusted R Squared = 0.620)
After burnishing, the Sz model is highly significant. Feed and force show strong significance on Sz.

References

  1. Kovács, G. Combination of Lean Value-Oriented Conception and Facility Layout Design for Even More Significant Efficiency Improvement and Cost Reduction. Int. J. Product. Res. 2020, 58, 2916–2936. [Google Scholar] [CrossRef]
  2. Afraa, K.; Sztankovics, I.; Felhő, C. Preliminary Experimental Comparison of Plunge Milling and Face Milling: Influences of Cutting Parameters on Cutting Force and Surface Roughness. ENG 2025, 6, 128. [Google Scholar] [CrossRef]
  3. Kundrák, J.; Felhő, C.; Nagy, A. Analysis and Prediction of Roughness of Face Milled Surfaces using CAD Model. Manuf. Technol. 2022, 22, 558–572. [Google Scholar] [CrossRef]
  4. Meng, Y.; Xu, J.; Ma, L.; Jin, Z.; Prakash, B.; Ma, T.; Wang, W. A Review of Advances in Tribology in 2020–2021. Friction 2022, 10, 1443–1595. [Google Scholar] [CrossRef]
  5. Tesfom, K.F.; Felho, C. Examining the Impact of Slide Burnishing Parameters on the 3D Surface Features Of Medium Carbon Steel. J. Prod. Eng. 2024, 27, 30–35. [Google Scholar] [CrossRef]
  6. Ferencsik, V. Analytical Analysis of the Theoretical Surface Roughness in the Case of Burnishing of Cylindrical Workpiece. Cut. Tool. Technol. Syst. 2023, 99, 101–109. [Google Scholar] [CrossRef]
  7. Dix, M.; Posdzich, M. Force-controlled Burnishing Process for High Surface Integrity on Additive Manufactured Parts. Procedia CIRP 2022, 108, 642–647. [Google Scholar] [CrossRef]
  8. Varga, G.; Smolnicki, S.; Babič, M.; Caesarendra, W. Energy Efficiency Analysis When Grinding and Diamond Burnishing of Components. In Towards Industry 5.0: Selected Papers from ISPR2022; Güneş, G.M., Durakbasa, N.M., Eds.; Springer International Publishing: Cham, Switzerland, 2023; pp. 378–396. [Google Scholar] [CrossRef]
  9. Maximov, J.; Duncheva, G. The Correlation between Surface Integrity and Operating Behaviour of Slide Burnished Components—A Review and Prospects. Appl. Sci. 2023, 13, 3313. [Google Scholar] [CrossRef]
  10. Maximov, J.; Duncheva, G. Effects of Cryogenic- and Cool-Assisted Burnishing on the Surface Integrity and Operating Behavior of Metal Components: A Review and Perspectives. Machines 2024, 12, 312. [Google Scholar] [CrossRef]
  11. Maximov, J.; Duncheva, G. Effects of Diamond Burnishing on Surface Integrity, Fatigue, Wear, and Corrosion of Metal Components—Review and Perspectives. Int. J. Adv. Manuf. Technol. 2025, 139, 4233–4267. [Google Scholar] [CrossRef]
  12. Korzynski, M.; Dudek, K.; Korzynska, K. Effect of Slide Diamond Burnishing on the Surface Layer of Valve Stems and the Durability of the Stem-Graphite Seal Friction Pair. Appl. Sci. 2023, 13, 6392. [Google Scholar] [CrossRef]
  13. Sedlacek, M.; Gregorcic, P.; Podgornik, B. Use of the Roughness Parameters Ssk and Sku to Control Friction—A Method for Designing Surface Texturing. Tribol. Trans. 2017, 60, 260–266. [Google Scholar] [CrossRef]
  14. Shuster, M.; Seasons, R.; Burke, D. Laboratory Simulation to Select Oil Seal and Surface Treatment. Wear 1999, 225–229 Pt 2, 954–961. [Google Scholar] [CrossRef]
  15. Prajapati, D.K.; Tiwari, M. The Correlation Between Friction Coefficient and Areal Topography Parameters for AISI 304 Steel Sliding Against AISI 52100 Steel. Friction 2021, 9, 41–60. [Google Scholar] [CrossRef]
  16. Sedlaček, M.; Podgornik, B.; Vižintin, J. Correlation Between Standard Roughness Parameters Skewness and Kurtosis and Tribological Behaviour of Contact Surfaces. Tribol. Int. 2012, 48, 102–112. [Google Scholar] [CrossRef]
  17. Reddy, M.V.K.; Kuriachen, B.; Joshy, J.; Joy, M.L. Influence of Areal Surface Parameters on The Tribological Behavior of Ti6Al4V Under Lubricated Condition. Tribol. Int. 2023, 179, 108147. [Google Scholar] [CrossRef]
  18. Shi, R.; Wang, B.; Yan, Z.; Wang, Z.; Dong, L. Effect of Surface Topography Parameters on Friction and Wear of Random Rough Surface. Materials 2019, 12, 2762. [Google Scholar] [CrossRef]
  19. Lavrys, S.; Pohrelyuk, I.; Padgurskas, J.; Shliakhetka, K. Improving Wear Resistance of Highly Porous Titanium by Surface Engineering Methods. Coatings 2023, 13, 1714. [Google Scholar] [CrossRef]
  20. Dzierwa, A.; Stelmakh, N.; Tikanashvili, N. Application of Taguchi Technique to Study Tribological Properties of Roller-Burnished 36CrNiMo4 Steel. Lubricants 2023, 11, 227. [Google Scholar] [CrossRef]
  21. Swirad, S. Influence of Ball Burnishing on Lubricated Fretting of the Titanium Alloy Ti6Al4V. Lubricants 2023, 11, 341. [Google Scholar] [CrossRef]
  22. Grudzien, J.; Grochała, D.; Grzejda, R.; Kochmanski, P. Testing the Effectiveness of Hybrid Milling and Surface Burnishing in Improving the Wear Resistance of Machine Parts Made of Structural Steel. Lubricants 2024, 12, 458. [Google Scholar] [CrossRef]
  23. Dzierwa, A.; Markopoulos, A.P. Influence of Ball-Burnishing Process on Surface Topography Parameters and Tribological Properties of Hardened Steel. Machines 2019, 7, 11. [Google Scholar] [CrossRef]
  24. Varga, G.; Dezső, G.; Szigeti, F. Surface Roughness Improvement by Sliding Friction Burnishing of Parts Produced by Selective Laser Melting of Ti6Al4V Titanium Alloy. Machines 2022, 10, 400. [Google Scholar] [CrossRef]
  25. Swirad, S.; Pawlus, P. The Effect of Ball Burnishing on Tribological Performance of 42CrMo4 Steel under Dry Sliding Conditions. Materials 2020, 13, 2127. [Google Scholar] [CrossRef] [PubMed]
  26. Swirad, S.; Pawlus, P. The Influence of Ball Burnishing on Friction in Lubricated Sliding. Materials 2020, 13, 5027. [Google Scholar] [CrossRef]
  27. Swirad, S.; Pawlus, P. The Effect of Ball Burnishing on Dry Fretting. Materials 2021, 14, 7073. [Google Scholar] [CrossRef] [PubMed]
  28. Swirad, S.; Pawlus, P. Effect of Ball Burnishing on Fretting at Elevated Temperatures. Materials 2024, 17, 5960. [Google Scholar] [CrossRef] [PubMed]
  29. Torres, A.; Cuadrado, N.; Llumà, J.; Vilaseca, M.; Travieso-Rodriguez, J.A. Influence of the Stainless-Steel Microstructure on Tribological Behavior and Surface Integrity after Ball Burnishing. Materials 2022, 15, 8829. [Google Scholar] [CrossRef]
  30. Velázquez-Corral, E.; Wagner, V.; Jerez-Mesa, R.; Liuma, J.; Travieso-Rodriguez, J.A.; Dessein, G. Analysis of Ultrasonic Vibration-Assisted Ball Burnishing Process on the Tribological Behavior of AISI 316L Cylindrical Specimens. Materials 2023, 16, 5595. [Google Scholar] [CrossRef]
  31. Kuznetsov, V.; Tatarintsev, I.; Voropaev, V.; Skorobogatov, A. Surface Nanocrystallization and Improvement of the Mechanical and Tribological Properties of AISI 304 Steel Using Multi-Pass Nanostructuring Burnishing. Materials 2024, 17, 5656. [Google Scholar] [CrossRef]
  32. Bednarski, P.; Biało, D.; Brostow, W.; Czechowski, K.; Polowski, W.; Rusek, P.; Tobola, D. Improvement of Tribological Properties of Matrix Composites by Means of Slide Burnishing. Mater. Sci. 2013, 19, 367–372. [Google Scholar] [CrossRef]
  33. Tomov, M.; Gecevska, V.; Vasileska, E. Modelling of Multiple Surface Roughness Parameters During Hard Turning: A Comparative Study Between the Kinematical-Geometrical Copying Approach and the Design of Experiments Method (DOE). Adv. Prod. Eng. Manag. 2022, 17, 75–88. [Google Scholar] [CrossRef]
  34. Nagy, A.; Kundrák, J. Roughness of Face-Milled Surface Topography in Directions Relative to the Feed Movement. Manuf. Techn. 2024, 24, 2. [Google Scholar] [CrossRef]
  35. Molnár, V.; Sztankovics, I. Analysis of Roughness Parameters Determining Tribological Properties in Hard Turned Surfaces. Hung. J. Ind. Chem. 2021, 49, 77–84. [Google Scholar] [CrossRef]
  36. Skoczylas, A.; Kłonica, M. Selected Properties of the Surface Layer of C45 Steel Samples after Slide Burnishing. Materials 2023, 16, 6513. [Google Scholar] [CrossRef]
  37. Kubatova, D.; Melichar, M. Roughness Evaluation Using Abbott-Firestone Curve Parameters. In Proceedings of the 30th DAAAM International Symposium, Zadar, Croatia, 23–26 October 2019; Katalinic, B., Ed.; DAAAM International: Vienna, Austria, 2019; pp. 0467–0475, ISBN 978-3-902734-22-8, ISSN 1726-9679. [Google Scholar] [CrossRef]
  38. Maximov, J.T.; Anchev, A.P.; Duncheva, G.V. Modeling of the Friction in the Tool Workpiece System in Diamond Burnishing Process. Coupled Syst. Mech. 2015, 4, 279–295. [Google Scholar] [CrossRef]
  39. Varga, G. Effect of burnishing technological parameters on the surface roughness and hardness of stainless-steel test pieces (A vasalástechnológiai paraméterek hatása a rozsdamentes acél próbadarabok felületi érdességére és keménységére). Mul-Tidiszcipl. Tudományok Miskolci Egy. Közleménye 2022, 12, 151–163. (In Hungarian) [Google Scholar]
  40. European Steel and Alloy Grades/Numbers SteelNumber. X5CrNi18-10 (1.4301). Available online: https://steelnumber.com/en/steel_composition_eu.php?name_id=100 (accessed on 9 September 2025).
  41. AltiSurf©520. Assuring Fast & Precise Optical Measurements. Available online: https://www.imeco-th.cz/files/tinymce/AltiSurf%E2%84%A2%20520.pdf (accessed on 13 July 2025).
  42. ISO 21920-2:2021; Geometrical Product Specifications (GPS)—Surface Texture: Profile Part 2: Terms, Definitions and Surface Texture Parameters. ISO: Geneva, Switzerland, 2021.
  43. ISO 25178-2:2021; Geometrical Product Specifications (GPS)—Surface Texture: Areal. Part 2: Terms, Definitions and Surface Texture Parameters. ISO: Geneva, Switzerland, 2021.
  44. Hisam, M.W.; Dar, A.A.; Elrasheed, M.O.; Khan, M.S.; Gera, R.; Azad, I. The Versatility of the Taguchi Method: Optimizing Experiments Across Diverse Disciplines. J. Stat. Theory Appl. 2024, 23, 365–389. [Google Scholar] [CrossRef]
Figure 1. Structure of this paper.
Materials 18 04500 g001
Figure 2. Schematic representation of diamond burnishing process [39]. 1—workpiece, 2—tool body, 3—burnishing insert, 4—toolholder, 5—diamond tip.
Materials 18 04500 g002
Figure 3. Change in surface roughness improvement ratio for different parameter combinations.
Materials 18 04500 g003
Figure 4. Main volume parameters on Abbott–Firestone curve: Vmp (peak material volume), Vmc (core material volume), Vvc (core void volume), and Vvv (dale void volume) [43].
Materials 18 04500 g004
Figure 5. Volume parameters calculated on areal material curve using default material threshold (10% and 80%) when F1 = 20 N and F2 = 30 N burnishing forces were applied.
Materials 18 04500 g005aMaterials 18 04500 g005b
Figure 6. Volume parameters calculated on areal material curve using default material threshold (10% and 80%) when F3 = 40 N and F4 = 50 N burnishing forces were applied.
Materials 18 04500 g006aMaterials 18 04500 g006b
Figure 7. Changes in DVmc/DVvc ratio for different parameter combinations.
Materials 18 04500 g007
Figure 8. Improvement ratios of Vmp, Vmc, Vvc, and Vvv for the two burnishing speeds applied.
Materials 18 04500 g008aMaterials 18 04500 g008b
Table 1. Chemical composition (wt.%) of austenitic chromium–nickel stainless steel X5CrNi18-10 [40].
C %Si %Mn %P %S %Cr %Ni %N %
≤0.07≤1.00≤2.00≤0.045≤0.01517.5–19.58.00–10.5≤0.11
Table 2. Mechanical properties of austenitic chromium–nickel stainless steel X5CrNi18-10 at 20 °C [40].
Hardness
HB 30
0.2% Yield Strength, RpTensile Strength, RmElongation
A5
Modulus of
Elasticity
HBN/mm2N/mm2%kN/mm2
≤215≥190500–700≥45/35200
Table 3. Diamond burnishing parameter variations.
No.Burnishing Parameters
nvfF
[1/min][m/min][mm/rev][N]
V11_126539.2750.012520
V21_237555.5780.012520
V31_326539.2750.050020
V41_437555.5780.050020
V52_126539.2750.012530
V62_237555.5780.012530
V72_326539.2750.050030
V82_437555.5780.050030
V93_126539.2750.012540
V103_237555.5780.012540
V113_326539.2750.050040
V123_437555.5780.050040
V134_137539.2750.012550
V144_237555.5780.012550
V154_326539.2750.050050
V164_437555.5780.050050
F17_126539.2750.100020
F27_237555.5780.100030
F37_326539.2750.100040
F47_437555.5780.100050
F58_126539.2750.100020
F68_237555.5780.100030
F78_326539.2750.100040
F88_437555.5780.100050
Table 4. Measured 3D surface roughness parameters for parameter variations V1–V16.
Before BurnishingAfter Burnishing
V1v1 = 39.275 m/min, f1 = 0.0125 mm/rev, F1 = 20 N
Materials 18 04500 i001Materials 18 04500 i002
Sa = 0.490 µm, Sq = 0.585 µm, Sz = 3.277 µm,
Sp = 1.588 µm, Sv = 1.689 µm, Ssk = −0.037, Sku = 2.269
Sa = 0.331 µm, Sq = 0.428 µm, Sz = 3.414 µm,
Sp = 1.736 µm, Sv = 1.678 µm, Ssk = −0.264, Sku = 3.737
V2v2 = 55.578 m/min, f1 = 0.0125 mm/rev, F1 = 20 N
Materials 18 04500 i003Materials 18 04500 i004
Sa = 0.402 µm, Sq = 0.493 µm, Sz = 3.278 µm,
Sp = 1.567 µm, Sv = 1.711 µm, Ssk = −0.137, Sku = 2.652
Sa = 0.386 µm, Sq = 0.486 µm, Sz = 3.265 µm,
Sp = 1.611 µm, Sv = 1.654 µm, Ssk = 0.111, Sku = 2.928
V3v1 = 39.275 m/min, f2 = 0.05 mm/rev, F1 = 20 N
Materials 18 04500 i005Materials 18 04500 i006
Sa = 0.435 µm, Sq = 0.535 µm, Sz = 3.400 µm,
Sp = 1.560 µm, Sv = 1.839 µm, Ssk = −0.150, Sku = 2.638
Sa = 0.298 µm, Sq = 0.380 µm, Sz = 2.817 µm,
Sp = 1.198 µm, Sv = 1.619 µm, Ssk = −0.606, Sku = 3.634
V4v2 = 55.578 m/min, f2 = 0.05 mm/rev, F1 = 20 N
Materials 18 04500 i007Materials 18 04500 i008
Sa = 0.446 µm, Sq = 0.557 µm, Sz = 3.603 µm,
Sp = 1.835 µm, Sv = 1.768 µm, Ssk = 0.062, Sku = 2.934
Sa = 0.258 µm, Sq = 0.330 µm, Sz = 2.556 µm,
Sp = 1.101 µm, Sv = 1.455 µm, Ssk = −0.598,Sku = 3.612
V5v1 = 39.275 m/min, f1 = 0.0125 mm/rev, F2 = 30 N
Materials 18 04500 i009Materials 18 04500 i010
Sa = 0.419 µm, Sq = 0.563 µm, Sz = 5.153 µm,
Sp = 3.222 µm, Sv = 1.931 µm, Ssk = 0.958, Sku = 6.610
Sa = 0.315 µm, Sq = 0.400 µm, Sz = 3.144 µm,
Sp = 1.520 µm, Sv = 1.625 µm, Ssk = −0.377, Sku = 3.223
V6v2 = 55.578 m/min, f1 = 0.0125 mm/rev, F2 = 30 N
Materials 18 04500 i011Materials 18 04500 i012
Sa = 0.343 µm, Sq = 0.428 µm, Sz = 3.019 µm,
Sp = 1.308 µm, Sv = 1.710 µm, Ssk = −0.127, Sku = 2.943
Sa = 0.329 µm, Sq = 0.421 µm, Sz = 3.588 µm,
Sp = 1.660 µm, Sv = 1.928 µm, Ssk = −0.474, Sku = 3.620
V7v1 = 39.275 m/min, f2 = 0.05 mm/rev, F2 = 30 N
Materials 18 04500 i013Materials 18 04500 i014
Sa = 0.369 µm, Sq = 0.457 µm, Sz = 3.542 µm,
Sp = 1.719 µm, Sv = 1.823 µm, Ssk = −0.059, Sku = 2.739
Sa = 0.302 µm, Sq = 0.382 µm, Sz = 2.678 µm,
Sp = 1.153 µm, Sv = 1.525 µm, Ssk = −0.554, Sku = 3.379
V8v2 = 55.578 m/min, f2 = 0.05 mm/rev, F2 = 30 N
Materials 18 04500 i015Materials 18 04500 i016
Sa = 0.386 µm, Sq = 0.478 µm, Sz = 3.149 µm,
Sp = 1.582 µm, Sv = 1.567 µm, Ssk = 0.210, Sku = 2.802
Sa = 0.318 µm, Sq = 0.402 µm, Sz = 2.849 µm,
Sp = 1.298 µm, Sv = 1.551 µm, Ssk = −0.206, Sku = 3.078
V9v1 = 39.275 m/min, f1 = 0.0125 mm/rev, F3 = 40 N
Materials 18 04500 i017Materials 18 04500 i018
Sa = 0.366 µm, Sq = 0.454 µm, Sz = 3.382 µm,
Sp = 1.520 µm, Sv = 1.862 µm, Ssk = −0.082, Sku = 2.803
Sa = 0.578 µm, Sq = 0.741 µm, Sz = 5.242 µm,
Sp = 2.255 µm, Sv = 2.987 µm, Ssk = −0.116, Sku = 3.503
V10v2 = 55.578 m/min, f1 = 0.0125 mm/rev, F3 = 40 N
Materials 18 04500 i019Materials 18 04500 i020
Sa = 0.379 µm, Sq = 0.466 µm, Sz = 3.060 µm,
Sp = 1.391 µm, Sv = 1.669 µm, Ssk = 0.022, Sku = 2.609
Sa = 0.682 µm, Sq = 0.852 µm, Sz = 4.988 µm,
Sp = 2.135 µm, Sv = 2.853 µm, Ssk = −0.495, Sku = 2.959
V11v1 = 39.275 m/min, f2 = 0.05 mm/rev, F3 = 40 N
Materials 18 04500 i021Materials 18 04500 i022
Sa = 0.348 µm, Sq = 0.435 µm, Sz = 2.936 µm,
Sp = 1.394 µm, Sv = 1.542 µm, Ssk = 0.012, Sku = 2.904
Sa = 0.289 µm, Sq = 0.405 µm, Sz = 3.668 µm,
Sp = 1.405 µm, Sv = 2.263 µm, Ssk = −1.275, Sku = 7.012
V12v2 = 55.578 m/min, f2 = 0.05 mm/rev, F3 = 40 N
Materials 18 04500 i023Materials 18 04500 i024
Sa = 0.384 µm, Sq = 0.492 µm, Sz = 3.669 µm,
Sp = 1.732 µm, Sv = 1.937 µm, Ssk = −0.069, Sku = 3.147
Sa = 0.310 µm, Sq = 0.425 µm, Sz = 3.526 µm,
Sp = 1.457 µm, Sv = 2.069 µm, Ssk = −0.737, Sku = 5.044
V13v1 = 39.275 m/min, f1 = 0.0125 mm/rev, F4 = 50 N
Materials 18 04500 i025Materials 18 04500 i026
Sa = 0.305 µm, Sq = 0.385 µm, Sz = 2.868 µm,
Sp = 1.313 µm, Sv = 1.555 µm, Ssk = −0.084, Sku = 3.148
Sa = 0.204 µm, Sq = 0.261 µm, Sz = 2.447 µm,
Sp = 1.160 µm, Sv = 1.286 µm, Ssk = −0.163, Sku = 3.508
V14v2 = 55.578 m/min, f1 = 0.0125 mm/rev, F4 = 50 N
Materials 18 04500 i027Materials 18 04500 i028
Sa = 0.305 µm, Sq = 0.388 µm, Sz = 2.923 µm,
Sp = 1.358 µm, Sv = 1.565 µm, Ssk = −0.021, Sku = 3.290
Sa = 0.547 µm, Sq = 0.663 µm, Sz = 4.521 µm,
Sp = 2.285 µm, Sv = 2.236 µm, Ssk = 0.238, Sku = 2.722
V15v1 = 39.275 m/min, f2 = 0.05 mm/rev, F4 = 50 N
Materials 18 04500 i029Materials 18 04500 i030
Sa = 0.351 µm, Sq = 0.439 µm, Sz = 3.304 µm,
Sp = 1.493 µm, Sv = 1.812 µm, Ssk = −0.027, Sku = 2.915
Sa = 0.263 µm, Sq = 0.341 µm, Sz = 2.680 µm,
Sp = 1.188 µm, Sv = 1.491 µm, Ssk = −0.387, Sku = 3.611
V16v2 = 55.578 m/min, f2 = 0.05 mm/rev, F4 = 50 N
Materials 18 04500 i031Materials 18 04500 i032
Sa = 0.337 µm, Sq = 0.419 µm, Sz = 2.957 µm,
Sp = 1.338 µm, Sv = 1.691 µm, Ssk = -0.019, Sku = 2.777
Sa = 0.267 µm, Sq = 0.353 µm, Sz = 3.115 µm,
Sp = 1.401 µm, Sv = 1.714 µm, Ssk = −0.533, Sku = 4.120
Disclaimer/Publisher’s Note: The statements, opinions and data contained in all publications are solely those of the individual author(s) and contributor(s) and not of MDPI and/or the editor(s). MDPI and/or the editor(s) disclaim responsibility for any injury to people or property resulting from any ideas, methods, instructions or products referred to in the content.