An Experimental Investigation of Twelve Concrete Beams Post-Tensioned with Unbonded Tendons Under Center-Point and Third-Point Loading
Abstract
1. Introduction
- σpmt and fps—stress in tendon at ultimate;
- σpm∞ and fpe—effective prestress—stress in tendon after immediate and time-dependent losses;
- Δσp,ULS and Δfps—stress increase in unbonded tendon beyond effective prestress.
- ρp—reinforcement ratio for prestressing reinforcement;
- fc′—compressive strength of concrete;
- fpy—specified yield strength of prestressing reinforcement;
- fpu—specified tensile strength of prestressing reinforcement.
- Janney J., Hognestad E., McHenry D. [10] investigated 19 rectangular simply supported beams under third-point loading. Of these, three were pretensioned, three were post-tensioned with bonded tendons, five were post-tensioned with unbonded tendons without deformed bars, five were post-tensioned with unbonded tendons with deformed bars, and five were reinforced with deformed bars only. It is worth emphasizing that in the group with prestressing reinforcement without bond and without additional rebars, only one or two cracks occurred. They had significantly lower capacity than members post-tensioned with bonded tendons.
- Pannell F. N. [11] conducted research on 38 simply supported members with unbonded tendons. The following parameters were tested: stress in tendon after all losses fpe, prestressing reinforcement ratio, and span-to-depth ratio.
- Mattock A., Yamazaki J., Kattula B. [6] tested three two-span continuous T-beams, four simply supported T-beams, and three simply supported rectangular beams. They investigated members with both bonded and unbonded tendons and proved that stress increments in unbonded tendons could reach much greater values than the recommended 105 MPa. Their work prompted the introduction of changes in the ACI Code.
- Tam A., Pannell F. N. [12] performed tests on eight simply supported rectangular beams under center-point loading. They tested the influence of the following parameters on the behavior of members post-tensioned with unbonded tendons: stress in tendon after all losses fpe, reinforcement ratio for rebars and prestressing reinforcement, span-to-depth ratio, and compressive strength of concrete.
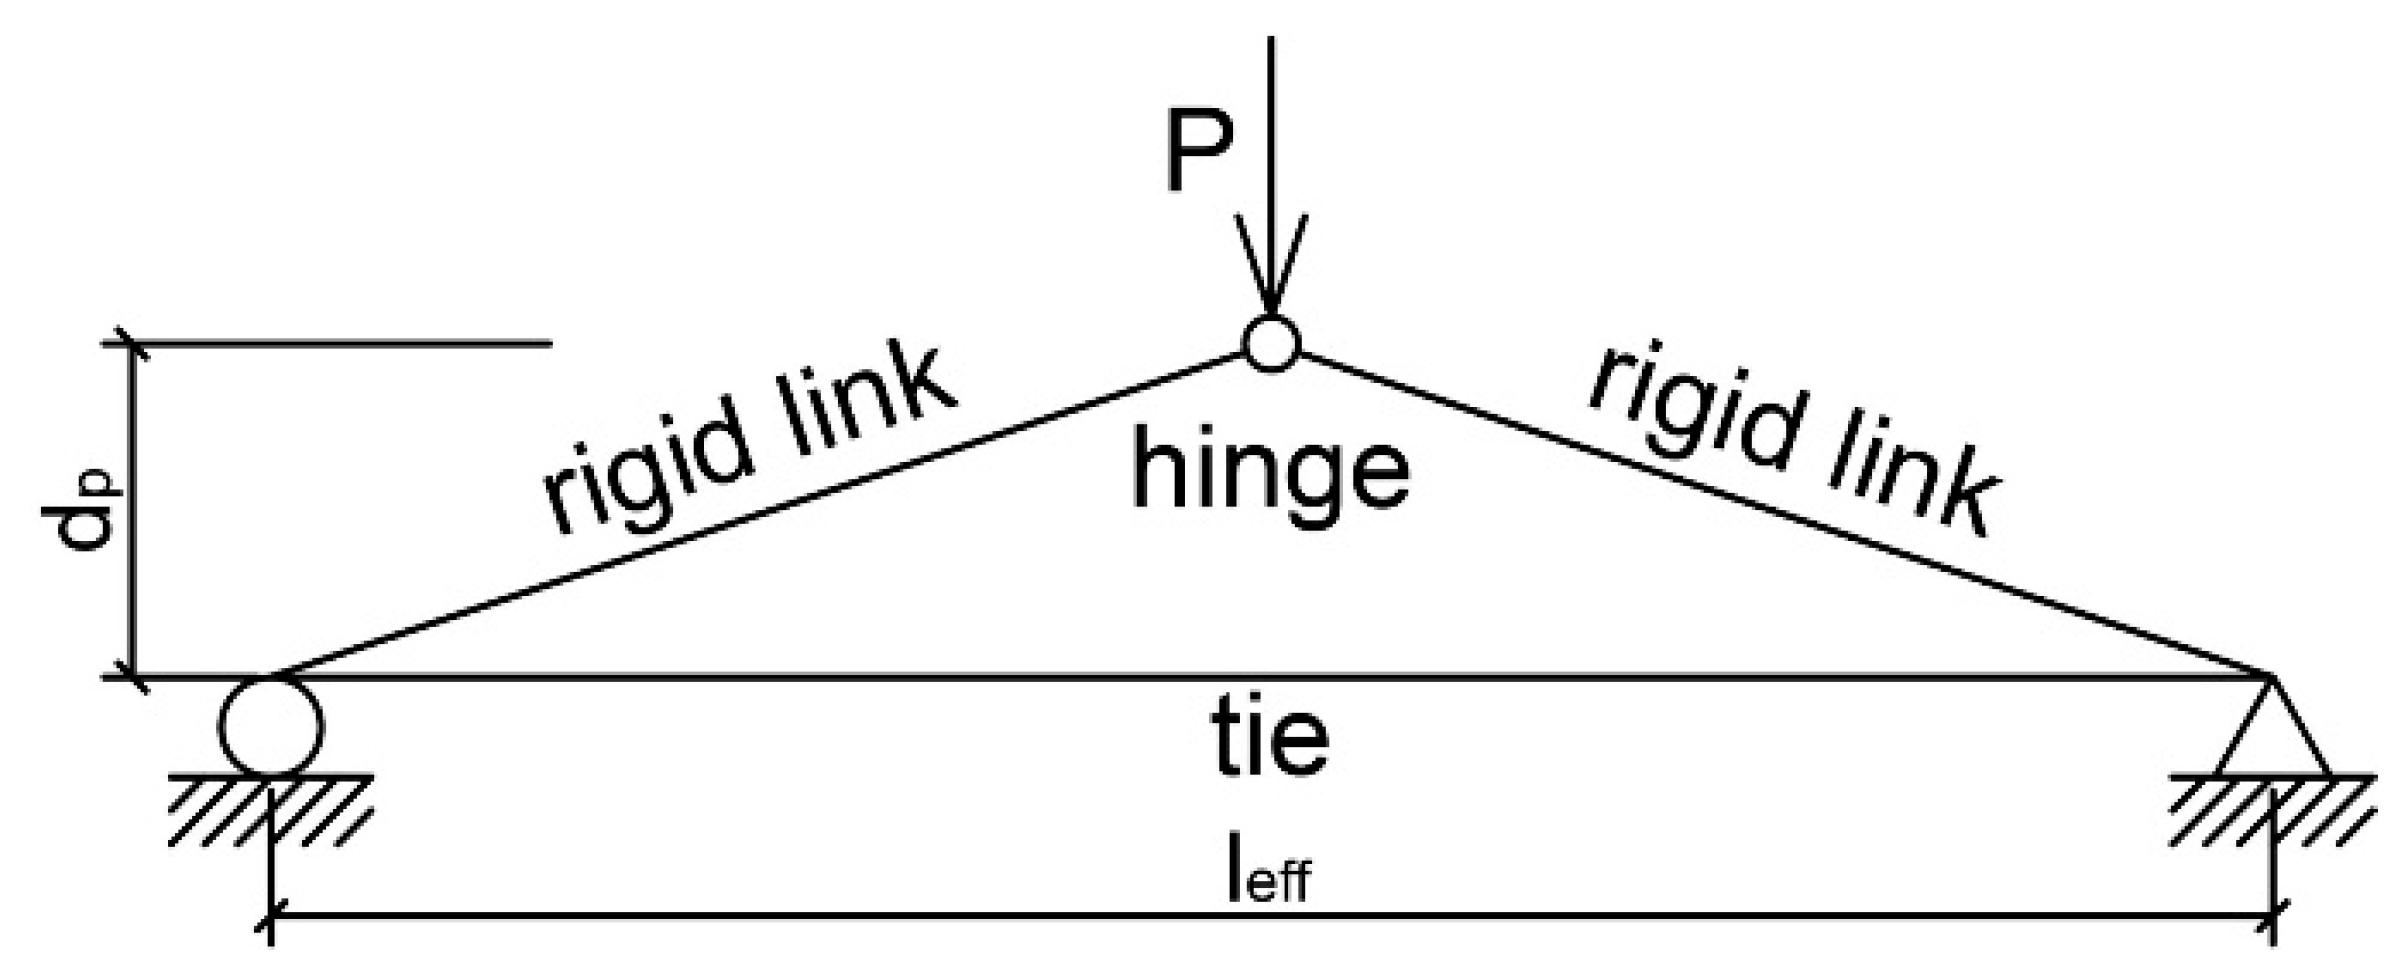
- Mojtahedi and Gamble [8] analyzed 16 beams with a large span-to-depth ratio. They indicated that the equation presented above (Equation (2)) can overestimate the stress increment in unbonded tendons and underestimate the flexural capacity of members. This happens due to the fact that only a few cracks appeared in the maximum moment region. Poor crack formation and propagation caused a small plastic hinge length, which led to more truss-like than beam-like behavior of the tested members (Figure 1).
- The aim of the test conducted by Cooke N., Park R., Yong Ph. [13] was to question the correctness of Equation (2). They tested nine simply supported members under third-point loading post-tensioned with unbonded tendons, divided into three groups with different span-to-depth ratios. The fourth group consisted of members with bonded tendons. The prestressing reinforcement ratio was the parameter that changed within each group.
- Du G., and Tao X. [14] investigated 26 simply supported members under third-point loading. Of these, 22 were with unbonded tendons and 4 were with bonded tendons. They all had the same span-to-depth ratio and differed with regard to concrete compressive strength, deformation of the bars, and the prestressing steel ratios. It was noted that the introduction of the proper amount of bar deformation led to better behavior of members post-tensioned with unbonded tendons. They acted in a similar way to those with bonded tendons. They described three phases of the response of elements to acting loading (Figure 2). Stage I is linear elastic uncracked, stage II is linear elastic cracked, and finally, stage III is the plastic phase. In members with low and medium values of the mechanical reinforcement ratio, all three phases could be observed, while for elements with a high value, only the first two were. They proposed boundary values of the reinforcement index, which can support the prediction of the behavior of the members.
- Campbell T. I. and Chouinard K. L. [15] tested six simply supported elements. They had the same span-to-depth ratio and prestressing reinforcement ratio. The only parameter that was changed during the experiment was the number of rebars.
- Research conducted by Harajli M. and Kanj M. [16] on 26 beams considered the following parameters: span-to-depth ratio (20, 13, and 8), type of loading (center-point and third-point), deformed and prestressing reinforcement ratio, and concrete compressive strength. A few of the members did not meet the ACI Code requirement regarding the minimum amount of ordinary reinforcement. In those under center-point loading, the behavior was not satisfactory due to the appearance of a large crack in the maximum moment region. In those under third-point loading, a few cracks in the region of constant moment appeared, but only one or two propagated at the final stage of loading.
- Daher Y. M. [20] investigated 11 simply supported beams—7 and 4 made from regular and high-strength concrete, respectively. The main aim was to establish the minimum reinforcement ratio, which would provide satisfactory behavior of the member up until the point of failure. All beams had the same cross-sectional dimensions and span-to-depth ratio. Both deformed and prestressing reinforcement ratios varied.
- Nassif H. et al. [21,22,23] tested 25 members—9 rectangular beams and 16 T-beams—under third-point loading. The following parameters were investigated: span-to-depth ratio, deformed and prestressing reinforcement ratio, stress in tendon after all losses, concrete compressive strength (HSC), and the type of cross-section. In most of the elements, three phases (elastic uncracked, elastic cracked, and plastic) were observed.
- Zhou W. and Zheng W. [24] conducted research on 16 two-span continuous beams with the same cross-section and concrete compressive strength under mid-span loading. They observed six stages during testing: stage I—elastic phase; stage II—first cracking at middle support; stage III—first cracking at span; stage IV—plastic hinge at middle support; stage V—plastic hinge at span, and stage VI—failure. During the first three stages, the stress increment in unbonded tendons was low and increased linearly. During the last three stages, the stress increment suddenly increased.
- Maguire M. et al. [25] tested four two-span slab specimens with span–depth ratios above 30. In the first two cases, the loading was acting in the live-end span and dead-end span, respectively, inducing maximum positive bending moments. In the two remaining specimens, the live load was acting in both spans, inducing an elastic maximum negative bending moment at the support and forming the first hinge at the center support and secondary hinges in both spans. Tendon stress increases in the tendons were compared to prediction equations by AASHTO LRFD, ACI 318 Building Code, Naaman, and Alkhairi. The test results and calculations indicated measured-to-predicted ratios between 1.23 and 3.99 and showed large scatter.
- Nakari T et al. [26,27] conducted research on four two-span T-shaped beams. All beams had the same number of unbonded tendons, and the degree of prestressing was kept constant. By contrast, the amount of passive reinforcement at the center support varied. Rotation capacity and moment redistribution were tested. The stress increments in unbonded tendons were considerably large in all tested members and allowed them to reach the yield point of tendon reinforcement.
- At very low values of the qe index, the ultimate moment is equal to the cracking moment. After the appearance of the first crack, the rapid increase in deflection and the lack of member response could be expected. Such a behavior was observed in experiments conducted by Pannell (for qe ≤ 0.15), Cook et al. (UB9—qe = 0.032), and Daher (R-4—qe = 0.028).
- At low values of the qe index, after the appearance of the first crack, a rapid increase in deflection and poor member response could be expected. The deflection increase led to stress increments in unbonded tendons, which allowed the achievement of bending resistance greater than the cracking moment. This kind of behavior was observed in tests performed by Cooke et al. (UB3 and UB6—qe = 0.033 and 0.029, respectively) and Daher (R-1 and RH-1—qe = 0.033 and 0.03, respectively).
- At average values of the qe index, more cracks are expected than with previous qe index values, but still fewer cracks than in pretensioned and post-tensioned members with a bond between the prestressing steel and the concrete. The occurrence of the first crack will not lead to a rapid deflection increment and a poorer response to external loading. Such behavior was observed in experiments conducted by Janney et al. (all elements from Group 3 except 3-.428), Pannell (for 0.15 < qe ≤ 0.30), Cooke et al. (UB2, UB5, and UB8—qe = 0.125, 0.111, and 0.125, respectively), Campbell et al. (beam no. 1—qe = 0.139), and Nassif (rectangular beam no. 8 and T-beam no. 13—qe = 0.064 and 0.030, respectively).
- At high values of the qe index, the crack pattern is expected to be very similar to those in pretensioned and post-tensioned members with a bond between the prestressing steel and the concrete, but due to a lack of bonded reinforcement, deviation of the crack width could be greater. This kind of behavior was observed in a test performed by Janney et al. (element 3-.428), Pannell (qe > 0.30), and Cooke et al. (UB1, UB4, and UB7—qe = 0.254, 0.223, and 0.249, respectively). It is worth emphasizing that the bending resistance of members UB4 and UB7 was slightly greater than member B4, which has the same properties but was post-tensioned with bonded tendons. This indicates that a high value of the qe index ensures similar behavior of these types of structures.
| Team | Janney et al. [10] | Pannell [11] | Cooke et al. [13] | Daher [20] | Nassif et al. [21,22,23] | |||||
|---|---|---|---|---|---|---|---|---|---|---|
| Index range | qe min | qe max | qe min | qe max | qe min | qe max | qe min | qe max | qe min | qe max |
| 0.060 | 0.242 | 0.053 | 0.335 | 0.029 | 0.254 | 0.028 | 0.033 | 0.030 | 0.064 | |
- At very low values of qs and q0 indexes, the member could behave in a similar manner to those with unbonded tendons only. After the appearance of one dominant crack, a sudden deflection and a lack of response to external loading could be expected. This kind of behavior was observed in a test conducted by Daher (R-2 and R-5—qs = 0.006 and RH-2 and RH-3, qs = 0.003 and 0.005, respectively).
- At low values of qs and q0 indexes, several cracks can occur in the initial phase of loading, but only one or two will propagate. This type of beam can achieve satisfying bending resistance and stress increments in unbonded tendons, but the crack pattern cannot be accepted due to the allowable crack width being exceeded. Such a behavior was noticed by Harajli (beams with qs ∈ <0.013–0.020> and q0 ∈ <0.039–0.135>).
- At an average value of the q0 index and a satisfactory value of qs, a similar behavior to that in members with bonded tendons can be expected. Proper crack formation and propagation are expected, and the load–deflection chart should include all three stages of member behavior: elastic uncracked, elastic cracked, and plastic. This statement was confirmed by the following tests: Janney et al. (elements 4-.131 and 4-.285—q0 = 0.097 and 0.184, respectively), Mattock et al. (T-beams TU1 and TU2—q0 = 0.054 and 0.044, respectively), Tam et al. (q0 < 0.2), Du et al. (q0 < 0.25), Campbell et al. (beams no. 2, 3, and 4—q0 = 0.213, 0.292, and 0.319, respectively), Chakrabarti et al. (qu ∈ <0.1 ÷ 0.25>), and Nassif (q0 < 0.25).
- With high values of the q0 index and a satisfactory value of qs, a similar behavior to that in members with bonded tendons can be expected. Proper crack formation and propagation is expected, and the load–deflection chart should include only the first two stages of member behavior: elastic uncracked and elastic cracked. Such behavior could be observed in elements tested by Janney et al. (element 4-.455—q0 = 0.270), Mattock et al. (rectangular beams RU1 and RU2—q0 = 0.299), Tam et al. (q0 > 0.2), Du et al. (q0 > 0.25), Campbell et al. (beams no. 5 and 6—q0 = 0.380, and 0.445, respectively), and Chakrabarti et al. (qu > 0.25).
| Team | Janney et al. [10] | Mattock et al. [6] | Tam et al. [12] | Du et al. [14] | Campbell et al. [15] | |||||
| Index range | qs min | qs max | qs min | qs max | qs min | qs max | qs min | qs max | qs min | qs max |
| 0.064 | 0.071 | 0.007 | 0.065 | 0.048 | 0.130 | 0.021 | 0.349 | 0.075 | 0.323 | |
| q0 min | q0 max | q0 min | q0 max | q0 min | q0 max | q0 min | q0 max | q0 min | q0 max | |
| 0.097 | 0.270 | 0.044 | 0.299 | 0.112 | 0.255 | 0.063 | 0.470 | 0.213 | 0.445 | |
| Team | Harajli et al. [16] | Chakrabarti [17,18,19] | Daher [20] | Nassif et al. [21,22,23] | Zhou et al. [24] | |||||
| Index range | qs min | qs max | qs min | qs max | qs min | qs max | qs min | qs max | qs min | qs max |
| 0.013 | 0.164 | 0.007 | 0.219 | 0.003 | 0.012 | 0.012 | 0.044 | 0.031 | 0.242 | |
| q0 min | q0 max | q0 min | q0 max | q0 min | q0 max | q0 min | q0 max | q0 min | q0 max | |
| 0.039 | 0.255 | 0.023 | 0.318 | 0.017 | 0.043 | 0.030 | 0.180 | 0.085 | 0.477 | |
2. Experimental Program
2.1. Members Geometry
2.2. Material Properties
2.3. Test Stand and Instrumentation Equipment
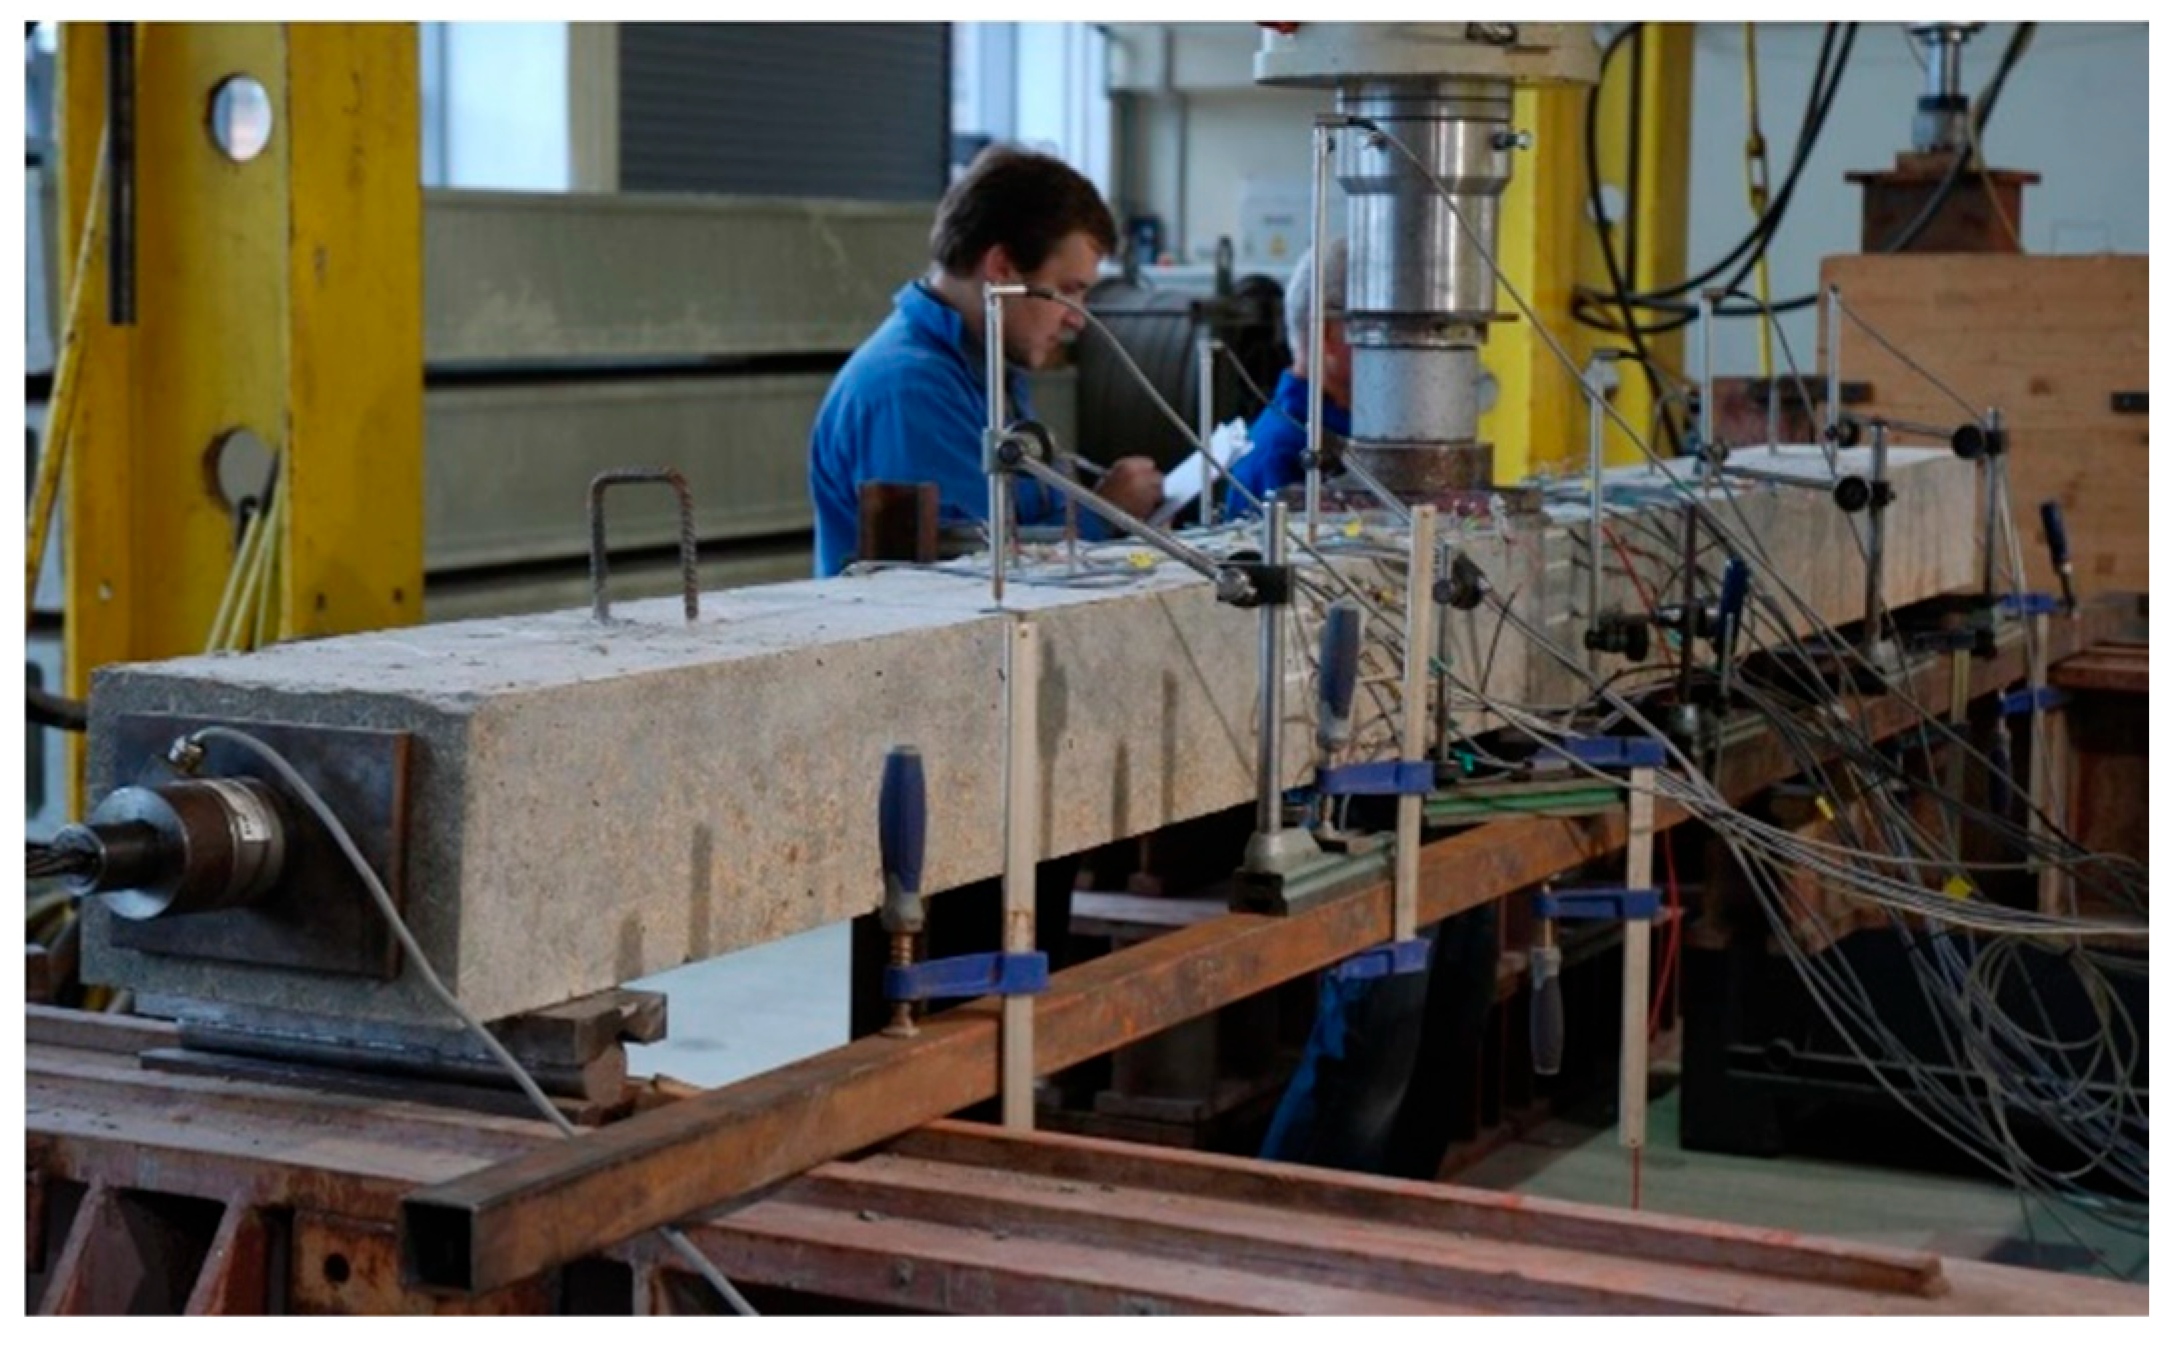
- The loading force in the hydraulic test machine was recorded.
- Force in the unbonded tendons was measured by use of force transducers placed under each of the anchorages—two for T1 and four for T2 beams (Figure 9).
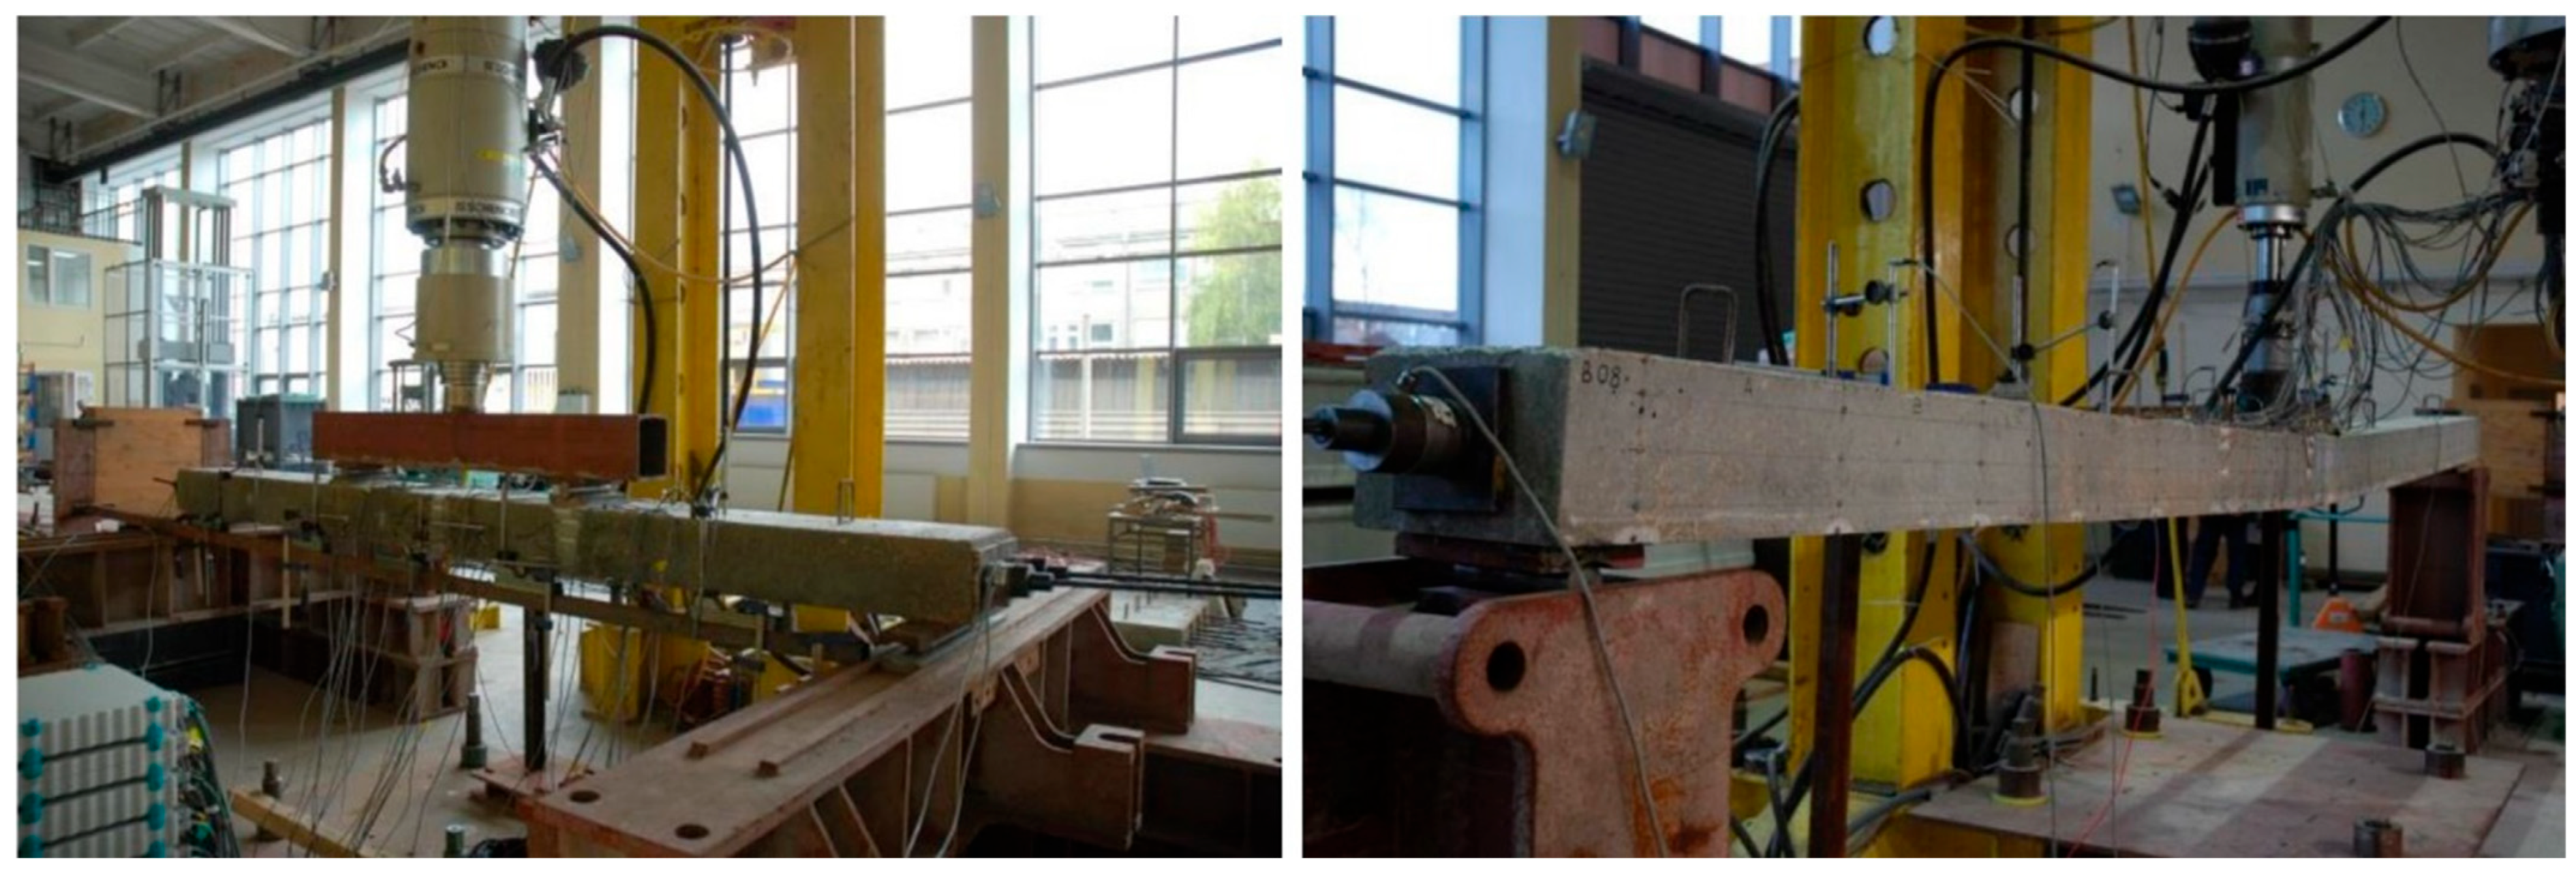
- Displacements at 1/6, 1/3, 1/2, 2/3, and 5/6 of the span length were measured by means of displacement transducers; the displacement in the mid-span was also controlled by a hydraulic machine piston extension (Figure 10).
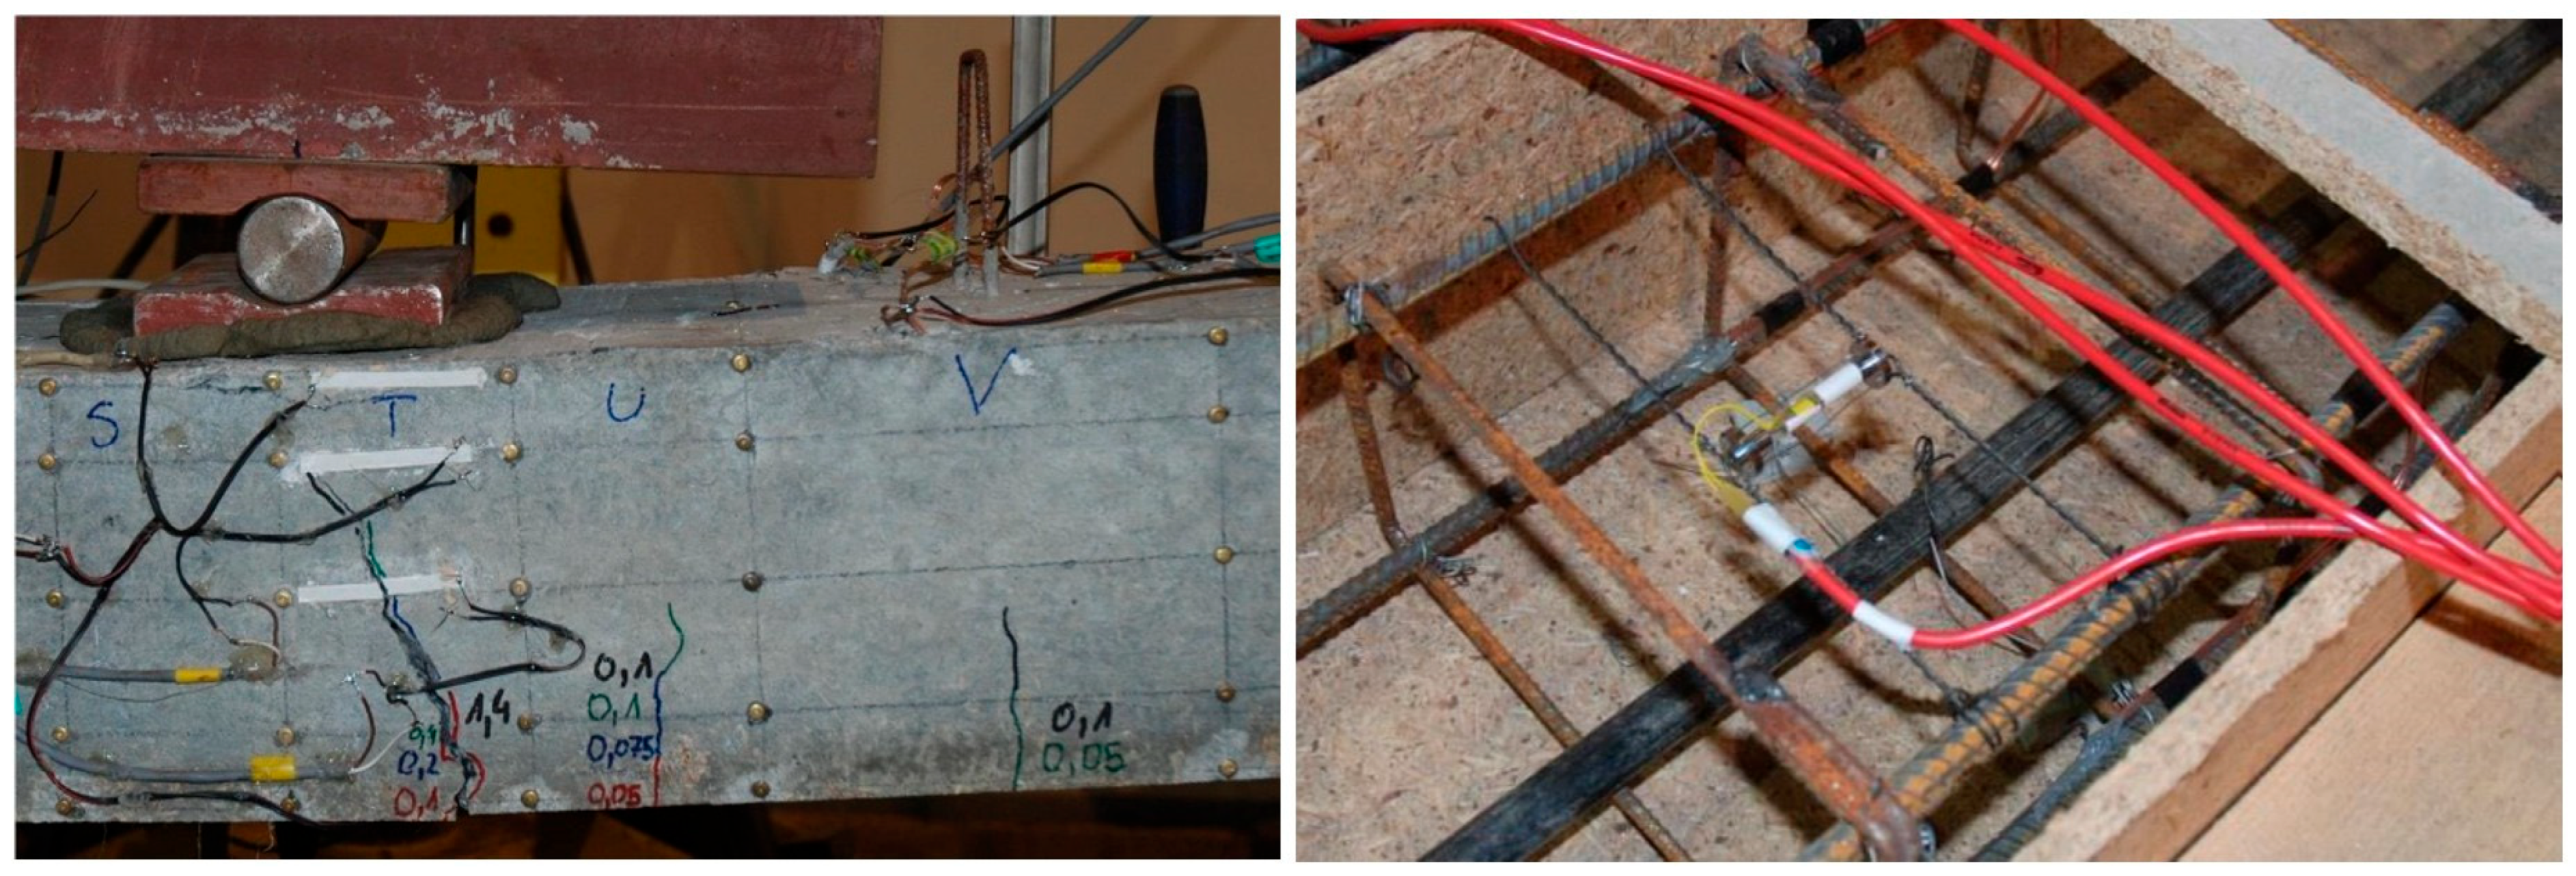
- Strains along beams were measured using a detachable mechanical strain gauge DEMEC. Steel discs attached to the structure using a suitable adhesive were placed on the front face of the beam 5, 40, 100, 160, and 195 mm from the bottom (Figure 11).
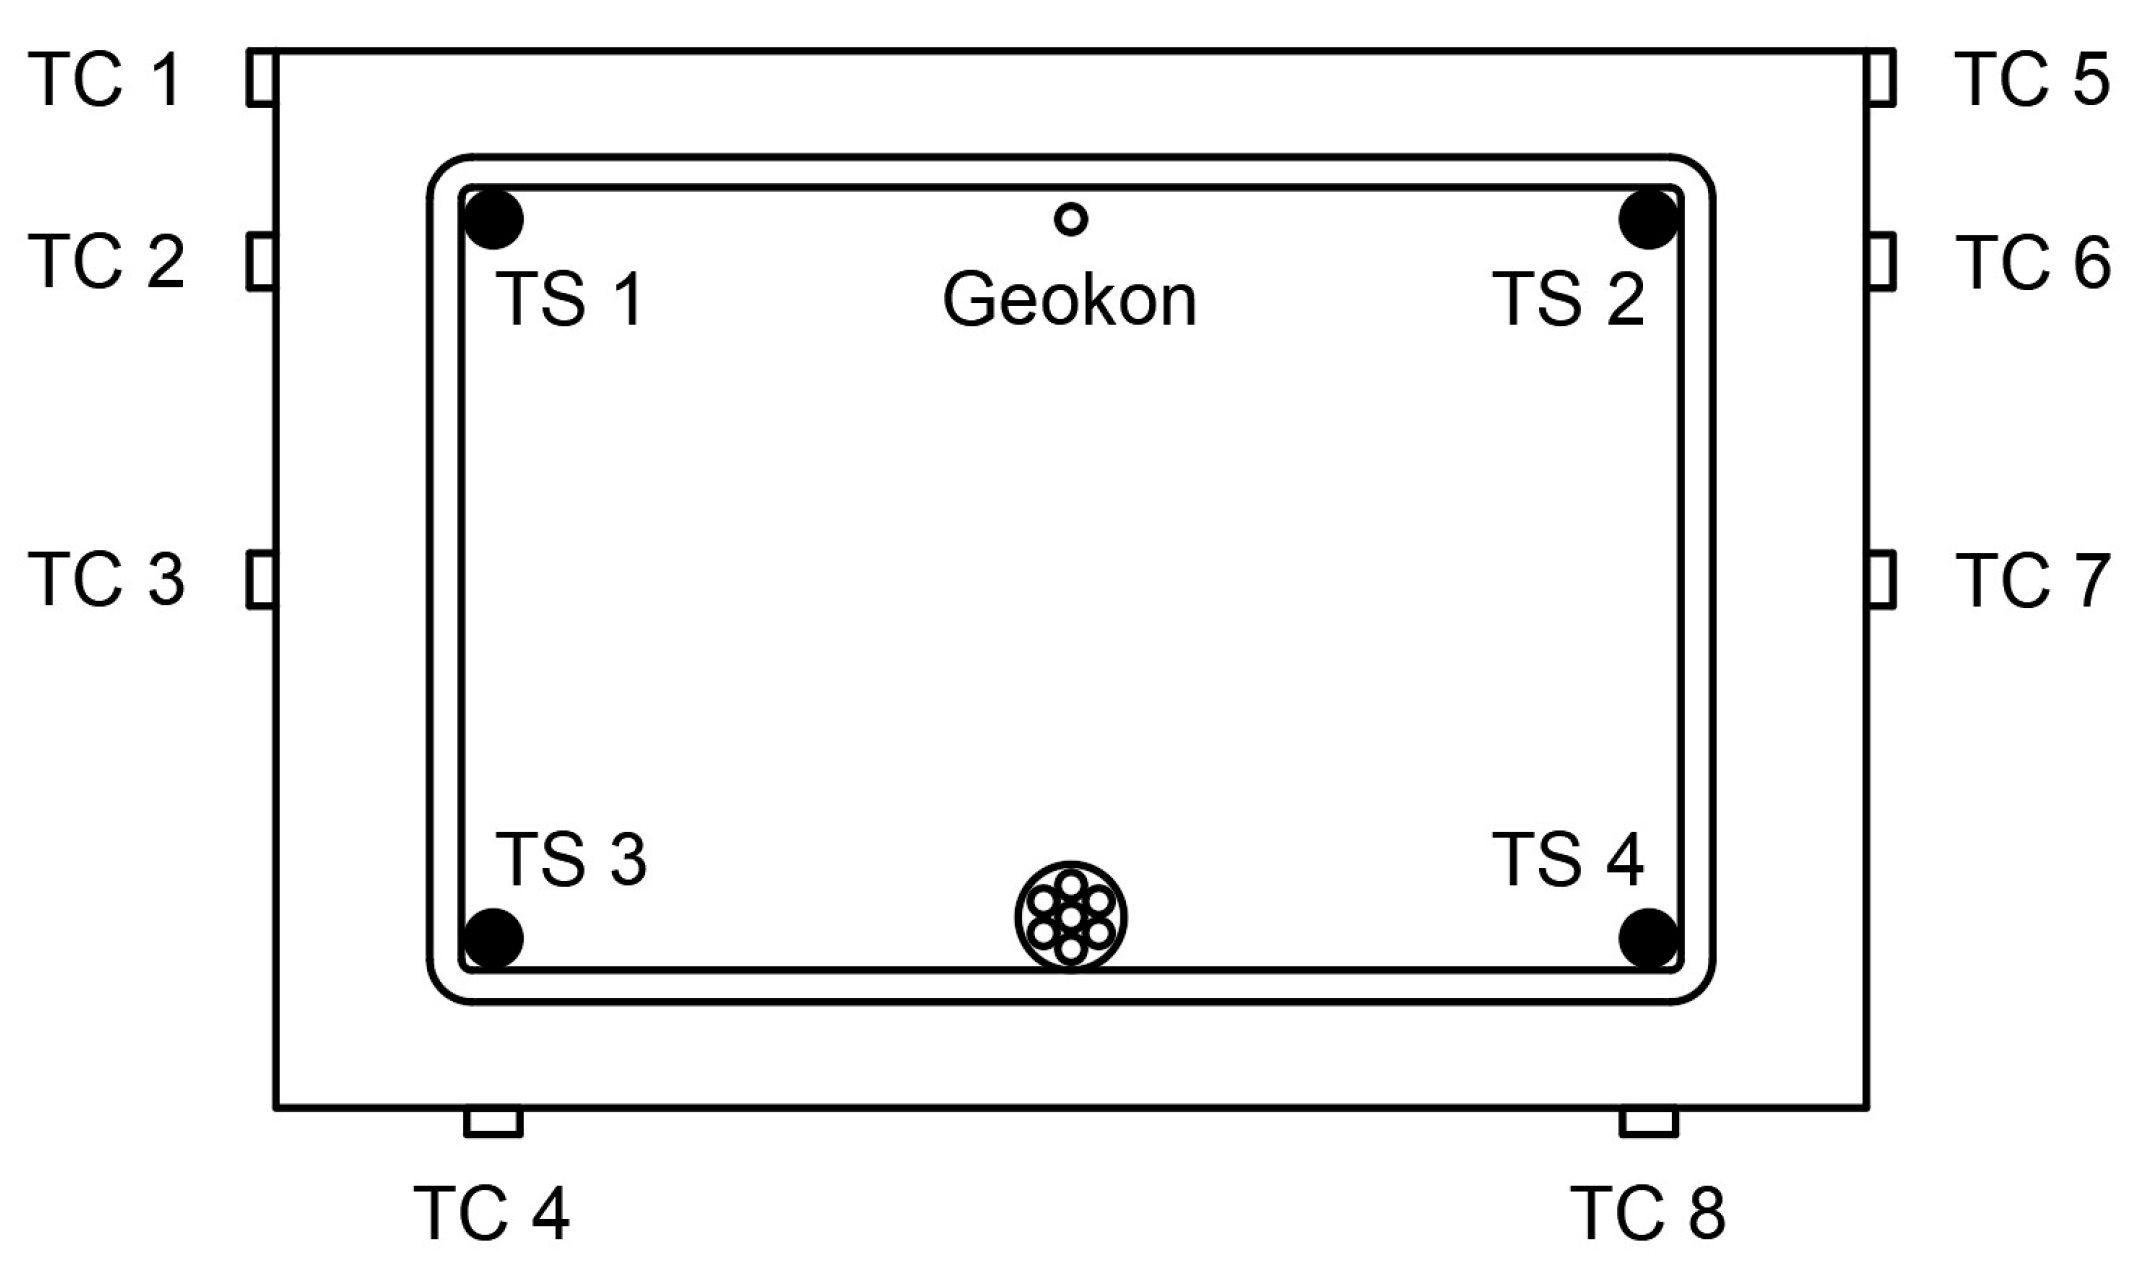
- Strains in critical cross-sections (1/2 and 1/3 span lengths) were measured using electrical strain gauges. These were attached to the bottom, front, and rear faces of each beam, and also to the reinforcing bars. A sketch presenting the strain gauge arrangement is shown in Figure 12. In the mid-span of each beam, a Geokon vibrating wire strain gauge was placed. It was placed in the center of the beam at the level of the upper reinforcement bars.
2.4. Research Timetable and Loading Phases
3. Experimental Results
3.1. Detailed Results for the L36T2F2 Member

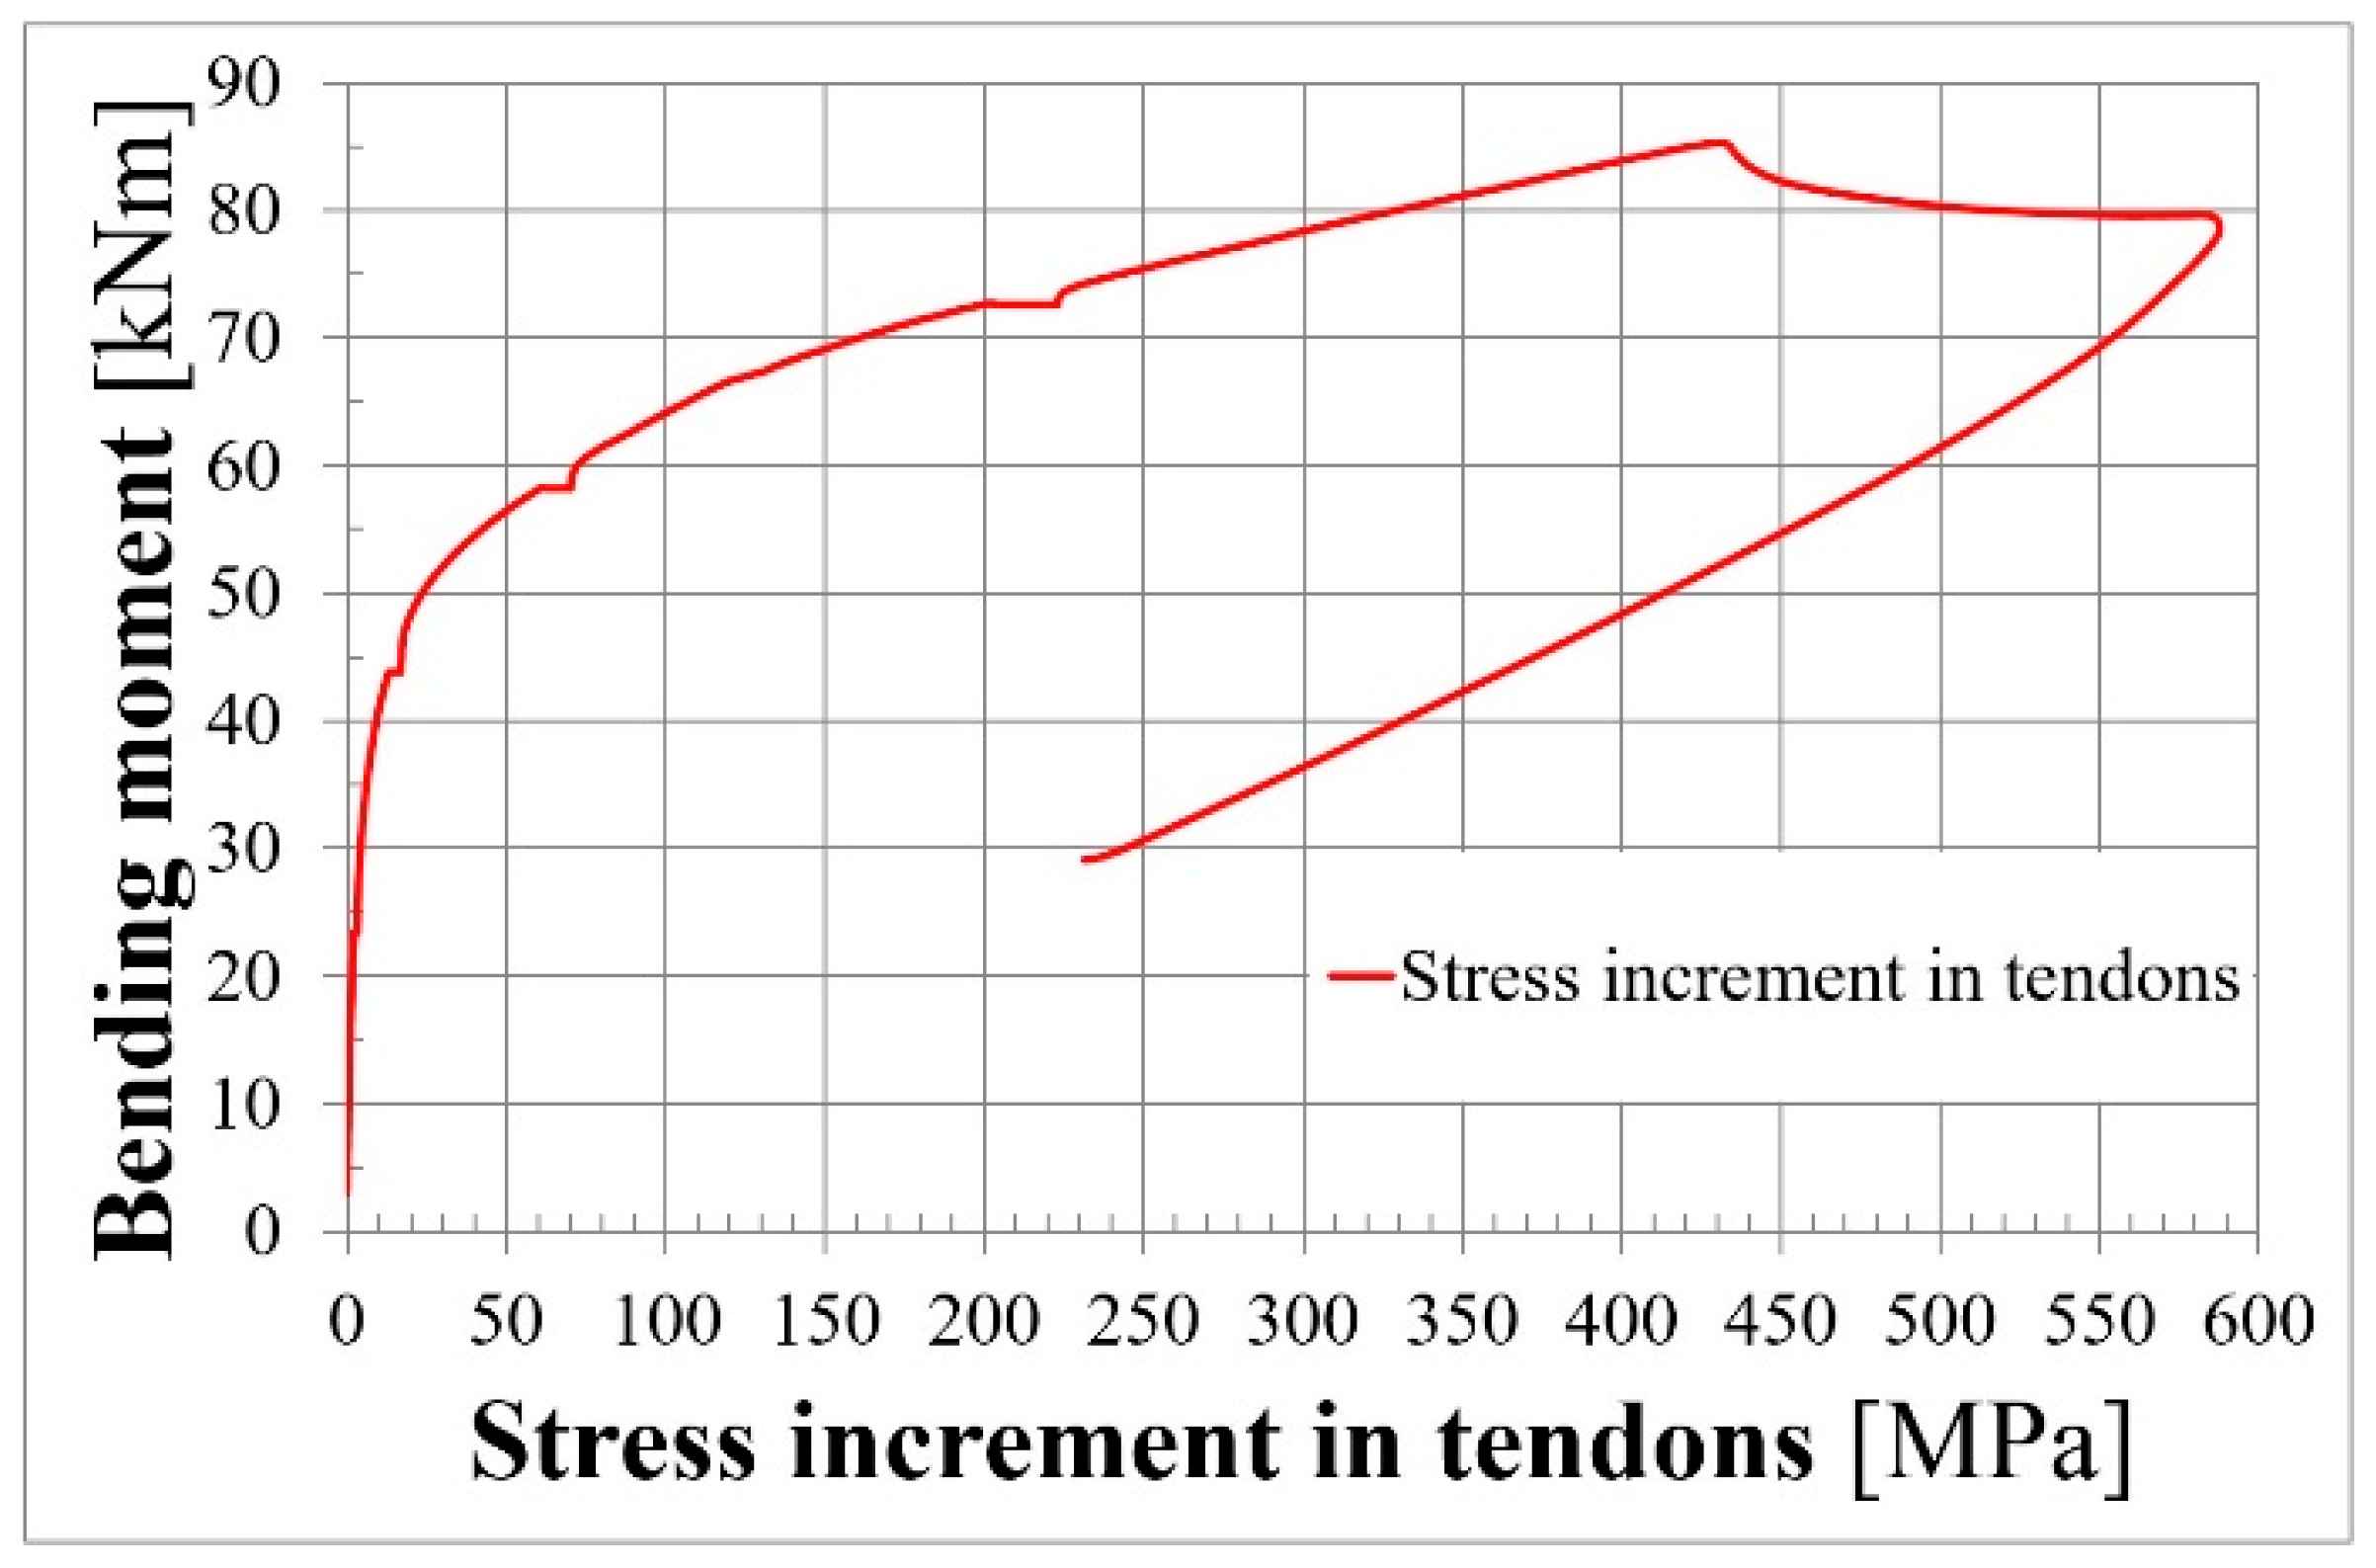

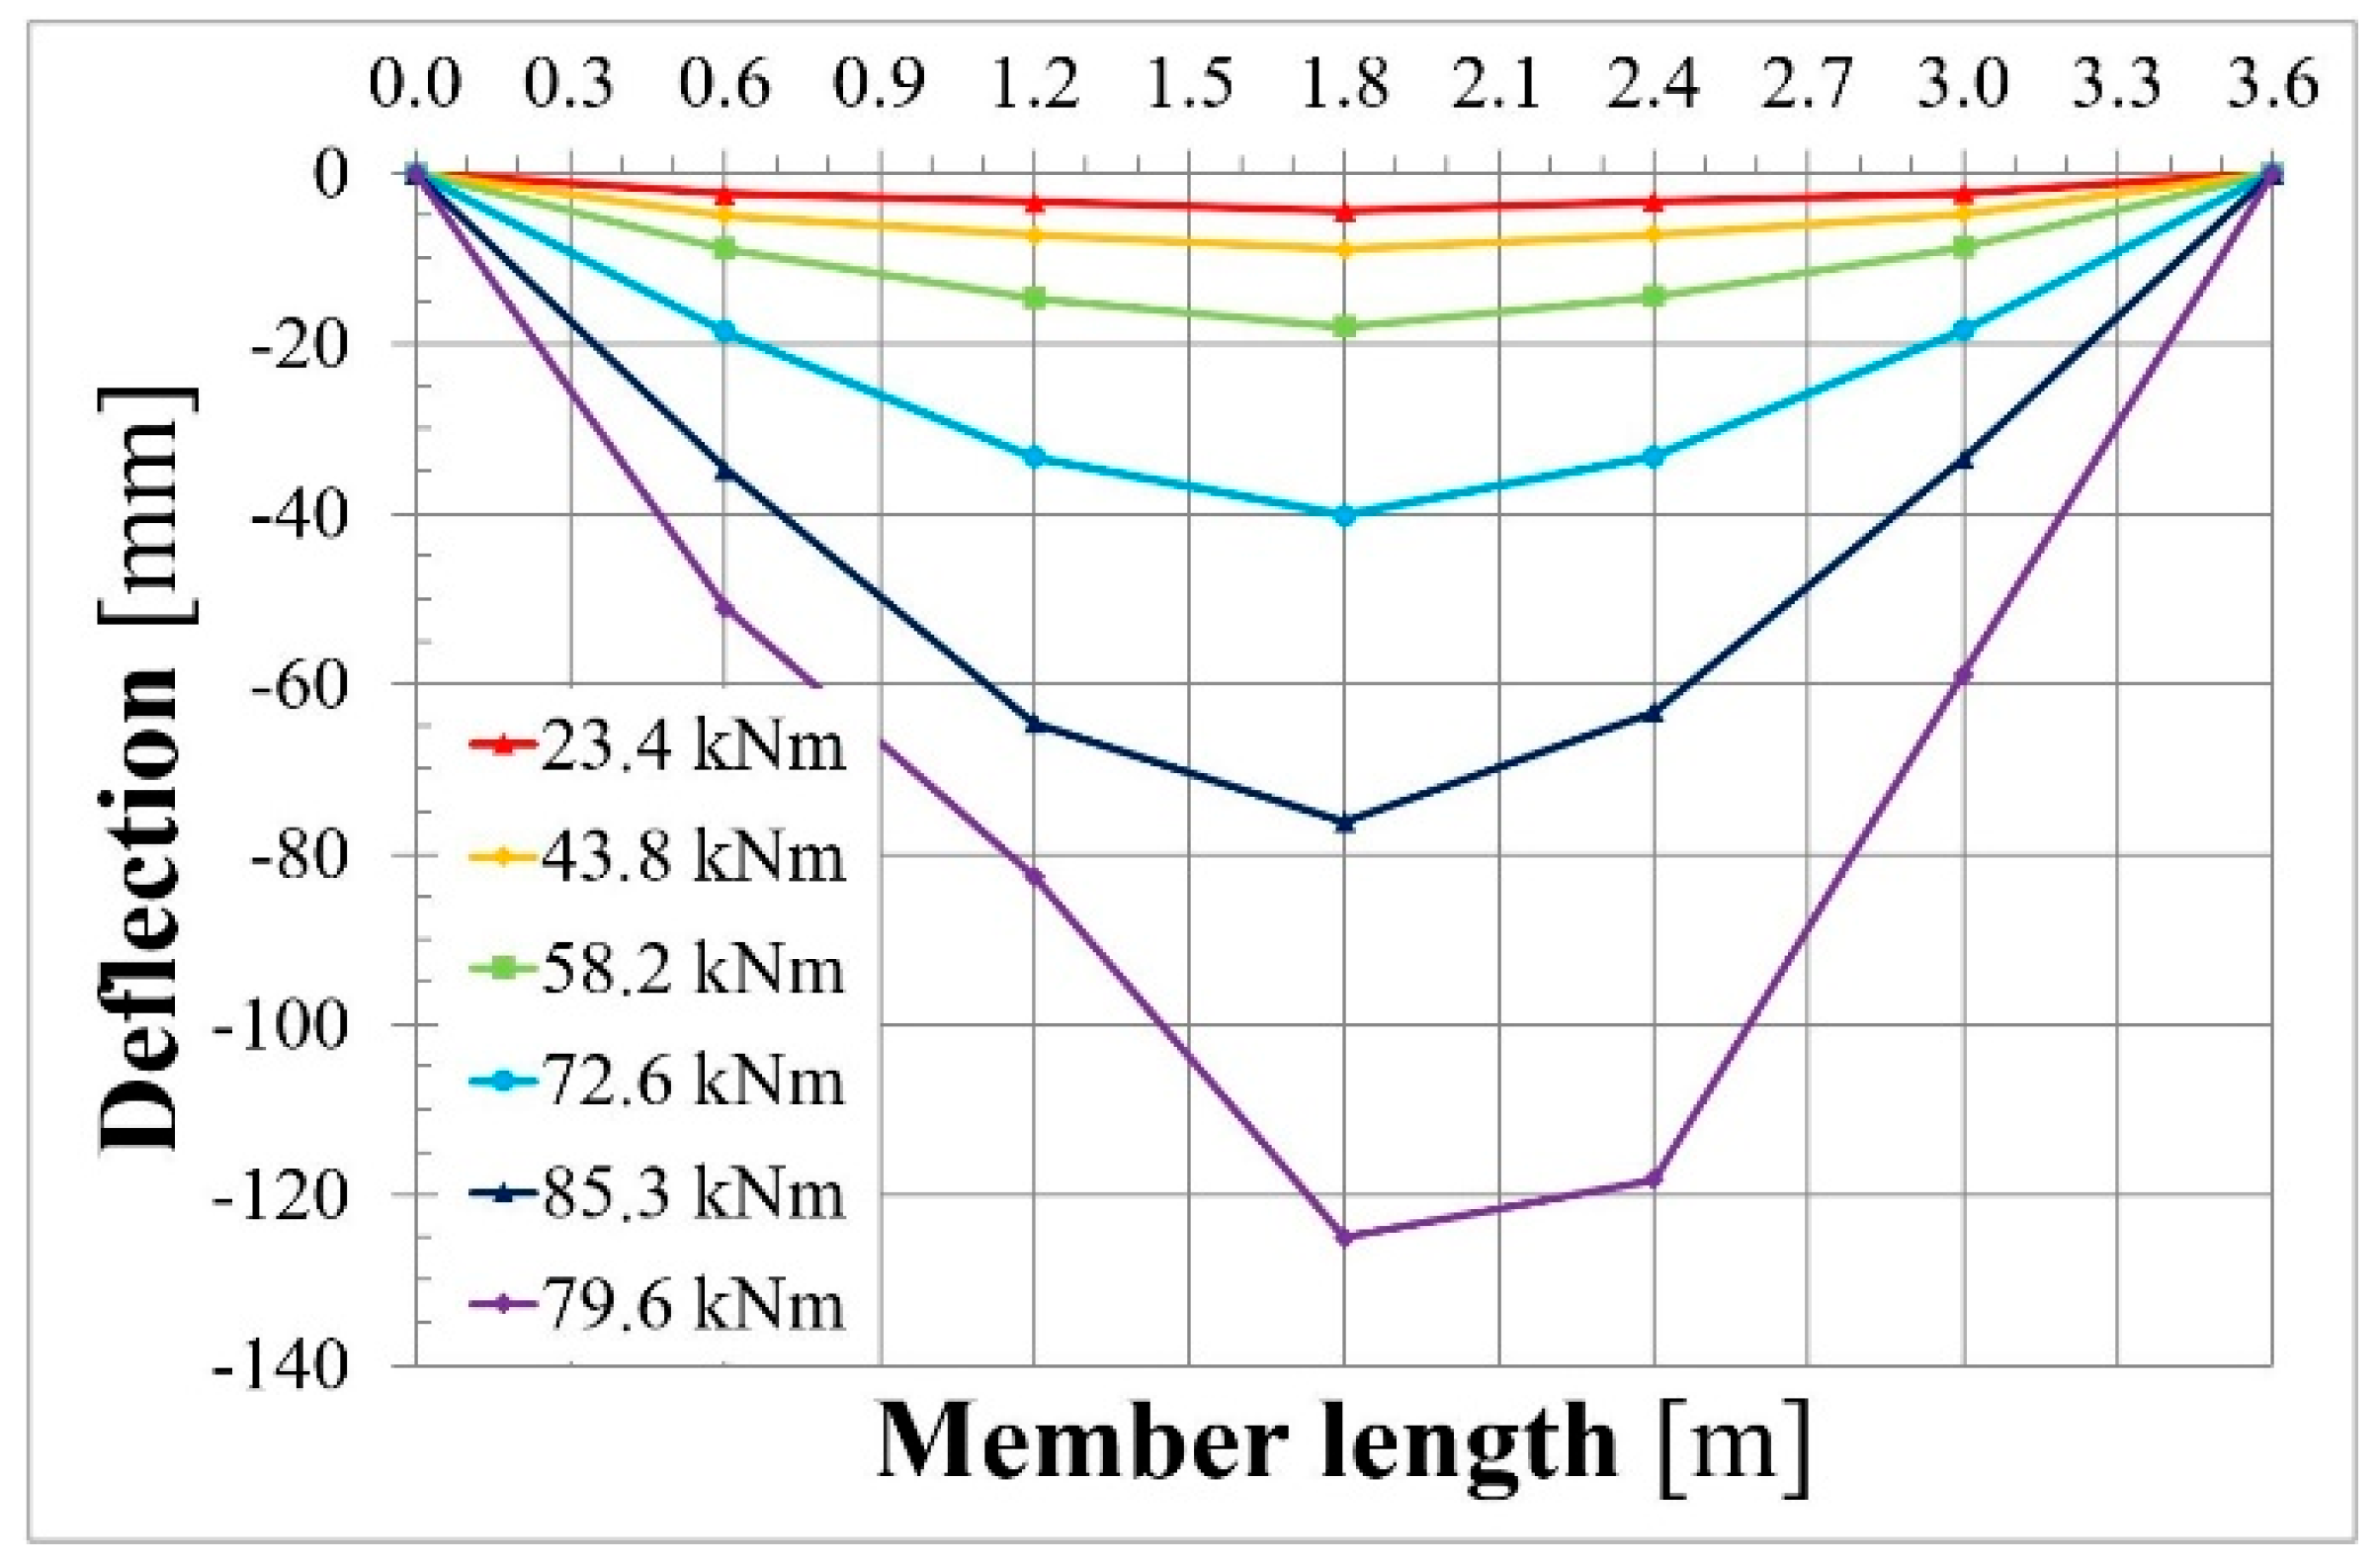


3.2. Compilation of Results for All Members
| Concrete | Ordinary Reinforcement | Prestressing Reinforcement | Indexes | |||||||||
|---|---|---|---|---|---|---|---|---|---|---|---|---|
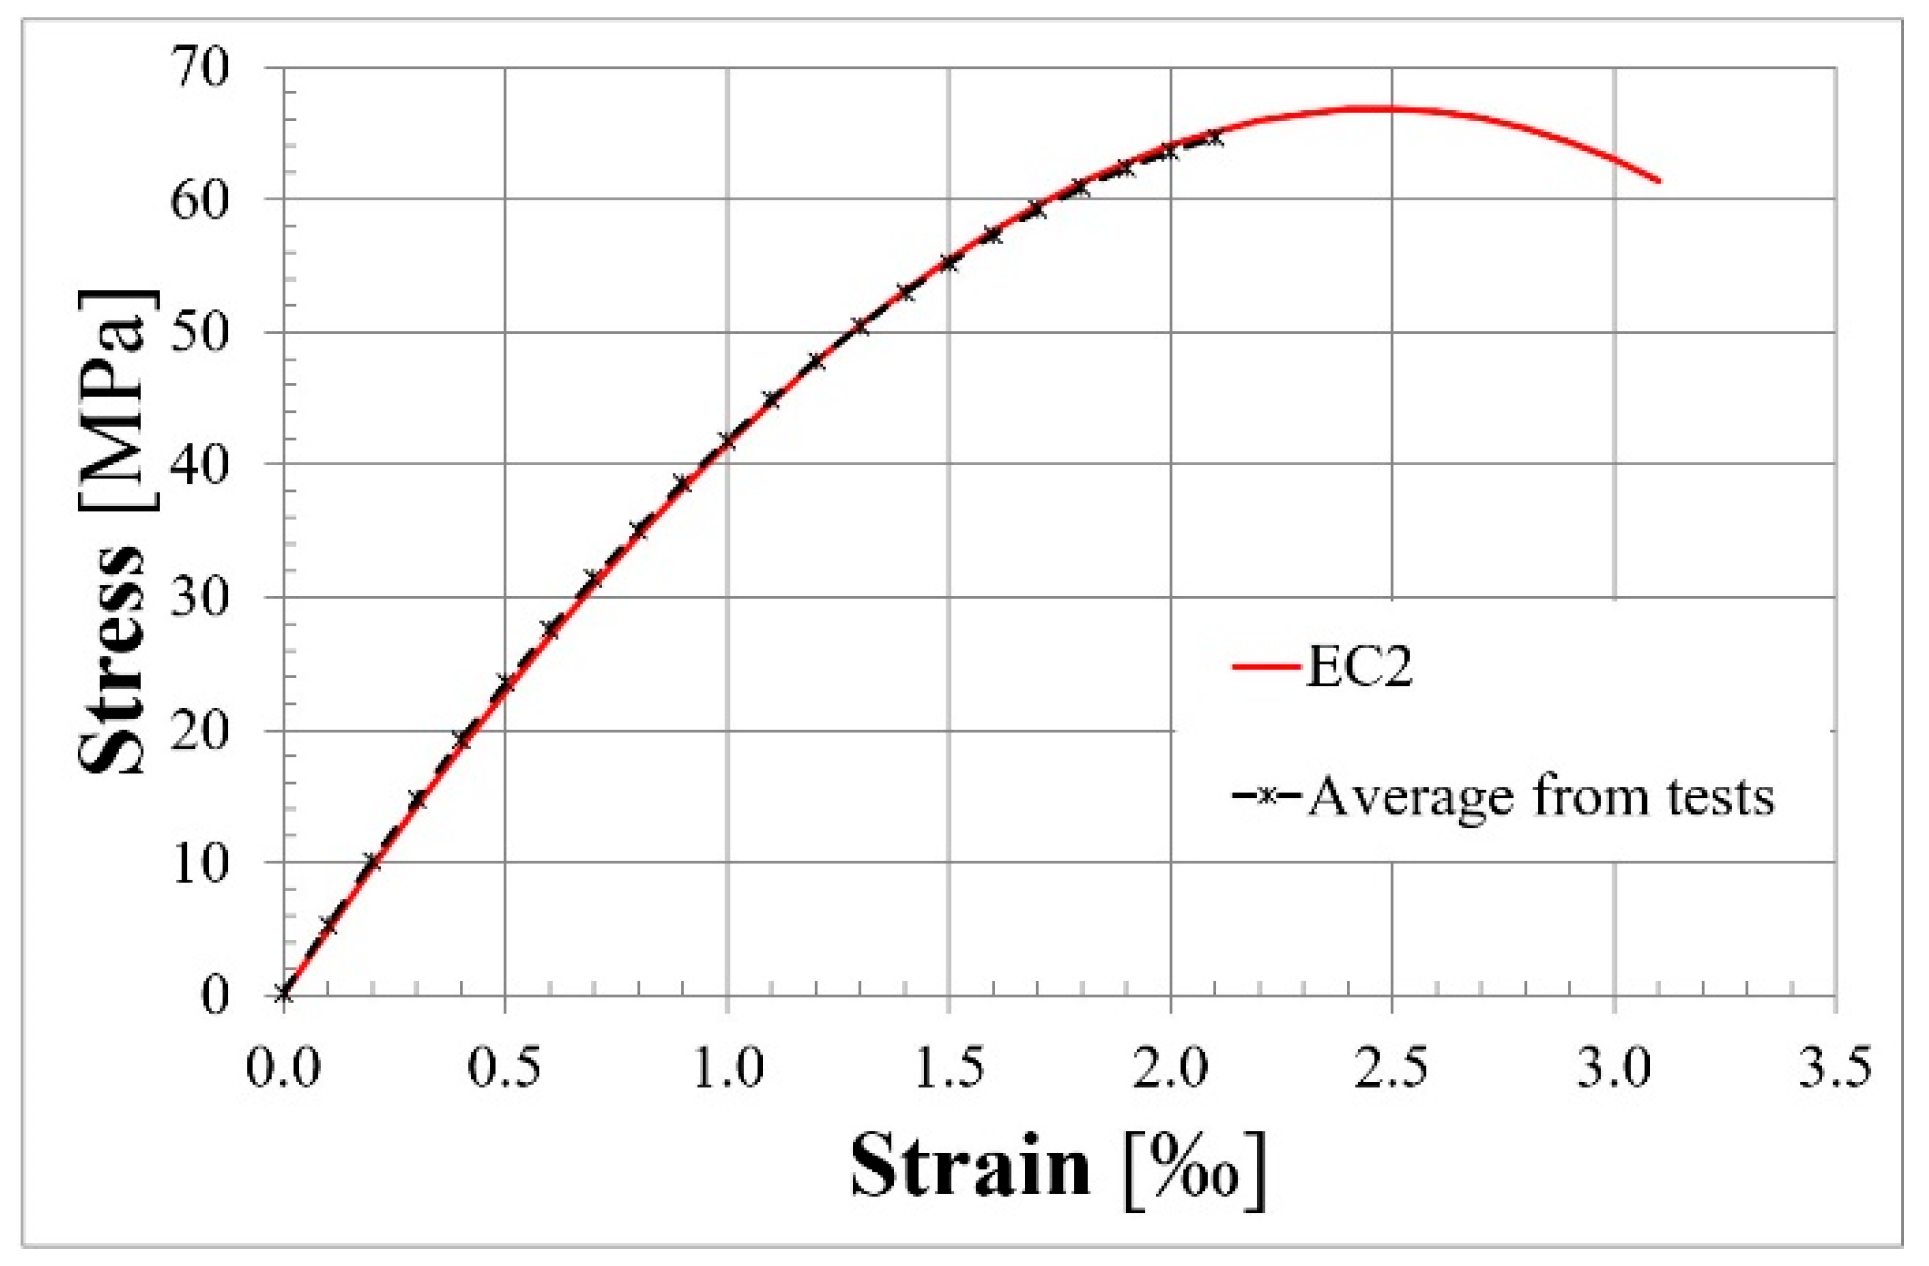
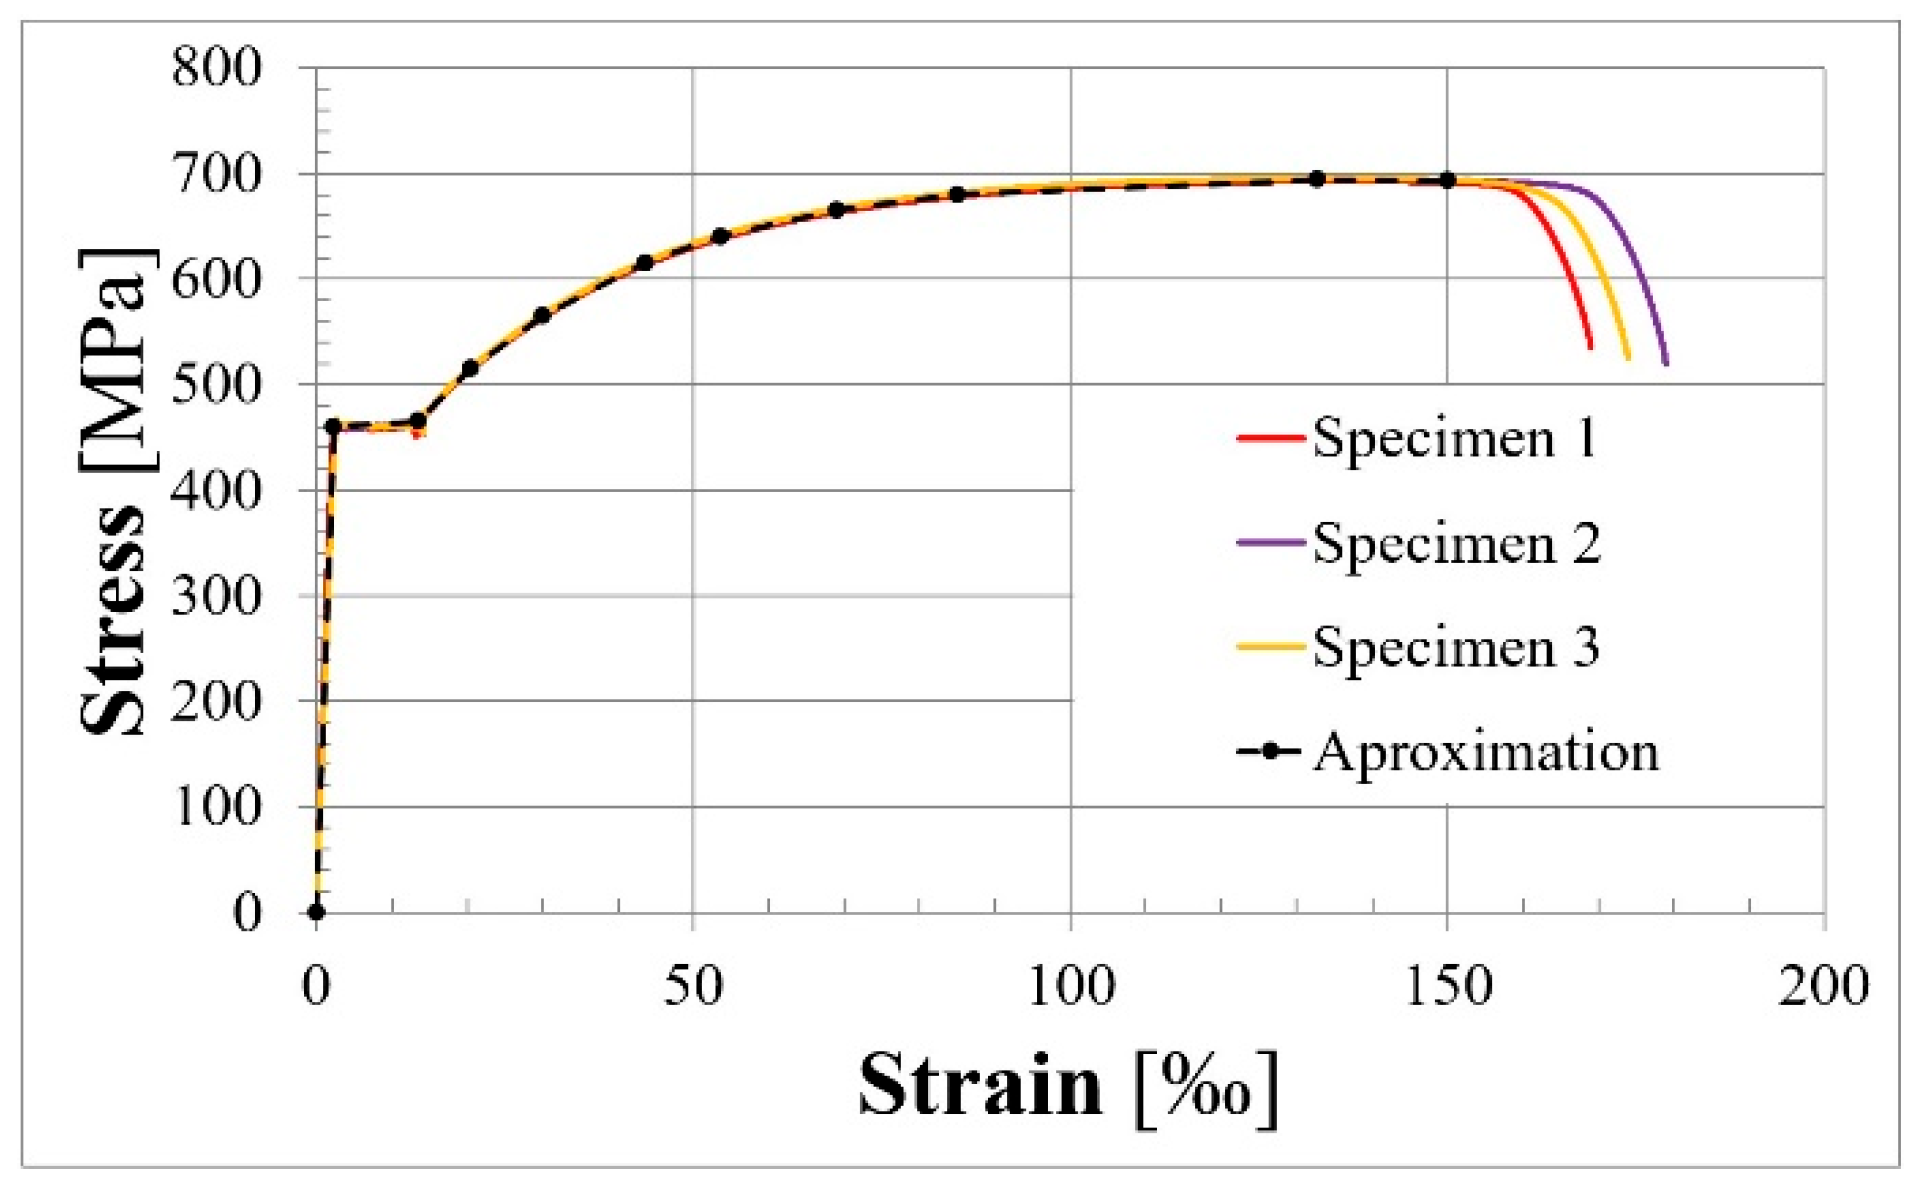
| Name of Member | Modulus of Elasticity [GPa] | Compressive Strength [MPa] | Reinforcement Ratio ρs [-] | Yield Strength [MPa] | Reinforcement Ratio ρp [-] | Effective Prestress [MPa] | 0.1% Proof Stress [MPa] | Ordinary Reinforcement Index qs = ρs∙fy/fc | Prestressing Reinforcement Index qe = ρp∙fpe/fc | Prestressing Reinforcement Index qps = ρp∙fpy/fc | Reinforcement Index q0 = qs + qe | Reinforcement Index qy = qs + qps |
| L36T2F2 | 47.5 | 66.8 | 0.33% | 460 | 0.63% | 1127 | 1742 | 0.023 | 0.107 | 0.165 | 0.130 | 0.188 |
| L36T2F1 | 47.5 | 66.8 | 0.33% | 460 | 0.63% | 1109 | 1742 | 0.023 | 0.105 | 0.165 | 0.128 | 0.188 |
| L36T1F2 | 47.5 | 66.8 | 0.33% | 460 | 0.32% | 1109 | 1742 | 0.023 | 0.053 | 0.083 | 0.075 | 0.105 |
| L36T1F1 | 47.5 | 66.8 | 0.33% | 460 | 0.32% | 1138 | 1742 | 0.023 | 0.054 | 0.083 | 0.077 | 0.105 |
| L60T2F2 | 47.5 | 66.8 | 0.33% | 460 | 0.63% | 1127 | 1742 | 0.023 | 0.107 | 0.165 | 0.130 | 0.188 |
| L60T2F1 | 47.5 | 66.8 | 0.33% | 460 | 0.63% | 1136 | 1742 | 0.023 | 0.108 | 0.165 | 0.130 | 0.188 |
| L60T1F2 | 47.5 | 66.8 | 0.33% | 460 | 0.32% | 1130 | 1742 | 0.023 | 0.054 | 0.083 | 0.076 | 0.105 |
| L60T1F1 | 47.5 | 66.8 | 0.33% | 460 | 0.32% | 1135 | 1742 | 0.023 | 0.054 | 0.083 | 0.076 | 0.105 |
| L84T2F2 | 47.5 | 66.8 | 0.33% | 460 | 0.63% | 1122 | 1742 | 0.023 | 0.106 | 0.165 | 0.129 | 0.188 |
| L84T2F1 | 47.5 | 66.8 | 0.33% | 460 | 0.63% | 1121 | 1742 | 0.023 | 0.106 | 0.165 | 0.129 | 0.188 |
| L84T1F2 | 47.5 | 66.8 | 0.33% | 460 | 0.32% | 1166 | 1742 | 0.023 | 0.055 | 0.083 | 0.078 | 0.105 |
| L84T1F1 | 47.5 | 66.8 | 0.33% | 460 | 0.32% | 1167 | 1742 | 0.023 | 0.055 | 0.083 | 0.078 | 0.105 |
3.2.1. Cracking, Yield, and Ultimate Moments of Tested Members
| Member Stiffness Decrease [kNm] | First Cracking [kNm] | Yield Moment [kNm] | Bending Resistance [kNm] | Stress Increment [MPa] | Compressive Zone Depth [mm] | Compressive Strain [‰] | Compressive Zone Depth [mm] | Compressive Strain [‰] | |
|---|---|---|---|---|---|---|---|---|---|
| 1/3 Span Length | 1/2 Span Length | ||||||||
| L36T2F2 | 35 | 40 | 68 | 85.3 | 431 | 35 | 2.3 | 48 | 1.9 |
| L36T2F1 | 35 | 35 | 68 | 86.4 | 447 | 111 | 0.6 | - | 3 |
| L36T1F2 | 22 | 25 | 39 | 54.8 | 575 | 18 | 2.8 | 31 | 2.6 |
| L36T1F1 | 21 | 23 | 45 | 58.7 | 343 | 102 | 0.4 | 19 | 3.2 |
| L60T2F2 | 33 | 33 | 65 | 76.2 | 312 | 37 | 2.3 | 42 | 1.9 |
| L60T2F1 | 33 | 33 | 65 | 77.1 | 183 | 115 | 0.6 | 22 | 3.4 |
| L60T1F2 | 21 | 22 | 40 | 50.9 | 474 | 33/23 | 1.8/2 | 40/30 | 2.1/3.9 |
| L60T1F1 | 24 | 22 | 40 | 48.4 | 286 | 100 | 0.5 | 25 | 1.7 |
| L84T2F2 | 33 | 35 | 64 | 83.4 | 447 | 41 | 2.3 | 38 | 2.7 |
| L84T2F1 | 33 | 36 | 62 | 74.2 | 196 | 114 | 0.6 | - | 2.5 |
| L84T1F2 | 24 | 24 | 41 | 56.3 | 513 | 21 | 2.2 | 21 | 2.5 |
| L84T1F1 | 23 | 26 | 42 | 50.7 | 247 | 71 | 0.6 | 21 | 2.5 |
| Average T2 | 34 | 35 | 65 | ||||||
| Average T1 | 23 | 24 | 41 | ||||||
3.2.2. Stress Increase in Unbonded Tendons
- For group L36 (span-to-depth ratio smaller than 35): 176 MPa for L36T2F2 and L36T2F1, and 281 MPa for L36T1F2 and L36T1F1.
- For group L60 and L84 (span-to-depth ratio greater than 35): 105 MPa for L60T2F2, L60T2F1, L84T2F2, and L84T2F1, and 140 MPa for L60T1F2, L60T1F1, L84T1F2, and L84T1F1.
| Prestressing Force During Tensioning (Member in Mould) [kN] | Prestressing Force After Wedge Draw-in (Member in Mould) [kN] | Prestressing Force After Initial Relaxation (Test Stand) [kN] | Prestressing Force at First Cracking [kN] | Prestressing Force at Yield of Rebars [kN] | Prestressing Force at Failure [kN] | Stresses After Losses [MPa] | Stress Increment -Cracking [MPa] | Stress Increment -Yielding [MPa] | Stress Increment -Failure [MPa] | Stresses at Failure [MPa] | |
|---|---|---|---|---|---|---|---|---|---|---|---|
| P0 | Pm0 | Pmt | Pmt | Pmt | Pmt | σPmt | Δσcr | Δσpl | Δσult | σPmt | |
| L36T2F2 | 401.2 | 345.0 | 340.5 | 342.6 | 381.8 | 470.7 | 1127 | 7 | 137 | 431 | 1559 |
| L36T2F1 | 398.5 | 338.8 | 335.0 | 335.9 | 351.3 | 469.9 | 1109 | 3 | 54 | 447 | 1556 |
| L36T1F2 | 198.5 | 166.7 | 167.4 | 168.3 | 181.8 | 254.2 | 1109 | 6 | 95 | 575 | 1683 |
| L36T1F1 | 200.7 | 169.0 | 171.8 | 172.1 | 179.8 | 223.7 | 1138 | 2 | 53 | 343 | 1481 |
| L60T2F2 | 384.9 | 352.2 | 340.5 | 341.8 | 377.4 | 434.7 | 1127 | 4 | 122 | 312 | 1439 |
| L60T2F1 | 392.5 | 350.1 | 343.2 | 343.6 | 356.6 | 398.6 | 1136 | 1 | 44 | 183 | 1320 |
| L60T1F2 | 192.2 | 172.1 | 170.6 | 171.0 | 187.2 | 242.2 | 1129 | 3 | 110 | 474 | 1604 |
| L60T1F1 | 193.5 | 171.9 | 171.4 | 171.6 | 178.6 | 214.6 | 1135 | 1 | 47 | 286 | 1421 |
| L84T2F2 | 373.0 | 342.1 | 338.9 | 340.2 | 375.0 | 473.9 | 1122 | 4 | 120 | 447 | 1569 |
| L84T2F1 | 373.1 | 341.7 | 338.6 | 338.9 | 351.8 | 397.7 | 1121 | 1 | 44 | 196 | 1317 |
| L84T1F2 | 194.6 | 177.6 | 176.0 | 176.2 | 192.9 | 253.4 | 1166 | 1 | 112 | 513 | 1678 |
| L84T1F1 | 194.6 | 177.6 | 176.2 | 176.3 | 186.3 | 213.4 | 1167 | 1 | 67 | 247 | 1413 |
3.2.3. Deflection
| Deflection Due to Self-Weight and Prestress | Deflection at First Cracking | Deflection at Yield of Rebars | Deflection at Failure | Value of Bending Moment at Reaching SLS | ||||||||
| u [mm] | u/leff [-] | u [mm] | u/leff [-] | u [mm] | u/leff[-] | u [mm] | u/leff [-] | ulim [mm] | MEd [kNm] | Mult[kNm] | MEd /Mult | |
| L36T2F2 | −2.6 | 1/1385 | 4.0 | 1/900 | 24.8 | 1/145 | 73.6 | 1/49 | 14.4 | 56.4 | 85.3 | 66% |
| L36T2F1 | −2.5 | 1/1440 | 2.0 | 1/1800 | 12.5 | 1/288 | 90.2 | 1/40 | 69.4 | 86.4 | 80% | |
| L36T1F2 | −1.1 | 1/3273 | 3.4 | 1/1059 | 16.8 | 1/214 | 111.6 | 1/32 | 36.6 | 54.8 | 67% | |
| L36T1F1 | −1.1 | 1/3273 | 1.9 | 1/1895 | 11.4 | 1/316 | 58.9 | 1/61 | 46.7 | 58.7 | 80% | |
| L60T2F2 | −5.4 | 1/1111 | 6.6 | 1/909 | 57.0 | 1/105 | 133.6 | 1/45 | 24.0 | 53.5 | 76.2 | 70% |
| L60T2F1 | −5.5 | 1/1091 | 3.9 | 1/1550 | 27.5 | 1/218 | 87.1 | 1/69 | 63.0 | 77.1 | 82% | |
| L60T1F2 | −1.4 | 1/4286 | 6.7 | 1/896 | 47.7 | 1/126 | 202.9 | 1/30 | 34.4 | 50.9 | 68% | |
| L60T1F1 | −1.4 | 1/4286 | 6.5 | 1/923 | 28.9 | 1/208 | 129.5 | 1/46 | 38.3 | 48.4 | 79% | |
| L84T2F2 | −5.6 | 1/1500 | 10.5 | 1/798 | 106.0 | 1/79 | 371.6 | 1/23 | 33.6 | 49.1 | 83.4 | 59% |
| L84T2F1 | −5.6 | 1/1500 | 8.3 | 1/1012 | 52.2 | 1/161 | 166.4 | 1/50 | 55.5 | 74.2 | 75% | |
| L84T1F2 | 2.0 | 1/4200 | 10.1 | 1/832 | 92.0 | 1/91 | 501.5 | 1/17 | 33.6 | 56.3 | 60% | |
| L84T1F1 | 2.0 | 1/4200 | 9.5 | 1/884 | 65.1 | 1/129 | 211.4 | 1/40 | 36.8 | 50.7 | 73% | |
3.2.4. Crack Pattern
| L36 T2F2 | L36 T2F1 | L36 T1F2 | L36 T1F1 | L60 T2F2 | L60 T2F1 | L60 T1F2 | L60 T1F1 | L84 T2F2 | L84 T2F1 | L84 T1F2 | L84 T1F1 | |
|---|---|---|---|---|---|---|---|---|---|---|---|---|
| Length of cracked region | 1800 | 825 | 1630 | 900 | 3140 | 1900 | 3620 | 1900 | 4900 | 2220 | 5050 | 3340 |
| [mm] | ||||||||||||
| Cracked region length to span length ratio | 50% | 23% | 45% | 25% | 52% | 32% | 60% | 32% | 58% | 26% | 60% | 40% |
| [-] | ||||||||||||
| Number of cracks | 14 | 7 | 12 | 7 | 23 | 14 | 32 | 13 | 38 | 17 | 39 | 22 |
| [-] | ||||||||||||
| Average crack spacing | 138 | 138 | 148 | 150 | 143 | 146 | 117 | 158 | 132 | 139 | 133 | 159 |
| [mm] |
4. Final Conclusions
- The reinforcement ratio for deformed bars was found to be in accordance with the requirements delineated in both EC2 [3] and the aforementioned literature. This approach ensured the formation and propagation of cracks in a controlled manner. This approach also enabled the consideration of member behavior as beams rather than as a truss model. The mechanical reinforcement ratio, designated as q0, for elements from both groups T1 and T2, assumed values within the interval where a substantial stress increment in tendons was anticipated. The stress increment in prestressing steel was found to exceed the values obtained from the predicting equations of EC2 [3] and ACI 318 [4].
- The initial value of prestressing force per tendon exhibited a range of 167 to 176 kN. The stress increment in the prestressing strands until the occurrence of the first crack is negligible (but greater for members from group F2 than from F1). A similar observation could be made at the time of deformed bar yielding. The stress increment in the tendons was approximately 100 MPa and 50 MPa for the elements that were tested from groups F2 and F1, respectively. An examination of the data reveals that, for phases preceding the attainment of the yielding moment, the nature of the loading (i.e., the configuration of the bending moment diagram) exerts the most significant influence on the value of the prestressing force. In the instance of failure, the influence of the prestressing reinforcement ratio on the stress increment in tendons could also be observed. For elements with equivalent span lengths and loading types, a greater stress increase was observed for members prestressed with a single tendon (group T1) compared to those with two tendons (group T2). However, this phenomenon was not observed for the two shortest beams under center-point loading (L36T2F1 and L36T2F2), which was likely due to the effects of concrete confinement. The stress levels exhibited an increase from 431 to 575 MPa and from 183 to 286 MPa for beams from groups F2 and F1, respectively. It should be noted that this summary excludes element L60T2F2. It is worth noting that an anomalous auditory phenomenon was detected during the final stage of the loading process. Initially, the condition was identified as a wire rupture in a tendon. Subsequent to the beam testing, the tendon was subjected to a thorough inspection, which revealed that the wires remained intact. Consequently, the noise was likely attributable to tendon slip within the anchorage.
- It has been demonstrated that, owing to minimal stress increments in tendons up to the occurrence of the first crack, the sole parameter exerting an influence on the cracking moment was the prestressing steel ratio. The mean value of the cracking moment for members from group T1 (one tendon) and T2 (two tendons) was approximately 24 kNm and 35 kNm, respectively. As previously indicated, the crack pattern was deemed satisfactory. The extent of the damaged region was contingent on the type of loading and ranged from 23 to 40% and from 45 to 60% of the span length for beams from groups F1 and F2, respectively. It is imperative to acknowledge that the ratio of the cracked region length to the span length undergoes an increase in proportion with the degree of beam slenderness. This phenomenon can be attributed to the observation that members with larger spans exhibited a greater participation of a dead load moment in the ultimate moment. The spacing of the cracks was found to be regular and consistent with the spacing of the stirrups. The initial cracks manifested in the cross-sections where transverse reinforcement had been implemented. It was observed that supplementary cracks typically manifested during the final phase of loading. Dominant cracks were observed in cross-sections where external point loading was acting.
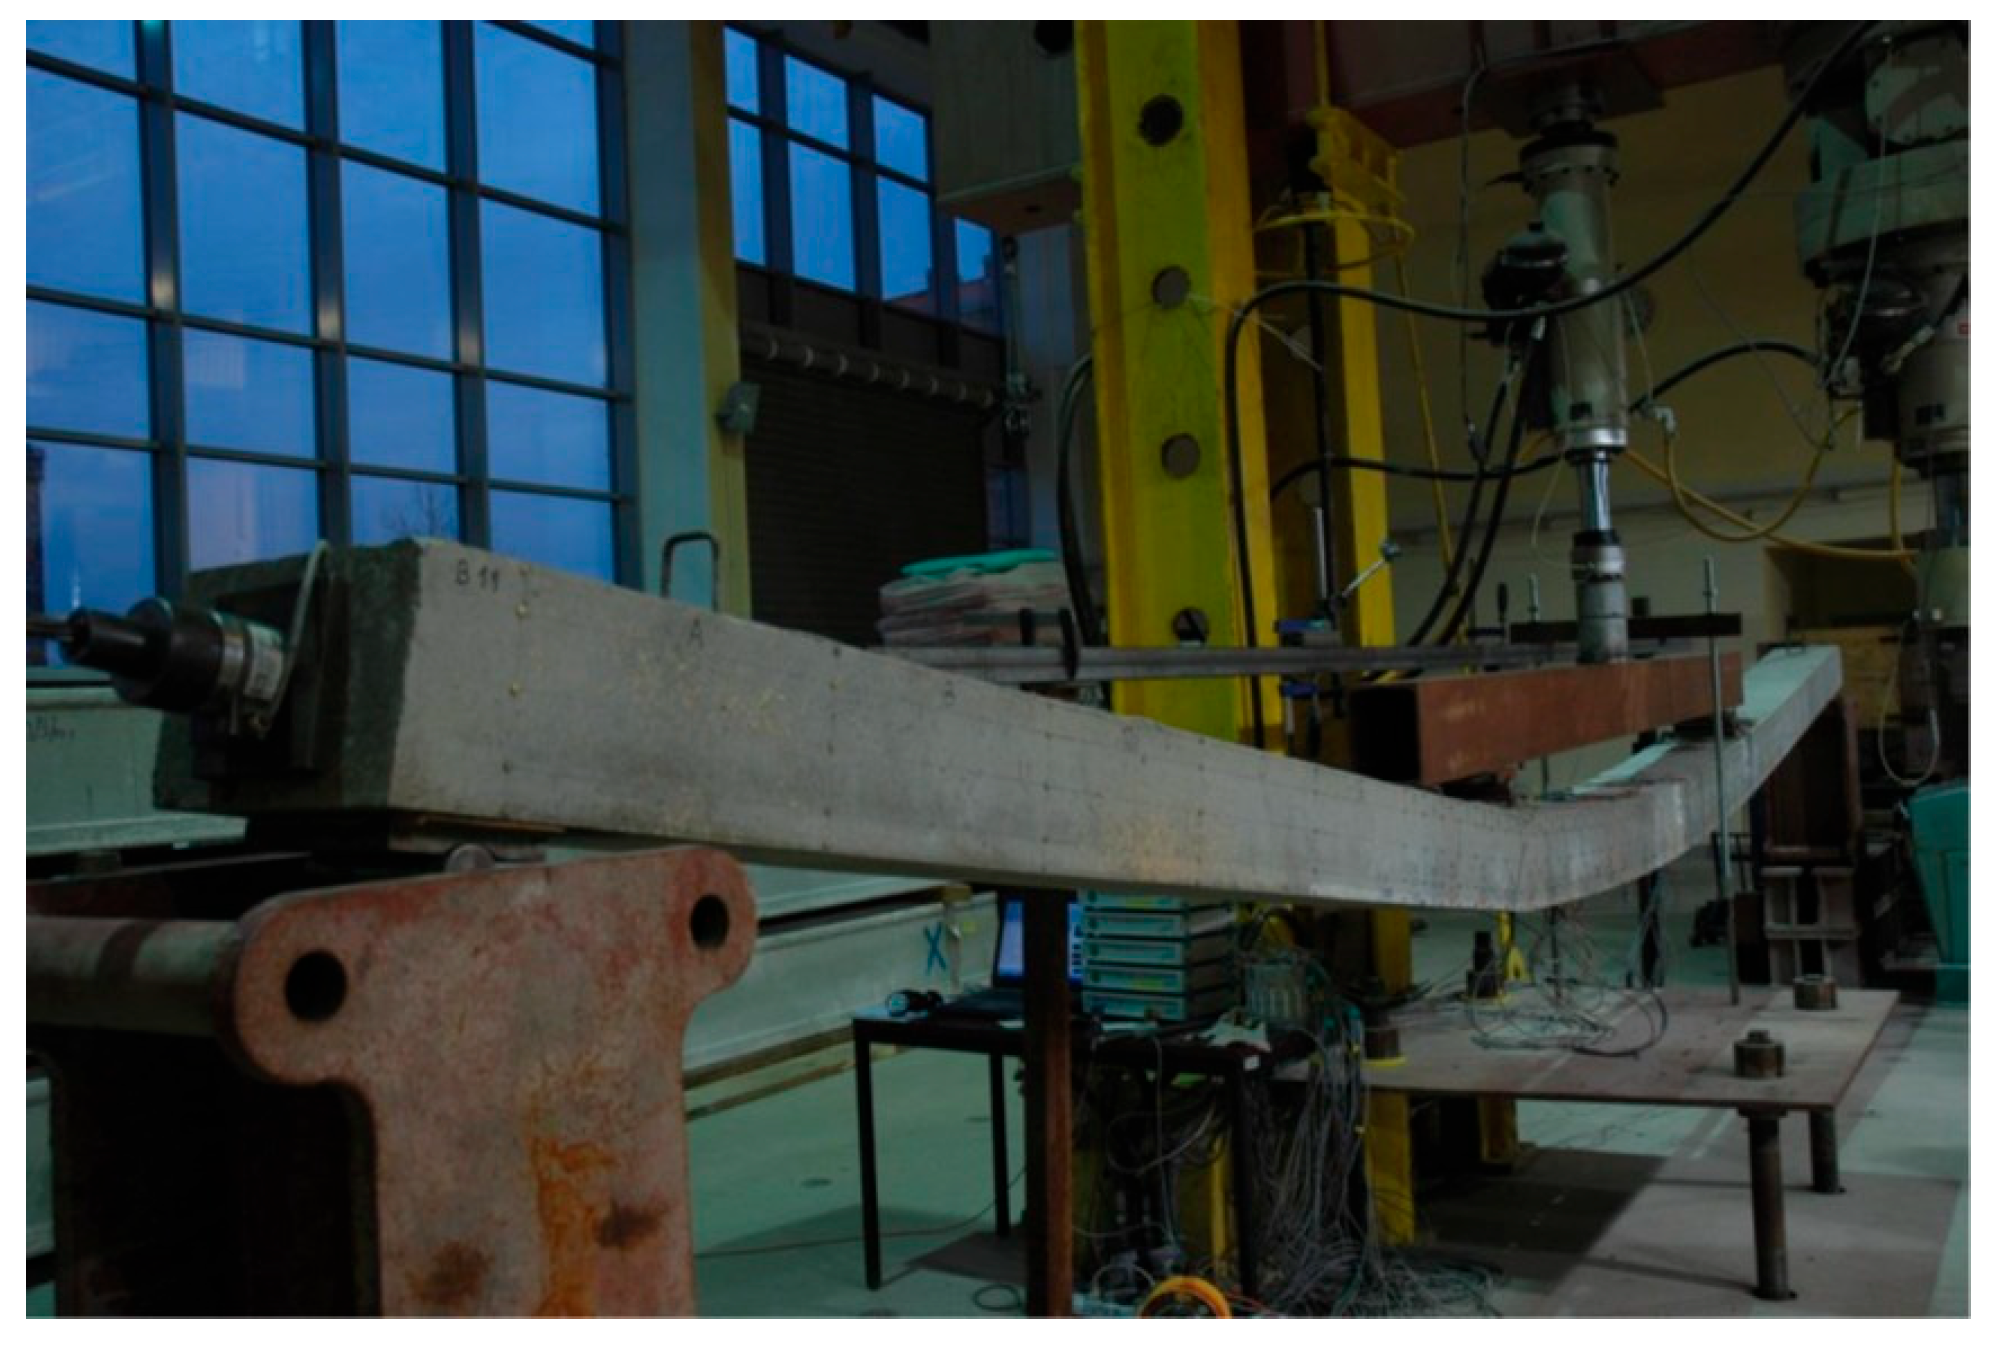
- The tested members exhibited adequate ductility. The deflection-to-span length ratio ranged from 1/69 to 1/17 at ultimate. The code condition for deflection (L/250) was met for beams under center-point loading at approximately 80%, 80%, and 74% of the ultimate moment for groups L36F1, L60F1, and L84F1, respectively. For beams under third-point loading, this provision was met at approximately 67%, 69%, and 60% of the ultimate moment for groups L36F2, L60F2, and L84F2, respectively.
- The analysis of the bending moment resistance proved to be a more complex undertaking than initially anticipated. A correlation was observed between the stress increment and the bending moment capacity. The values of these factors were found to be the lowest among members of group L60, which had an average span length, in comparison to members of groups L36 and L84. Pairs of members under third-point loading (L36T2F2 and L84T2F2, as well as L36T1F2 and L84T1F2) achieved analogous values of both the stress increase in unbonded tendons and bending resistance. Pairs of elements under center-point loading (L36T2F1 and L84T2F1, as well as L36T1F1 and L84T1F1) indicated that both the stress increase in unbonded tendons and bending resistance decreased with an increase in the span-to-depth ratio. The influence of the type of loading could be observed in the last three pairs of tested members (L60T1F2 and L60T1F1, L84T2F2 and L84T2F1, and L84T1F2 and L84T1F1). This effect was not observed in the three other pairs of elements. The stress increase in the unbonded tendons and the bending moment resistance exhibited comparable values for one pair (L36T2F2 and L36T2F1). In two other pairs (L36T1F2 and L36T1F1, as well as L60T2F2 and L60T2F1), the stress increase in the prestressing steel was greater in members under third-point loading. However, the bending capacity was slightly smaller. This phenomenon is likely attributable to the concrete confinement phenomenon.
Author Contributions
Funding
Institutional Review Board Statement
Informed Consent Statement
Data Availability Statement
Conflicts of Interest
References
- Lin, T.Y. Unbonded vs. Bonded Tendons for Building Construction with Particular Reference to Flat Slabs. In Proceedings of the Prestressed Concrete in Buildings, Sydney, Australia, 2–3 September 1976. [Google Scholar]
- Ajdukiewicz, A.; Mames, J. Konstrukcje z Betonu Sprężonego, 2nd ed.; Stowarzyszenie Producentów Cementu: Kraków, Poland, 2008. (In Polish) [Google Scholar]
- EN 1992-1-1:2023 (English); Eurocode 2—Design of Concrete Structures—Part 1-1: General Rules, Rules for Buildings, Bridges and Civil Engineering Structures. British Standards Institution (BSI): London, UK, 2004.
- ACI CODE-318-19(22); ACI Committee 318: Building Code Requirements for Structural Concrete and Commentary. American Concrete Institute: Farmington Hills, MI, USA, 2022.
- ACI 318-63; ACI Committee 318: Building Code Requirements for Reinforced Concrete. American Concrete Institute: Farmington Hills, MI, USA, 1963.
- Mattock, A.; Yamazaki, J.; Kattula, B. Comparative Study of Prestressed Concrete Beams, with and without Bond. ACI J. Proc. 1971, 68, 116–125. [Google Scholar] [CrossRef] [PubMed]
- ACI 318-71; ACI Committee 318: Building Code Requirements for Reinforced Concrete. American Concrete Institute: Farmington Hills, MI, USA, 1971.
- Mojtahedi, S.; Gamble, W. Ultimate Steel Stresses in Unbonded Prestressed Concrete. J. Struct. Div. ASCE 1978, 104, 1159–1165. [Google Scholar] [CrossRef]
- ACI 318-83; ACI Committee 318: Building Code Requirements for Reinforced Concrete. American Concrete Institute: Farmington Hills, MI, USA, 1983.
- Janney, J.; Hognestad, E.; McHenry, D. Ultimate Flexural Strength of Prestressed and Conventionally Reinforced Concrete Beams. ACI J. Proc. 1956, 52, 601–620. [Google Scholar] [CrossRef]
- Pannel, F.N. The Ultimate Moment of Resistance of Unbonded Prestressed Concrete Beams. Mag. Concr. Res. 1969, 21, 43–54. [Google Scholar] [CrossRef]
- Tam, A.; Pannel, F.N. The Ultimate Moment of Resistance of Unbonded Partially Prestressed Reinforced Concrete Beams. Mag. Concr. Res. 1976, 28, 203–208. [Google Scholar] [CrossRef]
- Cook, N.; Park, R.; Yong, P.H. Flexural Strength of Prestressed Concrete Members with Unbonded Tendons. PCI J. 1981, 26, 52–80. [Google Scholar] [CrossRef]
- Du, G.; Tao, X. Ultimate Stress of Unbonded Tendons in Partially Prestressed Concrete Beams. PCI J. 1985, 30, 72–91. [Google Scholar] [CrossRef]
- Campbell, T.I.; Chouinard, K.L. Influence of Nonprestressed Reinforcement on the Strength of Unbonded Partially Prestressed Concrete Members. ACI Struct. J. 1991, 88, 546–551. [Google Scholar] [CrossRef]
- Harajli, M.; Kanj, M. Ultimate Flexural Strength of Concrete Members Prestressed with Unbonded Tendons. ACI Struct. J. 1991, 88, 663–673. [Google Scholar]
- Chakrabarti, P.; Whang, T.; Brown, W.; Arsad, K.; Amezeua, E. Unbonded Post-Tensioning Tendons and Partially Prestressed Beams. ACI Struct. J. 1994, 91, 616–625. [Google Scholar] [CrossRef]
- Chakrabarti, P. Ultimate Stress for Unbonded Post-Tensioning Tendons in Partially Prestressed Beams. ACI Struct. J. 1995, 92, 689–697. [Google Scholar]
- Ament, J.; Chakrabarti, P.; Putcha, C. Comparative Statistical Study for the Ultimate Stress in Unbonded Post-Tensioning. ACI Struct. J. 1997, 94, 171–180. [Google Scholar]
- Daher, Y.M. Behavior of Lightly Prestressed Members with Unbonded Tendons, thesis submitted for MSc in Structural Engineering. Master’s Thesis, University of Alberta, Edmonton, AB, Canada, 1997; 166p. [Google Scholar]
- Nassif, H.; Ozkul, O. Serviceability Behavior of High Strength Concrete Beams Posttensioned with Unbonded Tendons. In Proceedings of the US-Poland Symposium on Concrete Materials and Structures, Kraków, Poland, 20 May 2004; pp. 1–6.
- Nassif, H.; Ozkul, O.; Malhas, F. Behavior of Concrete Beams Prestressed with Unbonded Tendons, Fédération Internationele du Béton. In Proceedings of the 2nd International Congress, Naples, Italy, 5–8 June 2006. [Google Scholar]
- Nassif, H.; Ozkul, O.; Tanchan, P.; Harajli, M. Rational approach for predicting stress in beams with unbonded tendons. ACI Struct. J. 2008, 105, 338–347. [Google Scholar] [CrossRef]
- Zhou, W.; Zheng, W. Unbonded Tendon Stresses in Continuous Post-Tensioned Beams. ACI Struct. J. 2014, 111, 525–536. [Google Scholar] [CrossRef]
- Maguire, M.; Collins, W.N.; Halbe, K.R.; Roberts-Wollmann, C.L. Multi-span members with unbonded tendons: Ultimate strength behavior. ACI Struct J. 2016, 113, 195–204. [Google Scholar] [CrossRef]
- Nakari, T.; Tulonen, J.; Asp, O.; Kytölä, U.; Laaksonen, A. Experimental study of moment redistribution in continuous concrete beams prestressed with unbonded tendons. Struct Conc. 2024, 25, 2553–2570. [Google Scholar] [CrossRef]
- Nakari, T.; Tulonen, J.; Laaksonen, A. Experimental study of stress increase of unbonded tendons in continuous post-tensioned concrete beams. Struct Conc. 2025, 26, 4567–4582. [Google Scholar] [CrossRef]
- Naaman, A.; Alkhairi, F. Stress at Ultimate in Unbonded Post-Tensioning Tendons: Part I—Evaluation of the State-of-the Art. ACI Struct. J. 1991, 88, 641–651. [Google Scholar]
- Naaman, A.; Alkhairi, F. Stress at Ultimate in Unbonded Post-Tensioning Tendons: Part II—Proposed Methodology. ACI Struct. J. 1991, 88, 683–692. [Google Scholar]
- Naaman, A.; Burns, N.; French, C.; Gamble, W.; Mattock, A. Stresses in Unbonded Prestressing Tendons at Ultimate: Recommendation. ACI Struct. J. 2002, 99, 518–529. [Google Scholar] [CrossRef]
- Harajli, M.; Hijazi, S. Evaluation of the Ultimate Steel Stress in Partially Prestressed Concrete Members. PCI J. 1991, 36, 62–82. [Google Scholar] [CrossRef]
- Harajli, M. On the Stress in Unbonded Tendons at Ultimate: Critical Assessment and Proposed Changes. ACI Struct. J. 2006, 103, 803–812. [Google Scholar] [CrossRef] [PubMed]
- Harajli, M. Tendon Stress at Ultimate in Continuous Unbonded Post-Tensioned Members: Proposed Modification of ACI 318, Eq. (18-4) and (18-5). ACI Struct. J. 2012, 109, 183–192. [Google Scholar] [CrossRef]
- Lee, L.H.; Moon, J.H.; Lim, J.H. Proposed Methodology for Computing of Unbonded Tendon Stress at Flexural Failure. ACI Struct. J. 1999, 96, 1040–1048. [Google Scholar] [CrossRef]
- Peng, F.; Xue, W. Calculating Method for Ultimate Tendon Stress in Internally Unbonded Prestressed Concrete Members. ACI Struct. J. 2019, 116, 225–234. [Google Scholar] [CrossRef]
- Politalski, W. Stress Increase in Internal Unbonded Tendons in Prestressed Concrete Flexural Members. Ph.D. Thesis, Cracow Univeristy of Technology, Kraków, Poland, 2015. Available online: https://repozytorium.biblos.pk.edu.pl/resources/26250 (accessed on 11 August 2025). (In Polish).
- Politalski, W. Stress increment in unbonded tendons due to the third-point loading of a prestressed concrete slab. In Proceedings of the Juniorstav 2008—10th Professional Conference of Postgraduate Students, Brno, Czech Republic, 23 January 2008. [Google Scholar]
- Politalski, W. Przyrost naprężeń w cięgnie bez przyczepności w wyniku obciążenia sprężonej belki kablobetonowej, IX Konferencja Doktorantów Wydziału Budownictwa—Szczyrk, 6–8 November 2008. Zesz. Nauk. Politech. Śląskiej. Ser. Bud. Z 2008, 113, 267–274. (In Polish) [Google Scholar]
- Politalski, W. Stress increment in unbonded tendon due to the third-point loading of a prestressed concrete beam. In Proceedings of the 11th Professional Conference of Postgraduate Students, Brno, Czech Republic, 4 February 2009. [Google Scholar]
- Politalski, W. Numerical study of a concrete beam post-tensioned with unbonded tendon under one-point loading. In Proceedings of the 12th Professional Conference of Postgraduate Students, Brno, Czech Republic, 24 February 2010. [Google Scholar]
- DIANA. User’s Manual: Finite Element Analysis; TNO DIANA: Delft, The Netherlands, 2015. [Google Scholar]
- Ajdukiewicz, A. FIB Model Code 2010 Pre-Norma Konstrukcji Betonowych, Tom 1 i 2; Stowarzyszenie Producentów Cementu: Kraków, Poland, 2014. (In Polish) [Google Scholar]

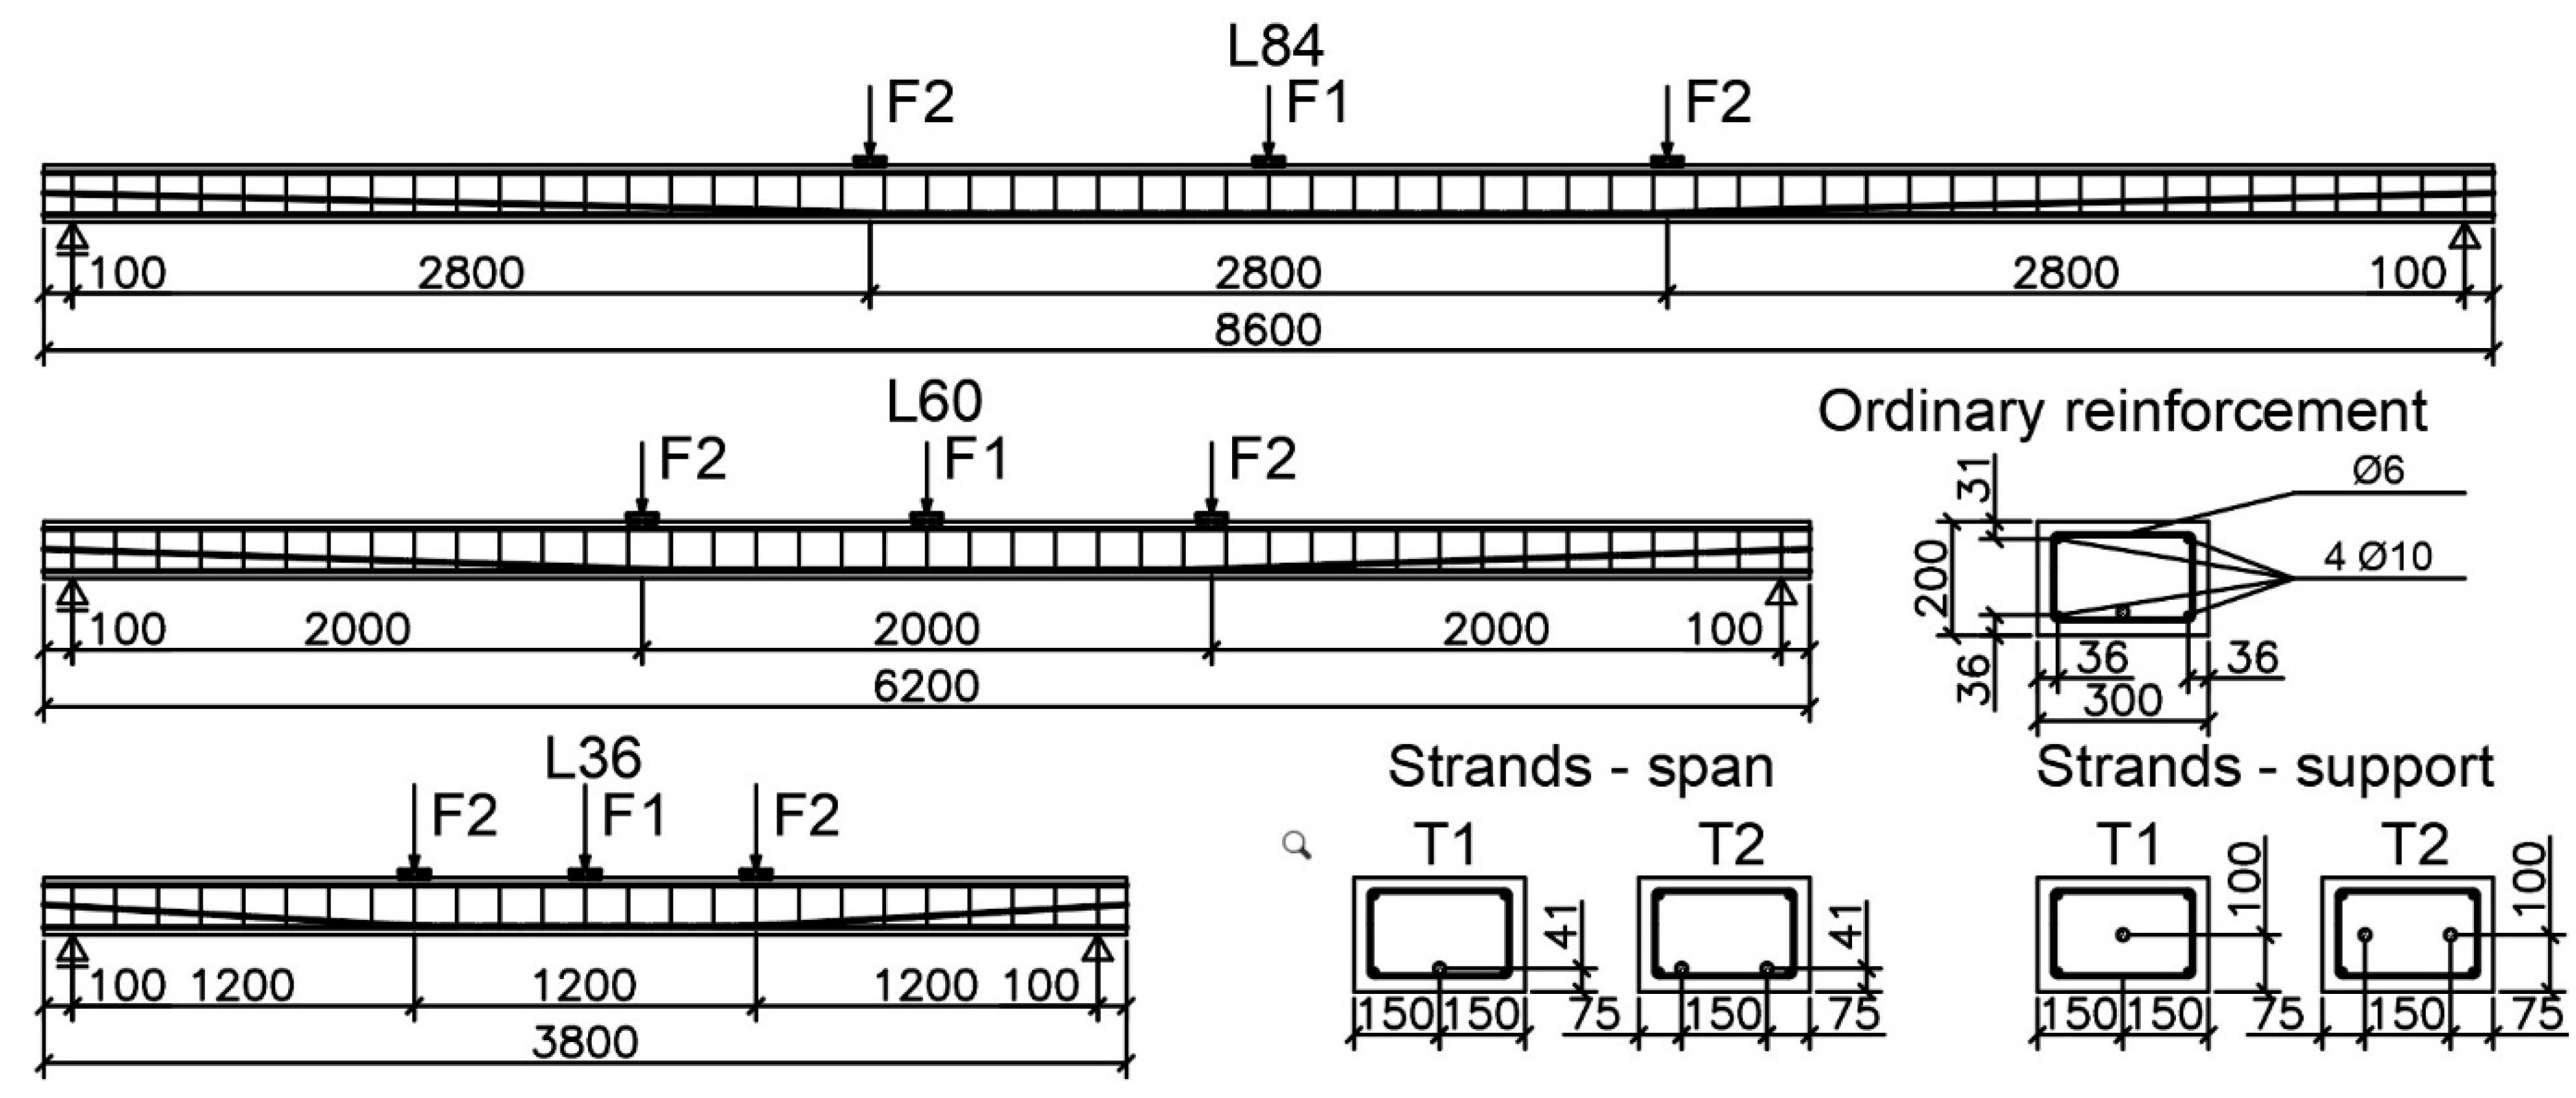


| Name of Member | L36 T2F2 | L36 T2F1 | L36 T1F2 | L36 T1F1 | L60 T2F2 | L60 T2F1 | L60 T1F2 | L60 T1F1 | L84 T2F2 | L84 T2F1 | L84 T1F2 | L84 T1F1 | ||||||||||||
|---|---|---|---|---|---|---|---|---|---|---|---|---|---|---|---|---|---|---|---|---|---|---|---|---|
| Cross-section | 1/3 | 1/2 | 1/3 | 1/2 | 1/3 | 1/2 | 1/3 | 1/2 | 1/3 | 1/2 | 1/3 | 1/2 | 1/3 | 1/2 | 1/3 | 1/2 | 1/3 | 1/2 | 1/3 | 1/2 | 1/3 | 1/2 | 1/3 | 1/2 |
| Width b | 301 | 300 | 300 | 300 | 301 | 299 | 302 | 300 | 296 | 298 | 300 | 298 | 302 | 300 | 298 | 300 | 301 | 300 | 298 | 300 | 300 | 300 | 300 | 300 |
| [mm] | ||||||||||||||||||||||||
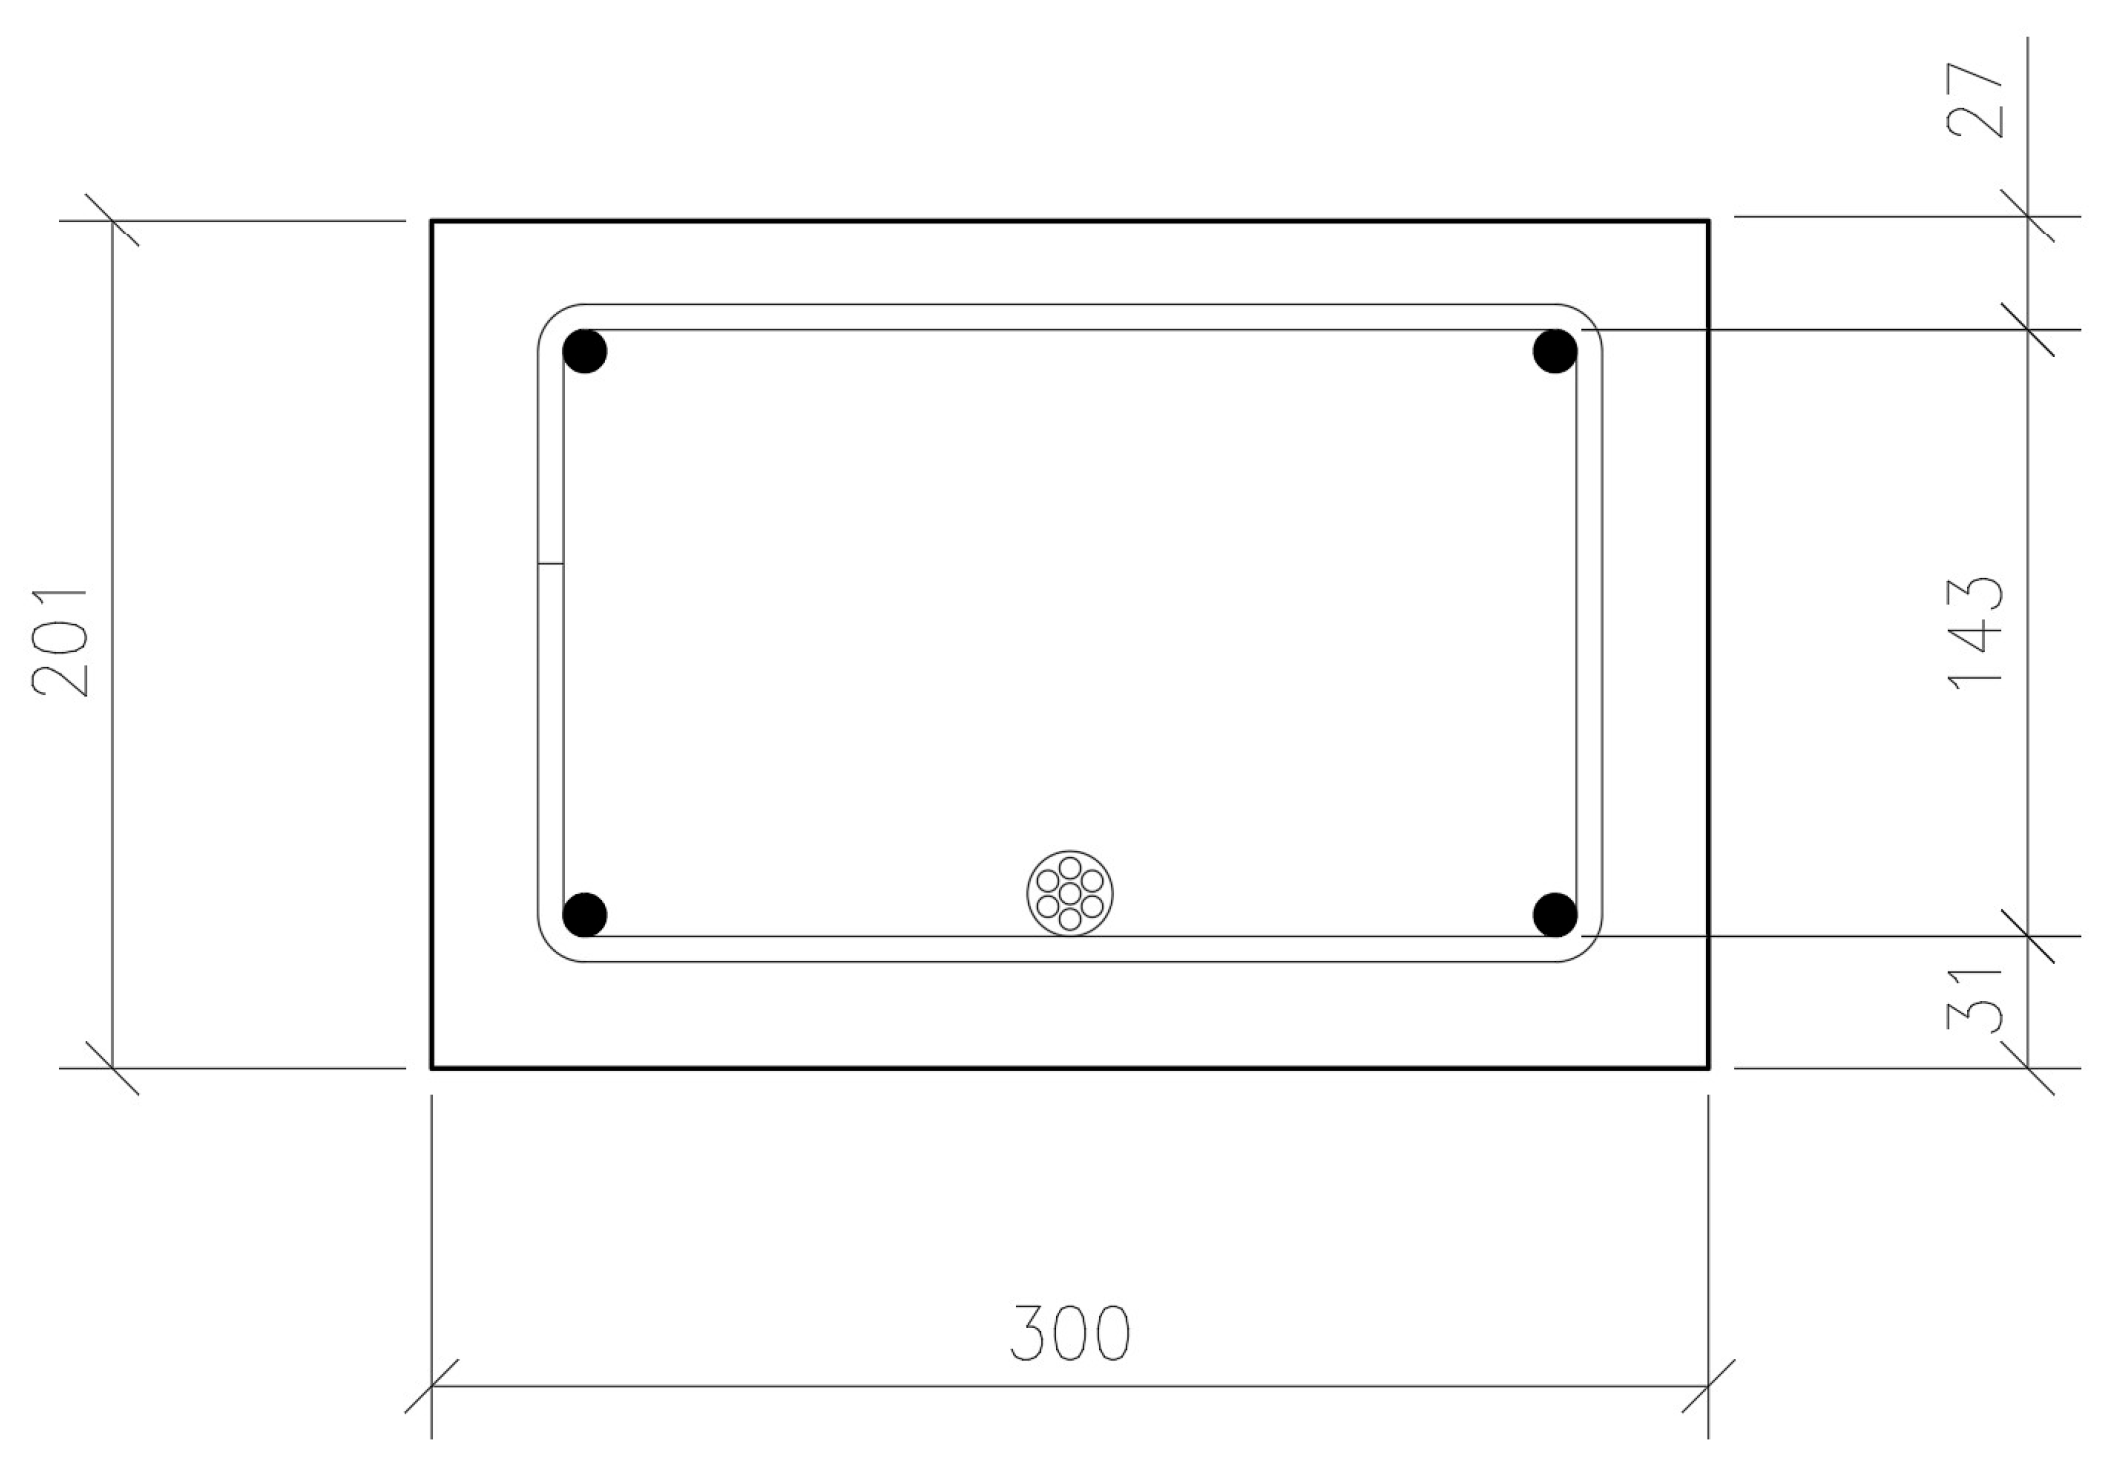
| Height h | 201 | 201 | 202 | 201 | 200 | 199 | 200 | 202 | 204 | 200 | 200 | 199 | 201 | 200 | 199 | 200 | 203 | 202 | 202 | 204 | 202 | 204 | 203 | 202 |
| [mm] | ||||||||||||||||||||||||
| Concrete cover to As2 | 26 | 26 | 29 | 25 | 24 | 27 | 27 | 28 | 30 | 25 | 26 | 25 | 28 | 27 | 29 | 24 | 32 | 29 | 30 | 25 | 29 | 29 | 27 | 28 |
| [mm] | ||||||||||||||||||||||||
| Distance from As1 to As2 | 144 | 145 | 139 | 144 | 144 | 142 | 141 | 144 | 143 | 142 | 144 | 141 | 140 | 142 | 143 | 144 | 138 | 142 | 142 | 146 | 140 | 144 | 143 | 142 |
| [mm] | ||||||||||||||||||||||||
| Concrete cover to As1 | 31 | 30 | 34 | 32 | 32 | 30 | 32 | 30 | 31 | 33 | 30 | 33 | 33 | 31 | 27 | 32 | 33 | 31 | 30 | 33 | 33 | 31 | 33 | 32 |
| [mm] | ||||||||||||||||||||||||
| L36 T2F2 | L36 T2F1 | L36 T1F2 | L36 T1F1 | L60 T2F2 | L60 T2F1 | L60 T1F2 | L60 T1F1 | L84 T2F2 | L84 T2F1 | L84 T1F2 | L84 T1F1 | |
|---|---|---|---|---|---|---|---|---|---|---|---|---|
| Loading phases up to first crack appearance -bending moment values [kNm] | 13.5 | |||||||||||
| 23.4 | 23.7 | 15.7 | 15.5 | 27.2 | 25.1 | 19.0 | 17.8 | 30.5 | 28.9 | 22.7 | 20.9 | |
| 26.7 | ||||||||||||
| 43.8 | 43.8 | 28.2 | 28.0 | 45.2 | 42.4 | 29.0 | 28.4 | 44.5 | 43.6 | 28.9 | 27.8 | |
| Loading phases up to failure -bending moment values [kNm] | 50.1 | 32.5 | 32.5 | |||||||||
| 58.2 | 55.9 | 36.6 | 36.1 | 53.7 | 53.6 | 36.5 | 34.8 | 55.0 | 54.1 | 35.3 | 34.1 | |
| 61.8 | 40.0 | 40.6 | 62.2 | 64.9 | 40.4 | 63.6 | 64.6 | 40.3 | 40.9 | |||
| 72.6 | 72.2 | 43.4 | 44.5 | 68.2 | 73.1 | 43.2 | 44.5 | 73.1 | 45.9 | 44.2 | ||
| 47.5 | 49.0 | 47.9 | ||||||||||
| 85.3 | 86.4 | 54.7 | 58.4 | 76.2 | 77.1 | 50.9 | 48.4 | 83.4 | 74.2 | 56.3 | 50.6 |
Disclaimer/Publisher’s Note: The statements, opinions and data contained in all publications are solely those of the individual author(s) and contributor(s) and not of MDPI and/or the editor(s). MDPI and/or the editor(s) disclaim responsibility for any injury to people or property resulting from any ideas, methods, instructions or products referred to in the content. |
© 2025 by the authors. Licensee MDPI, Basel, Switzerland. This article is an open access article distributed under the terms and conditions of the Creative Commons Attribution (CC BY) license (https://creativecommons.org/licenses/by/4.0/).
Share and Cite
Politalski, W.; Seruga, A. An Experimental Investigation of Twelve Concrete Beams Post-Tensioned with Unbonded Tendons Under Center-Point and Third-Point Loading. Materials 2025, 18, 4333. https://doi.org/10.3390/ma18184333
Politalski W, Seruga A. An Experimental Investigation of Twelve Concrete Beams Post-Tensioned with Unbonded Tendons Under Center-Point and Third-Point Loading. Materials. 2025; 18(18):4333. https://doi.org/10.3390/ma18184333
Chicago/Turabian StylePolitalski, Wojciech, and Andrzej Seruga. 2025. "An Experimental Investigation of Twelve Concrete Beams Post-Tensioned with Unbonded Tendons Under Center-Point and Third-Point Loading" Materials 18, no. 18: 4333. https://doi.org/10.3390/ma18184333
APA StylePolitalski, W., & Seruga, A. (2025). An Experimental Investigation of Twelve Concrete Beams Post-Tensioned with Unbonded Tendons Under Center-Point and Third-Point Loading. Materials, 18(18), 4333. https://doi.org/10.3390/ma18184333


