3.1. Morphology
The microstructure observations of samples were conducted using SEM and optical microscopy to assess the shape and distribution of alumina spheres and the degree of porosity in the matrix. Special attention was paid to the presence of intact spheres, the level of porosity in the matrix, and any particle damage resulting from the forming process under different pressure conditions.
In
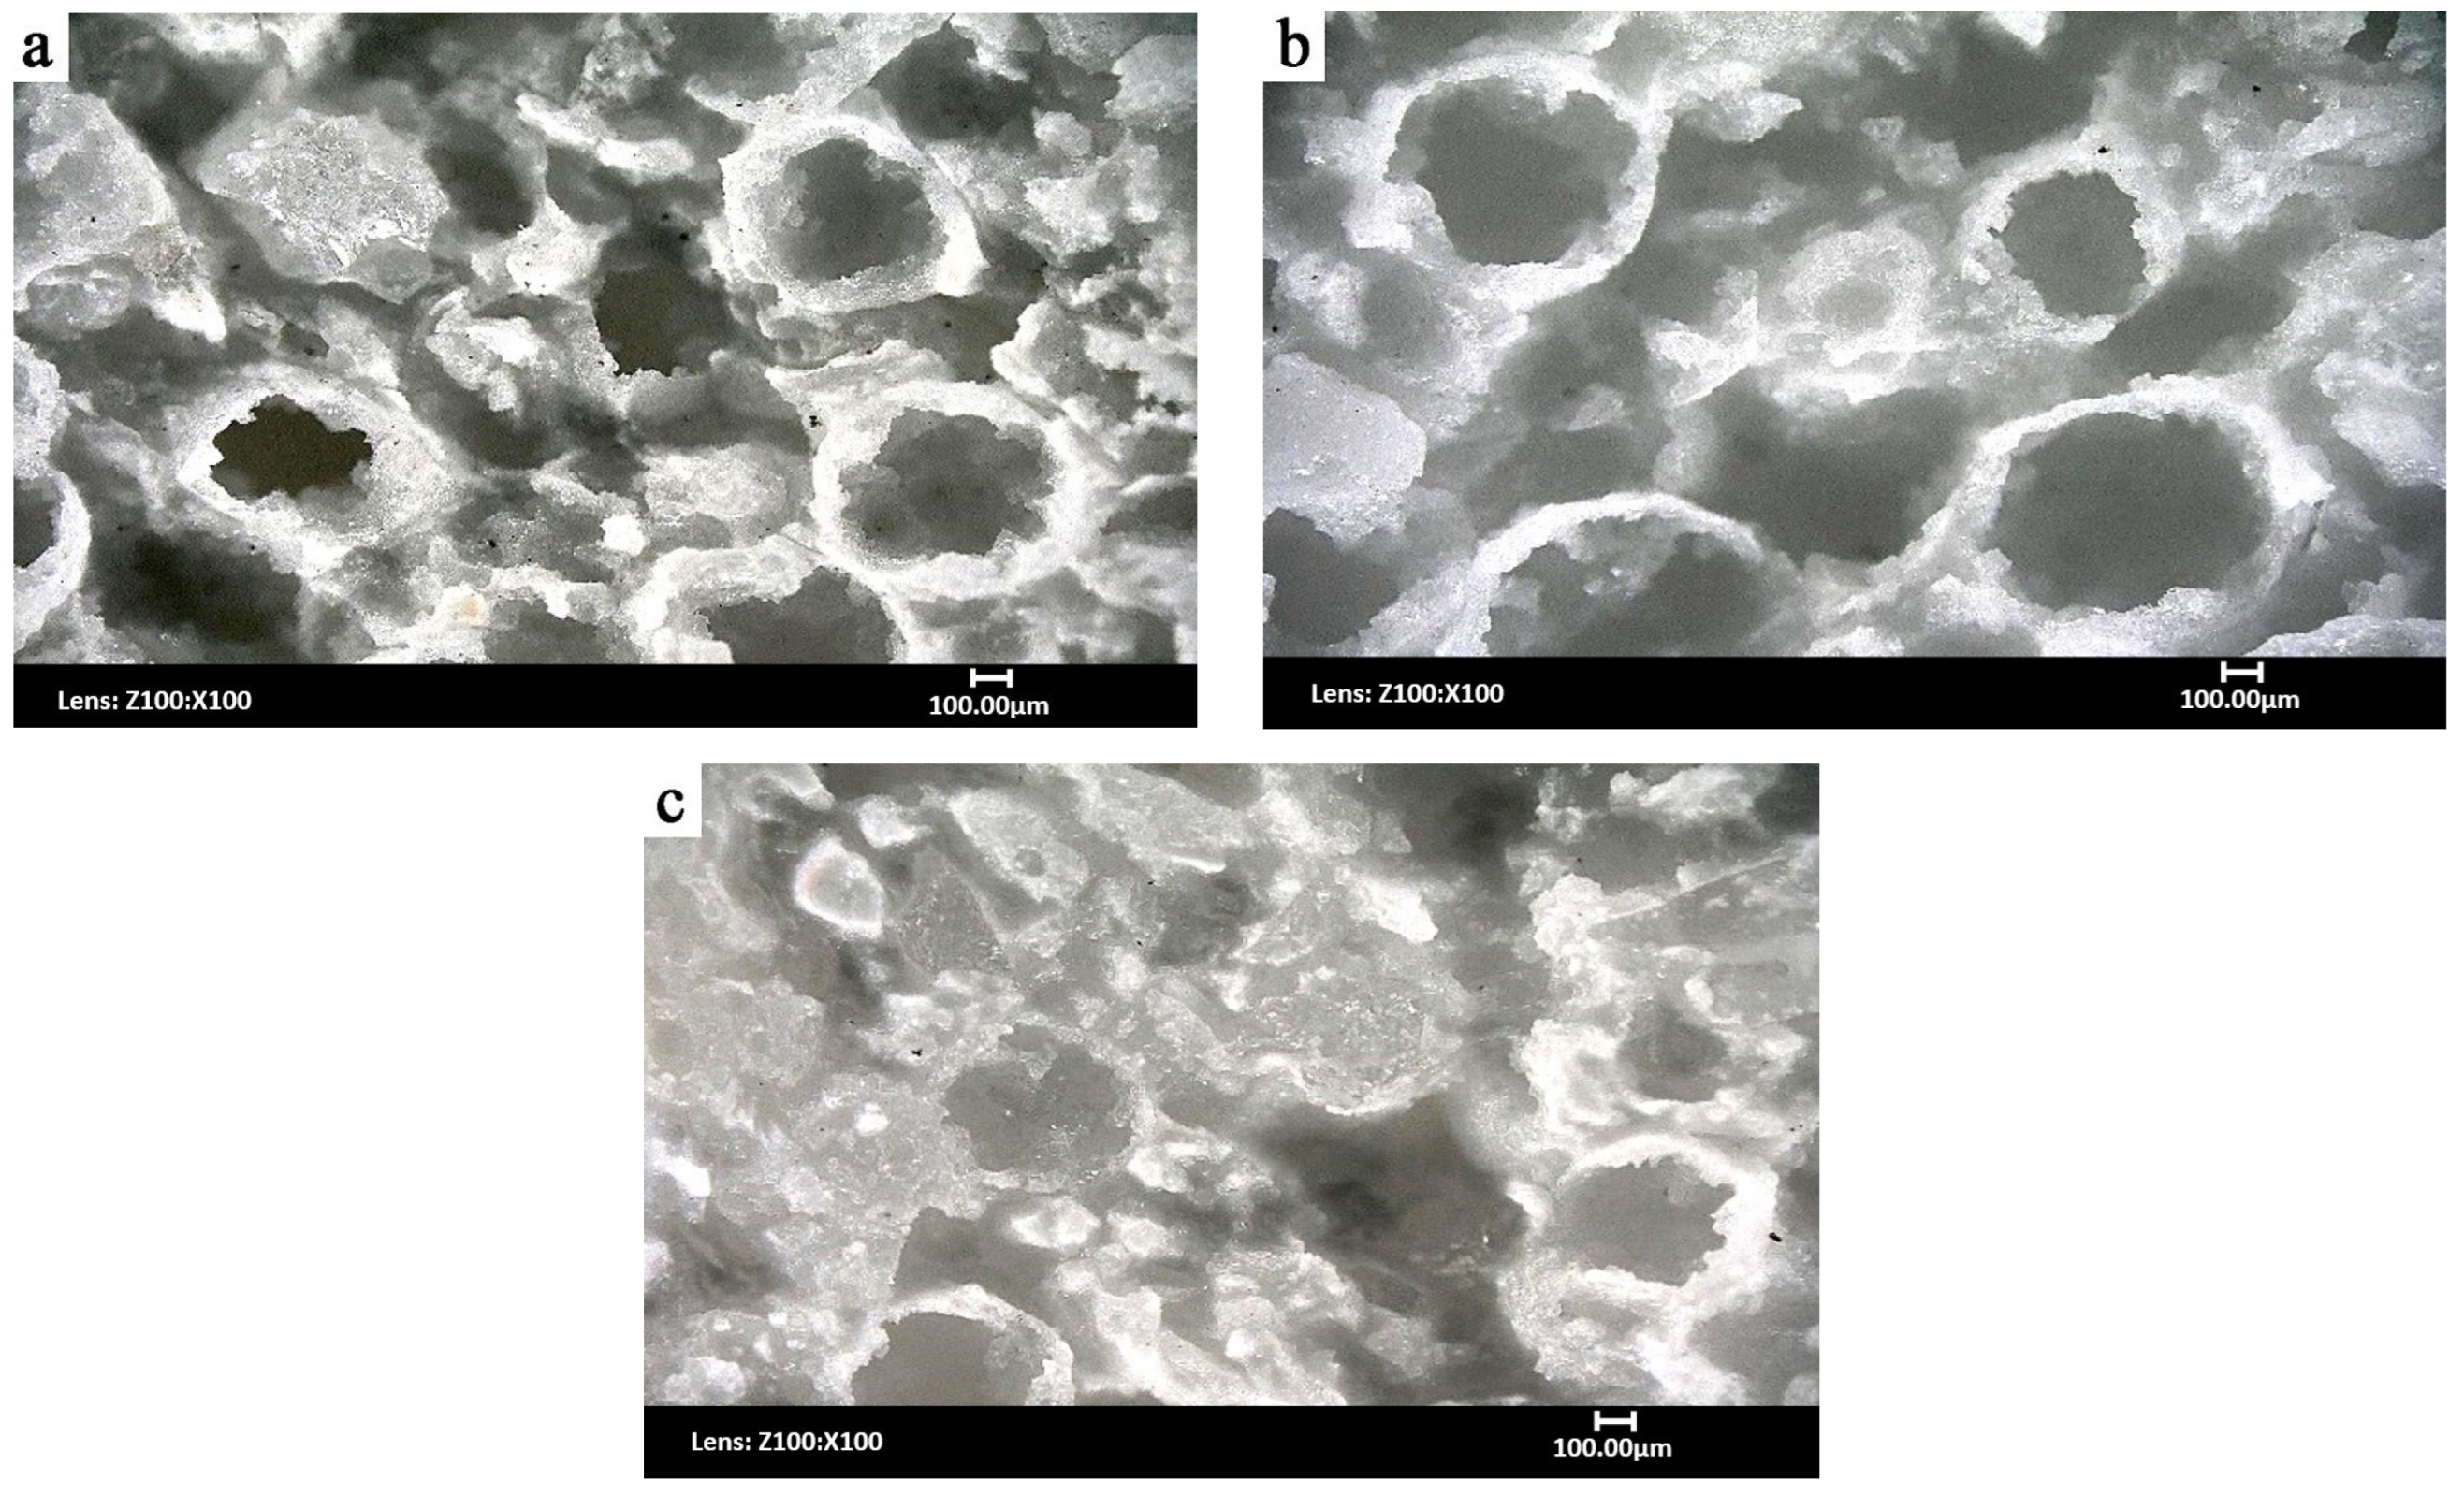
Figure 2a, the morphology of the composite formed at 10 MPa is shown. Numerous well-preserved spheres with a regular, circular shape are visible, randomly distributed throughout the material. The porosity in the matrix is clearly present and arranged irregularly. Damaged spheres are also noticeable, mainly as a result of cutting during sample preparation.
Figure 2b shows microstructure of a sample formed at 20 MPa. Compared to the sample formed at 10 MPa (
Figure 2a), the porosity is lower, and the matrix structure is denser. The alumina spheres are more closely packed, with no visible signs of deformation. Additionally, large, intact polyhedral corundum crystals are visible, which can be crucial in terms of inhibiting crack propagation.
For the sample formed at 25 MPa (
Figure 2c), the composite structure becomes even more compact, with minimal porosity in the matrix. The alumina spheres retain their shape, but the number of intact particles decreases, which may indicate the beginning of their destruction under excessive forming pressure. These observations suggest that the optimal forming pressure range for the analyzed ceramic composite lies between 10 MPa and 25 MPa, allowing for sufficient material densification without compromising the integrity of the dispersed phase particles.
SEM observations provided rapid and direct identification of potential technological errors post-sintering. Unlike other methods, samples did not require time-consuming preparation, enabling regular control of each stage of the composite forming process.
In
Figure 3, SEM microstructures of the ceramic materials formed at 10 MPa and 20 MPa are shown. In both cases, well-preserved circular alumina spheres are visible, indicating that low pressure forming does not lead to destructive effects on the material. However, significant porosity is observed both in the matrix and along the edges of the cut spheres. Discontinuities in the bonding between the spheres and the matrix, manifested as delaminations, are also visible, which may negatively impact the material’s mechanical properties.
Increasing the forming pressure to 25 MPa (
Figure 4a) results in significant changes in the structure of the composite. The material becomes denser, and the number of open pores clearly decreases. The alumina spheres retain their original shape and are better surrounded by the ceramic matrix, improving the integrity of the material. Similarly to the optical microscopy analysis (see
Figure 2c), large, sharply pointed corundum crystals are visible, serving as barriers to the propagation of microcracks.
Further increase in forming pressure to 35 MPa (
Figure 4b) results in noticeable morphological changes. Some of the spheres have deformed—their shape becomes flattened and irregular, and the number of undamaged structures decreases. These observations led to the exclusion of higher forming pressures (above 25 MPa) from further analyses. Pressing at 35 MPa and above resulted in mechanical damage to the alumina spheres, which disrupted the structural integrity of the composite and significantly reduced the amount of desired closed porosity. As the presence of intact spherical pores was a key design feature for reducing thermal mass while maintaining strength, the loss of this structural element was considered detrimental to the material’s functional properties. These changes indicate exceeding the limiting forming pressure above which mechanical damage to the alumina spheres occurs. Despite the compacted structure, excessive pressure causes degradation of this fraction, which may affect the long-term strength of the material.
In summary, the best morphological properties were obtained for samples formed under a pressure of 25 MPa. On one hand, this pressure allowed for proper densification of the matrix, and on the other hand, it did not yet lead to the destruction of the alumina spheres. The SEM observations turned out to be fully consistent with the optical microscopy analyses.
The X-ray computed tomography was applied only to the ceramic composite sample formed under 25 MPa, which—according to previous microscopic observations—exhibited the best morphological integrity. Non-destructive CT method allowed for the analysis of the internal structure of the material without the need to compromise its continuity.
Two CT scans were conducted: the first with a resolution of 18.5 µm (
Figure 5a) and the second—more detailed—with a resolution of 6.5 µm (
Figure 5b).
The images obtained from the first scan (
Figure 5a) revealed the presence of undamaged alumina spheres distributed throughout the entire volume of the sample. Alumina spheres retained their spherical shape, indicating no deformation during the technological process. The open porosity of the matrix is also visible, arranged irregularly, but present throughout the entire cross-section of the sample. The CT images also showed large particles of aluminium oxide, which, according to the structural design of the material, could act as crack barriers.
The more detailed scan (
Figure 5b) allowed for a more detailed assessment of the morphology. It was confirmed that the spheres are tightly surrounded by the ceramic matrix, strengthening the composite structure. An important observation is the variation in the thickness of the alumina sphere walls, which can influence local stresses and consequently the strength of the material. The interiors of the spheres exhibit high roughness and heterogeneity, which may be relevant in the context of cracking and thermal conductivity.
In any of the scans, no cracks indicating destructive effects from the forming process were observed. The alumina spheres and large corundum particles were randomly distributed and present throughout the entire cross-section of the sample. In summary, X-ray CT confirmed that the process of producing the ceramic composite based on spherical alumina does not cause damage to its internal structure. The material is characterized by the presence of both open and closed porosity, which may influence its functional properties.
In order to evaluate the porosity and distribution of pores, porosimetry tests of sintered 25 MPa sample was conducted. The results of the test are presented in
Table 5.
The obtained results indicate that the sample exhibits an open porosity of 47%. Within the volume of the material, the largest contribution to porosity came from pores with a diameter of 1–10 µm and 10–20 µm, which accounted for 39% and 35.9%, respectively. Pores larger than 20 µm constituted about 22% of the material’s volume, while the smallest pores with a diameter of 0.25–1 µm accounted for 3% of the volume. The median pore diameter was 2.05 µm, and no pores smaller than 0.25 µm were found in the material.
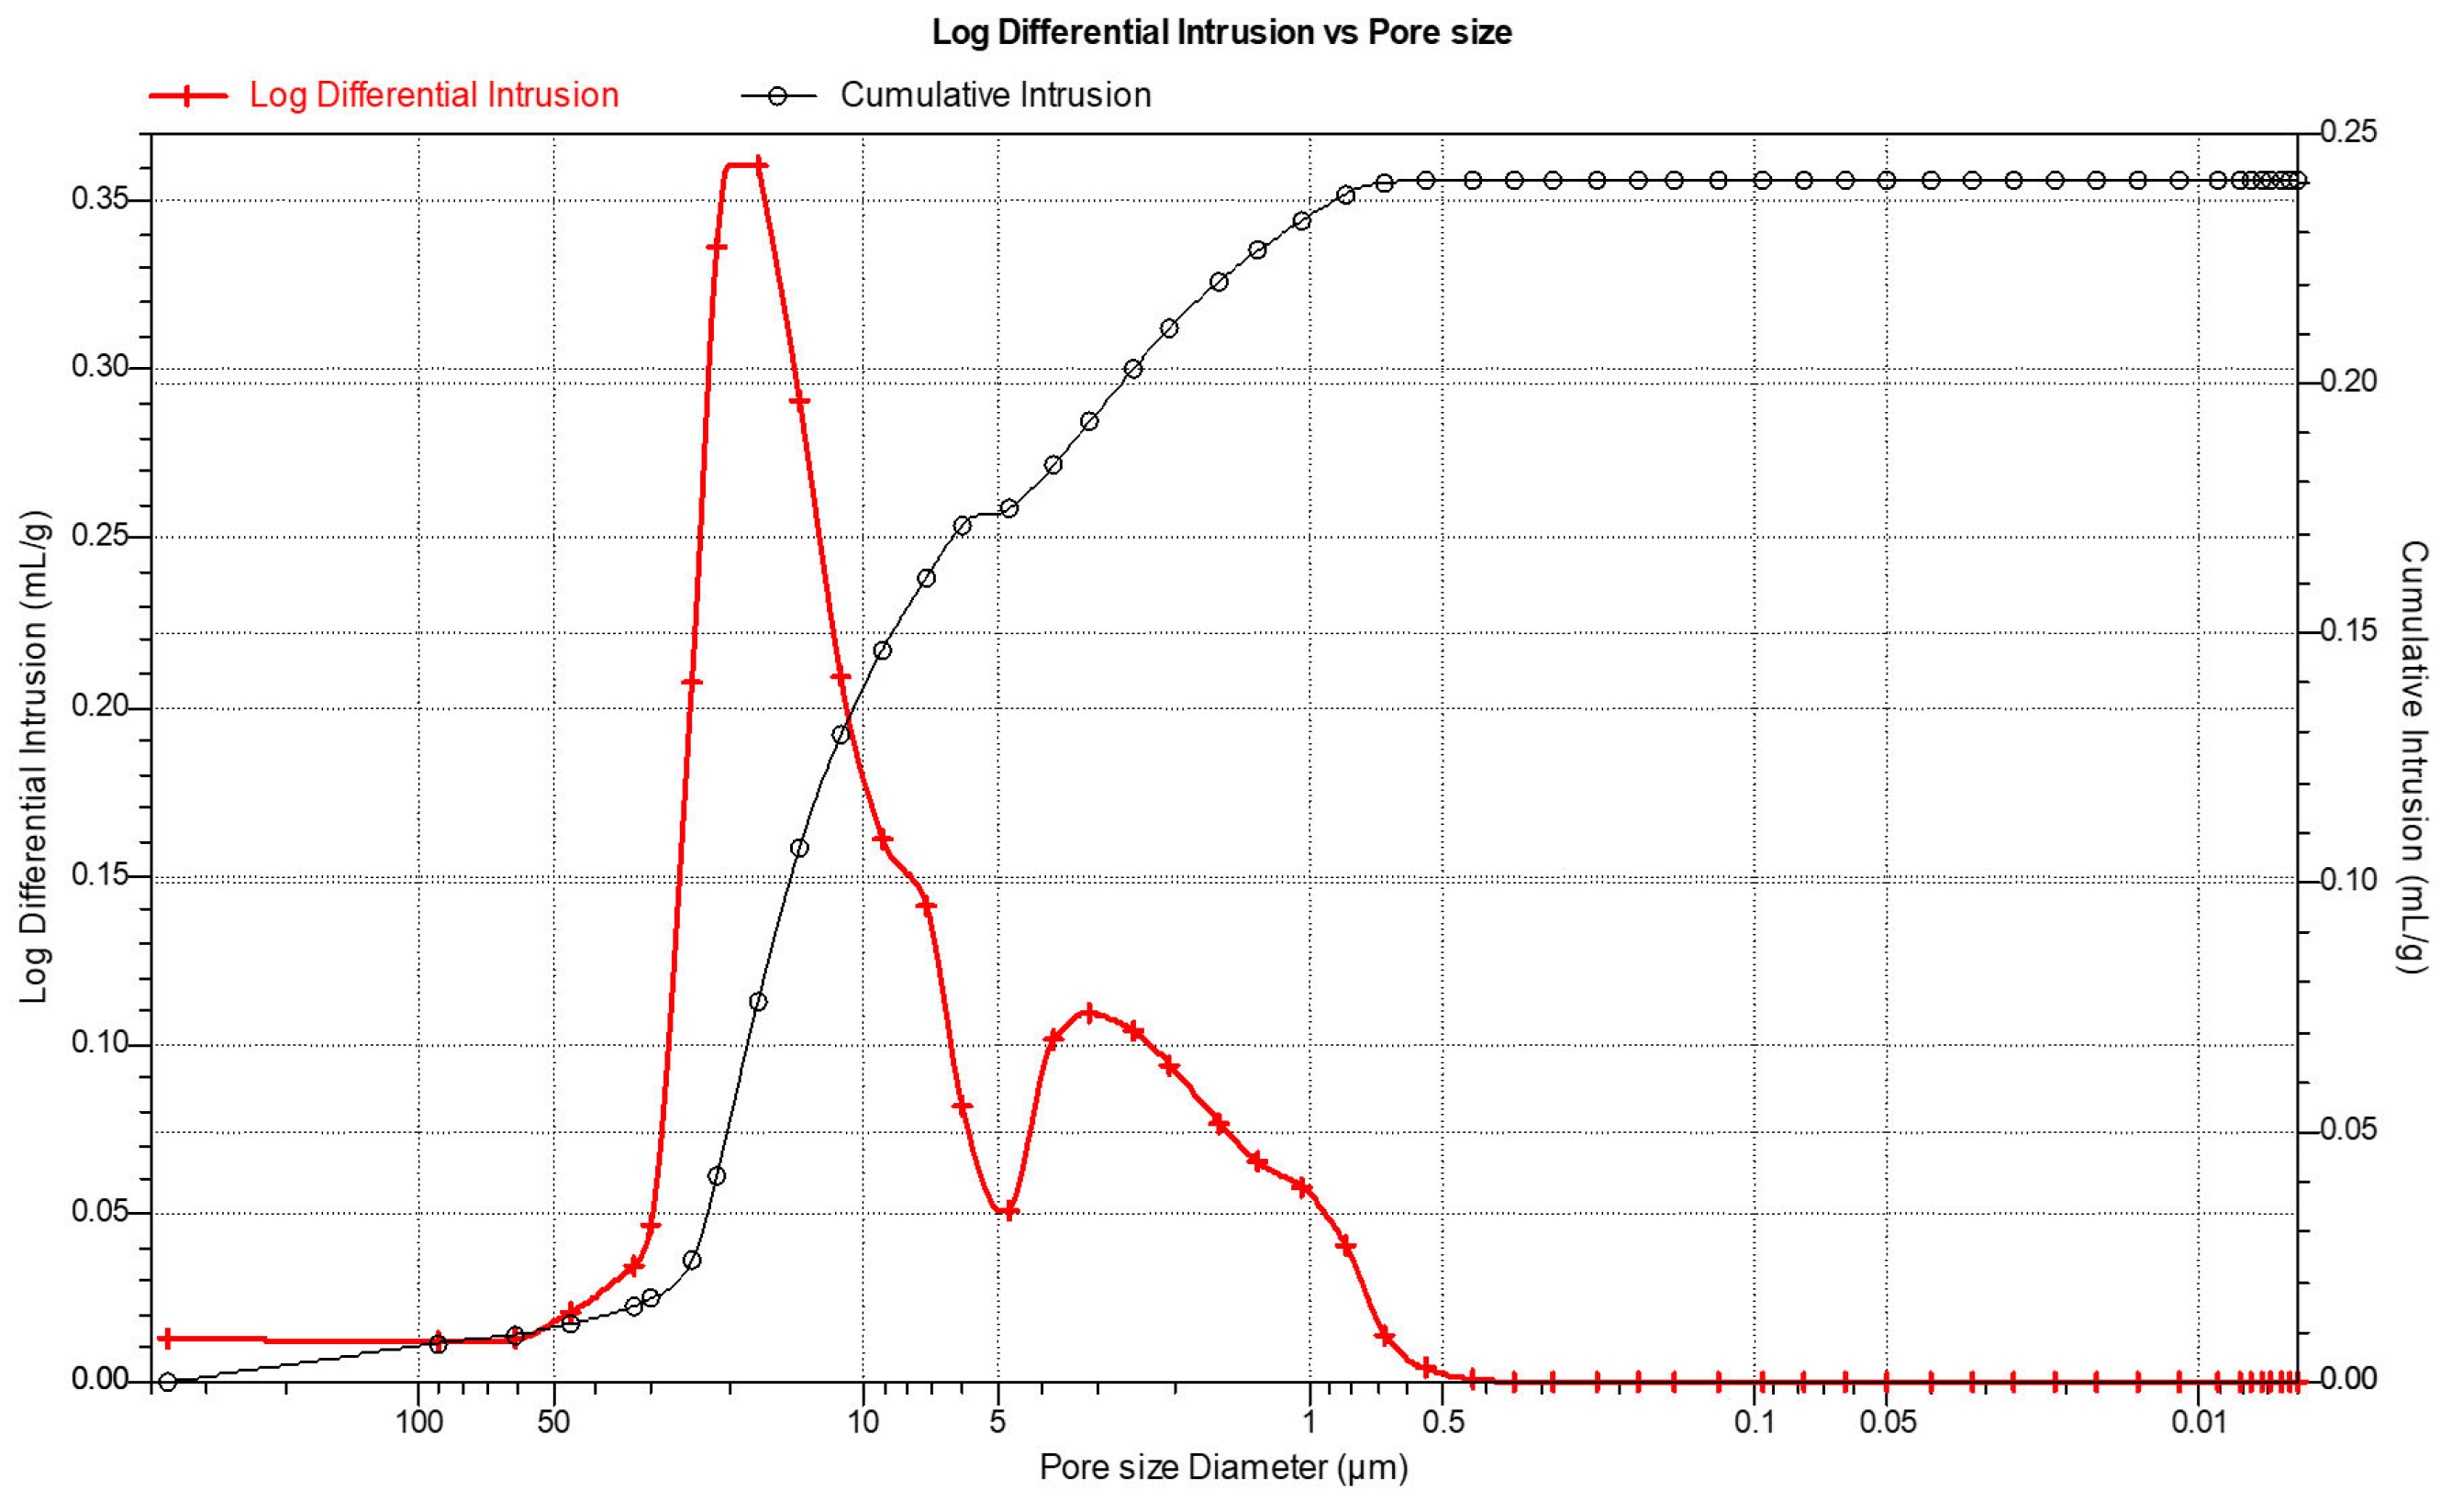
In addition, an analysis of the pore distribution based on the measurement of mercury intrusion into the open porosities was also carried out. The analysis software (Micromeritics, Norcross, GA, USA) allowed for the presentation of the open pores volume as a function of the applied pressure. The pore sizes correspond to specific pressure values, which allowed for the determination of their distribution. Results are shown in
Figure 6. Due to the large variation in pore sizes (from the smallest to the largest), the results were presented in a logarithmic scale in reverse order, starting from the largest values down to the smallest.
The mercury porosimetry method allowed not only the determination of the material’s porosity but also the quantitative contribution of pores classified according to their diameter.
Figure 6 presents the pore size distribution curve of the ceramic composite material, determined using mercury intrusion porosimetry. The graph shows the logarithmic differential intrusion as a function of pore diameter. The distribution exhibits a clear multimodal character, indicating the presence of pores with various diameters across the structure.
The primary peak, located within the range of approximately 1–10 µm, indicates the dominant pore size range in the tested material. This region corresponds to the highest volume of mercury intrusion, suggesting a significant contribution of medium-sized pores to the overall porosity. A secondary, less pronounced peak is observed around 20–30 µm, which may be associated with intergranular voids or structural defects resulting from incomplete compaction or burn-out of the organic binder.
The curve sharply decreases beyond 50 µm, indicating that large pores are relatively rare in the material. Below 1 µm, the intrusion volume is negligible, suggesting the absence of significant amounts of nanopores.
The pore size distribution confirms that the pressing and sintering process applied under 25 MPa results in a material structure dominated by medium-sized open pores, which is consistent with previous microstructural observations and porosity measurements.


