Article

Rheological Optimization of 3D-Printed Cementitious Materials Using Response Surface Methodology

1
College of Civil Engineering and Architecture, Xiamen University of Technology, Xiamen 361024, China
2
Engineering Research Center of Structure Crack Control for Major Project, Fujian Province University, Xiamen 361024, China
3
Admixture Research Institute, KZJ New Materials Group Co., Ltd., Xiamen 361011, China
4
Xiamen Chengzhi New Materials Technology Co., Ltd., Xiamen 361024, China
5
College of Civil Engineering, Inner Mongolia University of Science and Technology, Baotou 014010, China
*
Author to whom correspondence should be addressed.
Materials 2025, 18(17), 3933; https://doi.org/10.3390/ma18173933
Submission received: 28 July 2025 / Revised: 18 August 2025 / Accepted: 18 August 2025 / Published: 22 August 2025
(This article belongs to the Section Construction and Building Materials)

Abstract

This study employed response surface methodology (RSM) to optimize admixture proportions in 3D-printed cementitious materials, with the aim of enhancing printability. Based on preliminary tests, three additives, namely, an accelerator, hydroxypropyl methylcellulose (HPMC), and polycarboxylate superplasticizer (PCE), were incorporated to evaluate their effects on flowability and dynamic yield stress. A Box–Behnken central composite design was used to establish a mathematical model, followed by the RSM-driven optimization of mix proportions. The optimized formulation (0.32% accelerator, 0.24% HPMC, and 0.23% PCE) achieved a flowability of 147.5 mm and a dynamic yield stress of 711 Pa, which closely matched the predicted values and fulfilled the printability requirements, thus establishing RSM as an effective approach for designing printable cementitious composites. This approach established an RSM-based optimization framework for mix proportion design. These findings offer a mechanistic framework for rational 3DPC mixture design, combining theoretical insights and practical implementation in additive construction.

1. Introduction

Driven by the advancements in industrial innovation, 3D-printed concrete (3DPC) has emerged as a transformative technology for intelligent and automated construction, marking a paradigm shift in the building sector [1,2,3]. Through digital design and automated processes, 3DPC can facilitate the precise, layer-by-layer deposition of materials based on digital models, thereby constructing complex architectural forms. This approach improves construction efficiency and accelerates timelines, but also minimizes material waste and the environmental footprint [4]. Recent studies have emphasized the rheological properties of 3D-printed cementitious materials, especially flowability and yield stress, as critical indicators of their capacity to resist plastic deformation under shear and retain post-shear fluidity. These metrics offer critical insights into the workability and buildability of cementitious materials, positioning them as key research topics in academia and industry. To address these challenges, researchers such as Panda et al. [5,6,7] engineered cementitious composites with tailored rheological behavior for 3DPC applications. However, current research has often adopted a unidimensional approach, optimizing mix proportions through isolated rheological or buildability parameters, rather than holistically integrating flowability, buildability, and rheology.
Despite their low dosage in material formulations, chemical admixtures play a critical role in enhancing the performance of cementitious systems. Numerous studies have explored how admixtures influence the rheology of 3DPC, with a particular focus on flow behavior and structural stability. For example, Chen et al. [8] enhanced the thixotropy of calcium sulphoaluminate cement paste using thickeners, superplasticizers, and retarders, maintaining a plastic viscosity and dynamic yield stress below 2.5 Pa·s and 645.54 Pa, respectively. This approach optimized the flowability and elevated static yield stress, thus improving the structural stability of printed layers. Chen et al. [8,9,10] investigated the rheological behavior of 3D-printed sulphoaluminate cement composites incorporating cellulose ether, superplasticizers, Li2CO3, and bentonite. The results revealed that cellulose ether and bentonite significantly increased the static yield stress and plastic viscosity, reducing interlayer deformation. By contrast, superplasticizers and Li2CO3 were found to negatively influence these rheological parameters. After examining nano-silica and superplasticizers, Kruger et al. [11,12] constructed a rheological–thixotropic model for 3D-printed cementitious materials. The model highlighted how the formation–breakage–reconstruction cycle of flocculation structures governs thixotropic behavior, offering a quantitative basis for assessing printability. Zhu et al. [13] demonstrated that hydroxypropyl methylcellulose (HPMC) markedly improved the rheology of 3D-printed mortar. Furthermore, higher HPMC dosages increased the apparent viscosity, yield stress, and plastic viscosity while inducing a nonmonotonic thixotropic response, initially increasing and then decreasing, which collectively enhanced printability. Therefore, given the inherent complexity of admixture effects on cementitious rheology, systematically elucidating their synergistic or antagonistic interactions is essential for rational 3DPC design.
Despite extensive experimental studies on admixture rheological impacts, systematic investigations into 3DPC remain limited [14]. As a result, developing predictive models via targeted experiments remains critical for optimizing 3DPC printability [5]. Built on the Box–Behnken design, response surface methodology (RSM) provides a framework for investigating the individual and interactive effects of admixtures on rheological properties. RSM offers several benefits including reduced experimental runs, accelerated testing, and a high predictive accuracy. Moreover, its capacity to resolve multi-factor interactions positions RSM as a powerful tool for designing printable cement-based composites. First proposed by Box et al. [15], RSM combines experimental design with mathematical modeling to optimize complex systems. By strategically sampling localized experimental points, RSM can be used to construct regression models to extrapolate global relationships between input variables and output responses to identify optimal parameter combinations [16].
Based on prior single-factor studies by our research team, this work determined the dosage ranges for key experimental factors. A control mixture was supplemented with three chemical admixtures: an accelerator, cellulose ether, and polycarboxylate-based water reducer. Fresh-state rheology and flow behavior (dynamic yield stress) were characterized through standardized rheological tests. The experimental data were analyzed via RSM-driven regression models to quantify the individual and synergistic effects of admixture dosages on the performance metrics. This approach established an RSM-based optimization framework for mix proportion design. These findings offer a mechanistic framework for rational 3DPC mixture design, combining theoretical insights and practical implementation in additive construction.

2. Materials and Methods

2.1. Raw Materials

The cement consisted of P·O 42.5 ordinary Portland cement (C), sourced from Huaren Cement (Zhangping, China) Co., Ltd., while the silica fume was produced by Quanzhou Weilinte Import & Export Co., Ltd. (SF), Quanzhou, China. The mineral powder consisted of grade S95 ground granulated blast furnace slag (GS). The detailed chemical compositions are listed in Table 1. Particle size distribution analysis was performed using a Bettersize 3000Plus laser particle size analyzer (Fangxu Technology (Shanghai) Co., Ltd., Shanghai, China), with the cumulative particle size distribution curves shown in Figure 1. The sand consisted of natural sand (SS), with a particle size of 0.5–1 mm, and 6 mm polypropylene fibers (PPFs) were used, with their main properties shown in Table 2. The admixture contained a Kezhijie alkali-free accelerating agent that was used to extend the printable time of the mortar; hydroxypropyl methylcellulose (HPMC) ether solution that was used to enhance the printable properties of the mortar; and Kezhijie polycarboxylic acid water reducer (SO7D), with a water reduction rate of 40%. Polycarboxylate superplasticizer was used to adjust the workability of the fresh mortar. Tap water was used in the experiments.
According to the preliminary test, the content of the basic mix ratio could be determined as follows. The water–binder ratio was 0.3, with a cement/silica fume/mineral powder ratio of 1:0.3:0.15, and cement/sand/ratio of 1.45:1.5, with 2% PPF content of the cementitious material volume. Based on the closely packed theory combined with mixing experience, when the cement volume content accounts for 60–70% of the total powder, and the silica fume/cement and mineral powder/cement ratios are within the ranges of 0.2–0.3 and 0.15–0.3, respectively, the concrete material can achieve the maximum density [17]. The water-to-binder ratio and fiber content significantly influence the strength of fiber-reinforced concrete, with the water-to-binder ratio being the key factor. A higher fiber content increases concrete toughness but reduces workability [18]. In existing studies, fiber content is generally selected to be around 2% of the concrete volume [19].

2.2. Test Methods

2.2.1. Rheological Test

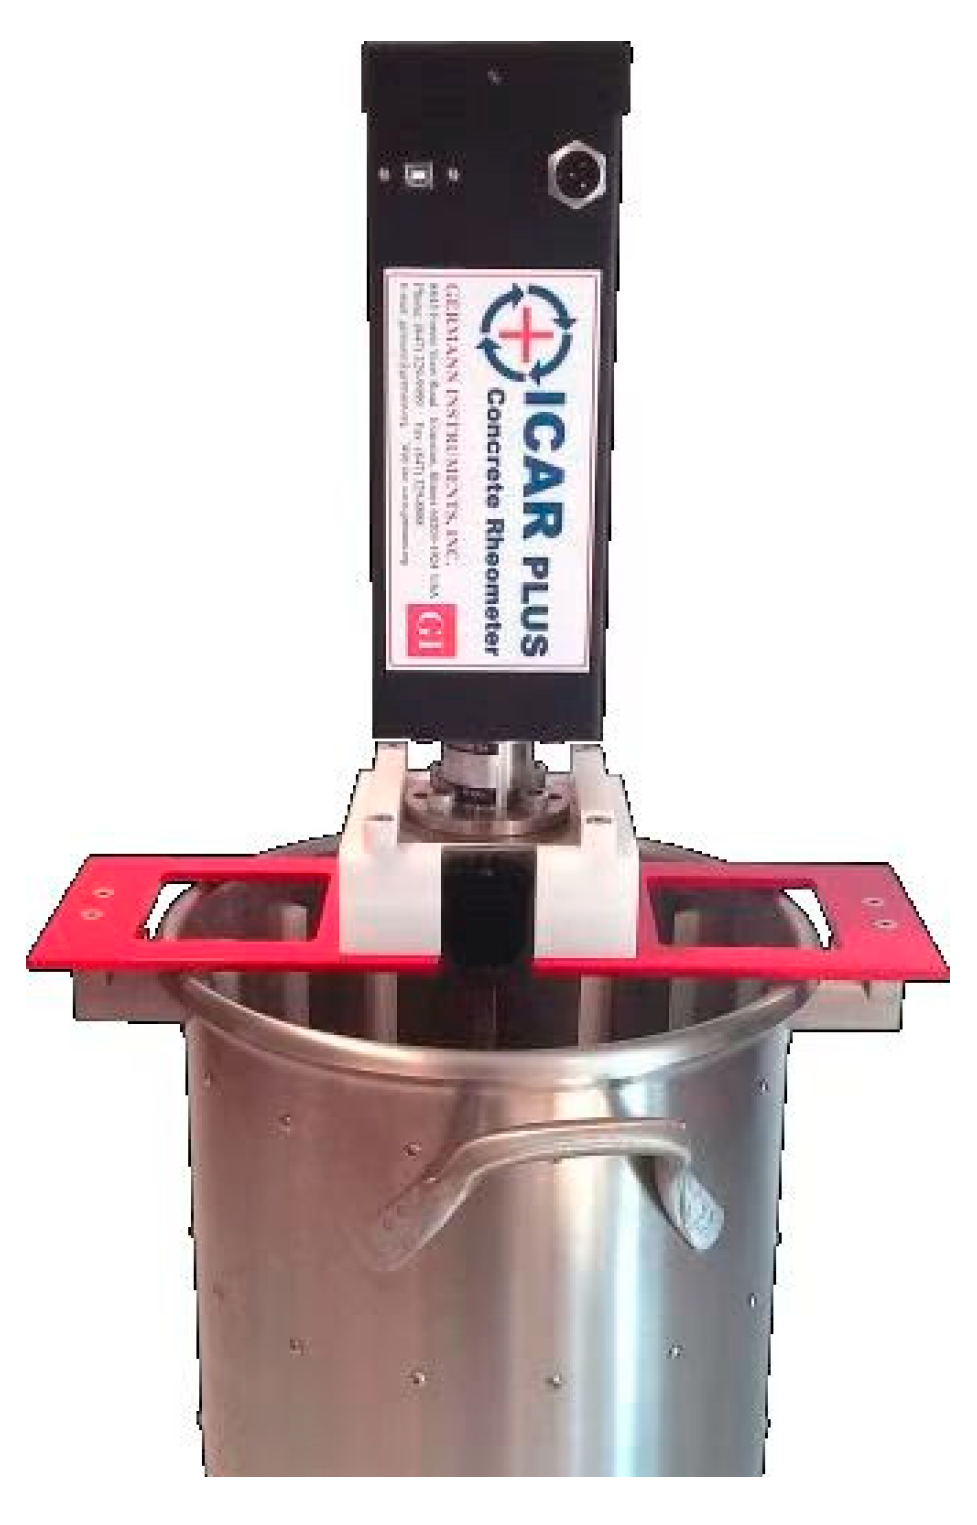
In this study, the ICAR Plus concrete rheometer was used to determine the rheological properties of fresh concrete. The rheometer results are shown in Figure 2, where the blade radius is 63.5 mm, the blade height is 127 mm, and the container radius is 143 mm. The test procedure is as follows: The test protocol involved rheological characterization, which was performed using an ICAR Plus concrete rheometer. Pre-shearing was conducted at 0.5 rotations per second (rps) for 20 s, and (2) linear ramp-down was performed from 0.5 to 0.05 rps to complete shear profiling. Each group was measured three times and the average result was calculated.
The rheological behavior of the material followed the Bingham model, and the yield stress (Pa) and plastic viscosity (Pa·s) of fresh concrete were determined by fitting the experimental data from its rotational speed–torque relationship. The dynamic yield stress was calculated using Equation (1), while the static yield stress was derived from Equation (2) as follows:
τ = τ 0 + μ γ ,
τ s = 2 T π D 3 ( H D + 1 3 ) ,
where τ 0 is the yield stress, T is the maximum torque, D is the blade diameter, H is the blade height, τ s denotes the static yield stress, μ is the plastic viscosity, and γ is the shear rate.

2.2.2. Flowability Test

The flowability testing protocol (compliant with GB/T 2419-2005 [20]) was conducted as follows. To prepare the samples, fresh mortar was poured into a truncated conical mold, compacted layer-wise, and vertically demolded after consolidation. For flow measurement, the flow table was triggered to release 25 drops in 25 s. Post test, the spread diameter was measured twice orthogonally, and the mean value was recorded. Each group was measured three times and the average result was calculated.

2.2.3. Preparation Procedures

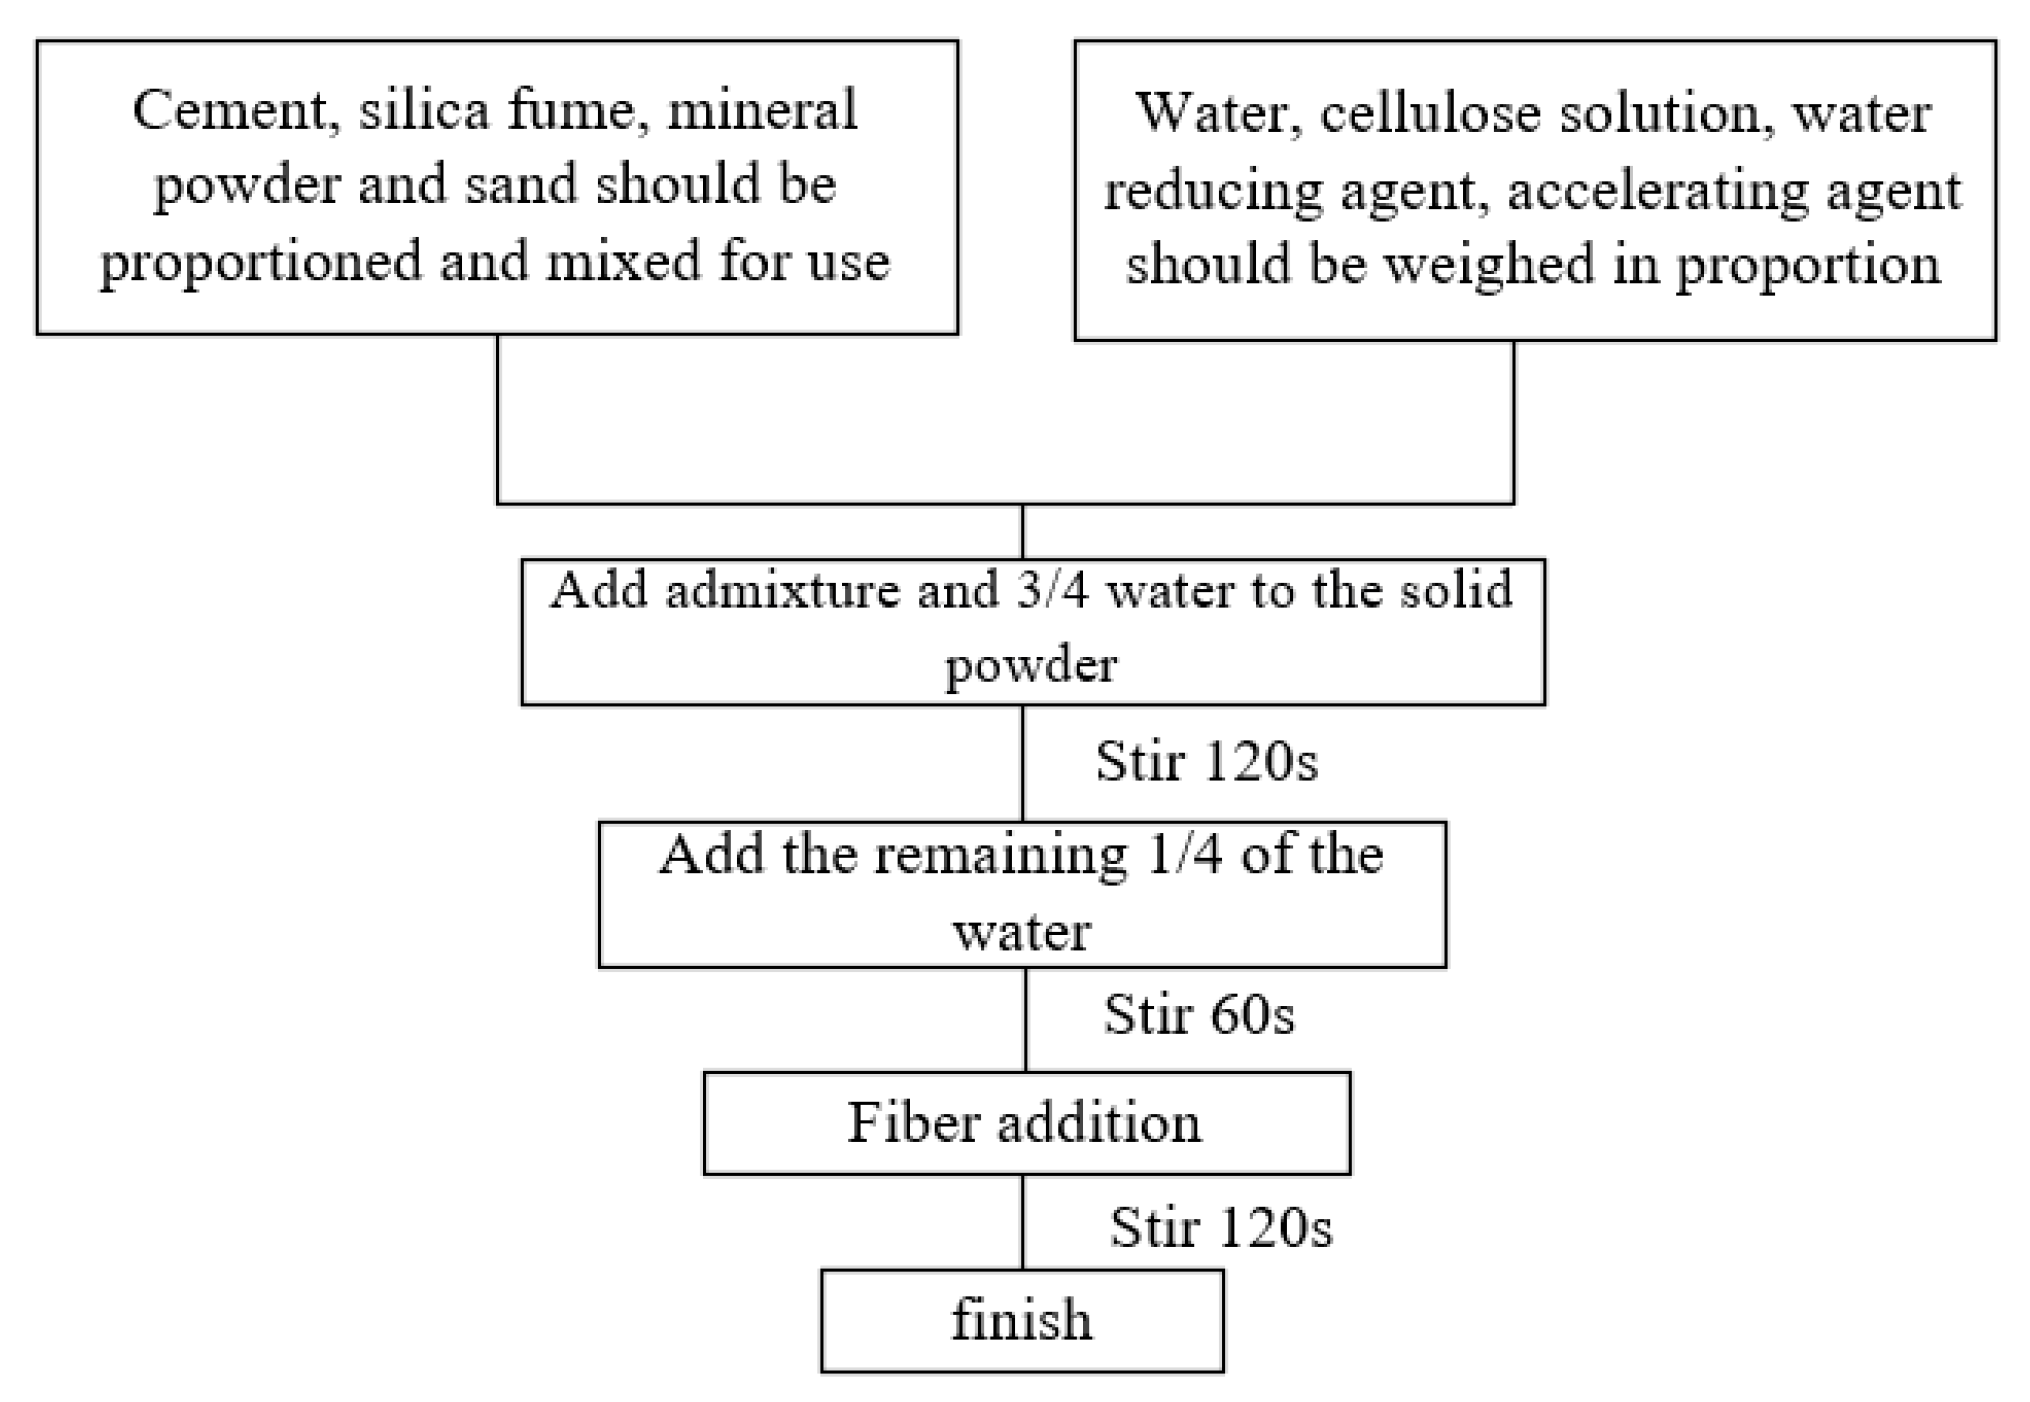
The preparation procedure for the 3D-printable materials is illustrated in Figure 3, with the detailed workflow is outlined below.
(1)
Dry mixing was achieved by mixing the pre-weighed cement, silica fume, slag powder, and sand in a planetary mixer for 180 s to homogenize the binder components.
(2)
The chemical admixtures and 75% of the total water were then slowly introduced into the dry mixture and wet-mixed for 120 s, to ensure even dispersion.
(3)
Water adjustment was then performed, where the remaining 25% of water was incrementally added during a 60 s mixing cycle to optimize the rheology and batch consistency.
(4)
Fibers were then integrated by manually feeding the fibers into the matrix and blending for 120 s to ensure uniform distribution, after which mixing was stopped to minimize fiber breakage.

2.3. Test Program

2.3.1. Response Surface Method Test Design

Despite their minor dosage (<5% by mass), chemical admixtures govern key performance metrics in 3D-printed mortars, which require strict rheological control and structural buildability [21,22]. For successful printing, these materials must demonstrate exceptional flowability under pumping shear, transitioning rapidly to high early strength after extrusion. Consequently, admixtures must fulfill a dual functionality: shear-thinning behavior for extrusion and rapid stiffening for dimensional stability.
Yield stress and flowability serve as critical parameters for assessing the resistance of 3DPC to shear-induced plastic deformation and their recovery of post-shear fluidity. These parameters critically govern a material’s workability and buildability, offering fundamental insights into its thixotropic behavior [23,24]. This study adopted a single-factor design to quantify the effects of accelerators, cellulose ether, and superplasticizers on the rheology of 3DPC, establishing a rational framework for formulation design and quality control.
Single-Factor Experiment
(1)
Effect of the accelerator on rheological properties
The base mix components were batched by mass. With PCE fixed at 0.25% and HPMC at 0.15%, the accelerator dosages (0.2–0.6%) were incrementally varied to evaluate their effects on rheological properties.
(2)
Effect of HPMC on the rheological properties
The mix constituents were prepared according to standardized protocols. The accelerator and PCE were fixed at 0.2% and 0.25%, respectively, and the HPMC dosages (0.11–0.27%) were adjusted to assess their influence on rheological behavior.
(3)
Effect of PCE on the rheological properties
The base mixture was prepared using standardized protocols. The accelerator and HPMC were maintained at 0.2% and 0.15%, while the PCE dosages (0.2–0.4%) were modulated to quantify their impact on rheology.
The Experimental Design of Response Surface Optimization
Building on the baseline mix design and single-factor experiments, three independent variables were selected, namely, the accelerator (A), HPMC (B), and PCE (C). Dynamic yield stress and flowability were assigned as response metrics, and a Box–Behnken design-based RSM was implemented using Design Expert 13 software [24]. Factor levels (Table 3) were calibrated according to the single-factor test outcomes (Section 2.3.1), ensuring alignment with practical dosage ranges.
Post-processing optimization analysis, supplemented by validation tests, was performed to determine the optimal 3DPC mix formulation. A quadratic regression model (Equation (3)) was subsequently adopted to correlate the input factors (accelerator, HPMC, and PCE) and output responses (dynamic yield stress and flowability) as follows:
Y = β 0 + i = 1 k β i X i + i = 1 k β ii X i 2 + i < j k β ij X i X j
where Y is the response variable, β 0 denotes the model intercept, β i represents the linear effect of variable X i , β i i denotes the quadratic effect of X i ,   β i j characterizes the interaction effect between X i and X j , and X i and X j are independent variables.
The predictive accuracy of the response surface model was evaluated via the coefficient of determination (R2) and adjusted determination coefficient ( R a d j 2 ), as demonstrated in Equations (4) and (5).
R 2 = i = 1 k ( y i y ¯ i ) 2 i = 1 k ( y i y ¯ i ) 2
R 2 adj = 1 i = 1 k ( y i y ¯ i ) 2 ( k 1 ) i = 1 k ( y i y ¯ i ) 2 ( k f 1 )
where k is the number of experimental runs, f represents the degrees of freedom, y i is the observed response value, y i denotes the predicted response value, and y ¯ i is the mean observed response value. Model accuracy was deemed satisfactory when both R2 and R a d j 2 exceeded 0.9, with values approaching 1 indicating superior fitting precision.

2.3.2. Three-Dimensional Printing Experiment Design

3D Printer Parameter Settings
This experiment utilized a concrete 3D printer (Xiamen Zhichuangchi Technology Co., Ltd., Key, Xiamen, China), with the operational parameters of the 3D printer configured as follows: nozzle diameter of 20 mm, X-/Y-axis movement speed of 80 mm/s for the print head, and Z-axis movement speed of 40 mm/s.
Print Path Diagram
Buildability, essential for successful 3D printing, requires printed layers to resist structural collapse and significant deformation under self-weight and overburden loads from successive layers. Deformation resistance under gravitational forces, quantified by the form retention ratio, directly reflects material stability and serves as a critical metric for assessing stackability in 3DPC. Higher form retention ratios are typically correlated with reduced self-weight deformation, ensuring stable multi-layer deposition. The buildability assessment protocol in this work followed established methodologies, utilizing a predefined printing path configuration (Figure 4) to simulate sequential layer deposition under controlled conditions. This framework enabled the systematic evaluation of interlayer adhesion and time-dependent structural integrity.

3. Results and Discussion

3.1. Single-Factor Test Results

The effect of additive dosage on the rheological properties of the material was investigated through single-factor experiments. This investigation had two primary objectives, with the first exploring the extent to which different variables could affect the rheological parameters of the material, and the second providing guidance for subsequent formulation optimization. These objectives were achieved by analyzing the influence of different variables on the rheological properties of the material.
(1)
Effect of accelerator on the rheological properties
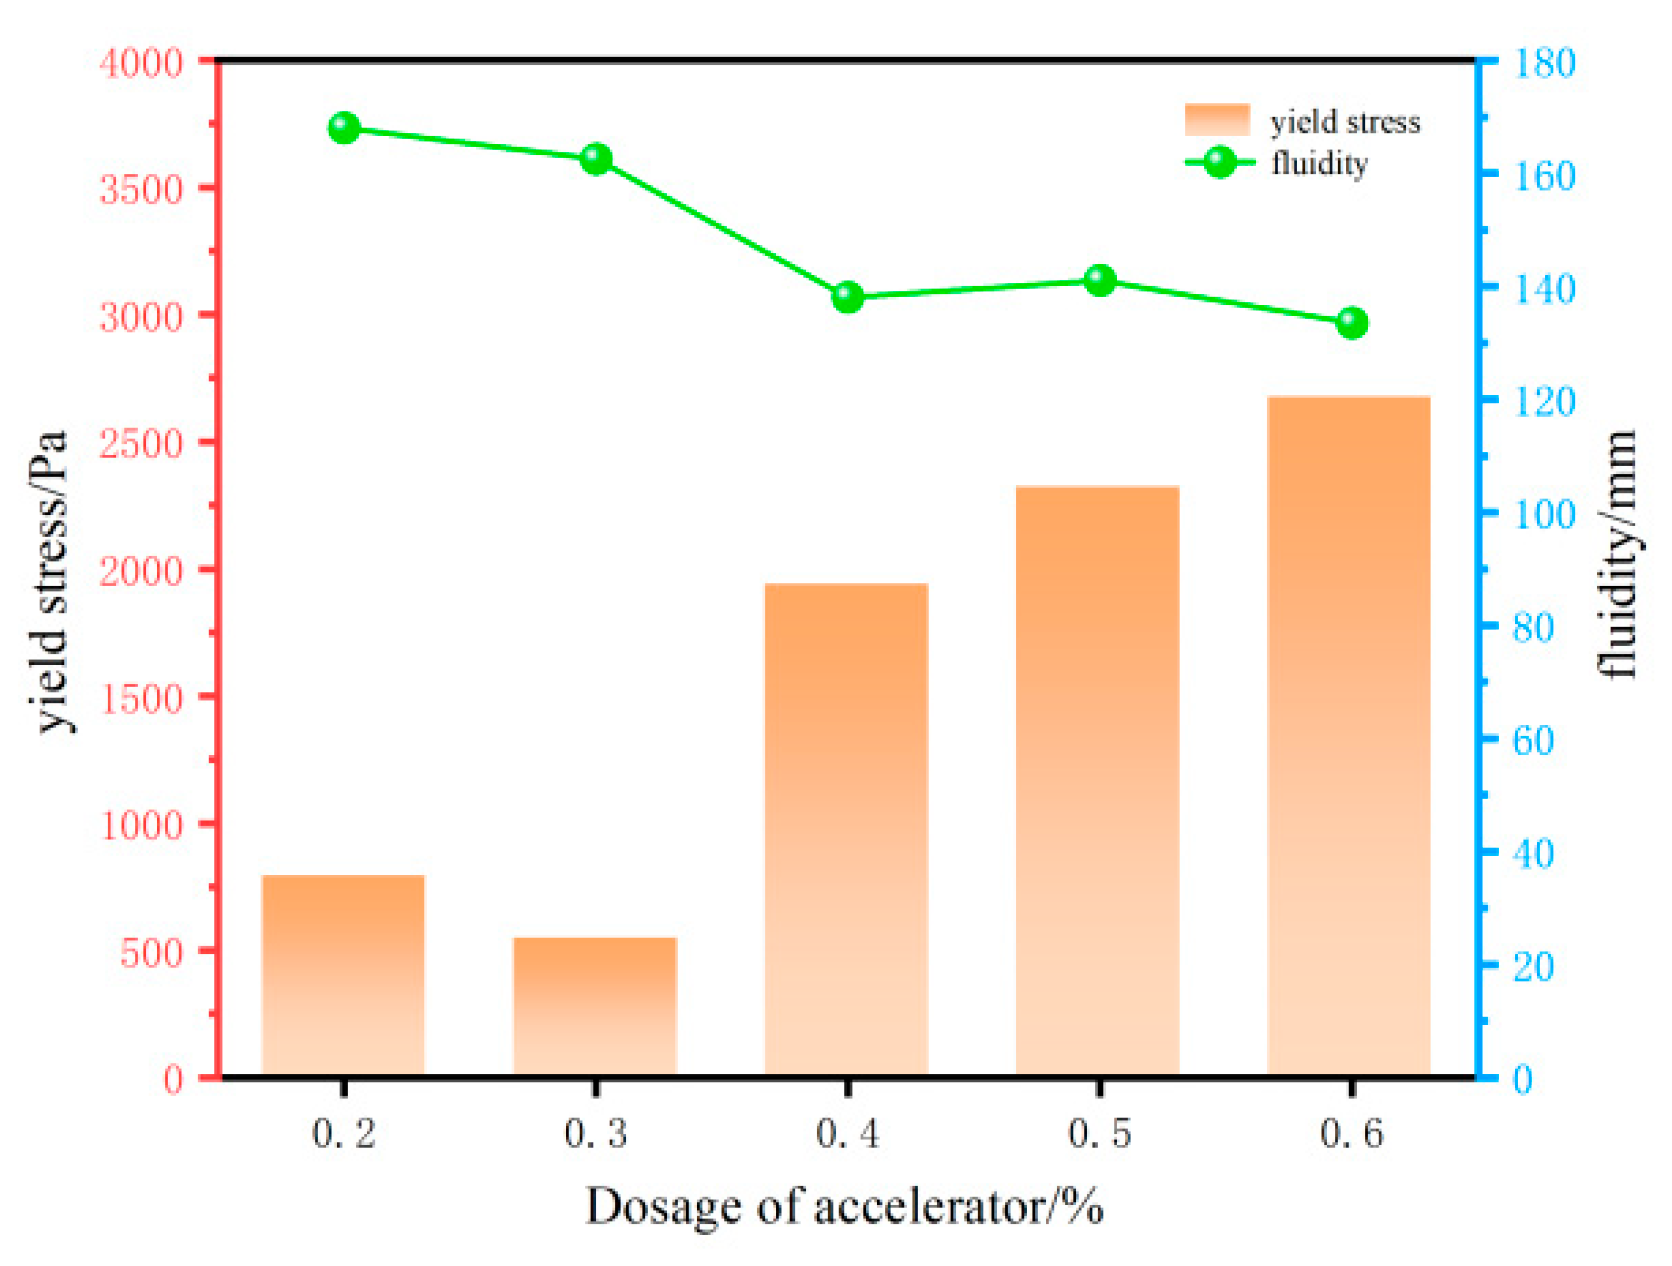
As shown in Figure 5, under fixed experimental conditions, the dynamic yield stress of 3DPC exhibited a complex dependence on accelerator dosage (0.2–0.6%). Below 0.3%, the yield stress decreased sharply, likely due to the insufficient modification of hydration kinetics, which delayed the formation of interparticle bonds and weakened early structural networks. Beyond 0.3%, the accelerated nucleation of calcium–silicate–hydrate (C-S-H) gels dominated, resulting in a progressive yield stress increase [25]. Concurrently, flowability decreased across the dosage range, except for a transient increase at 0.5% attributed to localized saturation effects. Based on these trends, accelerator dosages of 0.3%, 0.4%, and 0.5% were identified as critical thresholds for further optimization.
(2)
Effect of HPMC solution on the rheological properties
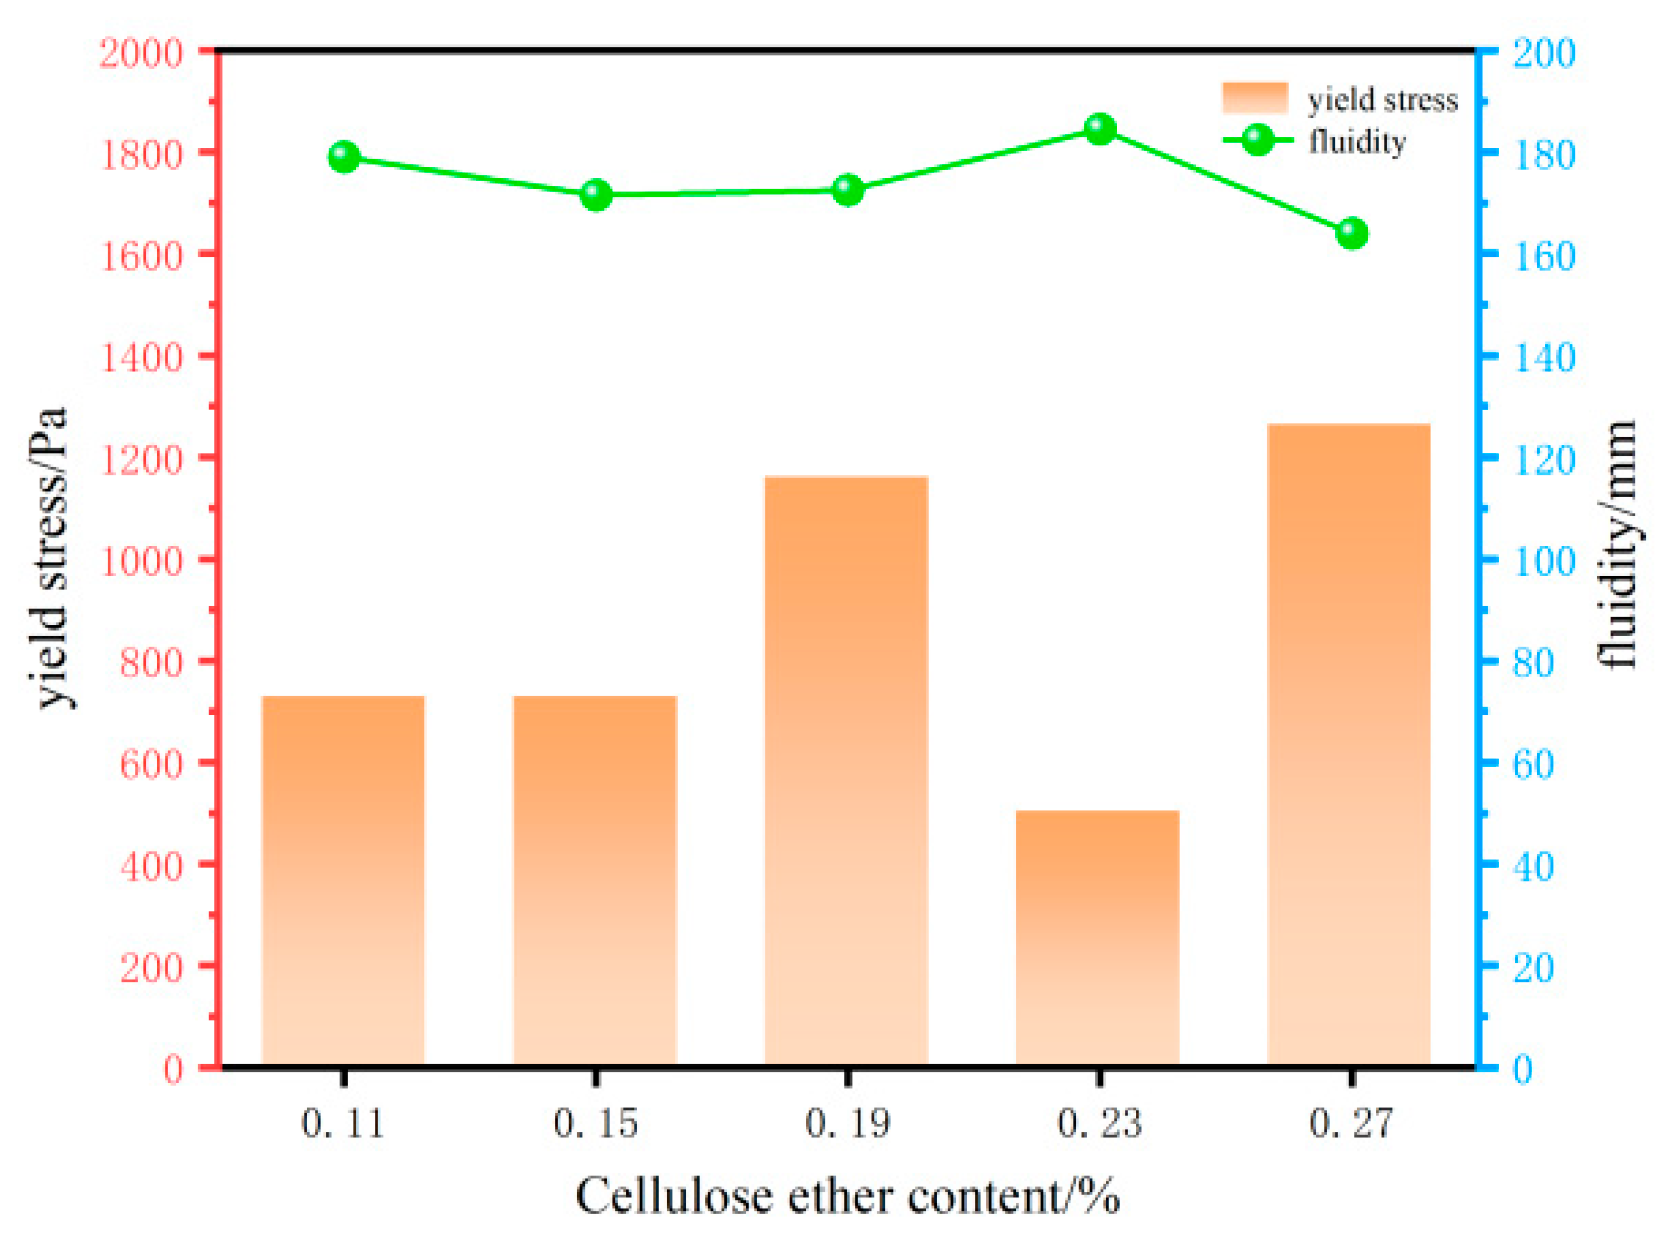
As shown in Figure 6, under identical conditions, the yield stress and flowability of the 3D-printed cement-based materials exhibited significant changes when the hydroxypropyl methylcellulose ether solution content ranged from 0.11% to 0.27%, with notable variations observed at 0.23% and 0.27%. This phenomenon could be attributed to the propensity of the hydroxyl groups and ether bonds present on the polymer chains of the HPMC solution, which readily formed hydrogen bonds with water. This process resulted in a reduction in free water content within the paste, thereby increasing internal friction within the material. Consequently, this heightened internal friction led to an increase in yield stress [8,26], and concurrently, the incorporation of HPMC markedly diminished the flowability of the mortar. As the HPMC content increased from 0.11% to 0.27%, the initial flowability of the mortar experienced a decrease from 179 mm to 171.5, 172.5, 184.5, and 164 mm. As a high-molecular-weight polymer, HPMC contained molecules that could intertwine, thereby forming a network structure. This structure enhanced the cohesive strength of the cement paste by enveloping components such as Ca(OH)2, resulting in the improved cohesiveness of the mortar at the macro level. As the static time increased, the hydration degree of the mortar increased, leading to a time-dependent loss of flowability [27,28,29]. Notably, at a content level of 0.23%, the mortar achieved its maximum flowability retention capacity. A series of optimization experiments were conducted, taking into account all pertinent factors. The experiments incorporated HPMC content levels of 0.19%, 0.23%, and 0.27%.
  • Effect of PCE on rheological properties
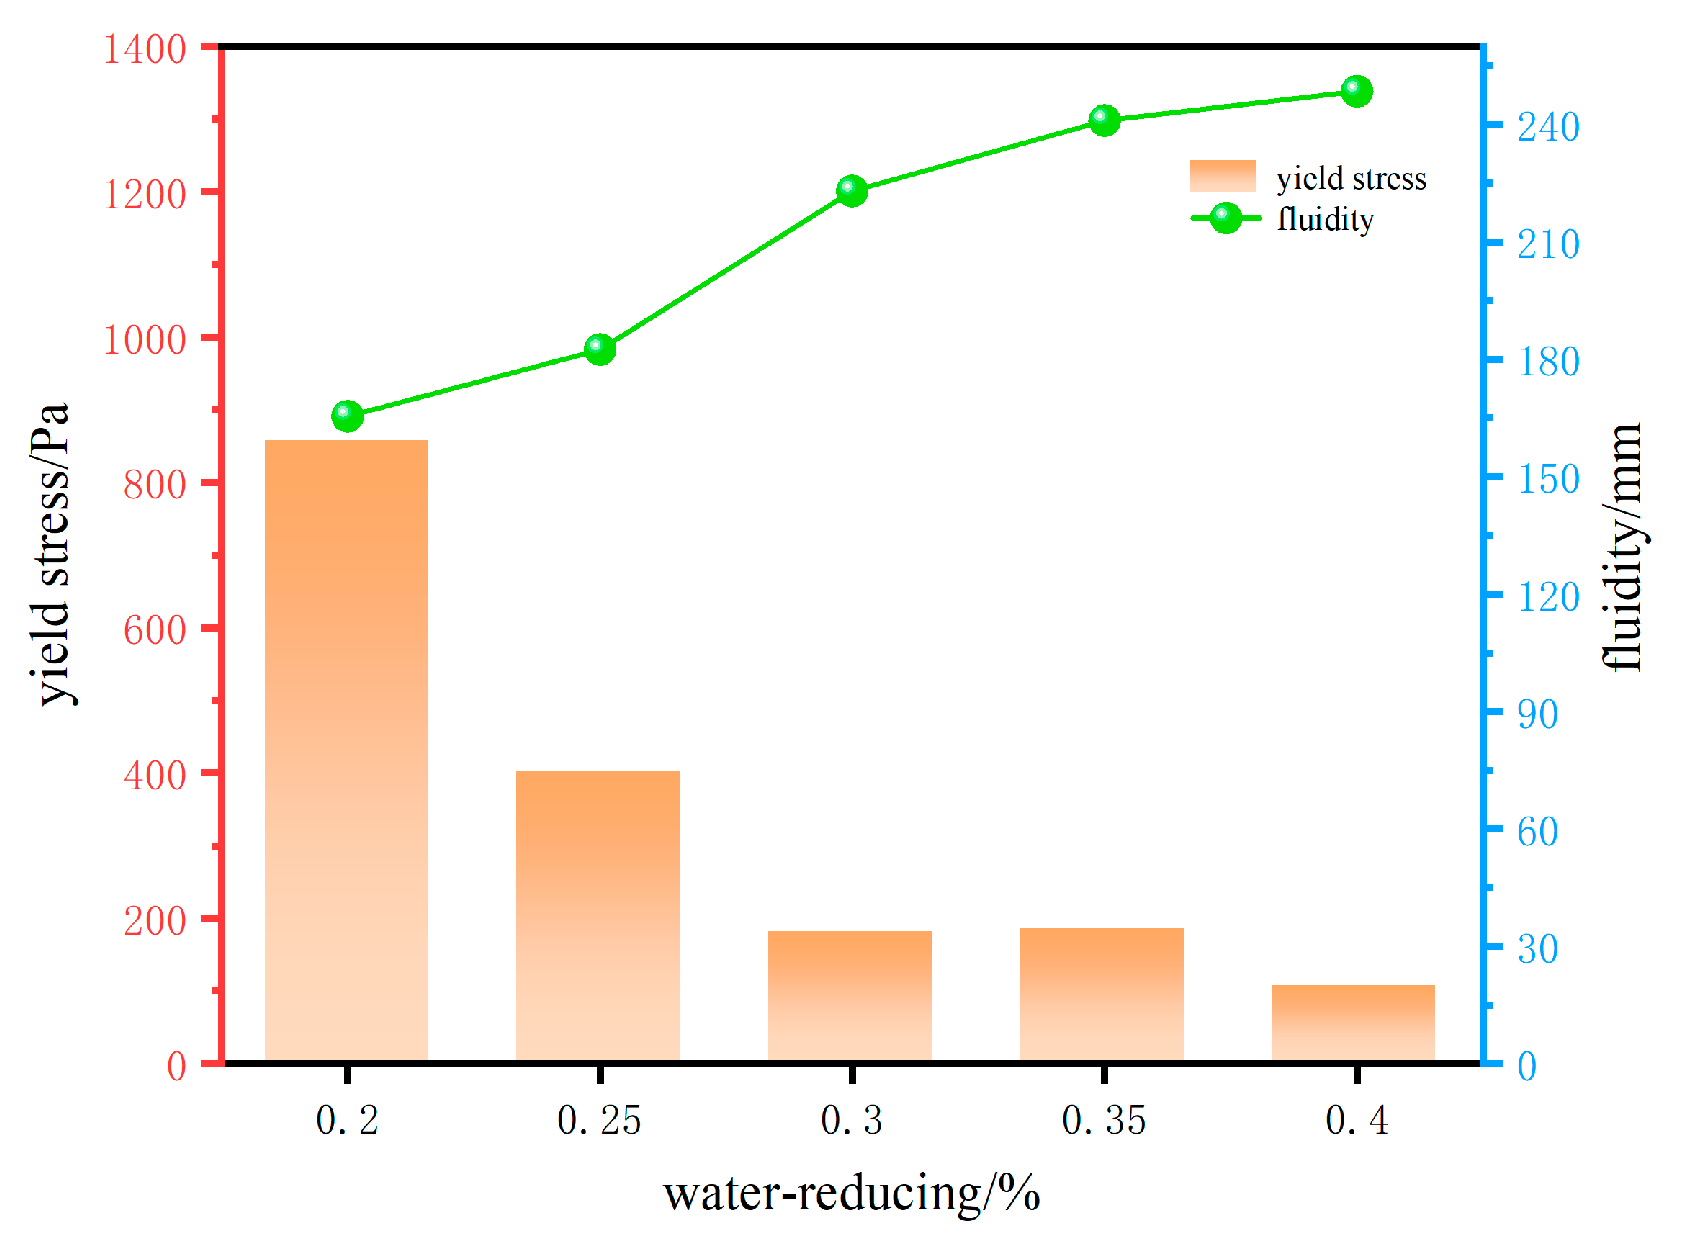
As illustrated in Figure 7, under identical conditions, the yield stress of the 3D-printed cement-based materials gradually decreased with increasing PCE dosage in the range of 0.2–0.4%, while the flowability correspondingly increased. This phenomenon could be attributed to the addition of high-performance superplasticizers to the cement paste, which resulted in changes to the paste’s internal structure. The adsorption of high-performance water-reducing agents on the surface of the cement particles was found to alter the zeta potential of the particles [30]. This change also possibly resulted in steric hindrance, leading to a reduction in the cohesive forces between the particles and an increase in repulsive forces. The flocculation structure of the cement paste underwent significant disruption, thus enhancing the dispersion of cement particles and establishing a novel equilibrium system. This, in turn, resulted in changes to the internal structure of the paste, which enhanced its flowability. In addition to relying on electrostatic repulsive forces, the polycarboxylic acid high-performance water-reducing agent also possessed a comb-shaped branched structure that could exert steric hindrance effects in the cement paste, promoting a more thorough dispersion of the cement [31,32,33]. To assess printability, optimization experiments were conducted using concentrations of 0.2%, 0.25%, and 0.3%.

3.2. Response Surface Results

The experimental configurations and outcomes of the RSM-based study are detailed in Table 4, including the design parameters and optimization results.

3.2.1. Response Surface Regression Model Analysis

Guided by the Box–Behnken design methodology, a predictive regression model was developed to establish the response equations for systematic optimization.
The experimental results in Table 4 were analyzed, with factors A (accelerator), B (hydroxypropyl methylcellulose, HPMC), and C (polycarboxylate superplasticizer, PCE) denoting the three admixtures under investigation. Interaction terms AB, AC, and BC quantified the synergistic or antagonistic relationships between the admixtures, modulating the key rheological responses.
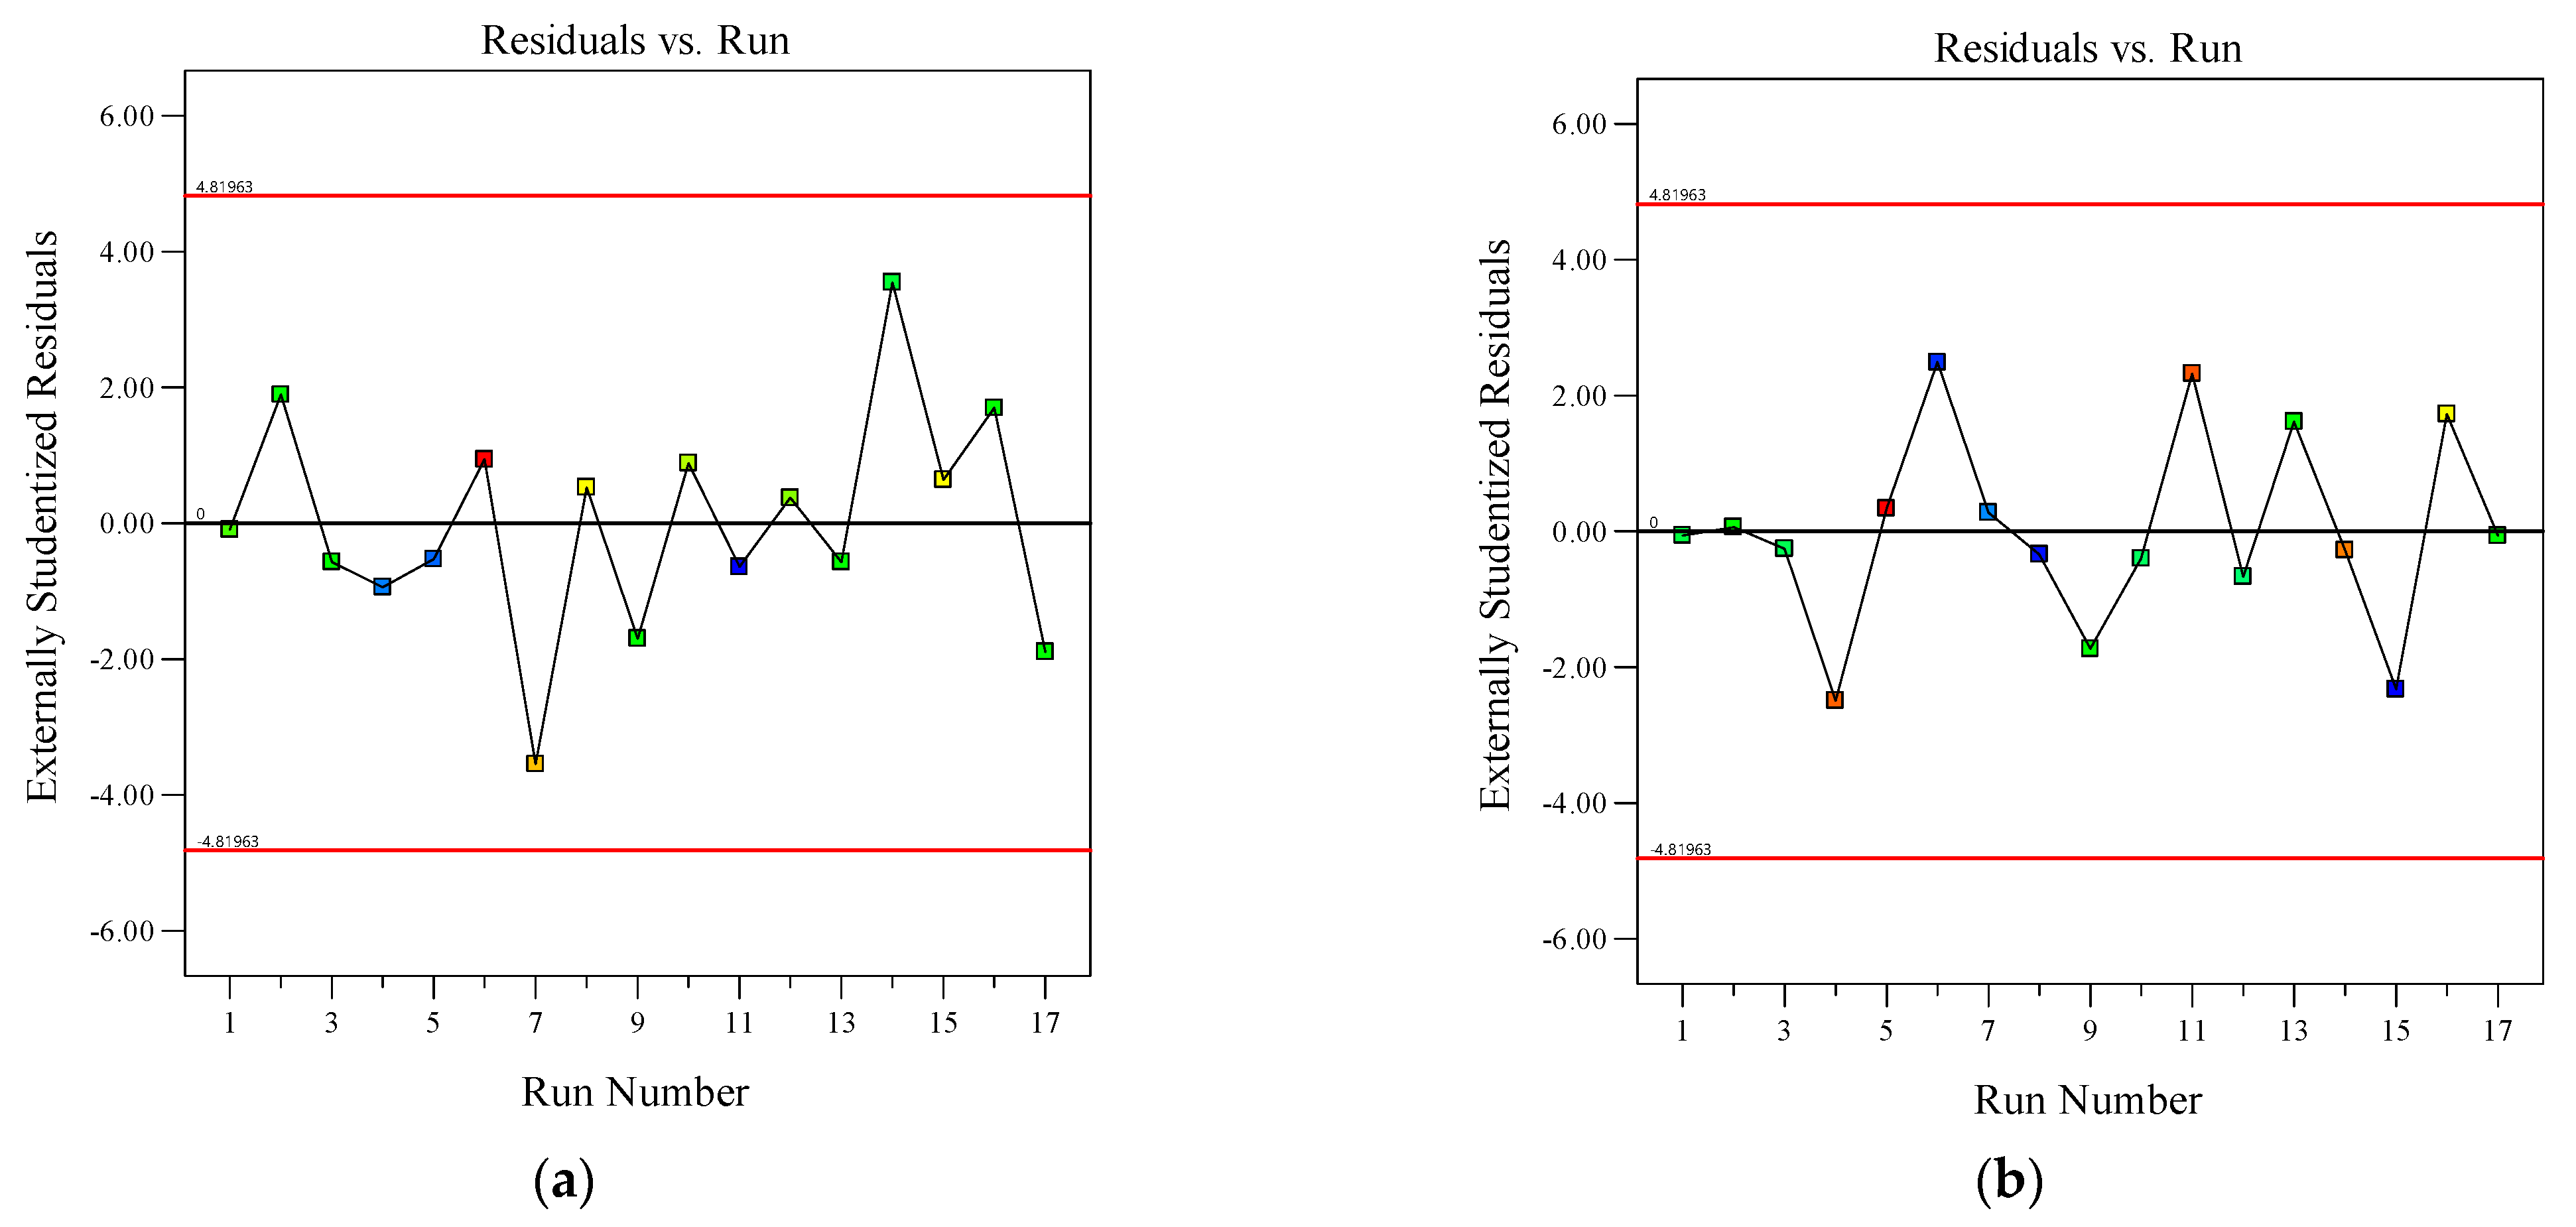
Figure 8 illustrates the relationship between the residuals, the run order for flowability (a), and the dynamic yield stress (b) tests, indicating no significant trends or clustering patterns. Residuals were randomly dispersed around the central line, confirming their mutual independence. From a statistical perspective, the derived RSM model was rigorously justified. It should be noted that the experimental points in the figure are divided into two categories: red points are high impact/outliers marked by the software, and the rest are normal data. Occasional red points do not need to be removed. If the diagnostic indicators and overall model quality are still acceptable, they can be retained and used for reference only.
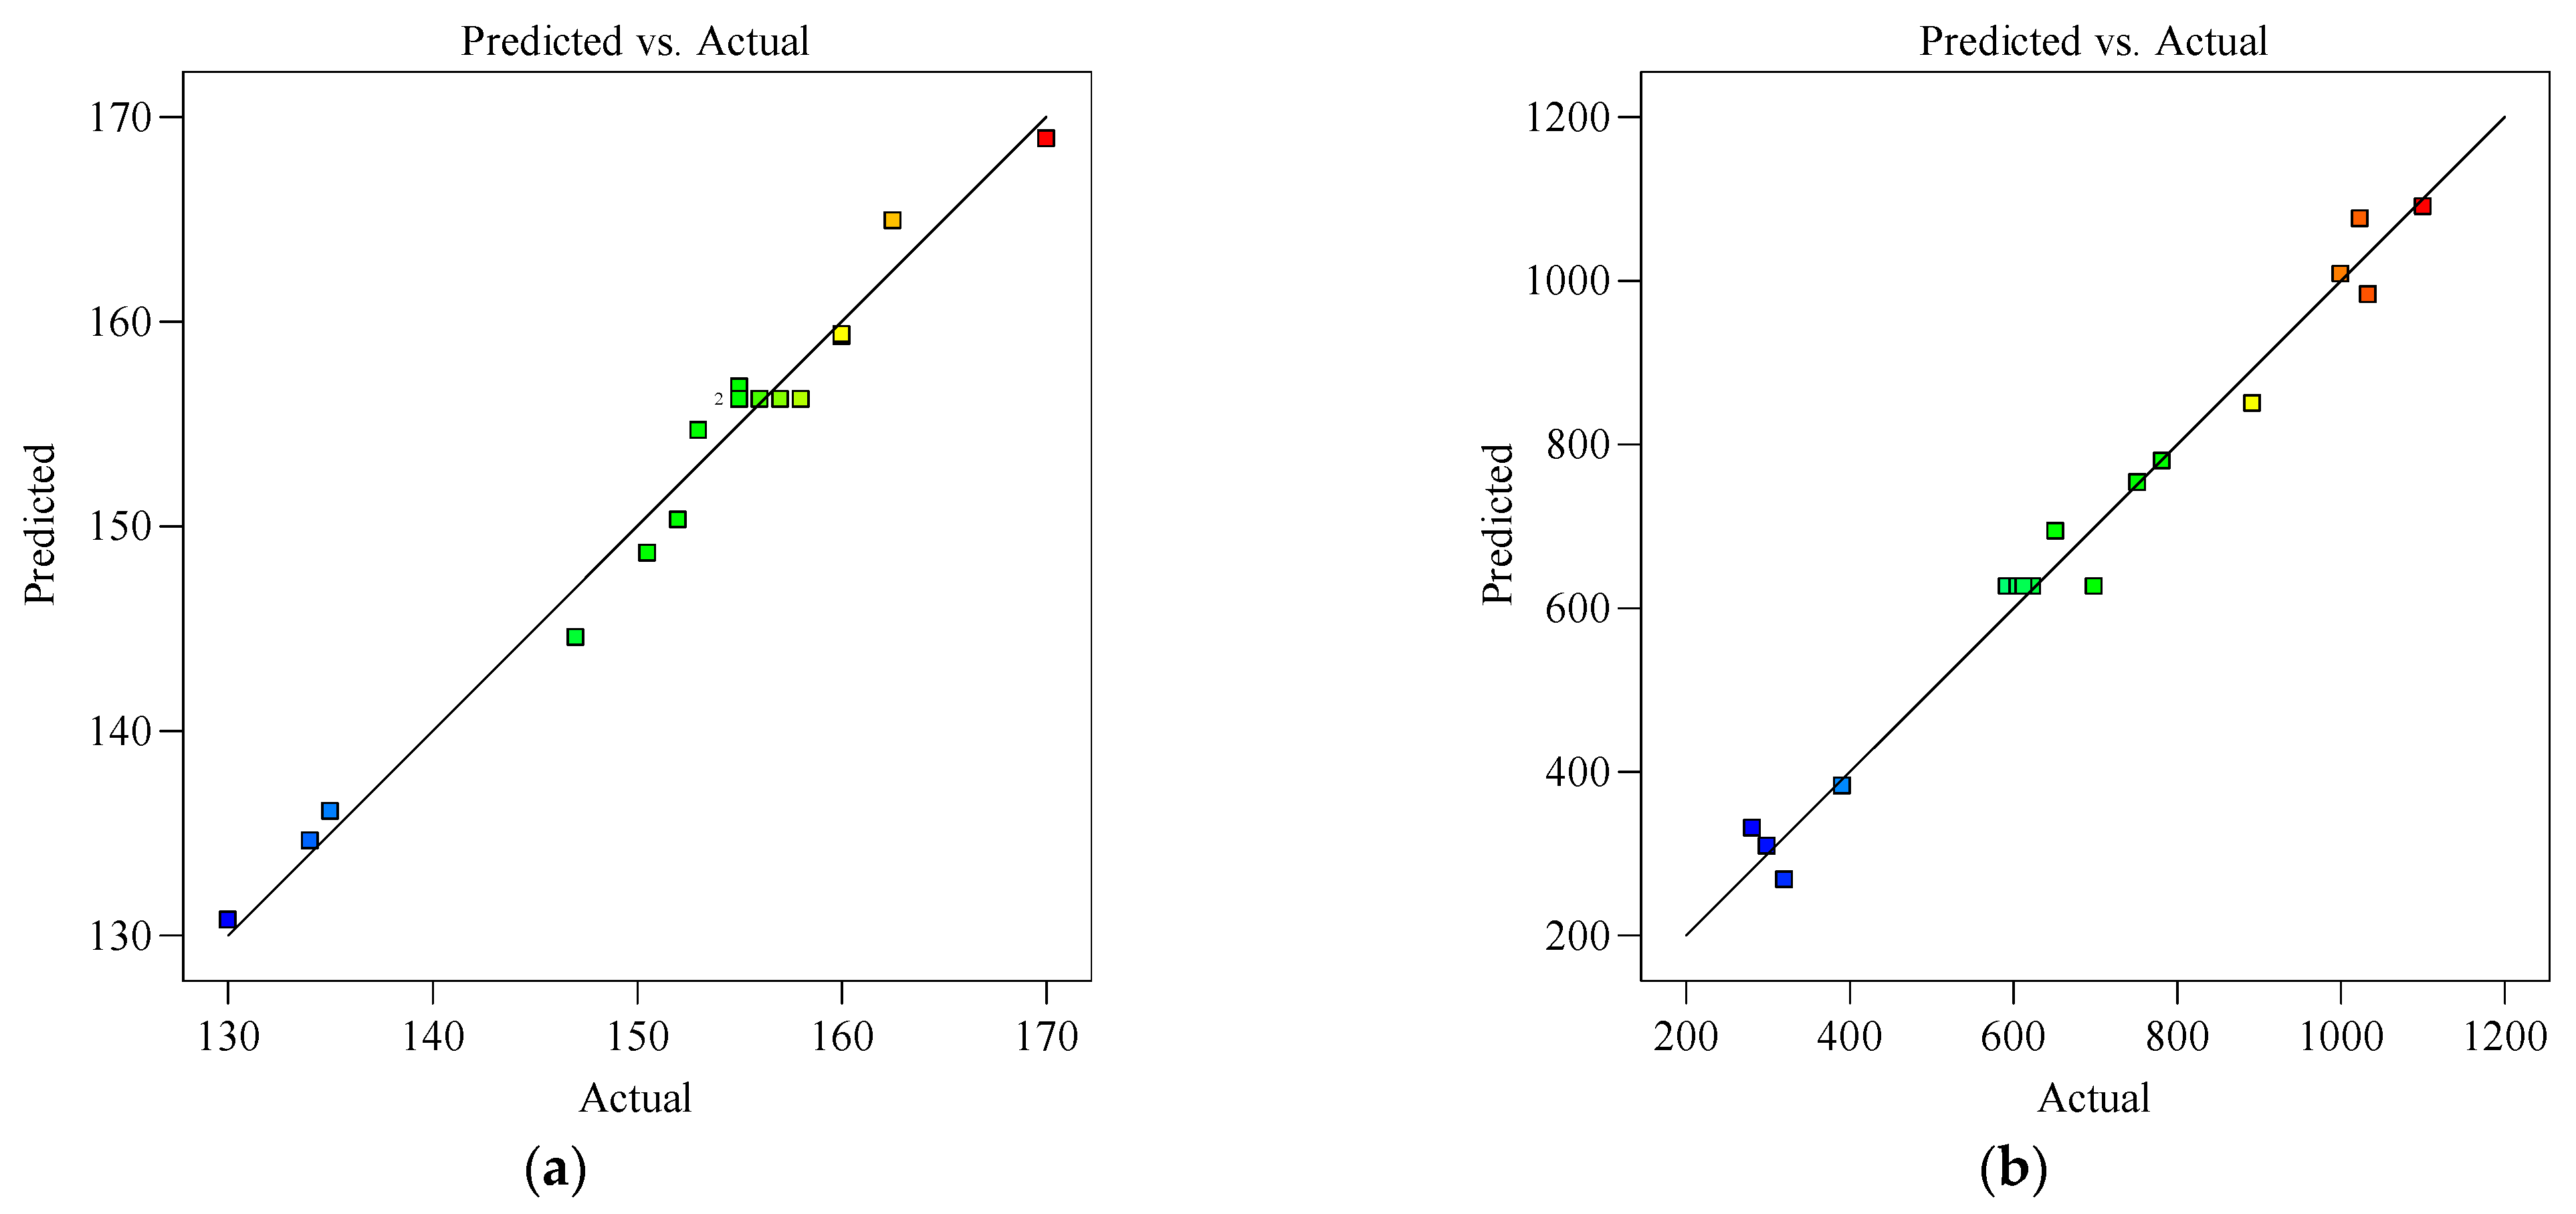
Figure 9a compares the predicted flowability (calculated via the response surface model) with the experimental values, while Figure 9b illustrates the predicted rheological properties (derived from the response surface model) against their experimentally measured counterparts. The linear regression line (y(predicted) = x(actual)) indicated a high degree of agreement. Flowability and dynamic yield stress both exhibited goodness-of-fit metrics (R2 and R a d j 2 ) exceeding 0.9, fully satisfying the model accuracy requirements, which confirmed that the proposed model effectively captured the relationship between the material characteristics and compositional parameters.
The final empirical models correlating flowability and dynamic yield stress to the admixture dosages (A, B, C) and their interactions were derived as follows:
Flowability = 156.20 − 3.12A − 0.9375B + 13.31C + 0.125AB + 1.13AC + 1.00BC + 2.02A2 − 5.60B2 − 4.60C2
Dynamic Yield Stress = 626.40 + 45.58A − 32.47B − 358.30C − 2.65AB + 11.75AC + 21.35BC + 73.97A2 + 68.82B2 − 16.77C2.
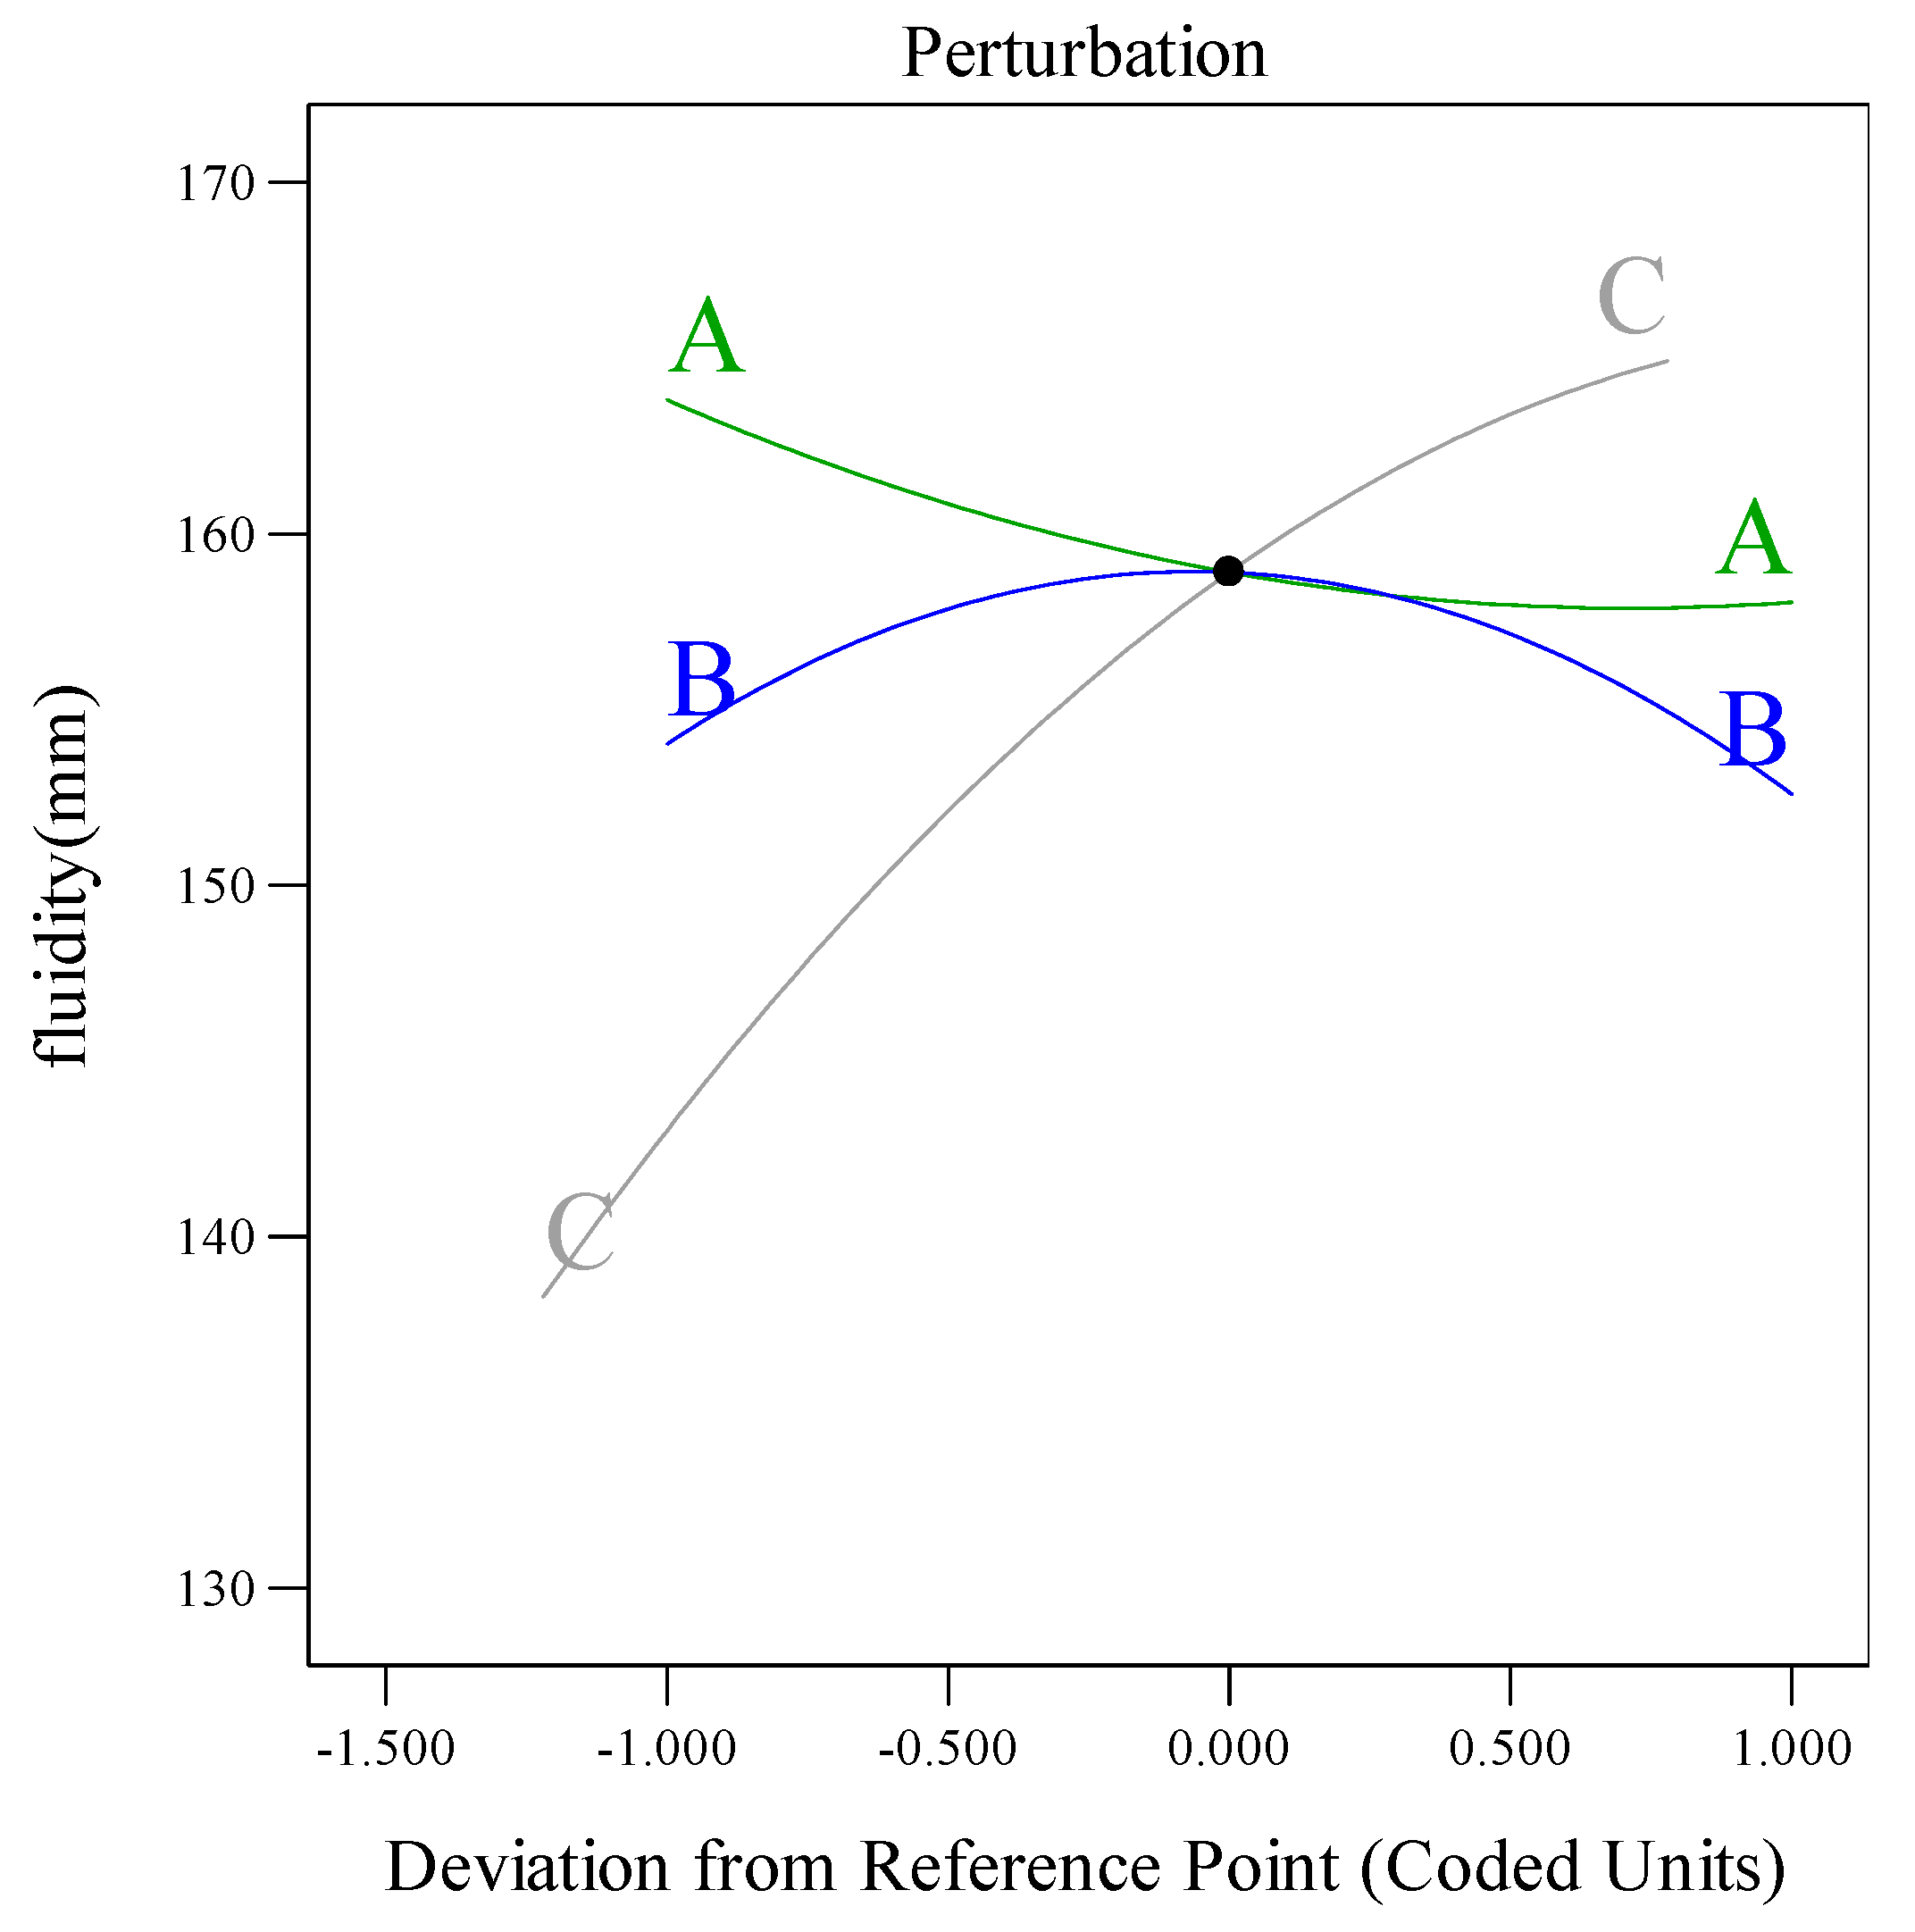
As shown in Table 5 and Table 6, the flowability model (p < 0.0001) and dynamic yield stress model (p < 0.0001) exhibited significant validity (p < 0.05). The lack-of-fit values (0.0656 and 0.1770) exceeded 0.05, confirming strong agreement between the models and experimental data [34,35]. The F-values indicated that the factor influence hierarchy followed C > A > B for both flowability and dynamic yield stress. In the flowability model, A, C, and BC interactions (p < 0.05) significantly governed flow behavior, while the AB interaction showed a negligible impact. For dynamic yield stress, only factor C (p < 0.05) demonstrated significant dominance, with interactions involving A and B remaining statistically insignificant. The sensitivity analysis of trend curves (Figure 10 and Figure 11) quantified the model responsiveness to dosage variations across the components. The results showed that flowability decreased linearly with A, indicating a parabolic trend with B, and rising sharply with C. Meanwhile, the dynamic yield stress declined with B or C but gradually increased with A, with C exhibiting the strongest destabilizing effect.

3.2.2. Response Surface Analysis

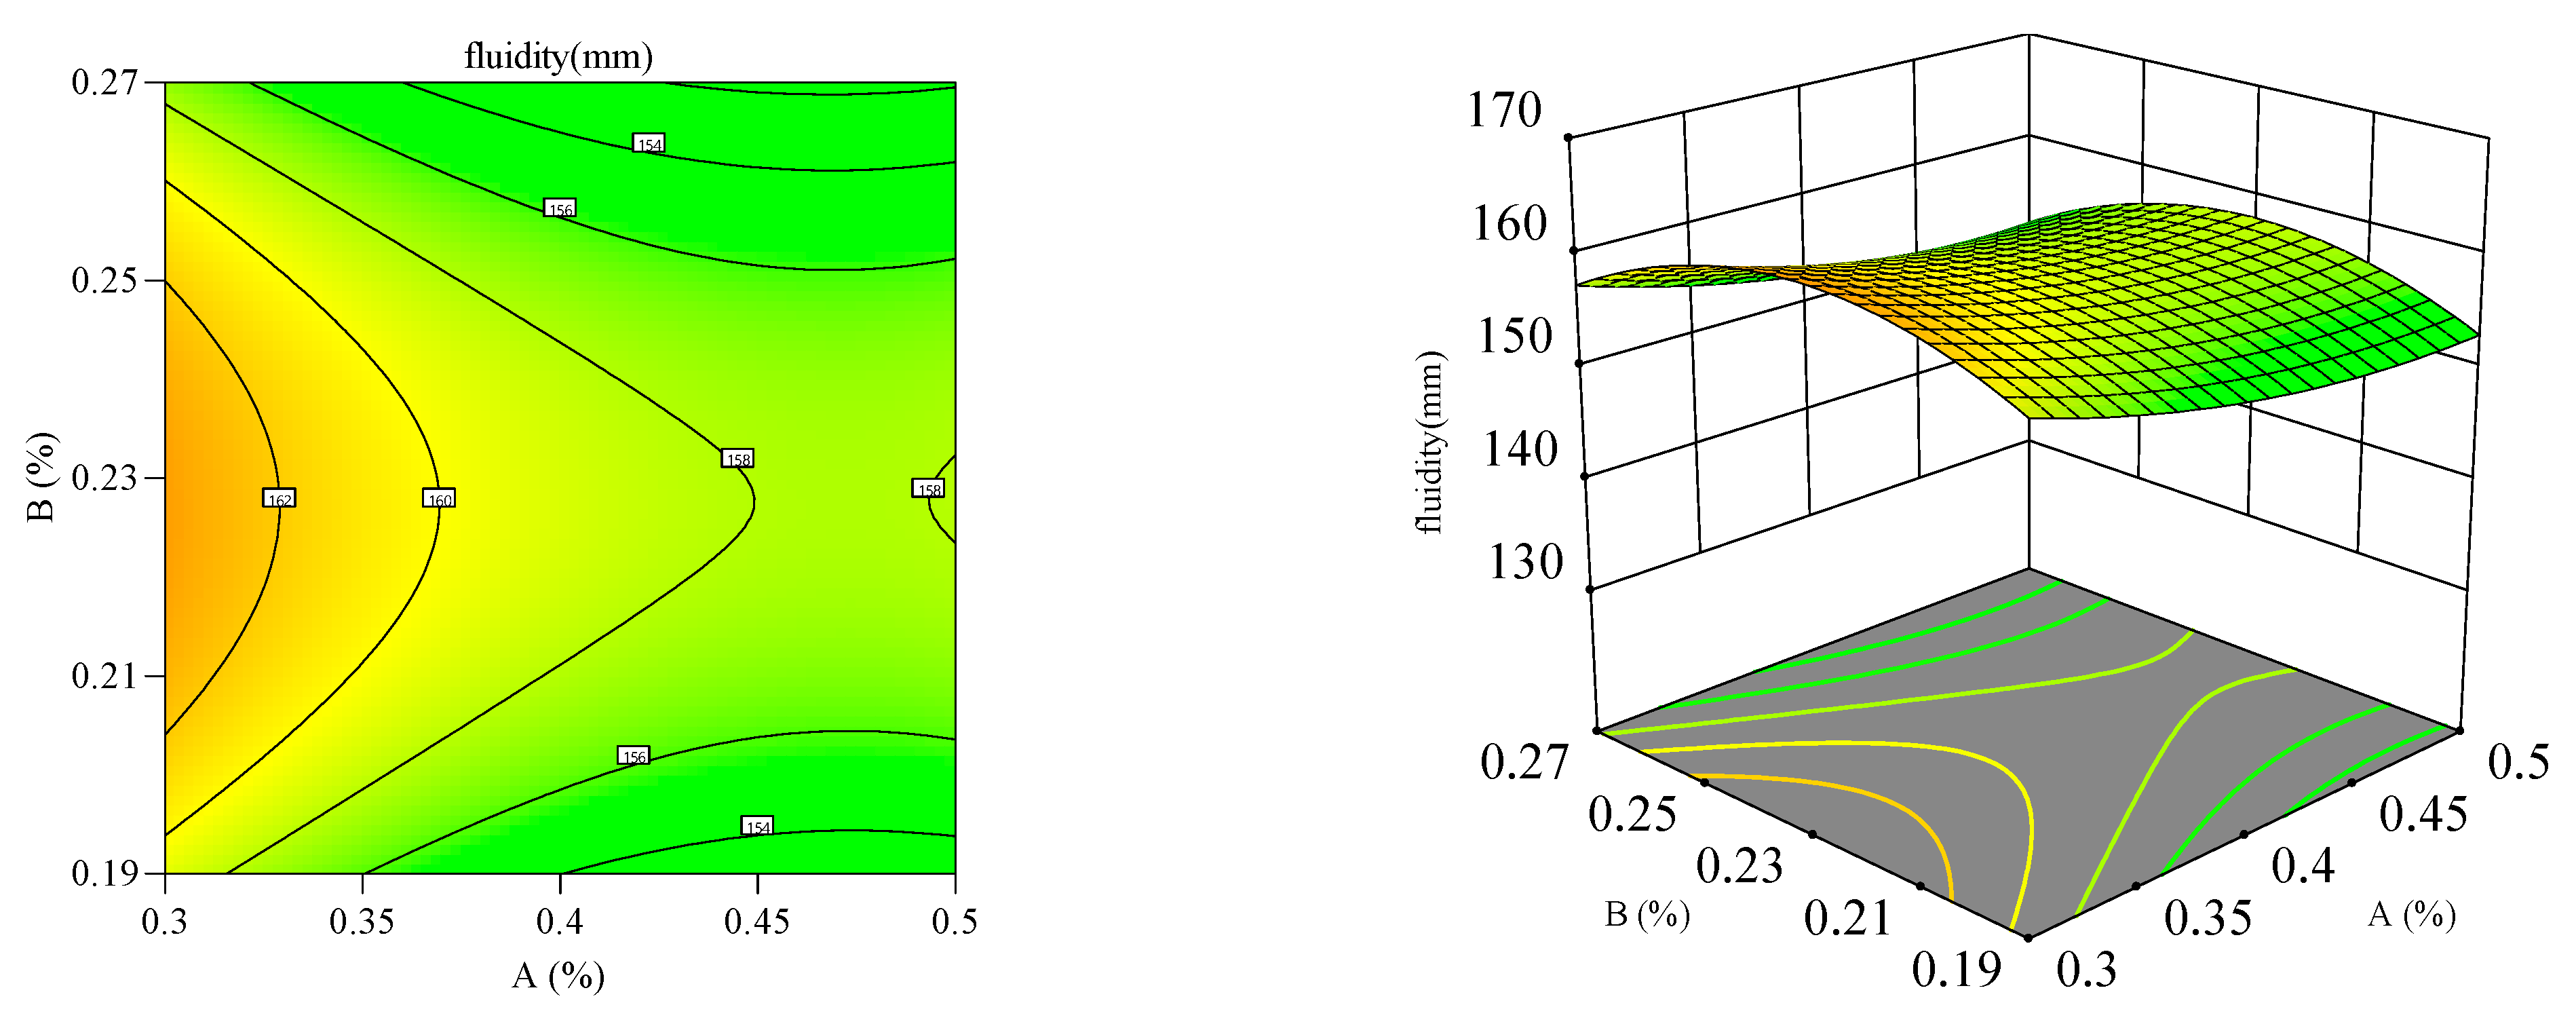
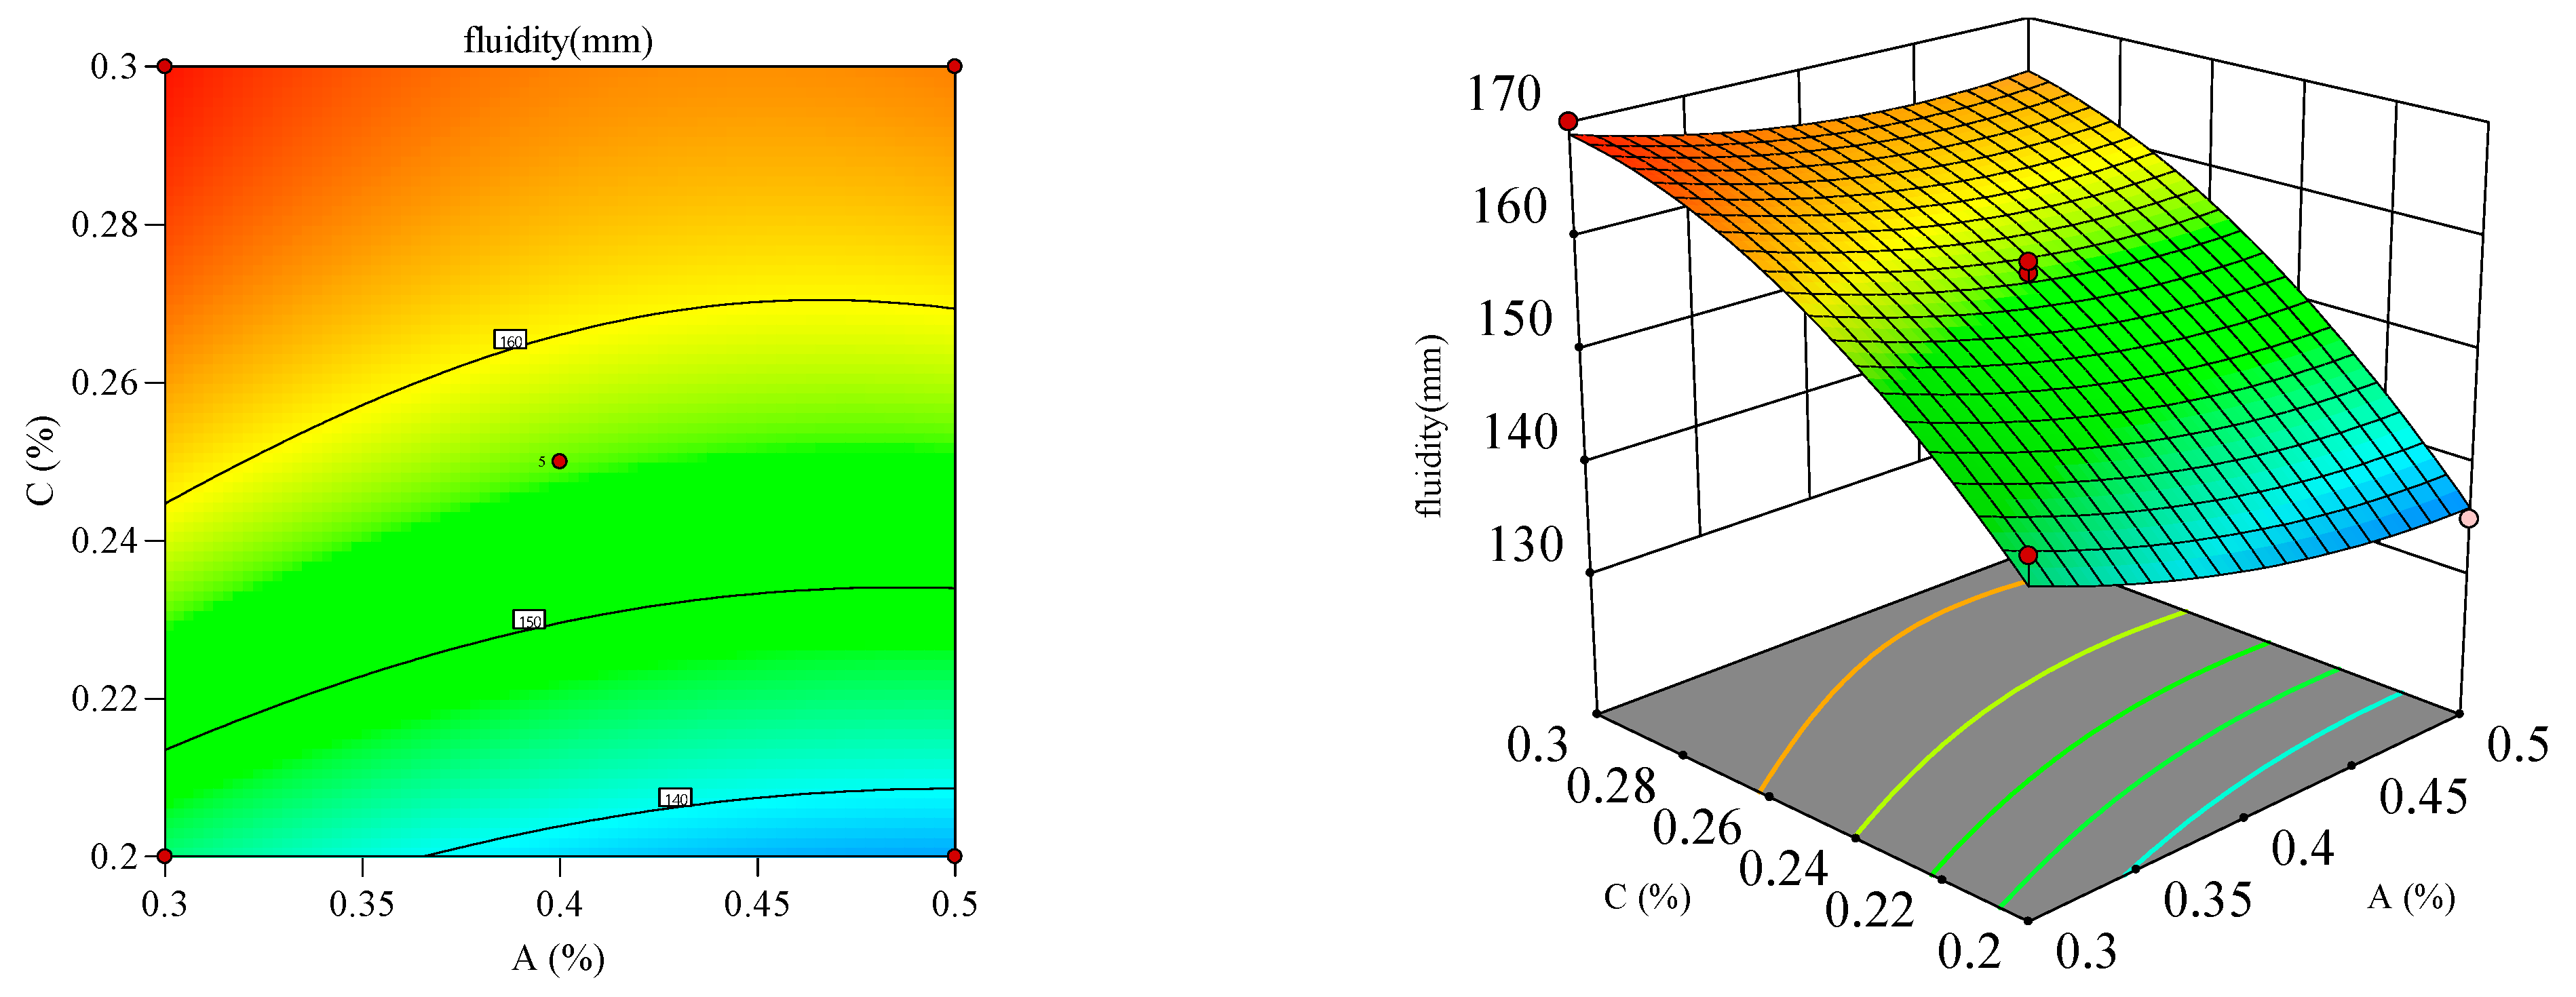
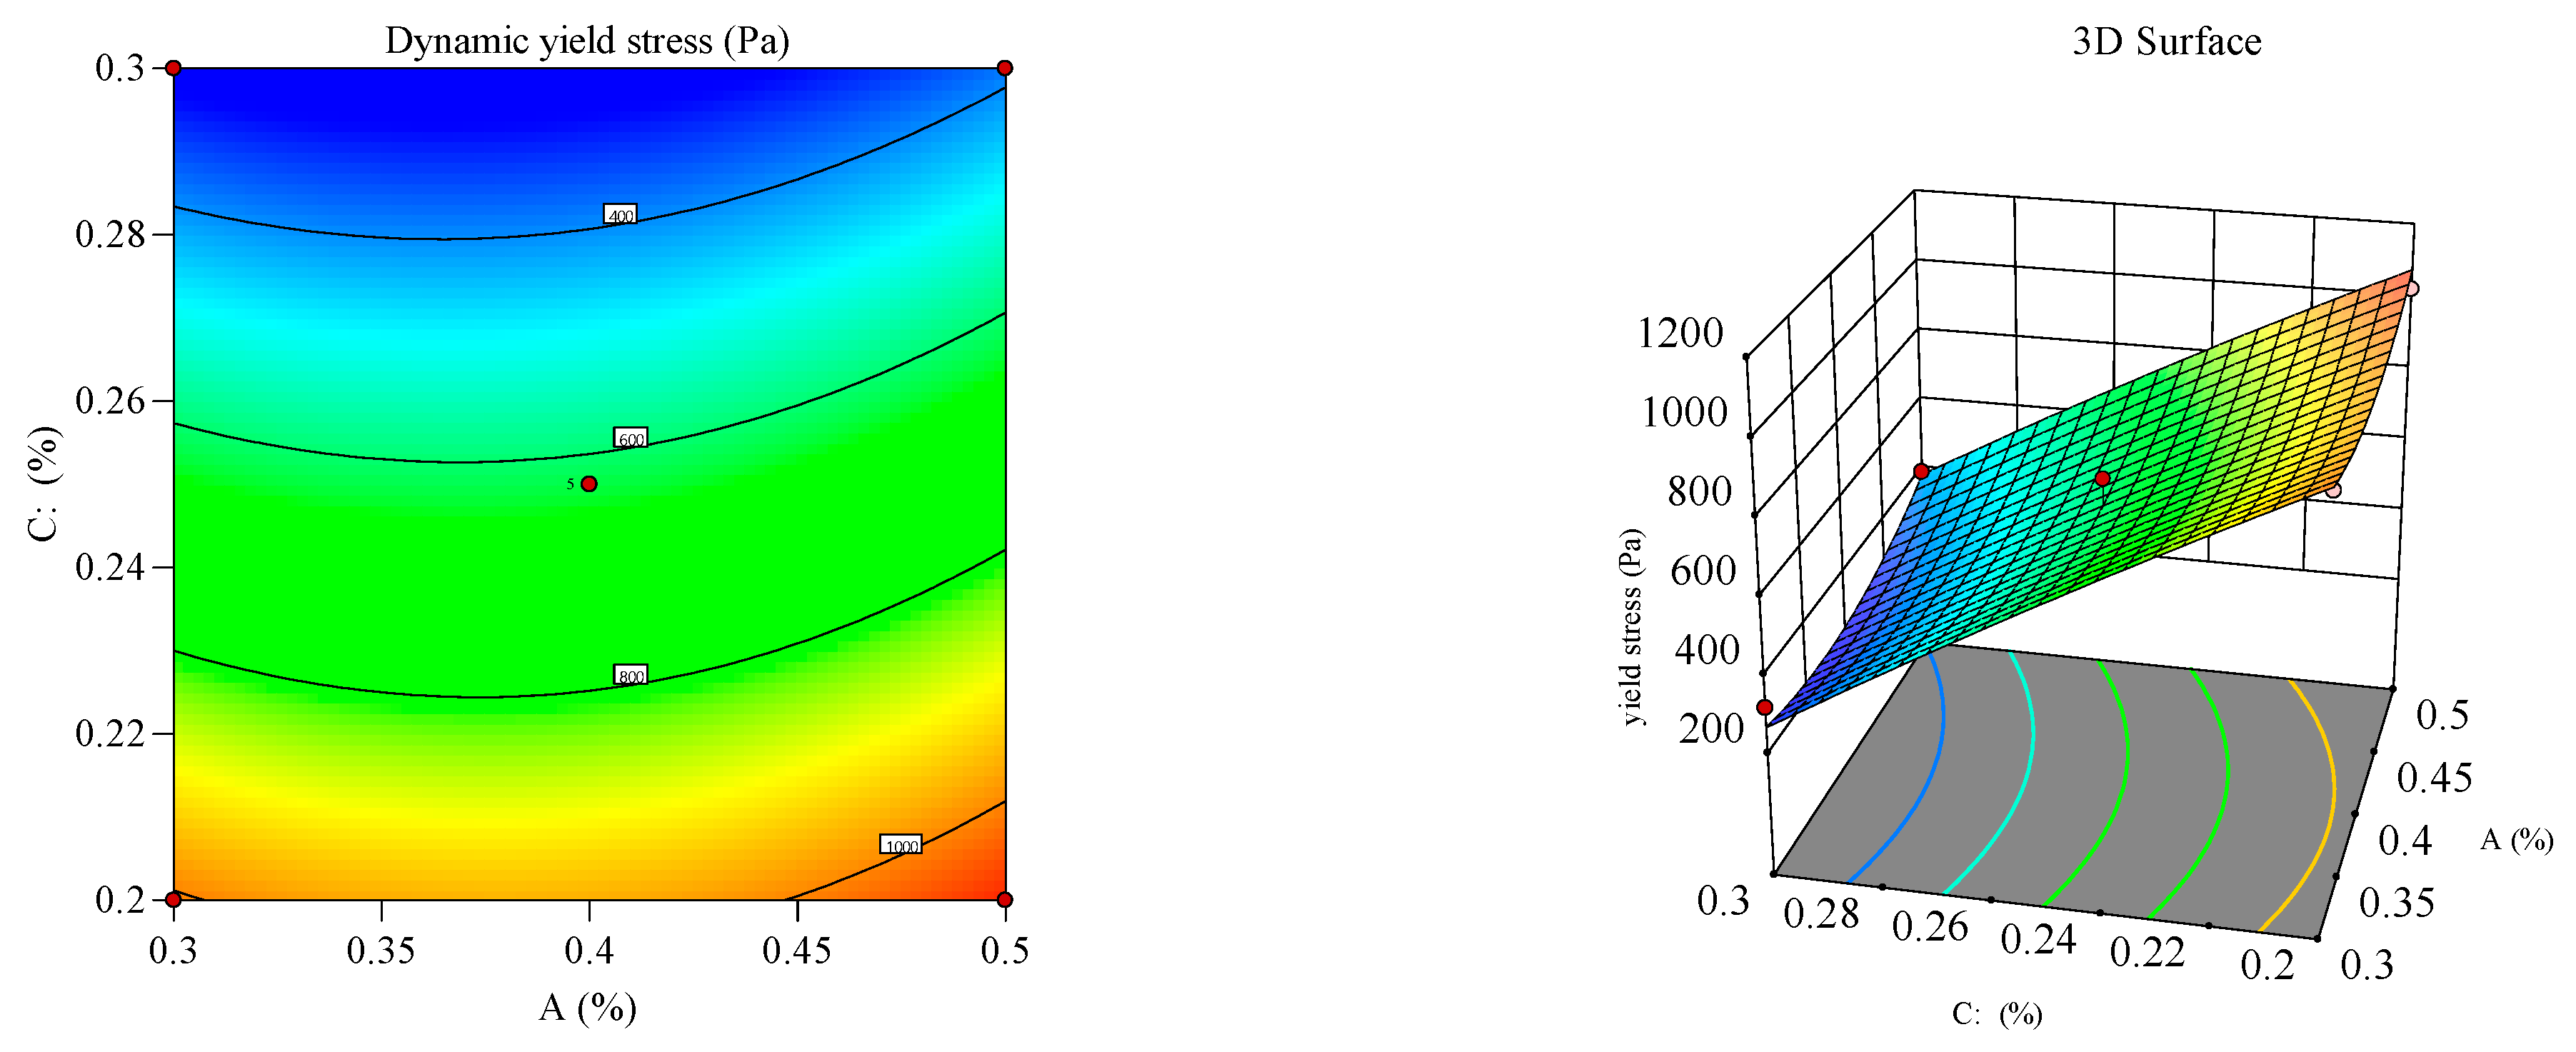
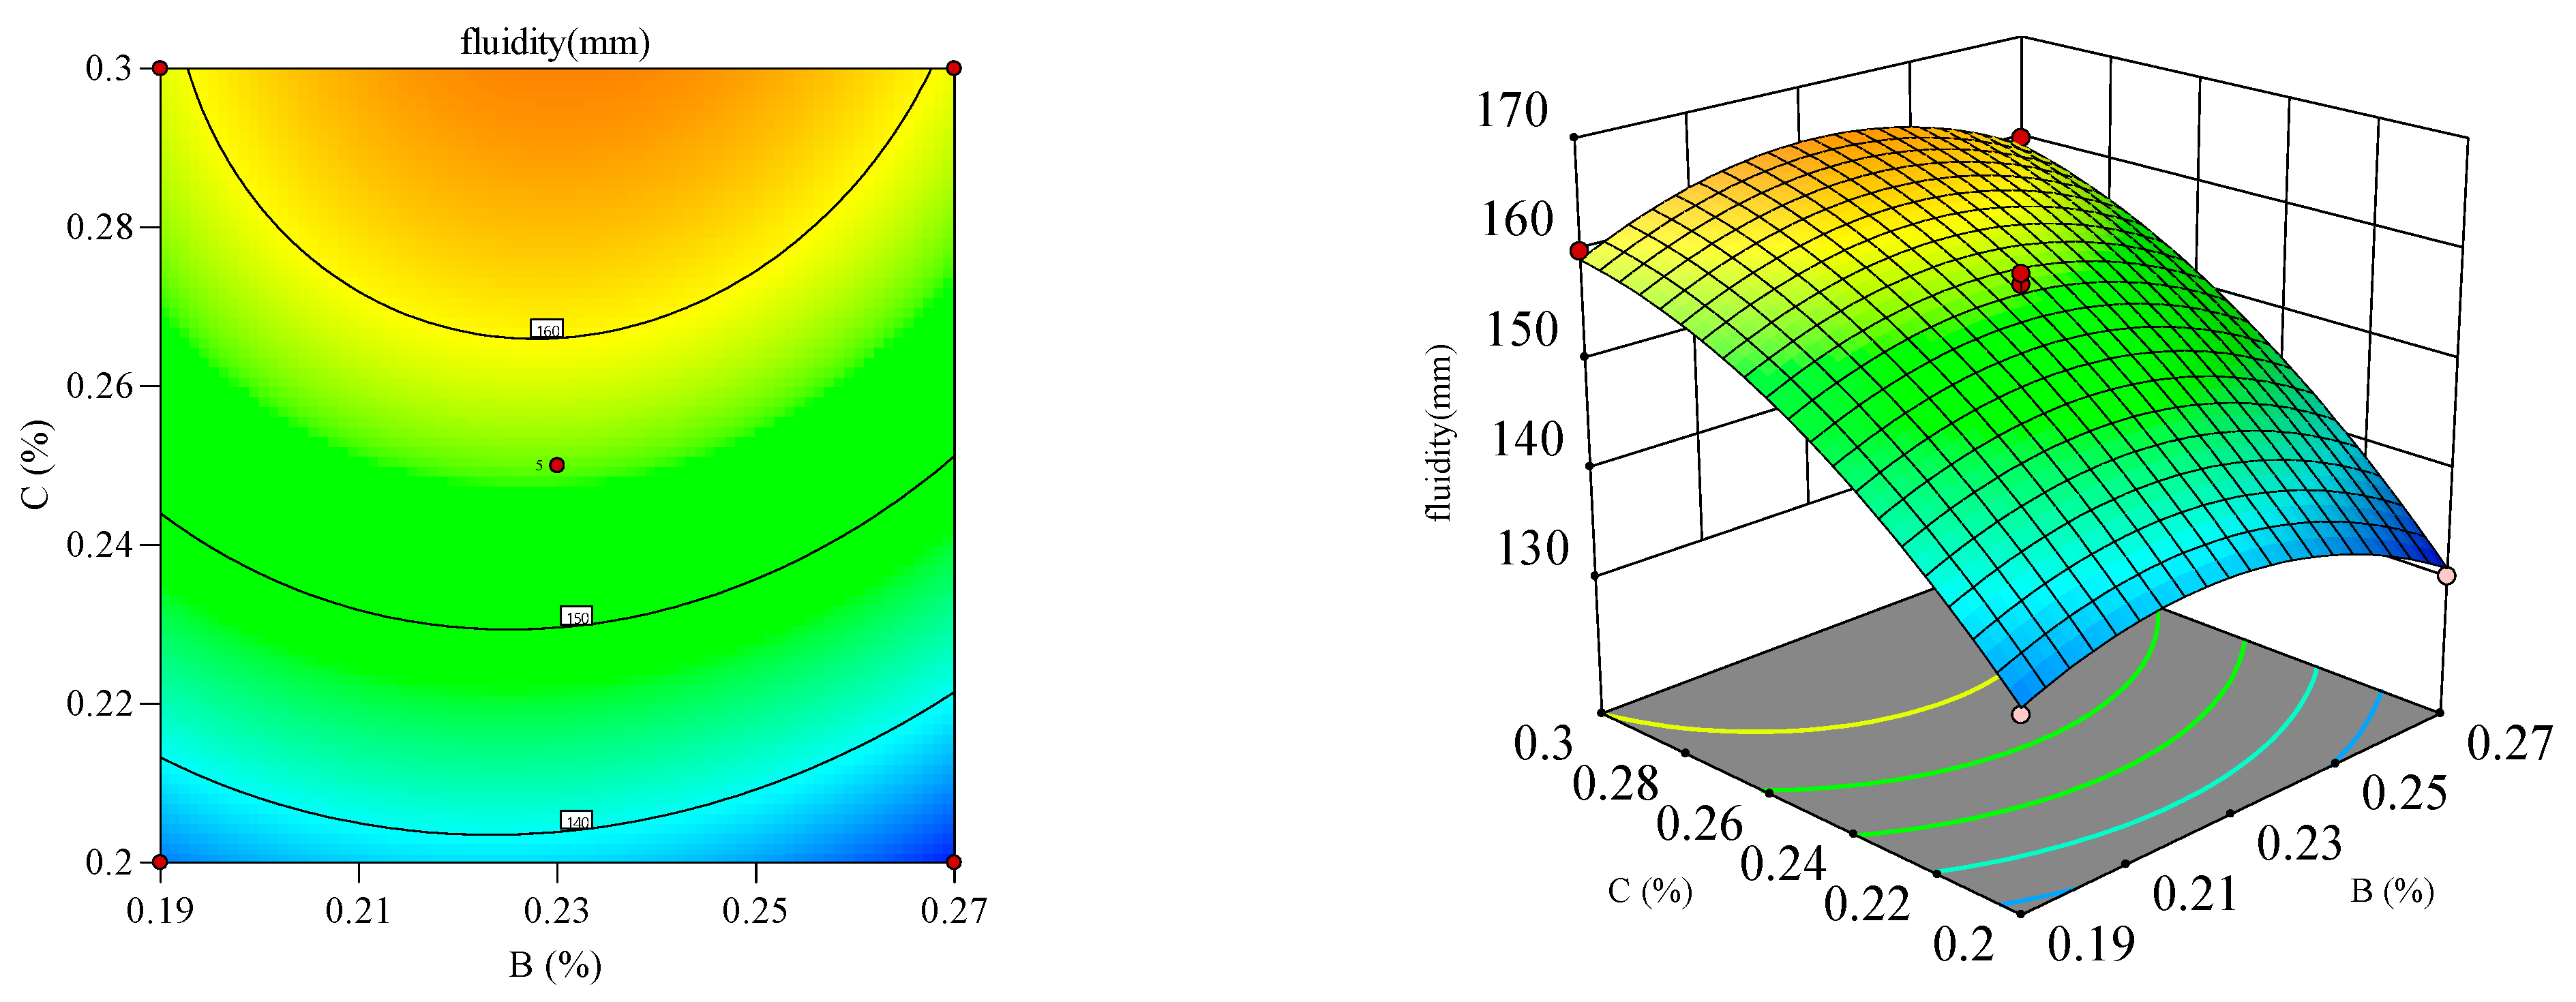
Response surface and contour plots (Figure 12, Figure 13, Figure 14, Figure 15, Figure 16 and Figure 17) were generated using Design Expert 13 to analyze the multi-factor interactions between A, B, and C on the flowability and yield stress, guided by ANOVA-validated regression models [36,37,38]. Subsequently, three-dimensional response surfaces and contour plots were derived by fixing one factor at its central value, thus isolating the interaction effects of the remaining two variables on flowability and yield stress. Inter-factor interactions were quantified using surface curvature and contour density, where steeper slopes and tighter contours denoted pronounced nonlinear dependencies. Elliptical contours, a hallmark of strong synergies, highlighted cooperative interactions between the variables, aligning with prior studies [39,40]. It is important to note that in the generated 3D response surface plot, colors only indicate the high/low or strong/weak response values.
Figure 12, Figure 13, Figure 14, Figure 15, Figure 16 and Figure 17 illustrate the interactive effects of A, B, and C on the mortar flowability and dynamic yield stress. The A–B interaction at fixed C levels (Figure 12 and Figure 13) revealed competing effects, notably, flowability declined and dynamic yield stress increased with increasing A near the central B dosages [41,42]. At moderate B doses, a higher A content decreased flowability but promoted the dynamic yield stress. This behavior arose from aluminum sulfate (A) reacting vigorously with the cement phases (C3S/C3A), accelerating hydration kinetics, particle coagulation, and early structuration at the expense of workability. At elevated A dosages, flowability showed a parabolic response to B, initially rising then declining, due to the saturation of hydroxyl-mediated hydration suppression [43]. In addition, B enhanced flow retention through hydrogen-bonded water entrainment and polymeric film formation, inhibiting moisture evaporation and sustaining workability [44].
Figure 14 and Figure 15 depict the mutual influence of A and C on flowability and dynamic yield stress at fixed B levels, where flowability escalated linearly with a higher C dosage, whereas dynamic yield stress declined proportionally. Mechanistically, the C polymeric side chains adsorbed onto cement particles, forming hydration films that stabilized the colloidal system through dual steric–electrostatic repulsion, thus suppressing particle agglomeration. The resultant dispersion enhanced flowability by reducing interparticle friction, but destabilized the cohesive forces, thereby lowering dynamic yield stress [45].
Figure 16 and Figure 17 depict the synergistic interaction between B and C on flowability at fixed A levels. A higher B dosage amplified flowability gains with increasing C, driven by complementary dispersion and water retention mechanisms. The steep response surface curvature (p < 0.05) confirmed significant B–C interactions, which was validated by ANOVA. Meanwhile, dominant B–C synergy emerged from the adsorption of B onto cement surfaces, which synergistically amplified superplasticizer dispersion.

3.3. Response Surface Results Optimization and Verification

Rheological parameters serve as key indicators for assessing the deformation behavior and workability of cementitious pastes, with direct implications for predicting flow dynamics in 3D-printed systems [46,47]. Well established thresholds [10,48,49] for 3DPC include (1) static yield stress (900–2189 Pa); (2) dynamic yield stress (200–800 Pa); (3) plastic viscosity (<25 Pa·s).
Extrudability, a prerequisite for 3D printing, demands uninterrupted mortar flow through the nozzle to prevent clogging. Extrudability relies on flowability, with inadequate flowability compromising pumpability and extrusion stability. Considering printer heterogeneity, the flowability range of printable 3DPC materials can be empirically established as 150–200 mm [13,50,51].
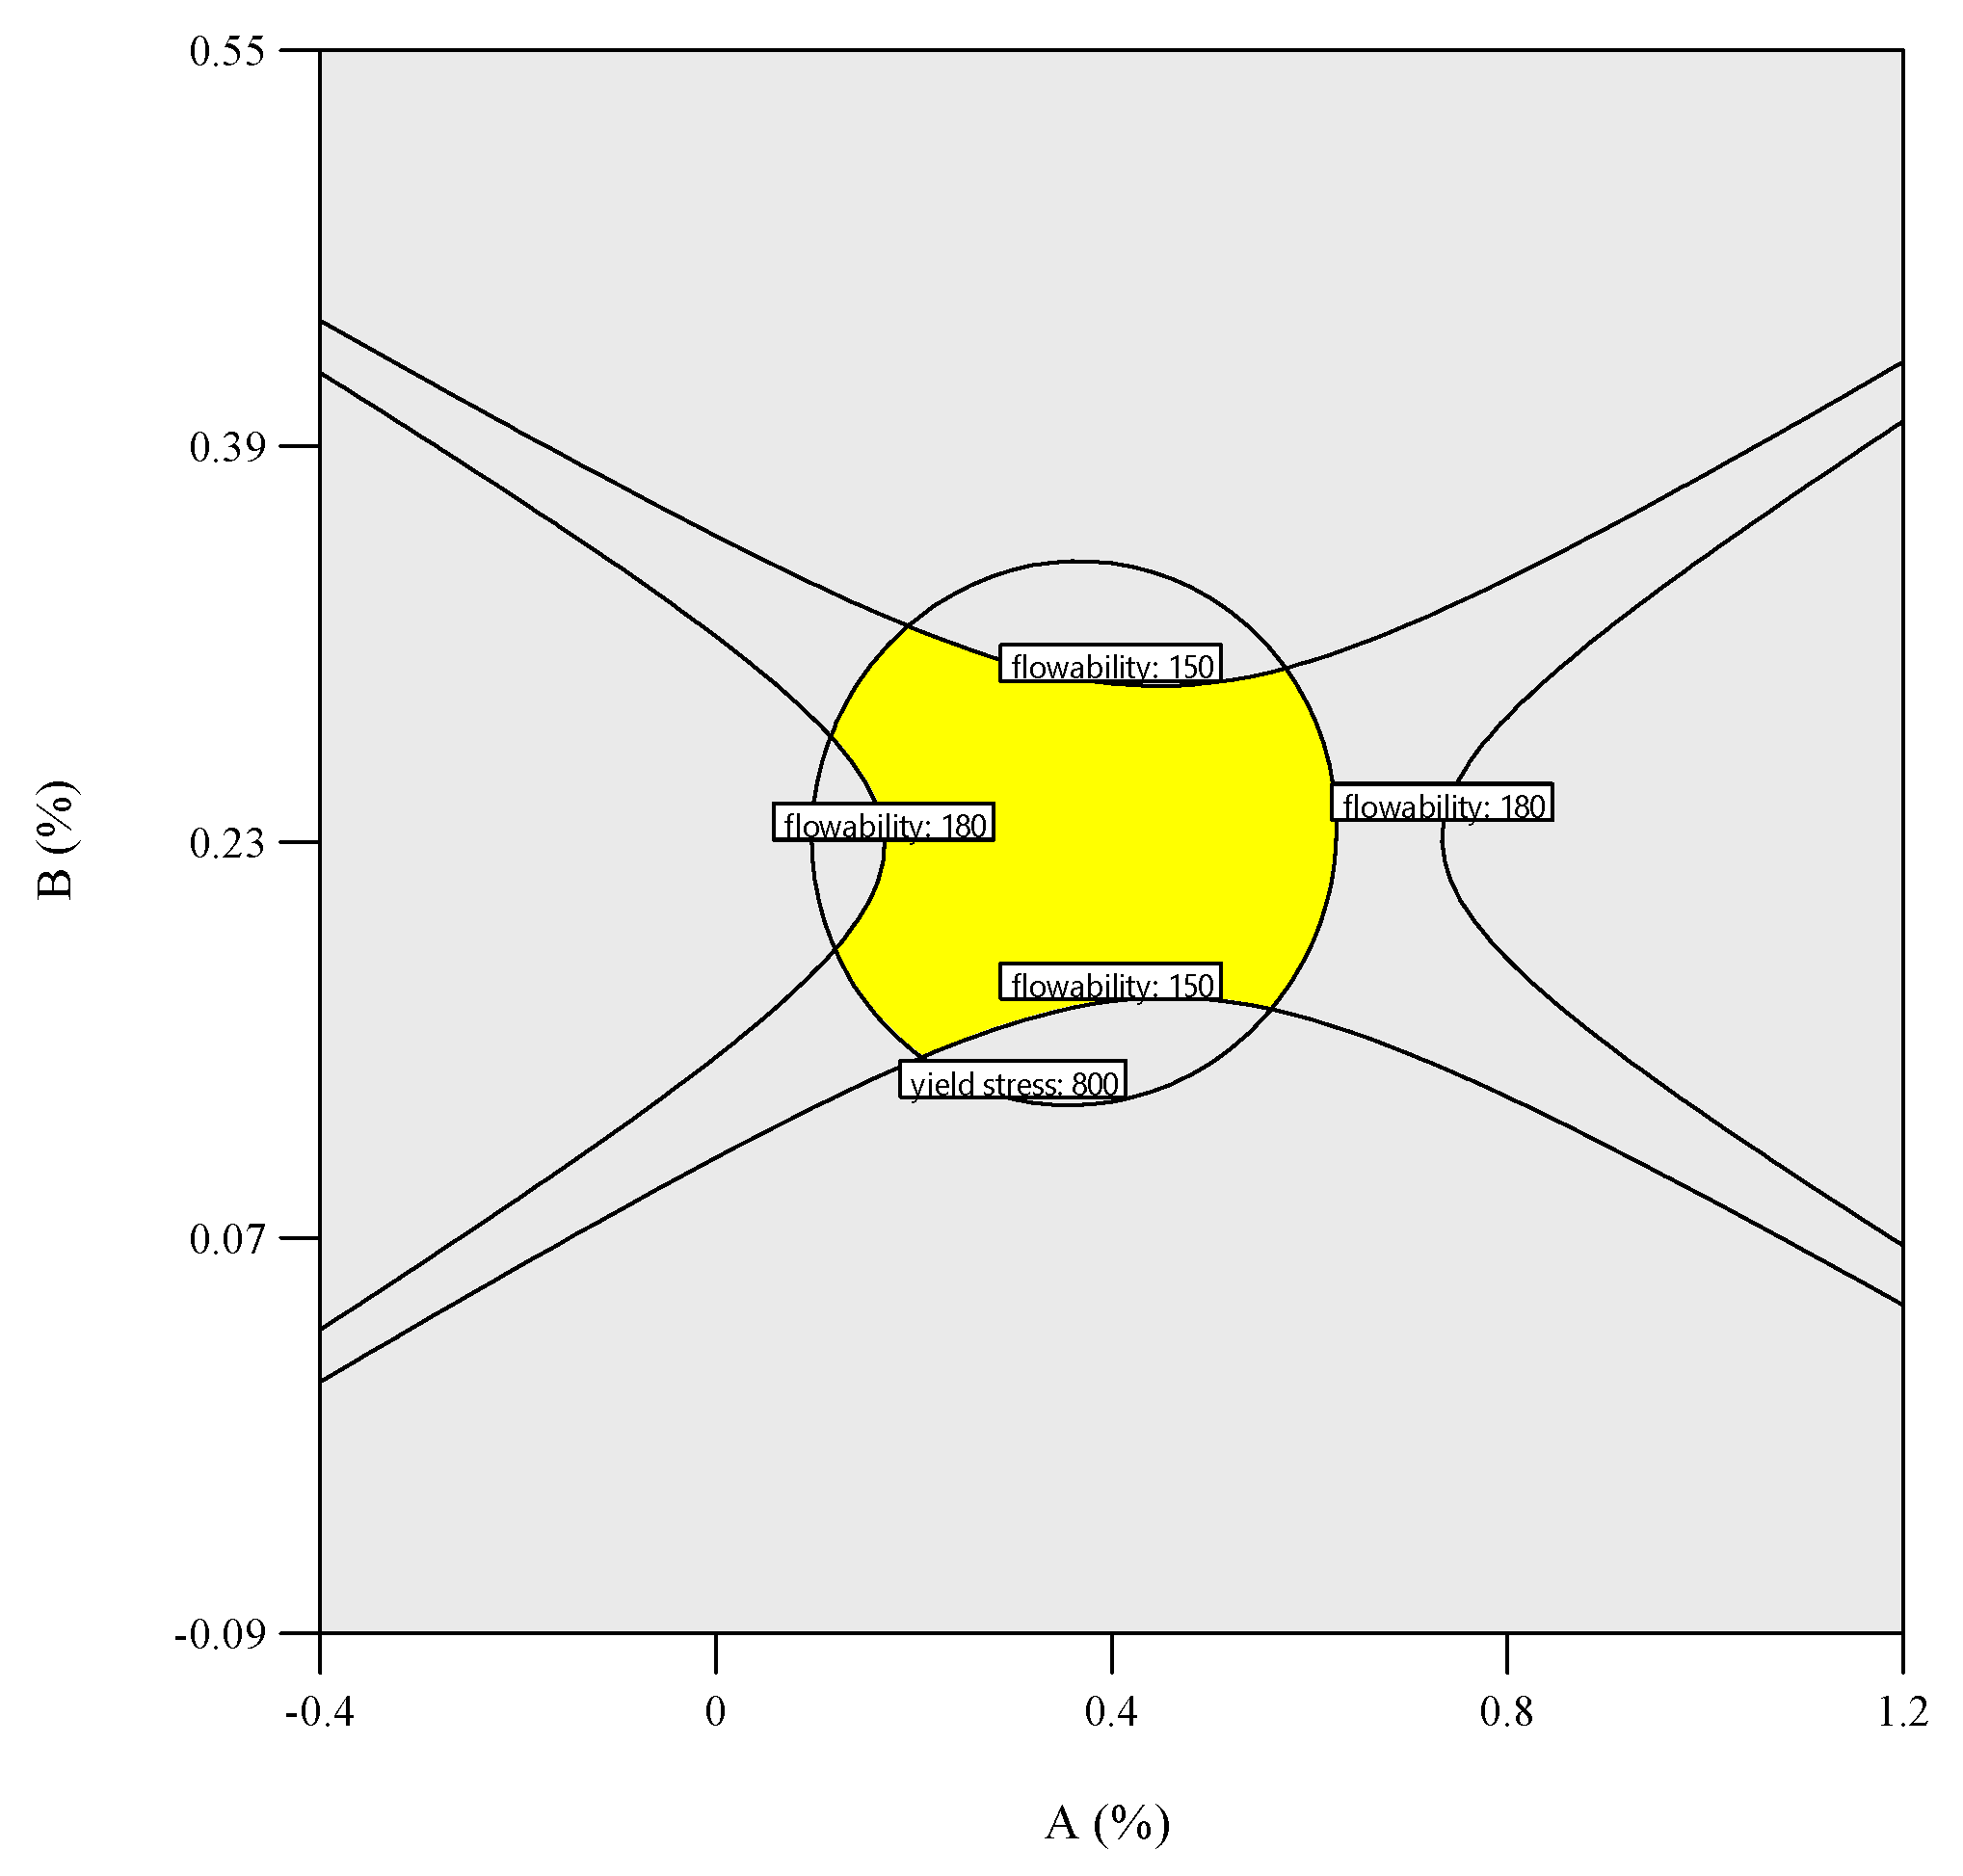
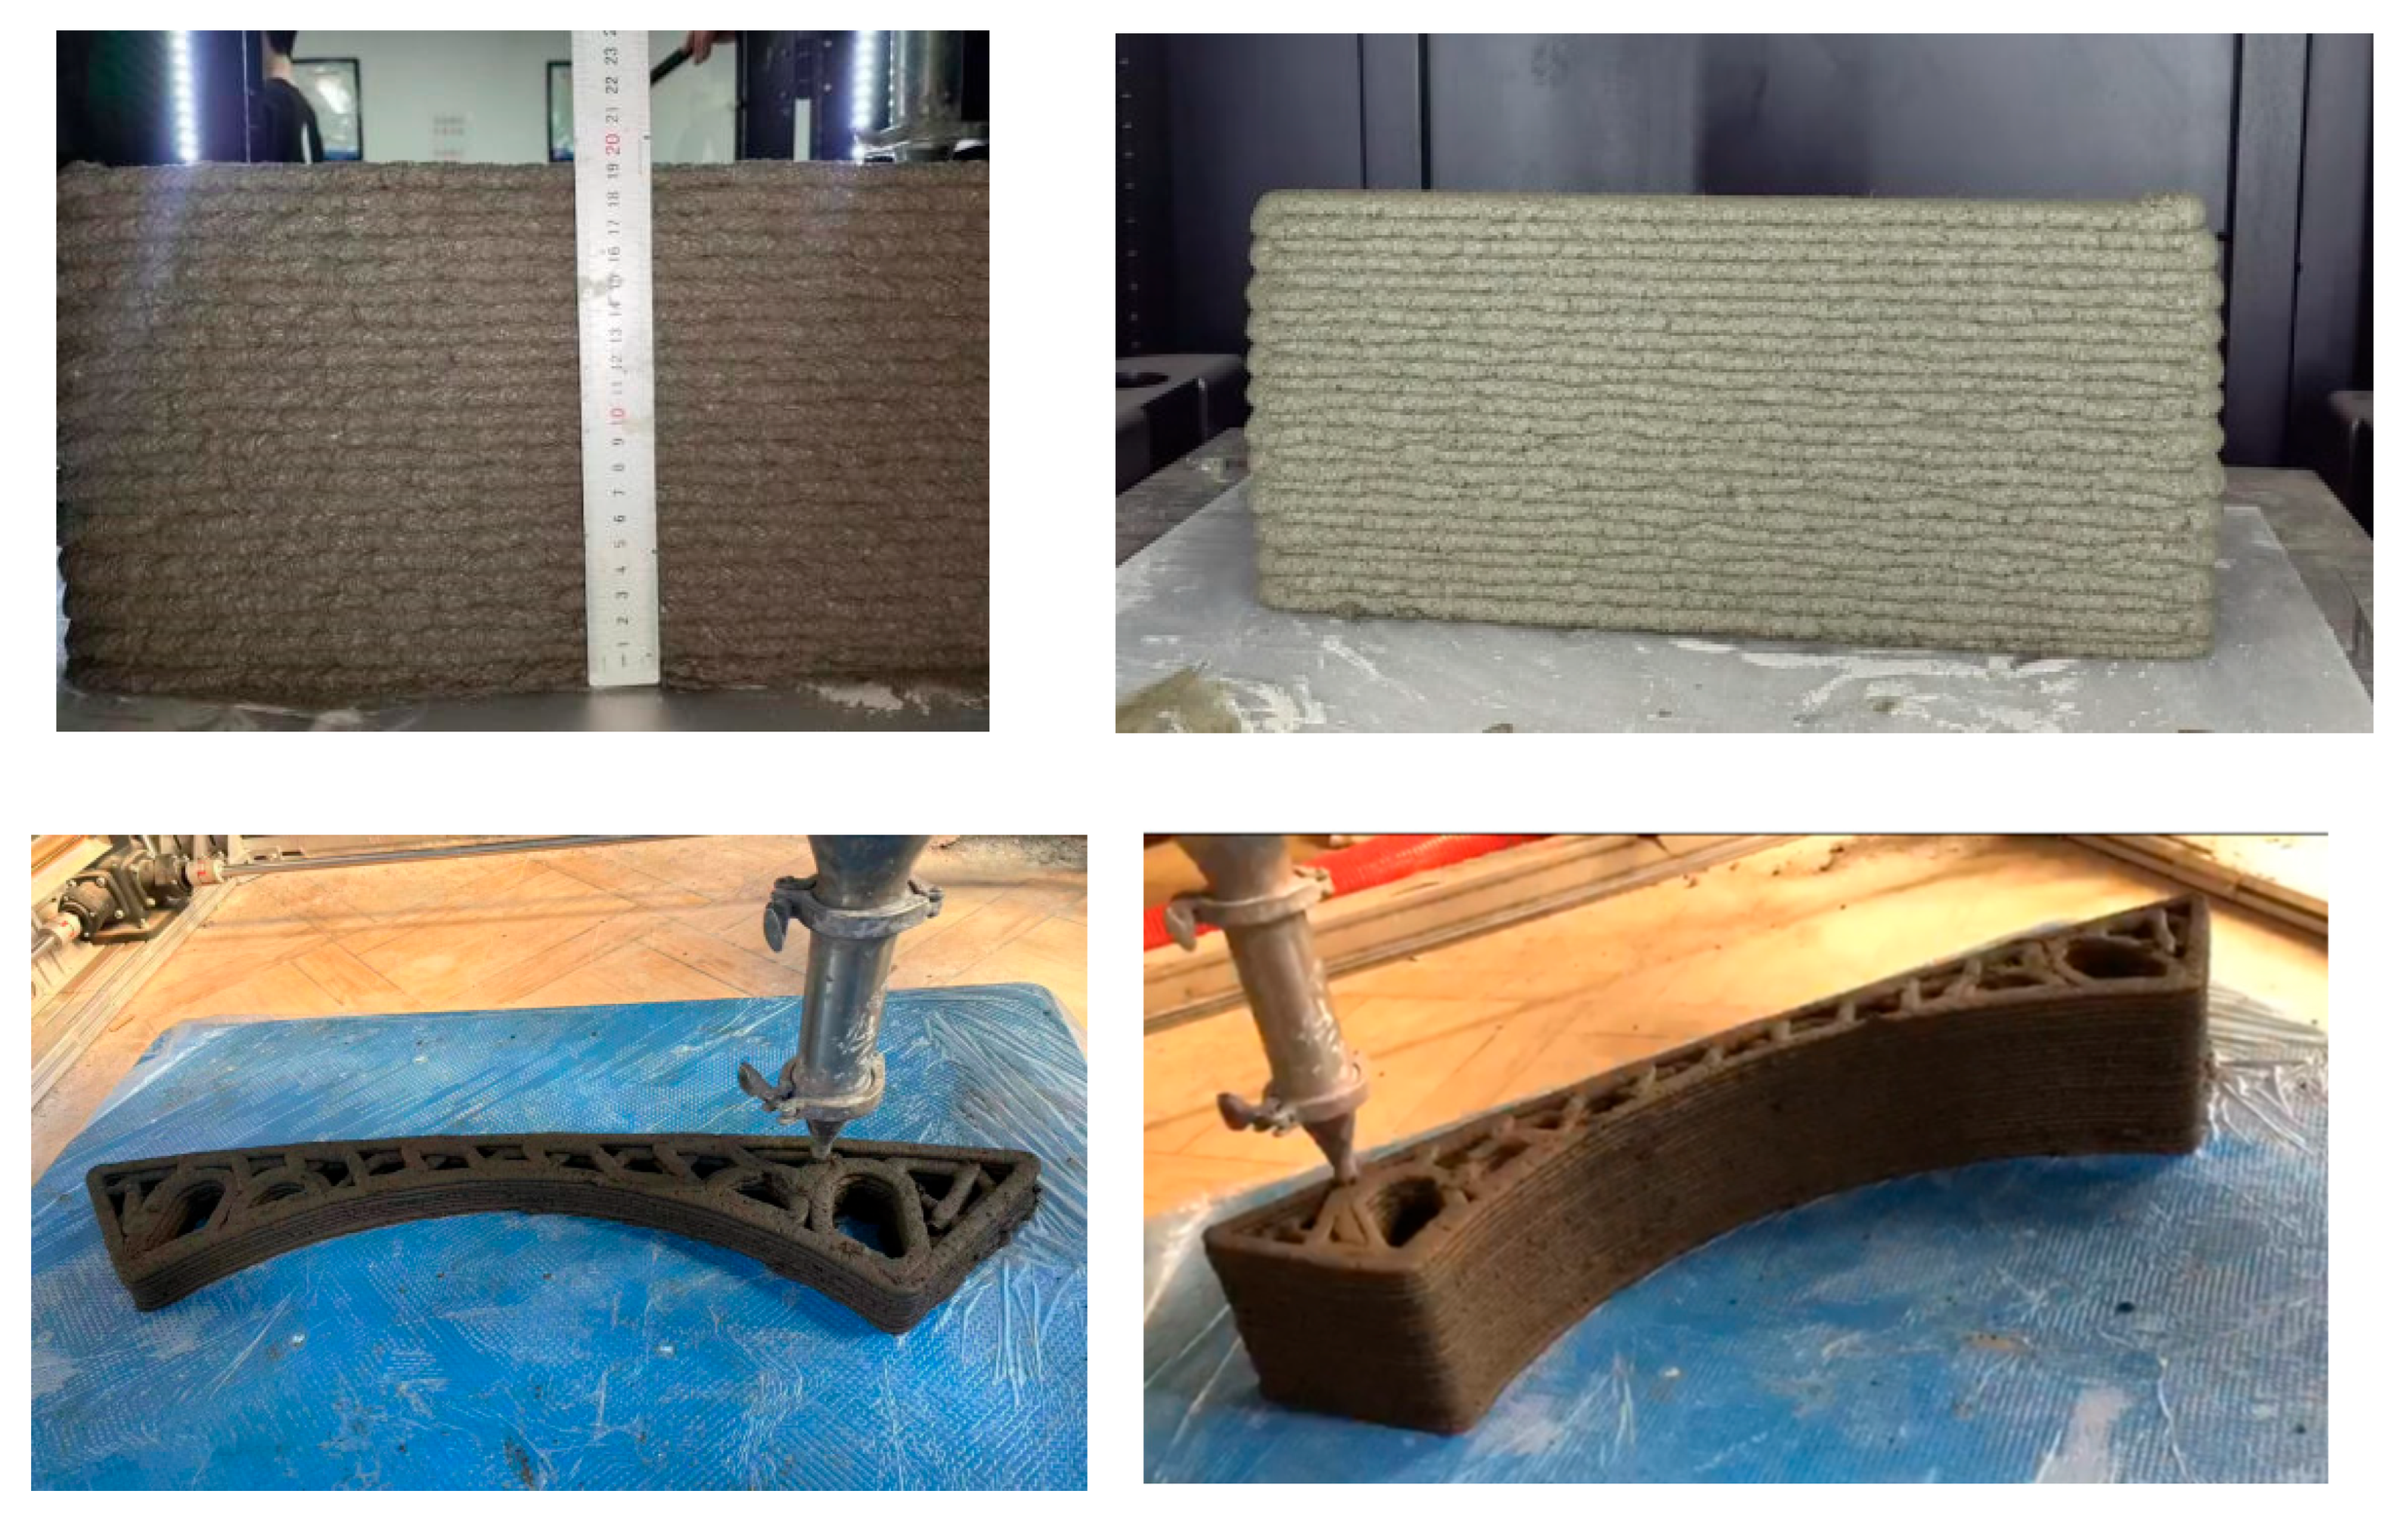
Flowability (150–180 mm) and dynamic yield stress (200–800 Pa), critical for extrudability and buildability, were designated as dual-response criteria for 3DPC mix optimization. An overlay plot (Figure 18) was used to integrate the flowability and yield stress models (Section 2.3.2) to identify feasible parameter combinations, using the multi-response optimization module in Design Expert 13. The intersecting feasible region (yellow) represented admixture dosages meeting both the flowability and yield stress thresholds. The desirability function (0 < D < 1) was used to rank feasible solutions, maximizing congruence with target responses. The optimal proportions (Table 7) predicted the flowability (153.8 mm) and yield stress (768.0 Pa) within 5% of the experimental data. Experimental validation (A: 0.32%, B: 0.24%, C: 0.23%) achieved 147.5 mm flowability (4.1% deviation) and 711 Pa yield stress (7.6% deviation), which aligned with the model predictions (<5% deviation). Buildability tests (Figure 19) confirmed stable interlayer adhesion and dimensional coherence under cumulative loading, satisfying the 3D printing requirements. Additional mechanical tests show that the material achieves a 3-day strength of up to 21.4MPa, a 7-day strength of up to 30.5 MPa, and a 28-day strength of up to 40.6 MPa, with a printable time of 40 min.

4. Conclusions

4.1. Main Conclusions

Building on a baseline mix design, a Box–Behnken central composite design was adopted in this study to conduct response surface experiments for optimizing mortar formulation. Subsequently, a quadratic regression model with excellent goodness-of-fit was established. Compared with traditional orthogonal experimental methods, the response surface methodology (RSM) offered a clearer visualization of factor interactions through 3D surface plots, aiding in identifying synergistic effects. The optimal mix ratio resulted in a mortar flowability and a dynamic yield stress which closely aligned with the RSM predictions, demonstrating the feasibility of the optimization framework. The following conclusions were drawn:
(1)
Model validity was established, where a statistical analysis of the quadratic polynomials for flowability and dynamic yield stress confirmed a high goodness-of-fit (R2 > 0.95) and robust predictive accuracy across responses.
(2)
Factor significance
(3)
Flowability followed the order of polycarboxylate superplasticizer (PCE) > accelerator > hydroxypropyl methylcellulose (HPMC) solution, with significant interaction between HPMC and PCE. Dynamic yield stress followed the order of PCE > accelerator > HPMC solution.
(4)
The optimal mix consisted of accelerator dosage = 0.32%, HPMC solution = 0.24%, and PCE dosage = 0.23%. The experimental results showed 147.5 mm flowability (4.1% deviation) and 711 Pa dynamic yield stress (7.6% deviation), aligning closely with the predictions.
The minimal deviation between the predicted and measured values demonstrated the efficacy of RSM in optimizing 3D printing material formulations. After applying the RSM model, building material production can be accurately proportioned in one stage, reducing waste and costs. Three-dimensional printing gains a stable and adjustable flow window and real-time equipment linkage, enabling efficient, reliable, and low-waste additive construction.

4.2. Suggestions and Prospects

This study investigates the optimization of the mixture proportions for 3D-printed cementitious materials using response surface methodology. Nevertheless, several challenges remain and further research is needed in the following areas:
(1)
This study only uses flowability and dynamic yield stress to judge printability, but it does not consider other important factors like thixotropy, how well layers stick together, or how long the material stays workable (open time). Focusing on just two factors may miss the other key points needed for successful 3D printing.
(2)
The printing tests used only one optimized mix and did not try different shapes or printing conditions. Testing more types of prints would make the results stronger and more widely useful.
(3)
All tests were performed in a laboratory environment using limited material quantities, and the RSM model was based on some simplifying assumptions. Therefore, the applicability of the findings in actual 3D printing or construction projects requires further validation through field-based continuous printing and long-term structural performance monitoring.

Author Contributions

C.W.: Conceptualization; Writing—review and editing; J.L. and Y.F.: Data curation; Writing—original draft; G.F.: Formal analysis; Y.Y.: Software; W.H.: Methodology; S.S.: Validation. All authors have read and agreed to the published version of the manuscript.

Funding

This study’s experiments and equipment were funded by the following sources (National Natural Science Foundation of China, grant number 52108247; Engineering Research Center of Structure Crack Control for Major Project, Fujian Province University), and the article processing charge (APC) did not receive external funding.

Institutional Review Board Statement

Not applicable.

Informed Consent Statement

Not applicable.

Data Availability Statement

The original contributions presented in this study are included in the article. Further inquiries can be directed to the corresponding author.

Acknowledgments

The authors extend their heartfelt thanks for the generous financial support they have received. This includes funding from the National Natural Science Foundation of China, identified by the grant number 52108247. Additionally, they are grateful for the support from Engineering Research Center of Structure Crack Control for Major Project, Fujian Province University.

Conflicts of Interest

Authors Chenfei Wang and Yunhui Fang were employed by the company Admixture Research Institute, KZJ New Materials Group Co., Ltd. Author Chenfei Wang was employed by the company Xiamen Chengzhi New Materials Technology Co., Ltd. The remaining authors declare that the research was conducted in the absence of any commercial or financial relationships that could be construed as a potential conflict of interes.

References

  1. Khan, M. Mix suitable for concrete 3D printing: A review. Mater. Today Proc. 2020, 32, 831–837. [Google Scholar] [CrossRef]
  2. Buswell, R.A.; De Silva, W.R.L.; Jones, S.Z.; Dirrenberger, J. 3D printing using concrete extrusion: A roadmap for research. Cem. Concr. Res. 2018, 112, 37–49. [Google Scholar] [CrossRef]
  3. Nan, B.; Qiao, Y.; Leng, J.; Bai, Y. Advancing Structural Reinforcement in 3D-Printed Concrete: Current Methods, Challenges, and Innovations. Materials 2025, 18, 252. [Google Scholar] [CrossRef]
  4. Wahlström, M.; Laineyliijoki, J.; Helena, J.; Kaartinen, T.; Erlandsson, M.; Anna, P.C.; Wik, O.; Suer, P.; Oberender, A.; Hjelmar, O. Environmentally Sustainable Construction Products and Mate-Rials—Assessment of Release; Nordic Innovation: Oslo, Norway, 2014. [Google Scholar]
  5. Panda, B.; Paul, S.C.; Tan, M.J. Anisotropic mechanical performance of 3D printed fiber reinforced sustainable construction material. Mater. Lett. 2017, 209, 146–149. [Google Scholar] [CrossRef]
  6. Chen, M.; Li, L.; Zheng, Y.; Zhao, P.; Lu, L.; Cheng, X. Rheological and mechanical properties of admixtures modified 3D printing sulphoaluminate cementitious materials. Constr. Build. Mater. 2018, 189, 601–611. (In Chinese) [Google Scholar] [CrossRef]
  7. Liu, Z.; Li, M.; Weng, Y.; Wong, T.N.; Tan, M.J. Mixture Design Approach to optimize the rheological properties of the material used in 3D cementitious material printing. Constr. Build. Mater. 2019, 198, 245–255. [Google Scholar] [CrossRef]
  8. Chen, M.; Liu, B.; Li, L.; Cao, L.; Huang, Y.; Wang, S.; Zhao, P.; Lu, L.; Cheng, X. Rheological parameters, thixotropy and creep of 3D-printed calcium sulfoaluminate cement composites modified by bentonite. Compos. Part B Eng. 2020, 186, 107821. [Google Scholar] [CrossRef]
  9. Chen, M.; Li, L.; Wang, J.; Huang, Y.; Wang, S.; Zhao, P.; Lu, L.; Cheng, X. Rheological parameters and building time of 3D printing sulphoaluminate cement paste modified by retarder and diatomite. Constr. Build. Mater. 2020, 234, 117391.1–117391.13. [Google Scholar] [CrossRef]
  10. Kruger, J.; Zeranka, S.; van Zijl, G. 3D concrete printing: A lower bound analytical model for buildability performance quantification. Autom. Constr. 2019, 106, 102904.1–102904.14. [Google Scholar] [CrossRef]
  11. Kruger, J.; Zeranka, S.; van Zijl, G. An ab initio approach for thixotropy characterisation of (nanoparticle-infused) 3D printable concrete. Constr. Build. Mater. 2019, 224, 372–386. [Google Scholar] [CrossRef]
  12. Zhu, Y.M.; Zhang, Y.; Jiang, Z.W. Effect of hydroxypropyl methylcellulose on performance of 3D-printed mortar. J. Build. Mater. 2021, 24, 1123–1130. [Google Scholar]
  13. Zhang, C.; Hou, Z.; Chen, C.; Zhang, Y.; Mechtcherine, V.; Sun, Z. Design of 3D printable concrete based on the relationship between flowability of cement paste and optimum aggregate content. Cem. Concr. Compos. 2019, 104, 103406. [Google Scholar] [CrossRef]
  14. Box, G.; Wilson, K. On the experimental attainment of optimum conditions. J. R. Stat. Soc. 1951, 13, 1–45. [Google Scholar] [CrossRef]
  15. Mason, R.L.; Gunst, R.F.; Hess, J.L. Statistical Design and Analysis of Experiments (with Applications to Engineering and Science); Wiley: New York, NY, USA, 1989. [Google Scholar] [CrossRef]
  16. Wang, Z.; Wu, J.; Su, L.; Gao, Z.; Yin, C.; Ye, Z. Optimization of Ultra-High Performance Concrete Based on Response Surface Methodology and NSGA-II. Materials 2024, 17, 4885. [Google Scholar] [CrossRef]
  17. Zhang, Q. Mix design and performance prediction of EPS lightweight structural concrete based on orthogonal experimentation. Sci. Rep. 2025, 15, 21420. [Google Scholar] [CrossRef]
  18. Mohamed, O.; Zuaiter, H. Fresh Properties, Strength, and Durability of Fiber-Reinforced Geopolymer and Conventional Concrete: A Review. Polymers 2024, 16, 141. [Google Scholar] [CrossRef]
  19. Li, N.; Xue, C.; Chen, S.; Aiyiti, W.; Khan, S.B.; Liang, J.; Zhou, J.; Lu, B. 3D Printing of Flexible Mechanical Metamaterials: Synergistic Design of Process and Geometric Parameters. Polymers 2023, 15, 4523. [Google Scholar] [CrossRef] [PubMed]
  20. GB/T 2419-2005; Test Method for Fluidity of Cement Mortar. China Standards Press: Beijing, China, 2005.
  21. Lim, S.; Buswell, R.; Le, T.; Austin, S.; Gibb, A.; Thorpe, T. Developments in construction-scale additive manufacturing processes. Autom. Constr. 2012, 21, 262–268. [Google Scholar] [CrossRef]
  22. Roussel, N. Rheological requirements for printable concretes. Cem. Concr. Res. 2018, 112, 76–85. [Google Scholar] [CrossRef]
  23. Marchon, D.; Kawashima, S.; Bessaies-Bey, H.; Mantellato, S.; Ng, S. Hydration and rheology control of concrete for digital fabrication: Potential admixtures and cement chemistry. Cem. Concr. Res. 2018, 112, 96–110. [Google Scholar] [CrossRef]
  24. Iwundu, M.P.; Cosmos, J. The Efficiency of Seven-Variable Box-Behnken Experimental Design with Varying Center Runs on Full and Reduced Model Types. J. Math. Stat. 2022, 18, 196–207. [Google Scholar] [CrossRef]
  25. Panda, B.; Tan, M.J. Experimental study on mix proportion and fresh properties of fly ash based geopolymer for 3D concrete printing. Ceram. Int. 2018, 44, 10258–10265. [Google Scholar] [CrossRef]
  26. Deng, S.; Liu, L.; Yang, P.; Zhang, C.; Lv, Y.; Xie, L. Experimental Study on Early Strength and Hydration Heat of Spodumene Tailings Cemented Backfill Materials. Materials 2022, 15, 8846. [Google Scholar] [CrossRef]
  27. Ke, J.; Shui, Z.; Gao, X.; Qi, X.; Zheng, Z.; Zhang, S. Effect of Vibration Procedure on Particle Distribution of Cement Paste. Materials 2023, 16, 2600. [Google Scholar] [CrossRef]
  28. Abedi-Firoozjah, R.; Yousefi, S.; Heydari, M.; Seyedfatehi, F.; Jafarzadeh, S.; Mohammadi, R.; Rouhi, M.; Garavand, F. Application of Red Cabbage Anthocyanins as pH-Sensitive Pigments in Smart Food Packaging and Sensors. Polymers 2022, 14, 1629. [Google Scholar] [CrossRef]
  29. Feng, K.; Xu, Z.; Zhang, W.; Ma, K.; Shen, J.; Hu, M. Rheological Properties and Early-Age Microstructure of Cement Pastes with Limestone Powder, Redispersible Polymer Powder and Cellulose Ether. Materials 2022, 15, 3159. [Google Scholar] [CrossRef]
  30. Dressler, I.; Freund, N.; Lowke, D. The Effect of Accelerator Dosage on Fresh Concrete Properties and on Interlayer Strength in Shotcrete 3D Printing. Materials 2020, 13, 374. [Google Scholar] [CrossRef]
  31. Xia, Y.; Shi, W.; Xiang, S.; Yang, X.; Yuan, M.; Zhou, H.; Yu, H.; Zheng, T.; Zhang, J.; Jiang, Z.; et al. Synthesis and Modification of Polycarboxylate Superplasticizers—A Review. Materials 2024, 17, 1092. [Google Scholar] [CrossRef] [PubMed]
  32. Fang, Y.; Chen, Z.; Yan, D.; Ke, Y.; Ma, X.; Lai, J.; Liu, Y.; Li, G.; Zhang, X.; Lin, Z.; et al. Study on the Effect of Main Chain Molecular Structure on Adsorption, Dispersion, and Hydration of Polycarboxylate Superplasticizers. Materials 2023, 16, 4823. [Google Scholar] [CrossRef] [PubMed]
  33. Zhang, J.; Ma, Y.; Liu, J.; Chen, X.; Ren, F.; Chen, W.; Cui, H. Improvement of shrinkage resistance and mechanical property of cement-fly ash-slag ternary blends by shrinkage-reducing polycarboxylate superplasticizer. J. Clean. Prod. 2024, 447, 141493.1–141493.14. [Google Scholar] [CrossRef]
  34. Gong, Y.; Bai, J.; Wang, Y.; Liu, R.; Tian, J. Rheological properties of seawater-mixed seashell powder calcined slag cement slurries: Effect of polycarboxylate superplasticizer and temperature. Mater. Lett. 2024, 367, 1.1–1.4. [Google Scholar] [CrossRef]
  35. Aydın, Ö.K.; Koca, N.; Koç, M.; Kaymak-Ertekin, F. Process Optimization and Storage Evaluation of Explosion Puffing Dried Reduced-Fat White Cheese Snacks. J. Food Sci. 2025, 90, e70353. [Google Scholar] [CrossRef] [PubMed]
  36. Xiang, Q.; Wang, J.; Tao, K.; Huang, H.; Zhao, Y.; Jia, J.; Tan, H.; Chang, H. Optimization of Phenolic-Enriched Extracts from Olive Leaves via Ball Milling-Assisted Extraction Using Response Surface Methodology. Molecules 2024, 29, 3658. [Google Scholar] [CrossRef]
  37. Chen, L.; Zhang, Z.; Gong, W.; Liang, Z. Quantifying the effects of fuel compositions on GDI-derived particle emissions using the optimal mixture design of experiments. Fuel 2015, 154, 252–260. [Google Scholar] [CrossRef]
  38. Parhi, S.K.; Patro, S.K. Application of R-curve, ANCOVA, and RSM techniques on fracture toughness enhancement in PET fiber-reinforced concrete. Constr. Build. Mater. 2023, 411, 134644.1–134644.14. [Google Scholar] [CrossRef]
  39. Zerig, T.; Belachia, M.; Aidoud, A.; Meftah, N.; Djedid, T.; Abbas, M. Statistical analysis using the RSM approach of the physical behavior of green polymerized eco-mortar. J. Clean. Prod. 2024, 450, 141858.1–141858.22. [Google Scholar] [CrossRef]
  40. Zhang, R.; Liu, T.; Zhang, Y.; Cai, Z.; Yuan, Y. Preparation of spent fluid catalytic cracking catalyst-metakaolin based geopolymer and its process optimization through response surface method. Constr. Build. Mater. 2020, 264, 120727. [Google Scholar] [CrossRef]
  41. Omranian, S.R.; Hamzah, M.O.; Yee, T.S.; Hasan, M.R.M. Effects of short-term ageing scenarios on asphalt mixtures’ fracture properties using imaging technique and response surface method. Int. J. Pavement Eng. 2018, 21, 1374–1392. [Google Scholar] [CrossRef]
  42. Sun, G.; Yang, X.; Zheng, H.; Wang, J.; Yang, H.; Zhang, F. Preparation and accelerating mechanism of aluminum sulfate-based alkali-free liquid flash setting admixture for shotcrete. Constr. Build. Mater. 2024, 422, 135799. [Google Scholar] [CrossRef]
  43. Sun, G.; Yang, X.; Wang, F.; Wang, J.; Liu, Z. Development of a High Early Strength Non-fluorine and Non-alkaline Flash Setting Admixture and Flash Mechanism. J. Wuhan Univ. Technol. Sci. Ed. 2024, 39, 1518–1527. [Google Scholar] [CrossRef]
  44. Chen, C.; Yan, D.; Li, X.; Liu, M.; Cui, C.; Li, L. Field-tested innovation: Sustainable utilization of secondary alumina dross for flash setting admixtures production. J. Environ. Manag. 2024, 358, 120857. [Google Scholar] [CrossRef] [PubMed]
  45. Patural, L.; Marchal, P.; Govin, A.; Grosseau, P.; Ruot, B.; Devès, O. Cellulose ethers influence on water retention and consistency in cement-based mortars. Cem. Concr. Res. 2011, 41, 46–55. [Google Scholar] [CrossRef]
  46. Pourchez, J.; Peschard, A.; Grosseau, P.; Guyonnet, R.; Guilhot, B.; Vallée, F. HPMC and HEMC influence on cement hydration. Cem. Concr. Res. 2006, 36, 288–294. [Google Scholar] [CrossRef]
  47. Teng, L.; Wei, J.; Khayat, K.H.; Assaad, J.J. Effect of competitive adsorption between specialty admixtures and superplasticizer on structural build-up and hardened property of mortar phase of ultra-high-performance concrete. Cem. Concr. Compos. 2023, 141, 105130. [Google Scholar] [CrossRef]
  48. Jiao, D.; Shi, C.; Yuan, Q.; An, X.; Liu, Y.; Li, H. Effect of constituents on rheological properties of fresh concrete-A review. Cem. Concr. Compos. 2017, 83, 146–159. [Google Scholar] [CrossRef]
  49. Zhang, Y.; Jiang, Z.; Zhu, Y.; Zhang, J.; Ren, Q.; Huang, T. Effects of redispersible polymer powders on the structural build-up of 3D printing cement paste with and without hydroxypropyl methylcellulose. Constr. Build. Mater. 2021, 267, 120551.1–120551.17. [Google Scholar] [CrossRef]
  50. Zou, R.; Xia, Y.; Liu, S.; Hu, P.; Hou, W.; Hu, Q.; Shan, C. Isotropic and anisotropic elasticity and yielding of 3D printed material. Compos. Part B Eng. 2016, 99, 506–513. [Google Scholar] [CrossRef]
  51. Ma, G.; Li, Z.; Wang, L. Printable properties of cementitious material containing copper tailings for extrusion based 3D printing. Constr. Build. Mater. 2018, 162, 613–627. [Google Scholar] [CrossRef]
Figure 1. Cumulative particle size distribution curve of the cementitious material and standard sand.
Materials 18 03933 g001
Figure 2. ICAR Plus concrete rheometer.
Materials 18 03933 g002
Figure 3. Three-dimensional printing material preparation flow chart.
Materials 18 03933 g003
Figure 4. Model slice diagram.
Materials 18 03933 g004
Figure 5. Effect of accelerant on the rheological properties of 3DPC.
Materials 18 03933 g005
Figure 6. Effect of cellulose ether on rheological properties of 3DPC.
Materials 18 03933 g006
Figure 7. Effect of water-reducing agent on the rheological properties of 3DPC.
Materials 18 03933 g007
Figure 8. Relationship between the residuals and the run order for flowability (a) and the dynamic yield stress (b) tests.
Materials 18 03933 g008
Figure 9. Predicted and actual material properties: (a) flowability; (b) dynamic yield stress.
Materials 18 03933 g009
Figure 10. Influence of different components on flowability.
Materials 18 03933 g010
Figure 11. Effects of different components on the dynamic yield stress.
Materials 18 03933 g011
Figure 12. Effect of accelerant and HPMC on the flowability of the mortar.
Materials 18 03933 g012
Figure 13. Effect of accelerant and HPMC on the yield stress of the mortar.
Materials 18 03933 g013
Figure 14. Effect of accelerant and PCE on the flowability of the mortar.
Materials 18 03933 g014
Figure 15. Effect of accelerant and PCE on the yield stress of the mortar.
Materials 18 03933 g015
Figure 16. Effect of HPMC and PCE on the flowability of the mortar.
Materials 18 03933 g016
Figure 17. Effect of HPMC and PCE on the yield stress of the mortar.
Materials 18 03933 g017
Figure 18. Double response overlay plot of flowability and dynamic yield stress.
Materials 18 03933 g018
Figure 19. Performance validation plot for optimized mix ratio in 3D printing tests.
Materials 18 03933 g019
Table 1. Chemical components of the cement, silica powder, and mineral powder (% by mass).
CaOSiO2Al2O3Fe2O3MgOSO3K2ONa2OLoss
C64.0020.105.552.552.373.860.660.253.50
SF1.0594.910.780.450.560.570.660.500.52
GS37.9231.3813.779.821.090.071.520.330.23
Table 2. Main properties of the polypropylene fibers.
Length (mm)Diameter (mm)Young’s Modulus (GPa)Elastic Modulus (GPa)Tensile Strength (MPa)
PPF60.0213.23-5>480
Table 3. Design factor level (% by mass).
FactorLevel
−101
A0.30.40.5
B0.190.230.27
C0.20.250.3
Table 4. Response surface test design and results (% by mass).
No.A Accelerator (%)B HPMC (%)C PCE (%)Flowability (mm)Dynamic Yield Stress (Pa)
10.30.190.25155751.6
20.50.190.25152765.7
30.30.270.25153651.6
40.50.270.25150.5662.2
50.30.230.2147999.9
60.50.230.2135950.6
70.30.230.3170320.2
80.50.230.3162.5355
90.40.190.21341183.3
100.40.270.21301111.6
110.40.190.3160233.9
120.40.270.3160200
130.40.230.25157592.1
140.40.230.25155698.5
150.40.230.25156623.2
160.40.230.25158605.4
170.40.230.25155612.8
Table 5. Regression model analysis of variance (flowability).
SourceSum of SquaresdfMean SquareF-Valuep-Value
Model1754.279194.9238.86<0.0001significant
A78.12178.1215.570.0056
B7.0317.031.400.2751
C1417.7811417.78282.65<0.0001
AB0.062510.06250.01250.9143
AC5.0615.061.010.3485
BC4.0014.000.79740.0415
A217.27117.273.440.1059
B2132.041132.0426.320.0014
C289.09189.0917.760.0040
Residual35.1175.02
Lack of Fit28.3139.445.550.0656not significant
Pure Error6.8041.70
Cor Total1789.3816
R2 0.9804
R2Adj 0.9551
R2pred 0.7409
Table 6. Regression model analysis of variance (dynamic yield stress).
SourceSum of SquaresdfMean SquareF-Valuep-Value
Model1.100 × 10691.222 × 10539.90<0.0001Significant
A16,616.65116,616.655.420.0527
B8437.0018437.002.750.1410
C1.027 × 10611.027 × 106335.25<0.0001
AB28.09128.090.00920.9264
AC552.251552.250.18030.6839
BC1823.2911823.290.59520.4657
A223,041.27123,041.277.520.0288
B219,944.76119,944.766.510.0380
C21184.8411184.840.38680.5537
Residual21,444.4773063.50
Lack of Fit14,433.3734811.122.740.1770Not significant
Pure Error7011.1041752.77
Cor Total1.122 × 10616
R2 0.9596
R2Adj 0.9076
R2pred 0.8522
Table 7. Response surface optimization optimal mix ratio.
AcceleratorHPMCPCEFlowability (mm)Dynamic Yield Stress (Pa)Desirability
0.321%0.241%0.231%153.763 768.031 1
Disclaimer/Publisher’s Note: The statements, opinions and data contained in all publications are solely those of the individual author(s) and contributor(s) and not of MDPI and/or the editor(s). MDPI and/or the editor(s) disclaim responsibility for any injury to people or property resulting from any ideas, methods, instructions or products referred to in the content.