Design of Technological Parameters for Vibrocompression of Gypsum Concrete
Abstract
1. Introduction
- Production and use of gypsum binders with relatively low water demand, such as high-strength gypsum (α-hemihydrate) [8];
- Optimal selection of binder grain size distribution to ensure tight packing and reduced intergranular voids, thereby lowering water demand [8];
- Introduction of admixtures such as plasticizers and superplasticizers [9].
- Pressing stiff mixtures made of building or high-strength gypsum at W/G = 0.15–0.20; the molding mixture may be prepared by moistening the binder, granulation followed by pressing, or by incorporating porous water-saturated fillers, microcapsules with liquid phase, mineral or organic fibers, etc. [12];
- Forming from plastic and castable mixtures (W/G ≥ 0.5) followed by removal of part of the liquid phase under pressure in a mold, a method first proposed in 1977 [13];
- Pressing of ground gypsum stone followed by hydrothermal treatment, either in an autoclave or directly in the mold [14].
2. Materials
3. Methods
3.1. Experimental Design
3.2. The Influence of Mix Moisture, Aggregate Consumption, and Vibrocompaction Parameters
− 31 X1X3 − 30 X1X4 + 9 X2X3 − 15 X2X4 − 9 X3X4
− 2.42 X42 − 0.83 X1X2 + 0.59 X1X3 + 0.66 X1X4 − 0.16 X2X3 − 0.08 X2X4 + 0.08 X3X4
3.3. Granulometric Composition at Constant Compaction Parameters and Changes in Mix Moisture
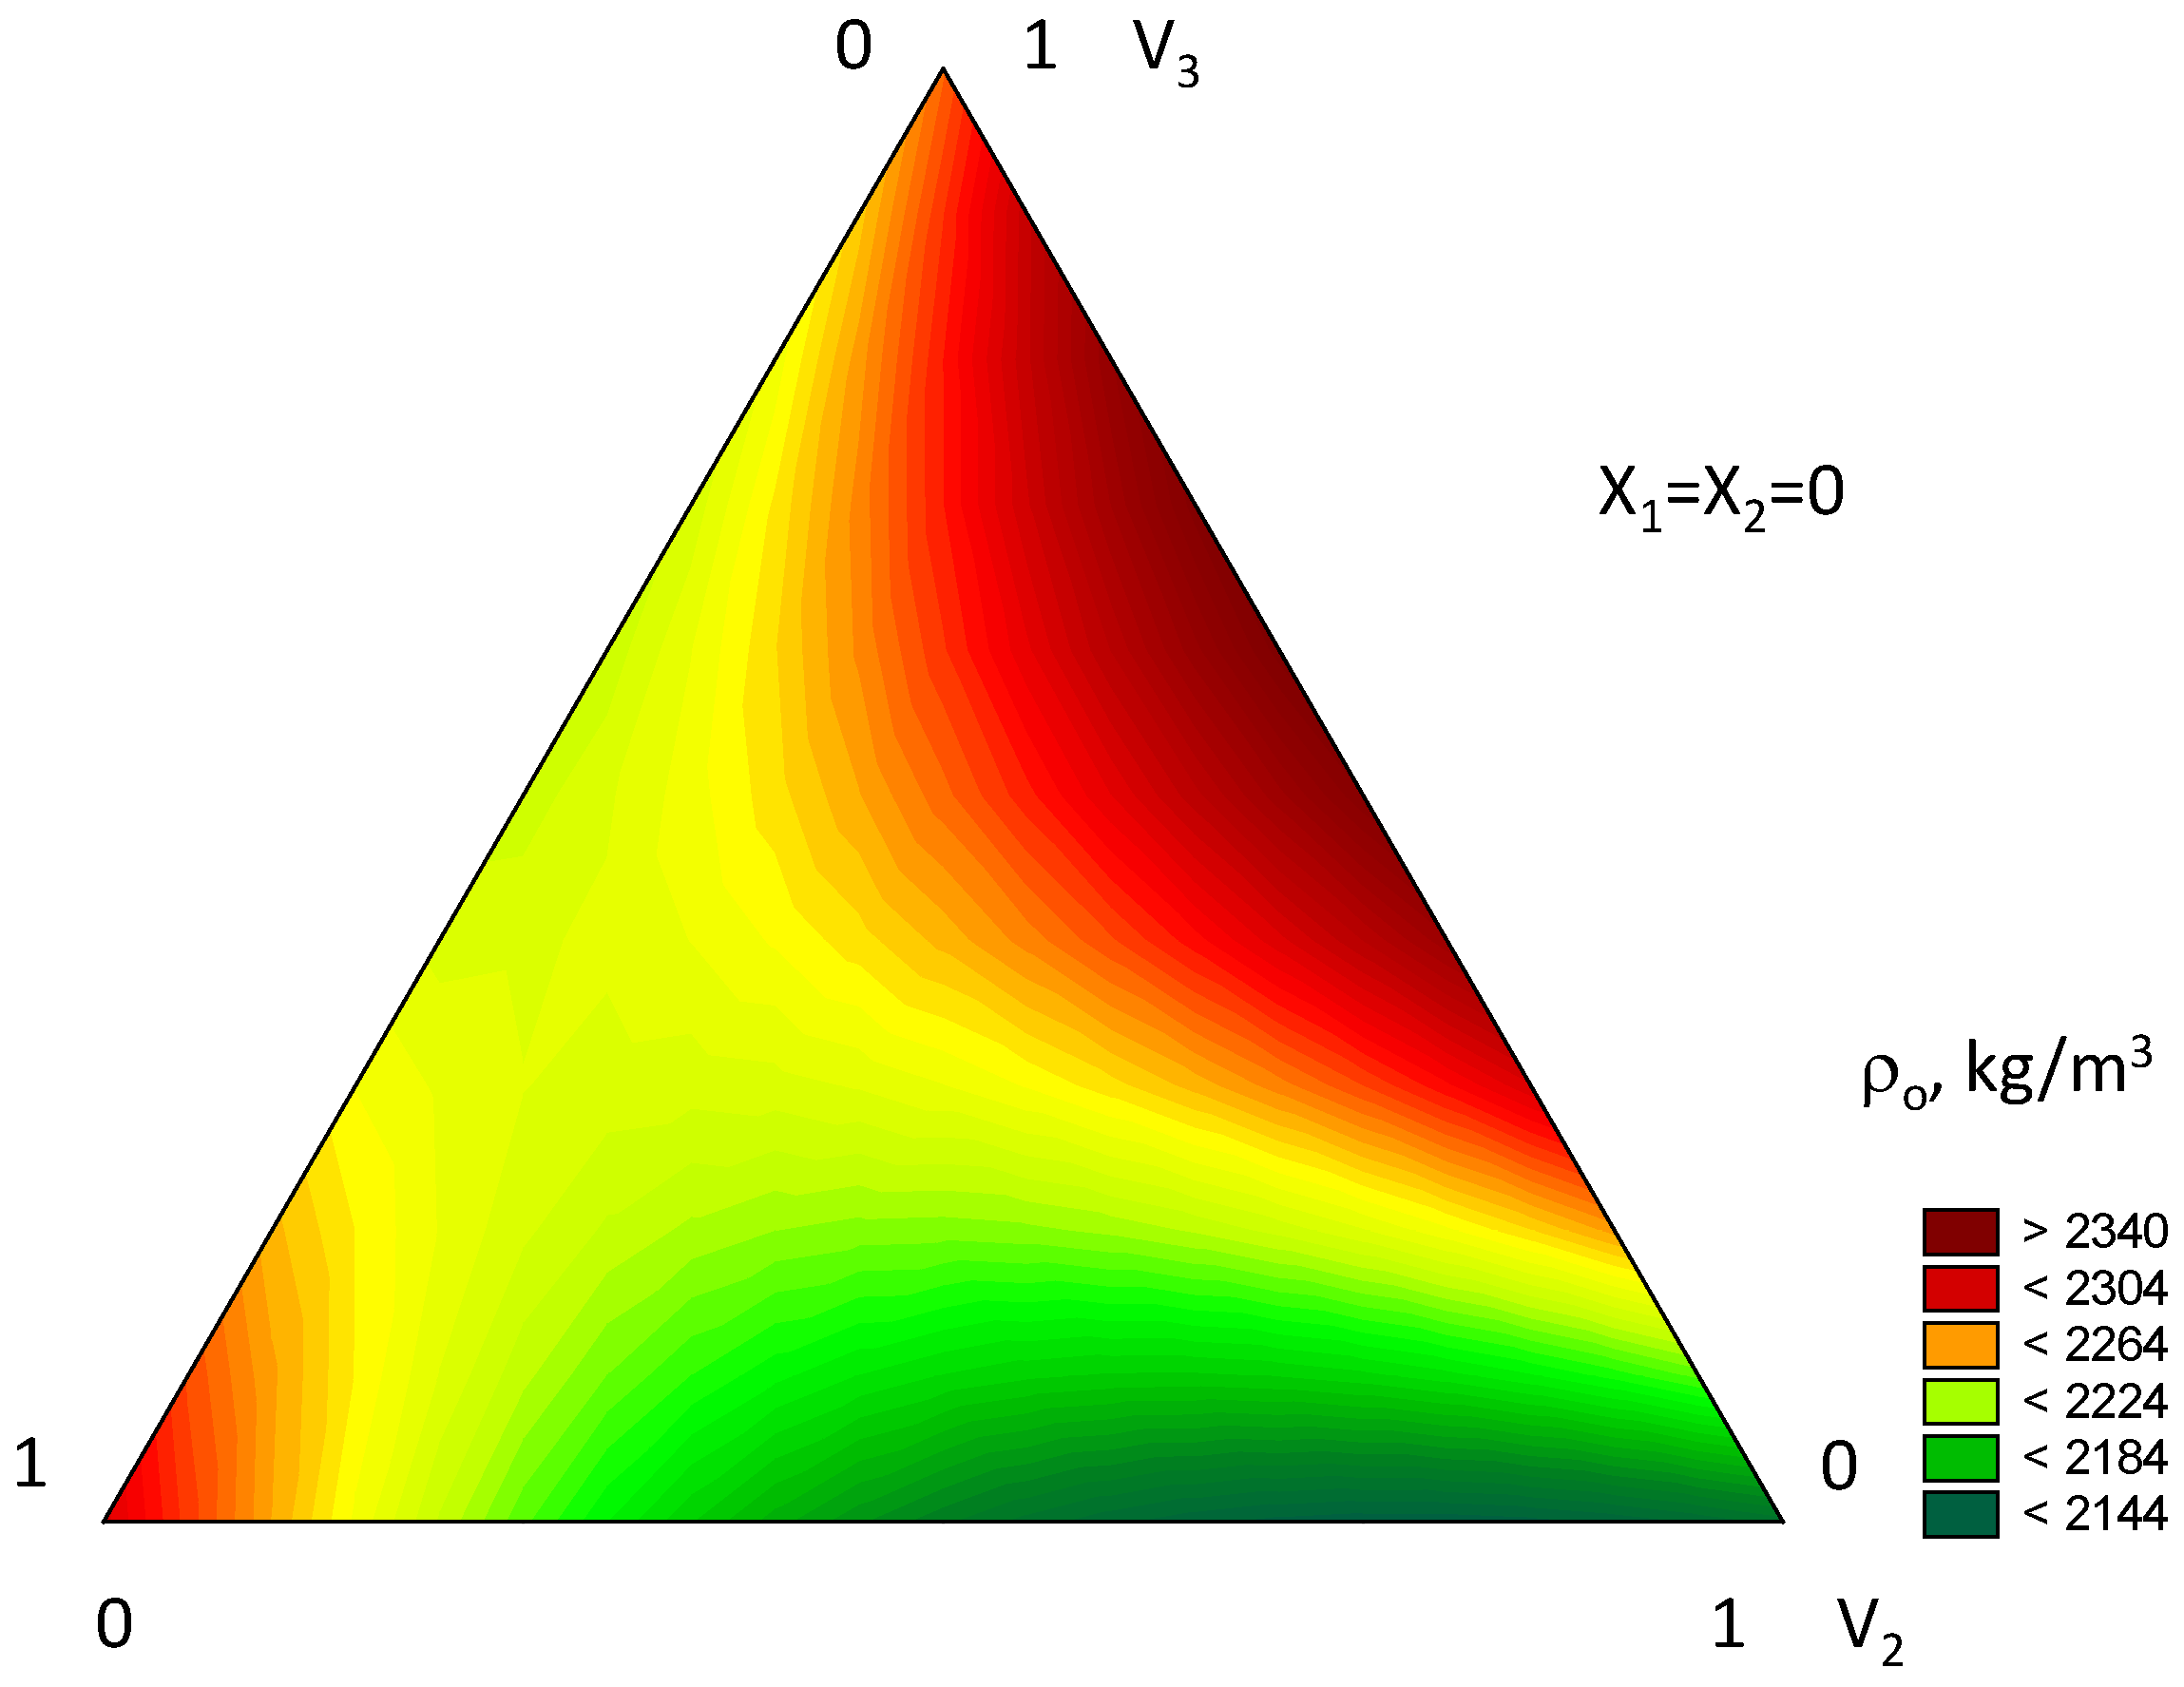
3.4. The Influence of Mix Composition Parameters at Optimal Moisture
– 0.012X1X3 + 0.01X2X3
4. Results Analysis
4.1. The Influence of Mix Moisture, Aggregate Consumption, and Vibrocompaction Parameters
4.2. Granulometric Composition at Constant Compaction Parameters and Changes in Mix Moisture
4.3. The Influence of Mix Composition Parameters at Optimal Moisture
4.4. Method for Calculating Vibropressed Gypsum Concrete Mix Composition
- Based on the strength model (Equation (5)), the ratio of aggregate to gypsum (A/G) is determined according to the given strength. This takes into account the gypsum’s strength of the fineness modulus of sand. Equation (5) in its natural form is as follows:
- 2.
- From the model (Equation (11)), taking into account the A/G and the particle size distribution, the optimal W/G ratio ((W/G)ₒₚₜ) is as follows:
- 3.
- The gypsum content is then calculated.
- 4.
- The water consumption is determined:
- 5.
- The aggregate consumption is determined:
5. Conclusions
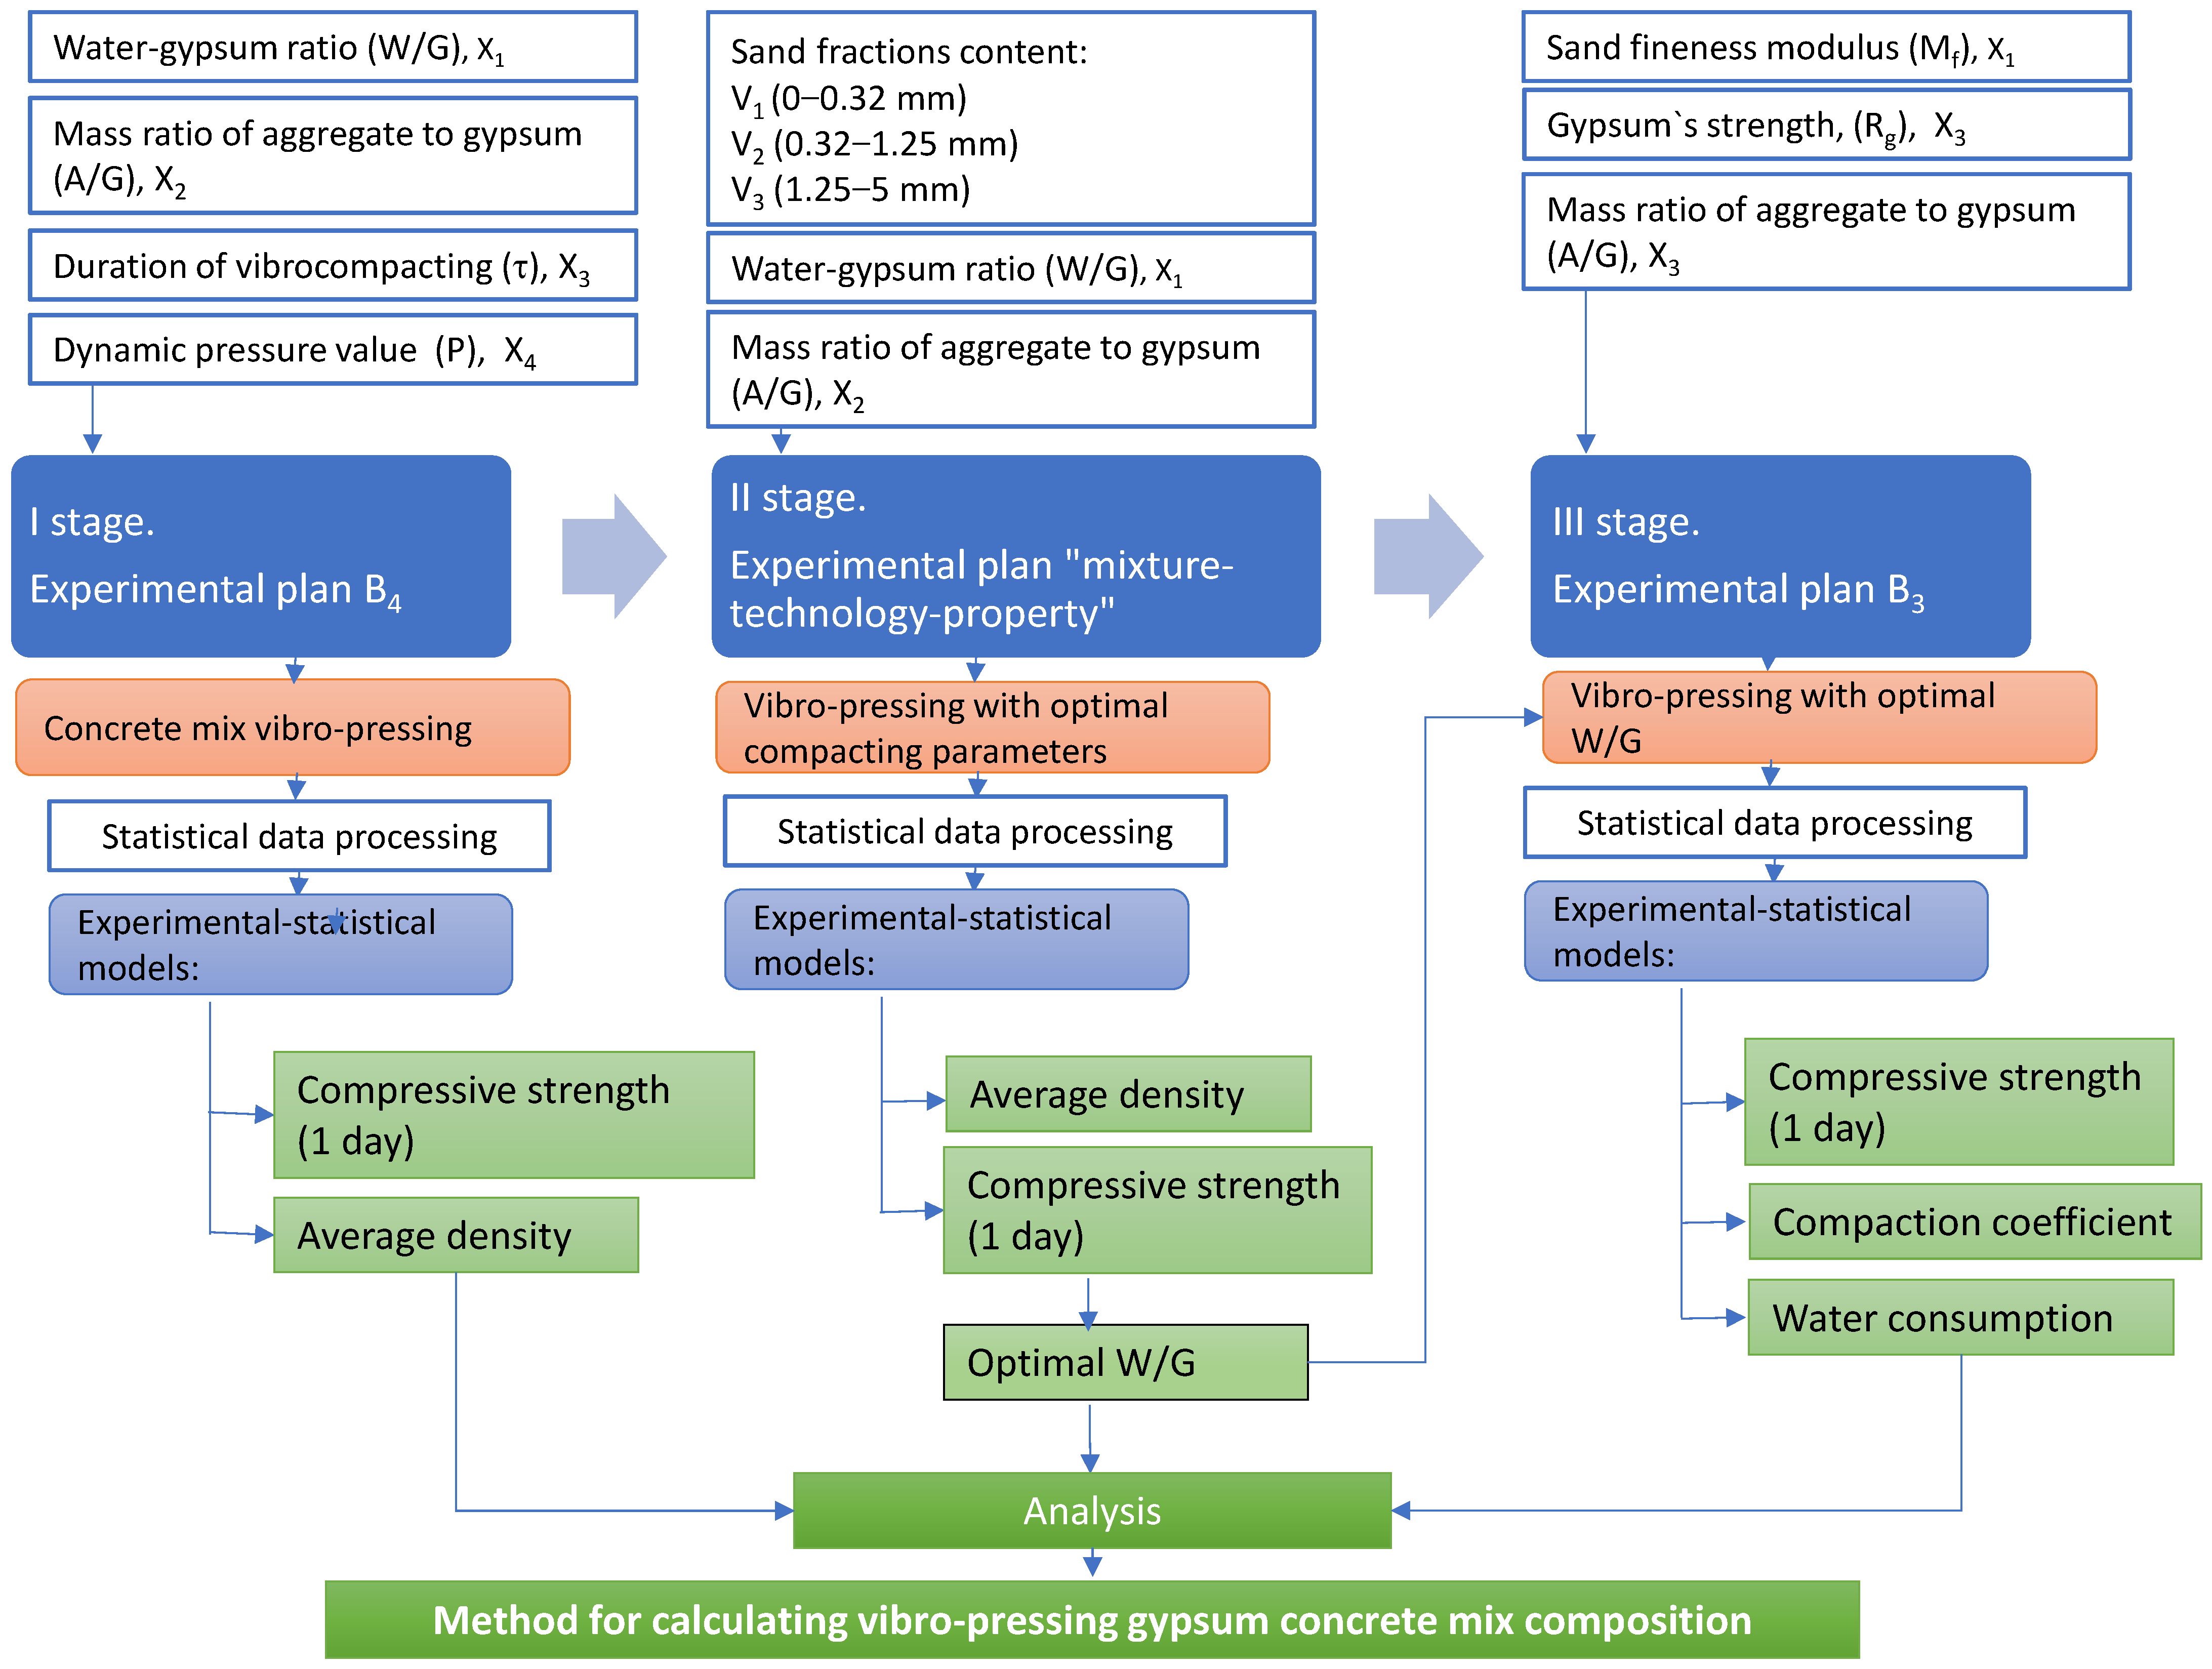
- The influence of the humidity of the superhard gypsum concrete mixture (50–55 s according to Webe), aggregate content, dynamic pressure of the punch, and the compaction duration on the average density and strength of gypsum concrete was investigated. Experimental–statistical polynomial models of the dependence of these properties on technological factors were constructed.
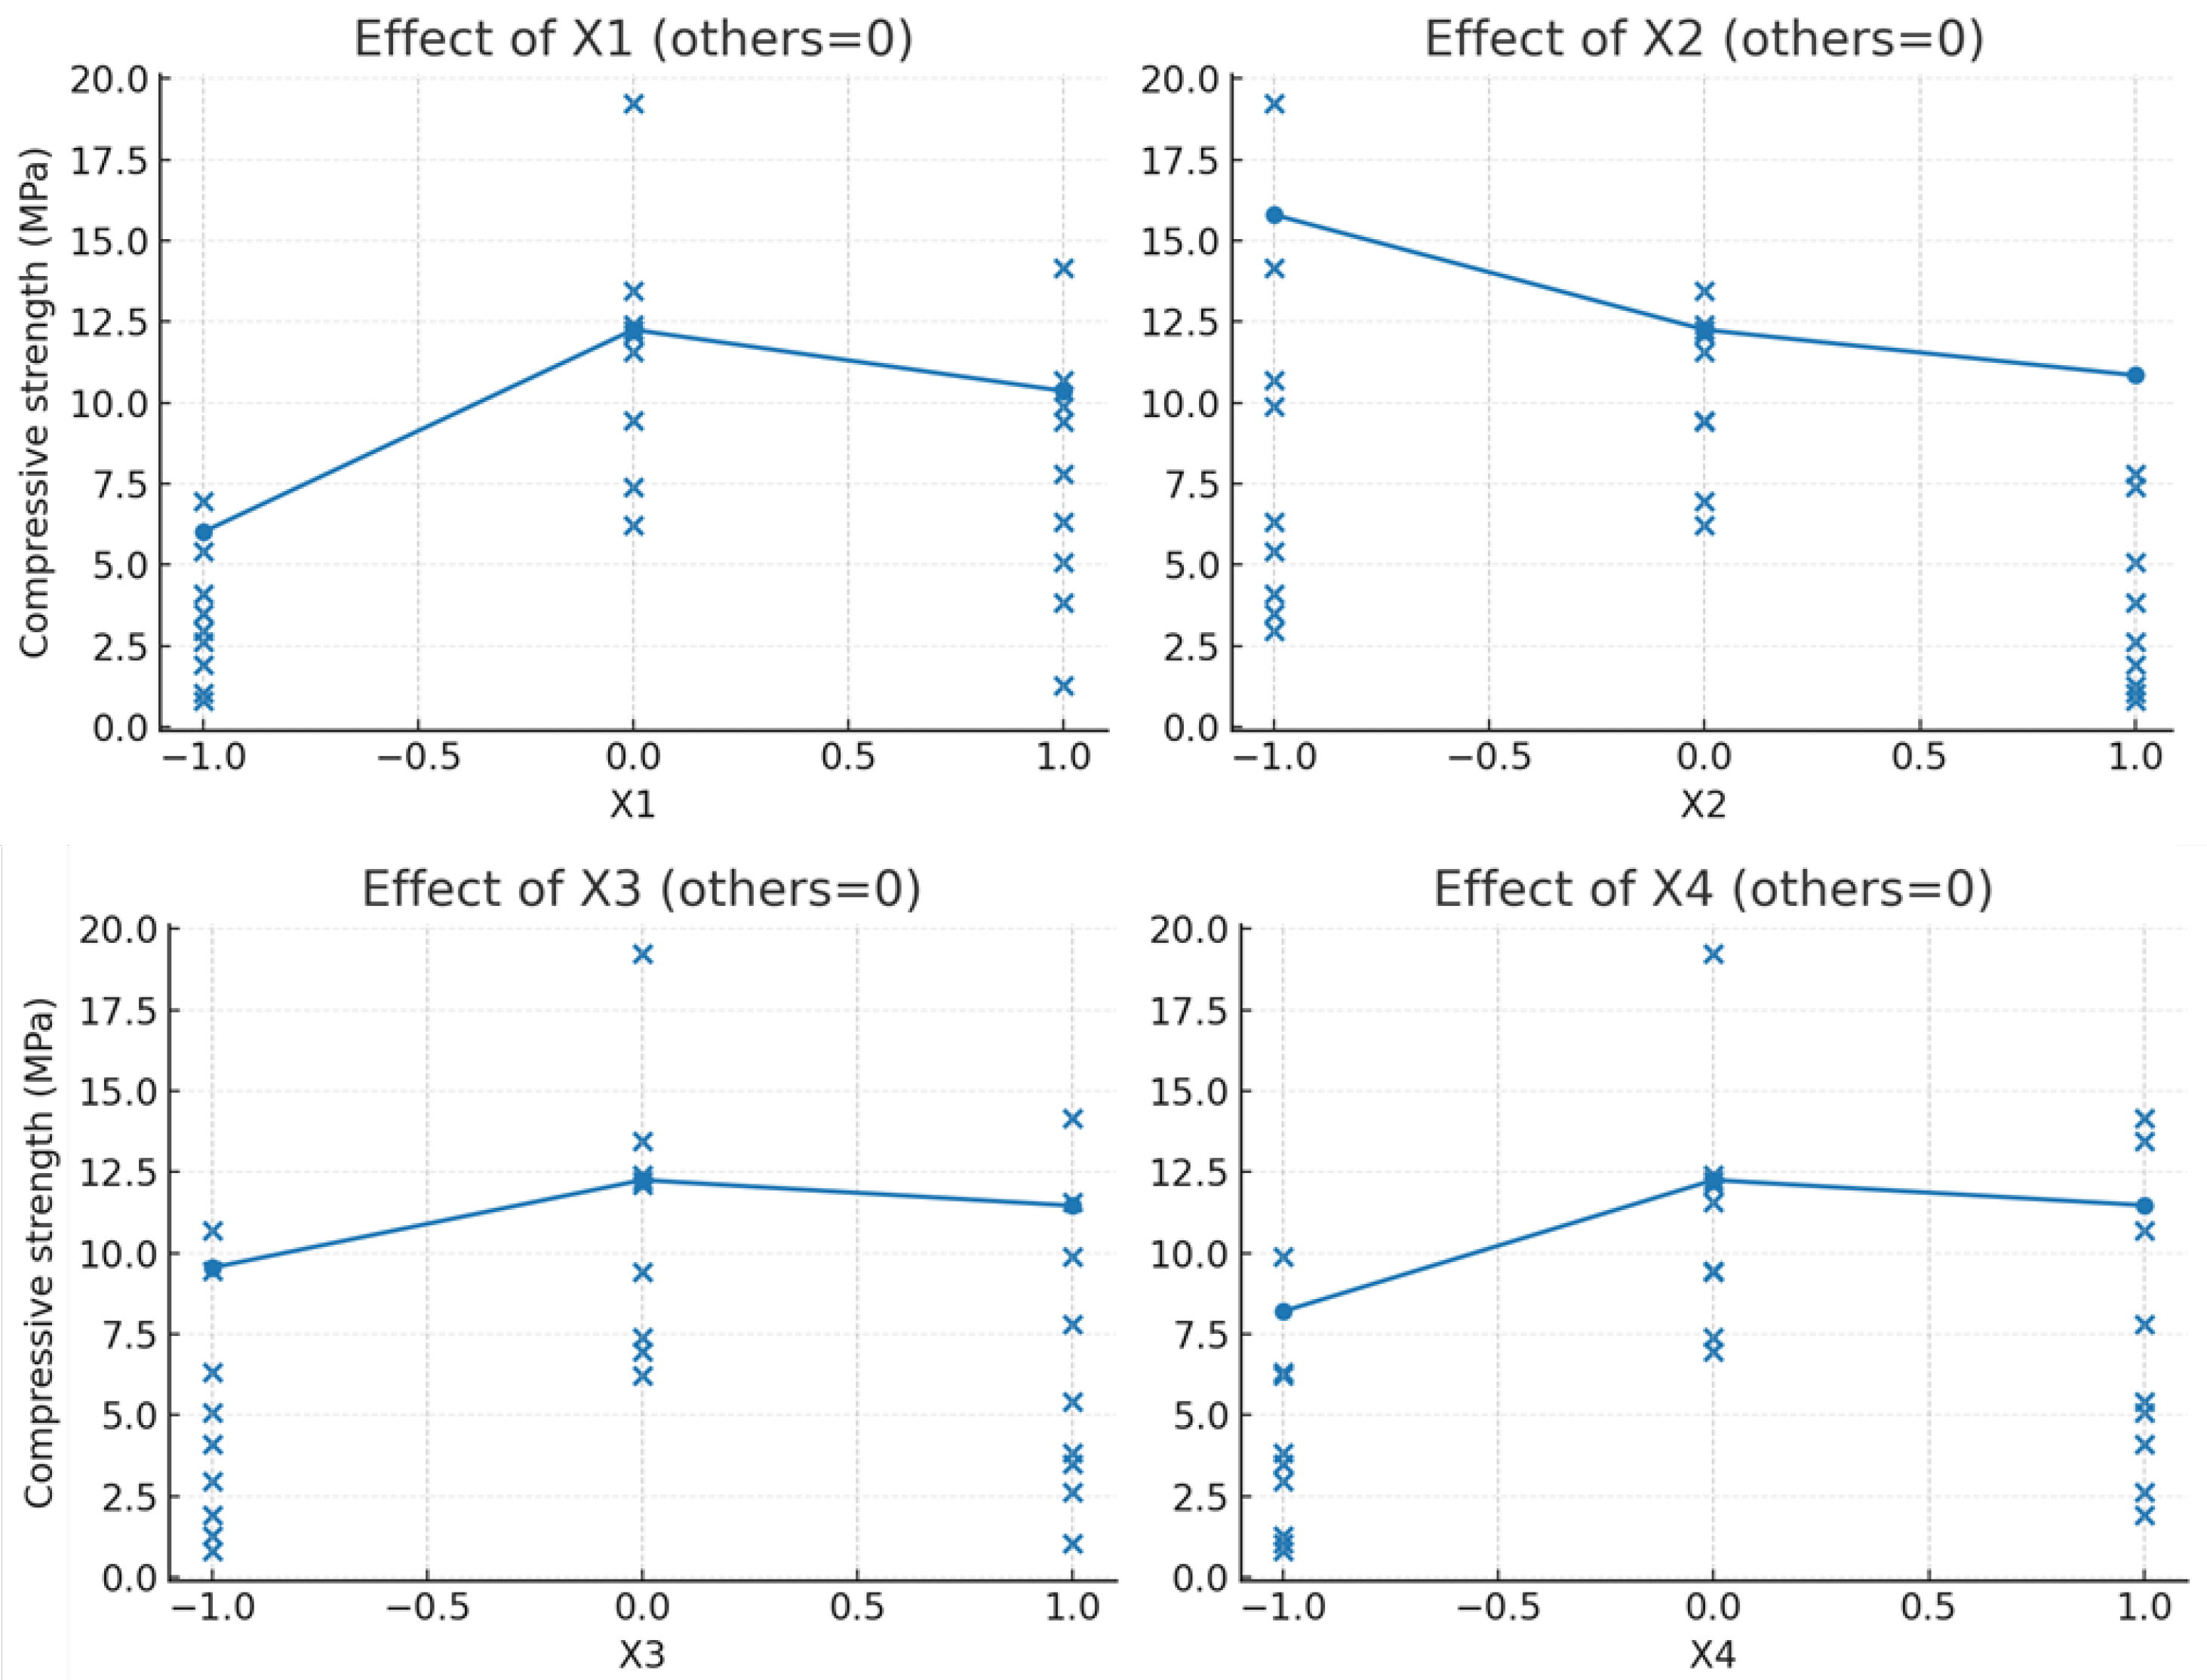
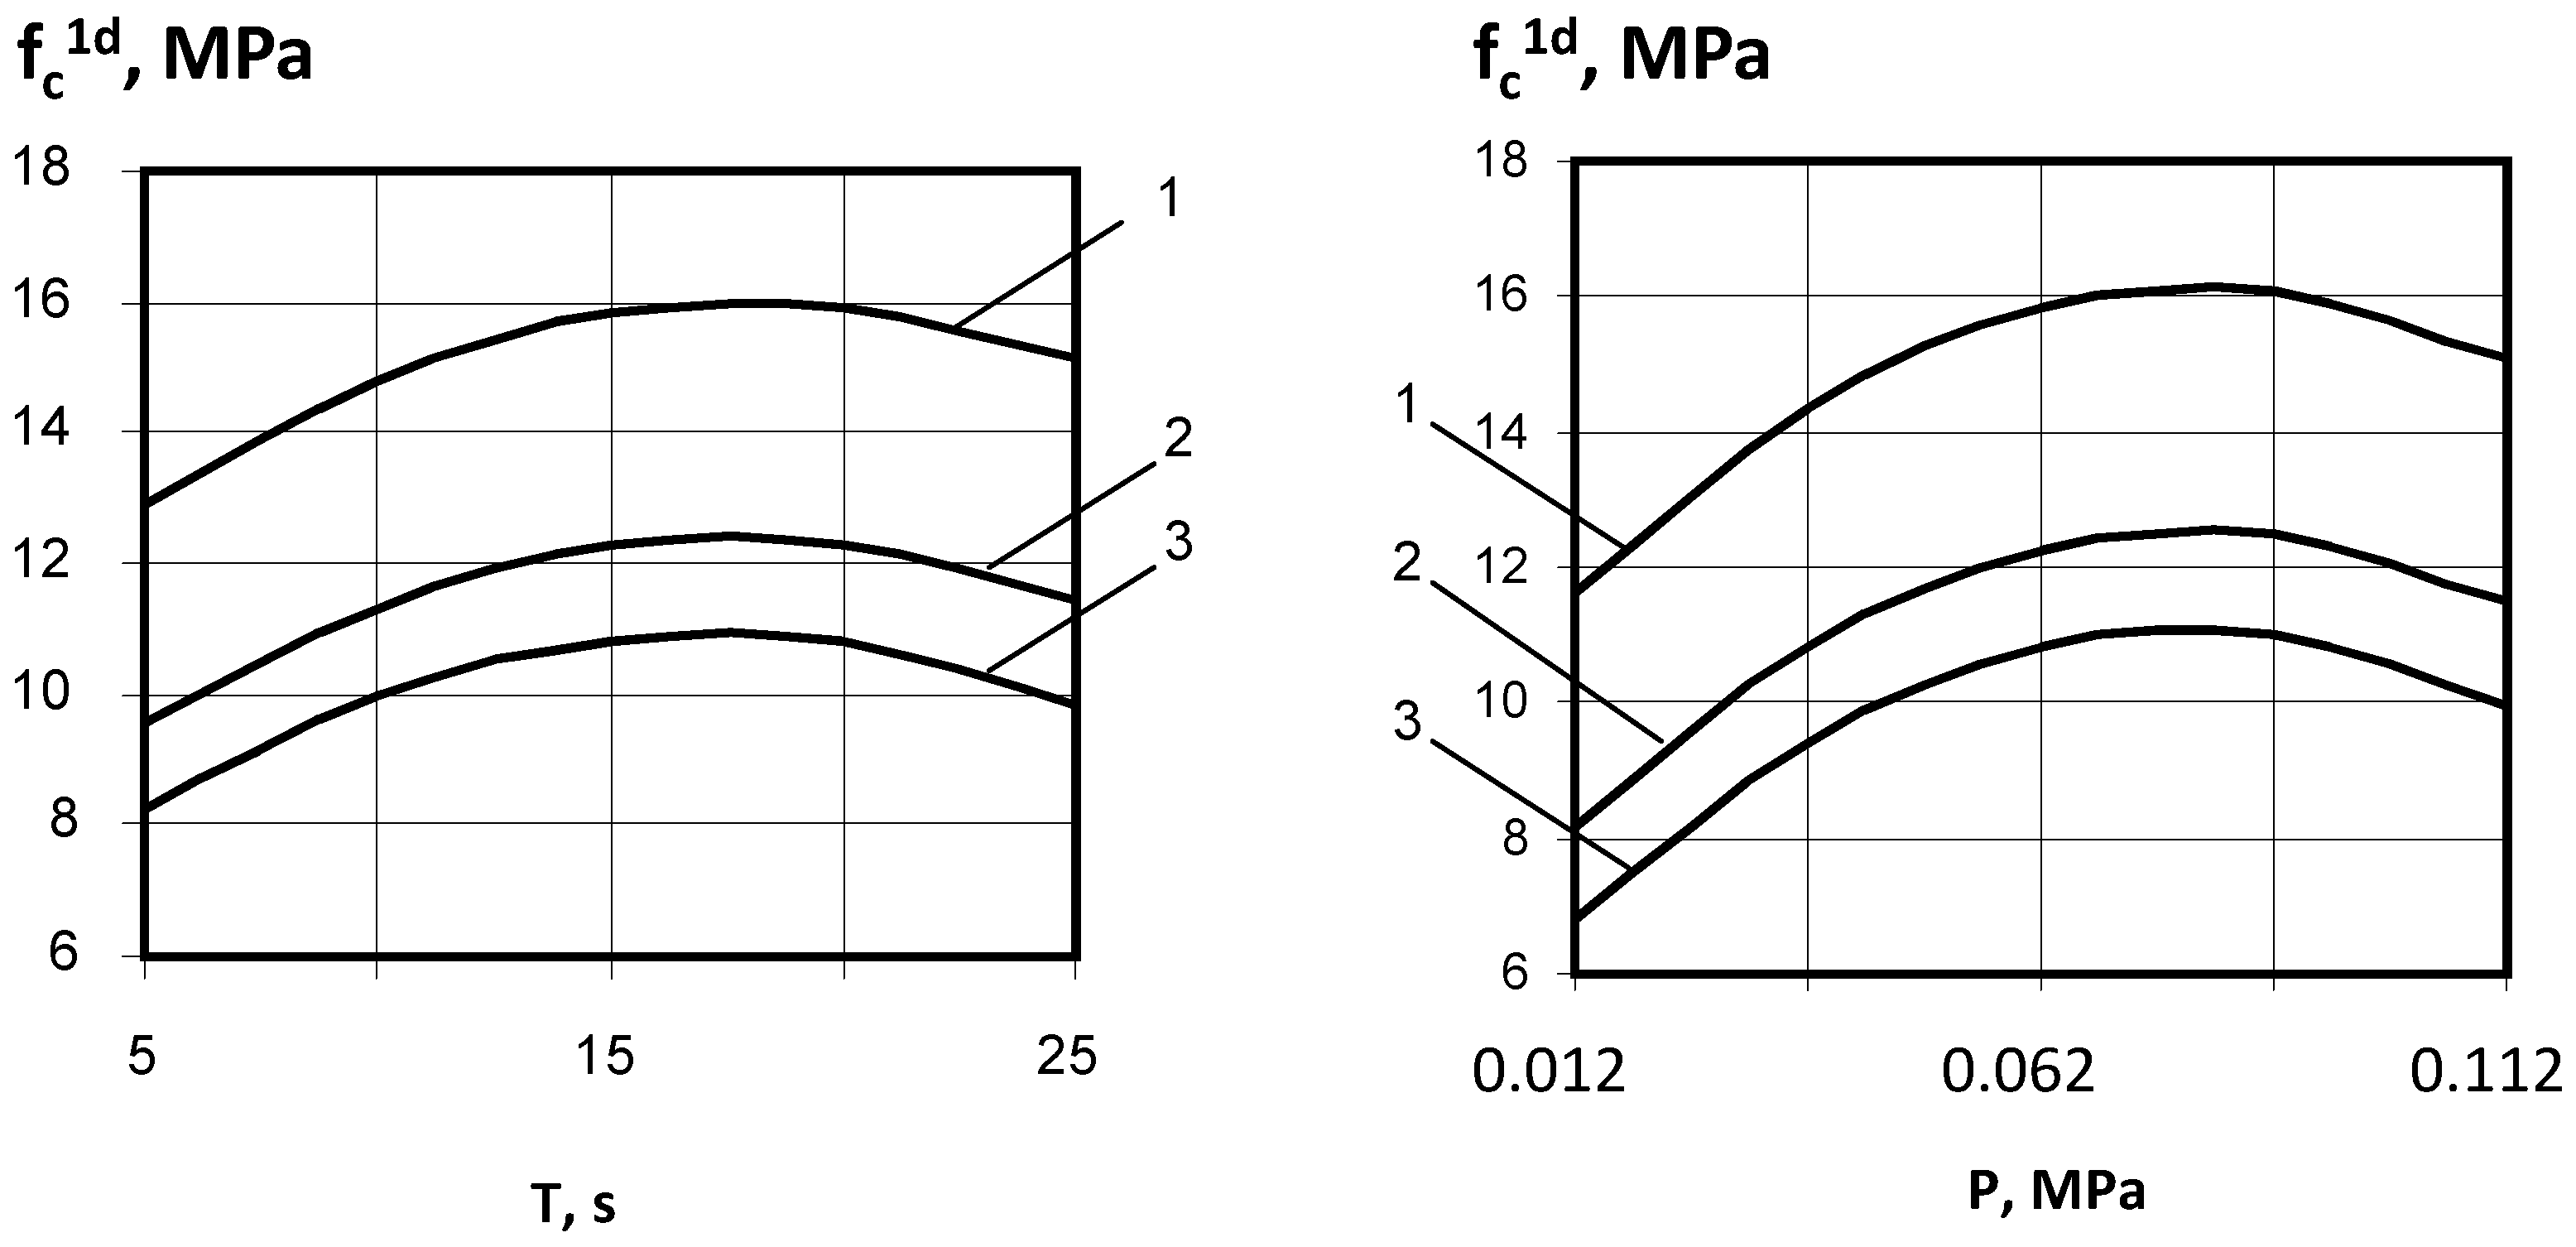
- It was found that, at a vibration frequency of 50 Hz, maximum density and compressive strength in the range from 11 to 16 MPa are achieved at a punch pressure of 0.06–0.09 MPa, a compaction duration of 15–20 s, and an optimal water–gypsum ratio (W/G) of 0.26–0.28, which ensures effective compaction, sufficient hydration, and minimal porosity.
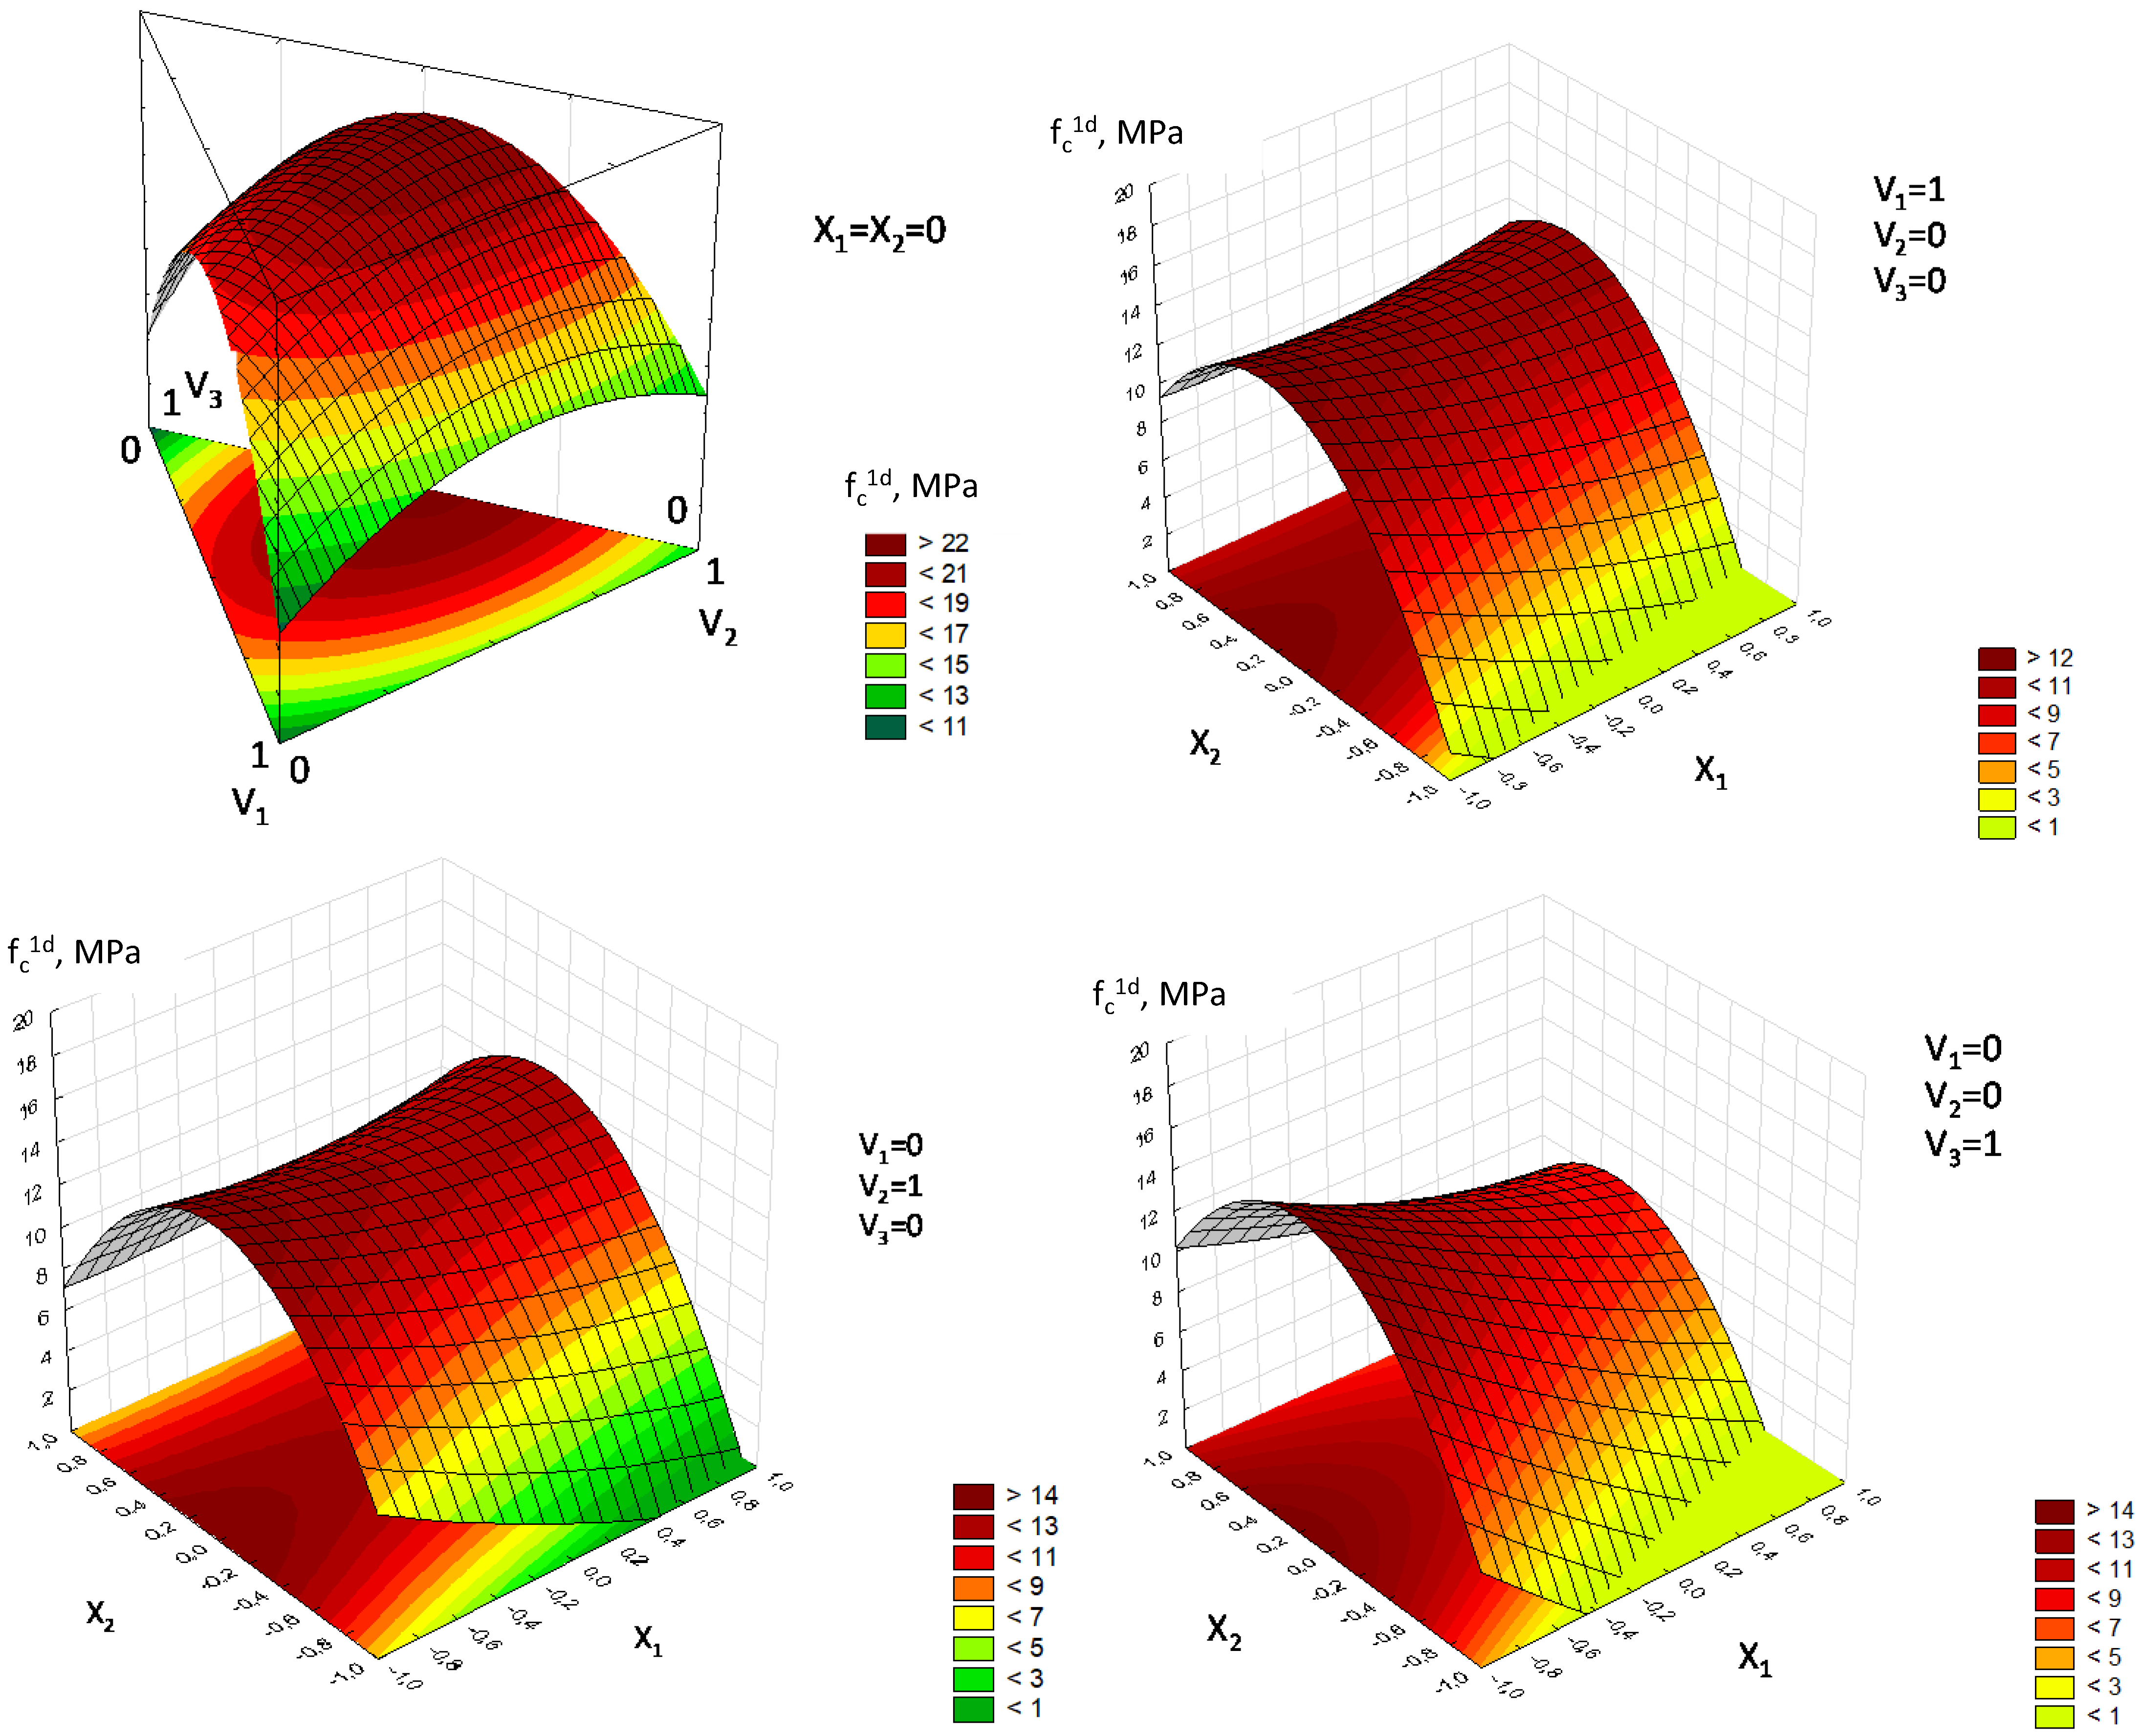
- It has been shown that the fractional composition and content of the aggregate, together with the moisture content of the mixture, significantly affect the density and strength. The optimal combination of fractions is determined by the minimum void content of the aggregate.
- The obtained equation of the optimal W/G ratio provides maximum compressive strength up to 23 MPa, taking into account the aggregate content and grain composition.
- The developed models describe the compressive strength in the range from 15 to 44 MPa, the compaction coefficient, and water consumption at optimal mixture moisture content, taking into account the binder strength, the content, and the size of the aggregate.
- Based on a set of models, a method for designing the composition of vibropressed gypsum concrete from ultra-hard mixtures with dense aggregate is proposed, which allows optimal compositions to be determined for classes from C8/10 to C20/25.
- In the future, it is planned to expand the range of application of the developed composition design method by adding the possibility of using composite waterproof gypsum binders, as well as lightweight aggregates.
Author Contributions
Funding
Institutional Review Board Statement
Informed Consent Statement
Data Availability Statement
Acknowledgments
Conflicts of Interest
Appendix A
Appendix B. Statistical Indicators of the Experimental–Statistical Model of the Gypsum Concrete Strength (Equation (1)) According to Plan B4 (Table 4)
| Source | Sum of Squares (SS) | df | F-Value | p-Value |
|---|---|---|---|---|
| X1 | 84.98 | 1 | 27.09 | 0.00022 |
| X2 | 110.06 | 1 | 35.09 | 0.00007 |
| X3 | 16.44 | 1 | 5.24 | 0.0410 |
| X4 | 48.05 | 1 | 15.32 | 0.00206 |
| X12 | 42.43 | 1 | 13.53 | 0.00316 |
| X22 | 2.93 | 1 | 0.93 | 0.353 |
| X32 | 7.85 | 1 | 2.50 | 0.140 |
| X42 | 14.96 | 1 | 4.77 | 0.0496 |
| X1·X2 | 11.27 | 1 | 3.59 | 0.0823 |
| X1·X3 | 5.70 | 1 | 1.82 | 0.203 |
| X1·X4 | 7.14 | 1 | 2.28 | 0.157 |
| X2·X3 | 0.43 | 1 | 0.14 | 0.719 |
| X2·X4 | 0.10 | 1 | 0.03 | 0.861 |
| X3·X4 | 0.11 | 1 | 0.04 | 0.852 |
| Residual | 37.64 | 12 | – | – |
| lack-of-fit | 37.59 | 10 | 67.1 | 0.061 |
| Pure error | 0.045 | 2 | – | – |

Appendix C. Statistical Indicators of the Experimental–Statistical Model of the Average Concrete Density (Equation (2)) According to Plan B4 (Table 4)
| Source | Sum of Squares (SS) | df | F-Value | p-Value |
|---|---|---|---|---|
| X1 | 82.433 | 1 | 22.93 | 0.0003 |
| X2 | 635.219 | 1 | 176.54 | <0.0001 |
| X3 | 14.682 | 1 | 4.08 | 0.063 |
| X4 | 107.122 | 1 | 29.75 | <0.0001 |
| X12 | 2.551 | 1 | 0.71 | 0.412 |
| X22 | 13.127 | 1 | 3.65 | 0.077 |
| X32 | 1.435 | 1 | 0.40 | 0.535 |
| X42 | 48.319 | 1 | 13.43 | 0.002 |
| X1·X2 | 92.225 | 1 | 25.65 | <0.0001 |
| X1·X3 | 2.376 | 1 | 0.66 | 0.428 |
| X1·X4 | 2.058 | 1 | 0.57 | 0.462 |
| X2·X3 | 1.904 | 1 | 0.53 | 0.476 |
| X2·X4 | 7.569 | 1 | 2.10 | 0.166 |
| X3·X4 | 22.823 | 1 | 6.34 | 0.021 |
| Residual Error | 43.152 | 12 | – | – |
| Lack-of-fit | 34.012 | 8 | 27.7 | 0.0353 |
| Pure Error | 7.215 | 4 | – | – |


Appendix D. Statistical Indicators of the Experimental–Statistical Model of the Concrete Strength (Equation (3)) According to Plan “Mixture-Technology-Property” (Table 5)
| Source | Sum of Squares (SS) | df | F-Value | p-Value |
|---|---|---|---|---|
| V1 | 2.44 | 1 | 0.23 | 0.0657 |
| V2 | 38.94 | 1 | 3.67 | 0.0128 |
| V3 | 13.26 | 1 | 1.25 | 0.0326 |
| V1·V2 | 48.11 | 1 | 4.54 | 0.0100 |
| V1·V3 | 315.24 | 1 | 29.73 | 0.0055 |
| V2·V3 | 64.73 | 1 | 6.10 | 0.0689 |
| X1 | 0.0 | 1.0 | 0.0 | 1.0 |
| X2 | 0.0 | 1.0 | 0.0 | 1.0 |
| X12 | 217.18 | 1 | 20.48 | 0.0106 |
| X22 | 47.34 | 1 | 4.46 | 0.0102 |
| X1·X2 | 0.0096 | 1 | 0.0009 | 0.0977 |
| V1·X1 | 48.18 | 1 | 4.54 | 0.0100 |
| V2·X1 | 49.97 | 1 | 4.71 | 0.0096 |
| V3·X1 | 3.09 | 1 | 0.29 | 0.0618 |
| V1·X2 | 74.47 | 1 | 7.02 | 0.0570 |
| V2·X2 | 44.08 | 1 | 4.16 | 0.0111 |
| V3·X2 | 21.65 | 1 | 2.04 | 0.0226 |
| Residual | 42.42 | 4 | — | — |
| lack-of-fit | 41.31 | 1 | 111.91 | 0.0018 |
| Pure error | 1.1075 | 3 | — | — |

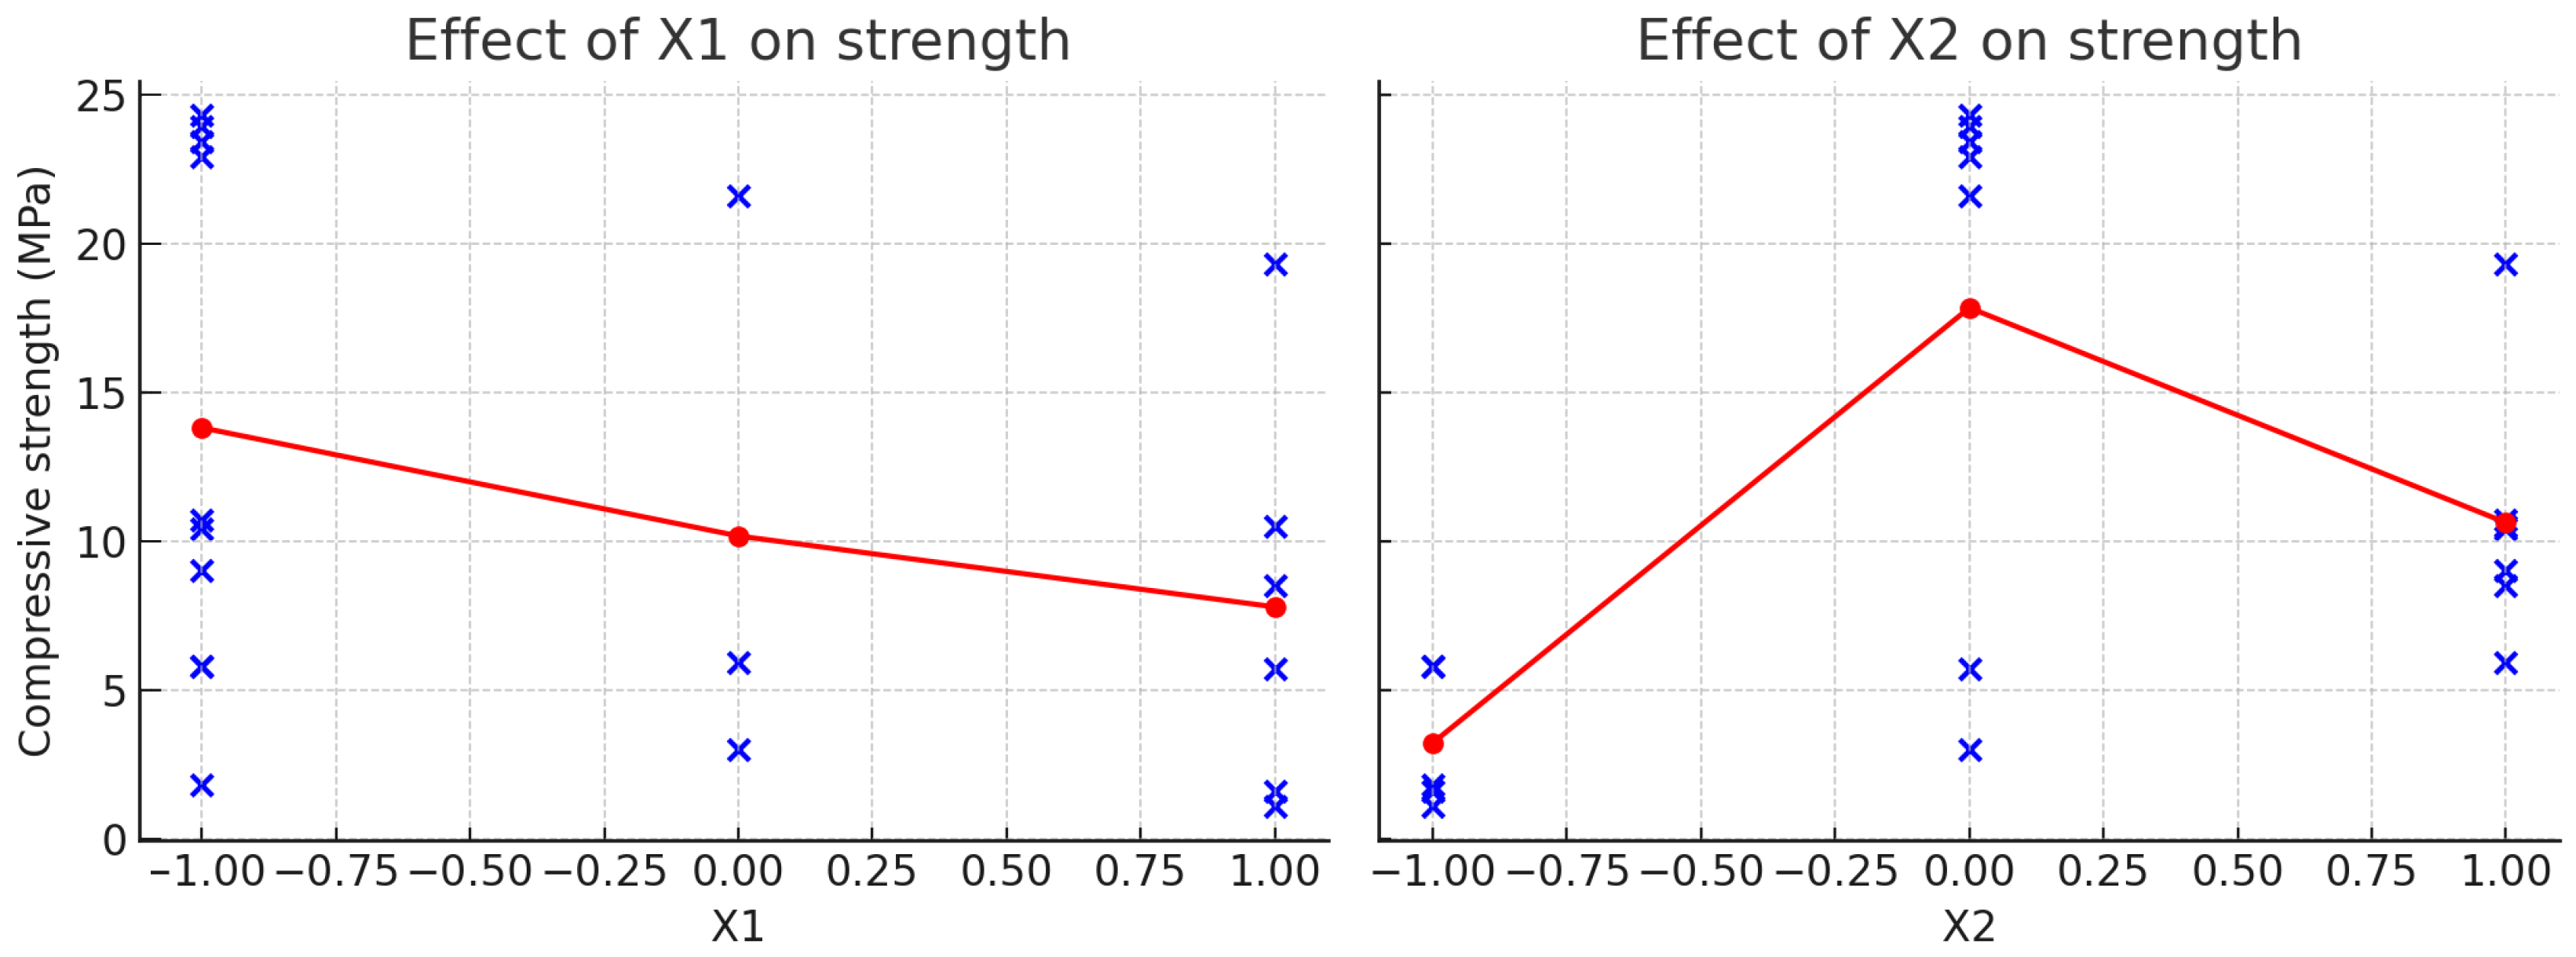
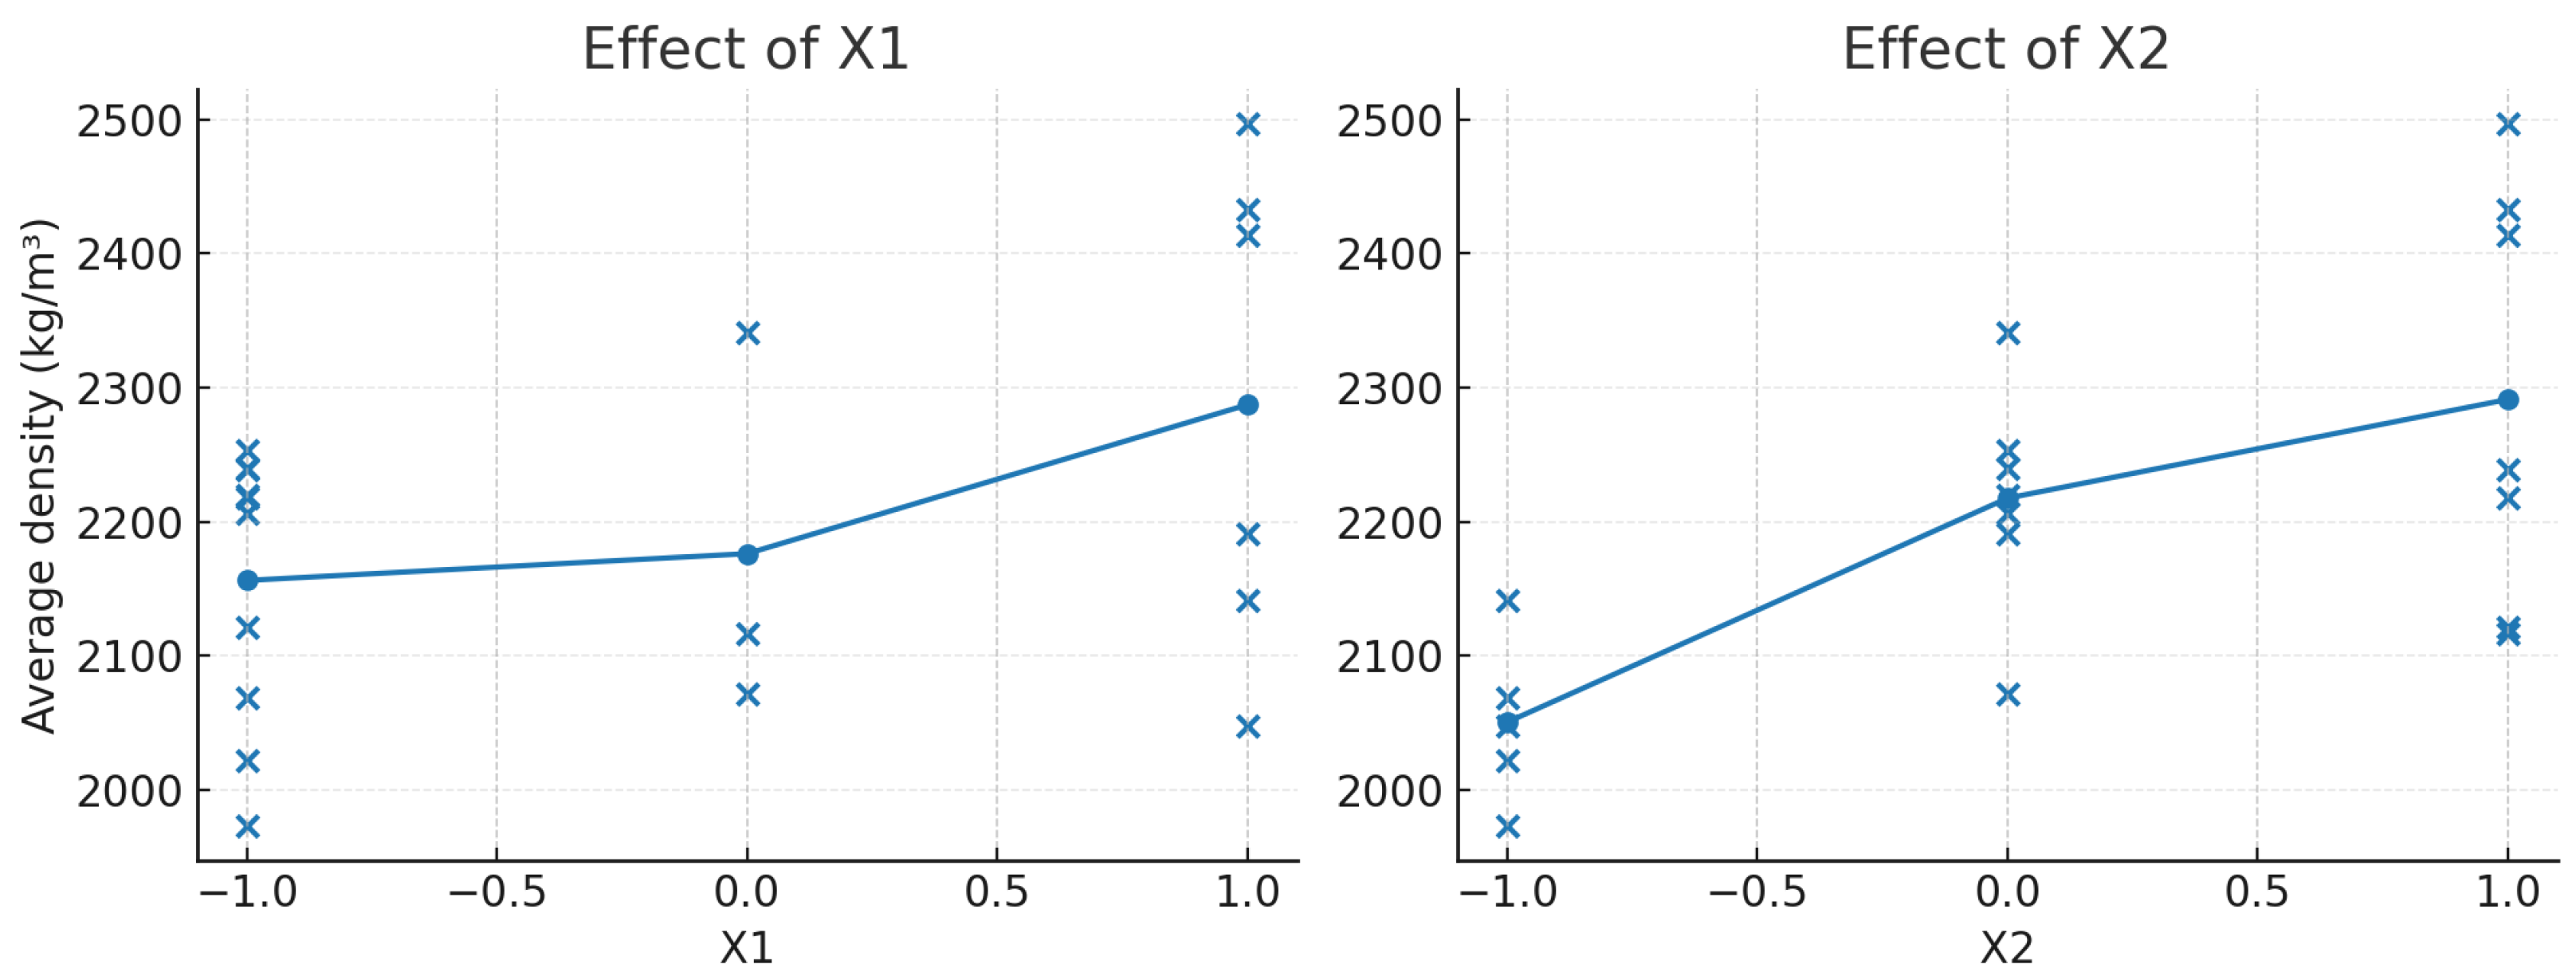
Appendix E. Statistical Indicators of the Experimental–Statistical Model of the Average Concrete Density (Equation (4)) According to Plan “Mixture-Technology-Property” (Table 5)
| Source | Sum of Squares (SS) | df | F-Value | p-Value |
|---|---|---|---|---|
| V1 | 707,685.7312 | 1.0 | 579.2658 | 0.0 |
| V2 | 1,163,105.803 | 1.0 | 952.0433 | 0.0 |
| V3 | 750,673.3224 | 1.0 | 614.4527 | 0.0 |
| V1·V2 | 1123.5375 | 1.0 | 0.9197 | 0.3919 |
| V1·V3 | 20,144.1141 | 1.0 | 16.4887 | 0.0153 |
| V2·V3 | 4888.563 | 1.0 | 4.0015 | 0.1161 |
| X1 | 0.0 | 1.0 | 0.0 | 1.0 |
| X2 | 0.0 | 1.0 | 0.0 | 1.0 |
| X12 | 23,108.2937 | 1.0 | 18.915 | 0.0122 |
| X22 | 29,052.9009 | 1.0 | 23.7808 | 0.0082 |
| X1·X2 | 9128.0402 | 1.0 | 7.4716 | 0.0523 |
| V1·X1 | 47.1474 | 1.0 | 0.0386 | 0.8538 |
| V2·X1 | 11,528.4865 | 1.0 | 9.4365 | 0.0372 |
| V3·X1 | 5905.3496 | 1.0 | 4.8337 | 0.0928 |
| V1·X2 | 1713.66 | 1.0 | 1.4027 | 0.3018 |
| V2·X2 | 147.781 | 1.0 | 0.121 | 0.7455 |
| V3·X2 | 999.0115 | 1.0 | 0.8177 | 0.417 |
| Residual | 4886.7771 | 4.0 | – | – |
| lack-of-fit | 3582.0271 | 1 | 8.2361 | 0.0641 |
| Pure error | 1304.75 | 3 | – | – |

Appendix F. Statistical Indicators of the Experimental–Statistical Model of the Concrete Strength (Equation (5)) According to Plan B3 (Table 7)
| Source | Sum of Squares (SS) | df | F-Value | p-Value |
|---|---|---|---|---|
| X1 | 22.201 | 1.0 | 4.3644 | 0.0751 |
| X2 | 556.516 | 1.0 | 109.4026 | 0.06 |
| X3 | 429.025 | 1.0 | 84.3398 | 0.071 |
| X12 | 7.6982 | 1.0 | 1.5133 | 0.2584 |
| X22 | 17.4892 | 1.0 | 3.4381 | 0.1061 |
| X32 | 19.4604 | 1.0 | 3.8256 | 0.0914 |
| X1·X2 | 0.0112 | 1.0 | 0.0022 | 0.9638 |
| X1·X3 | 0.4512 | 1.0 | 0.0887 | 0.7745 |
| X2·X3 | 105.8512 | 1.0 | 20.8087 | 0.0026 |
| Residual | 35.6081 | 7.0 | — | — |
| lack-of-fit | 35.36 | 5.0 | 57.342 | 0.0572 |
| Pure error | 0.1233 | 2.0 | — | — |


Appendix G. Statistical Indicators of the Experimental–Statistical Model of the Compaction Coefficient (Equation (6)) According to Plan B3 (Table 7)
| Source | Sum of Squares (SS) | df | F-Value | p-Value |
|---|---|---|---|---|
| X1 | 0.001812 | 1 | 8.1991 | 0.0243 |
| X2 | 0.002112 | 1 | 9.5546 | 0.0180 |
| X3 | 0.000050 | 1 | 0.2258 | 0.6482 |
| X12 | 0.000000 | 1 | 0.0001 | 0.9910 |
| X22 | 0.001012 | 1 | 4.5743 | 0.0709 |
| X32 | 0.000050 | 1 | 0.2258 | 0.6482 |
| X1·X2 | 0.000800 | 1 | 3.6197 | 0.1008 |
| X1·X3 | 0.000012 | 1 | 0.0549 | 0.8230 |
| X2·X3 | 0.000050 | 1 | 0.2258 | 0.6482 |
| Residual | 0.001553 | 7 | — | — |
| lack-of-fit | 0.001181 | 5 | 0.5921 | 0.7248 |
| Pure error | 0.001979 | 7 | — | — |


Appendix H. Statistical Indicators of the Experimental–Statistical Model of the Water Consumption (Equation (7)) According to Plan B3 (Table 7)
| Source | Sum of Squares (SS) | df | F-Value | p-Value |
|---|---|---|---|---|
| X1 | 826.281 | 1 | 198.876 | 0.000003 |
| X2 | 1118.366 | 1 | 269.226 | 0.000001 |
| X3 | 1089.366 | 1 | 262.037 | 0.000001 |
| X12 | 14.758 | 1 | 3.549 | 0.094676 |
| X22 | 52.758 | 1 | 12.678 | 0.009282 |
| X32 | 10.758 | 1 | 2.585 | 0.145734 |
| X1·X2 | 19.778 | 1 | 4.756 | 0.065364 |
| X1·X3 | 16.278 | 1 | 3.911 | 0.085158 |
| X2·X3 | 21.278 | 1 | 5.122 | 0.058237 |
| Residual | 20.788 | 5 | — | — |
| lack-of-fit | 19.95 | 5 | 6.629 | 0.1358 |
| Pure error | 1.202 | 2 | — | — |


References
- Sakthieswaran, N.; Sophia, M. Effect of superplasticizers on the properties of latex modified gypsum plaster. Constr. Build. Mater. 2018, 179, 675–691. [Google Scholar] [CrossRef]
- Çolak, A. Properties of plain and latex modified Portland cement pastes and concretes with and without superplasticizer. Cem. Concr. Res. 2005, 35, 1510–1521. [Google Scholar] [CrossRef]
- Leccese, F.; Tuoni, G.; Pau, S.; Salvadori, G. Vibro-compressed concrete hollow blocks with high thermal performance: Steady-state and dynamic thermal behavior. In Proceedings of the CLIMA 2010—10th REHVA World Congress on Sustainable Energy Use in Buildings, Antalya, Turkey, 9–12 May 2010; Federation of European HVAC Associations (REHVA), CD-Rom: Brussels, Belgium; pp. 1–8, ISBN 978-975-6907-14-6. [Google Scholar]
- Soutsos, M.N.; Tang, K.; Millard, S.G. Concrete building blocks made with recycled demolition aggregate. Constr. Build. Mater. 2011, 25, 726–735. [Google Scholar] [CrossRef]
- Jaafar, A.; Abbas, Z.; Allawi, A. Studying Sustainable Concrete Block Efficiency Production: A Review. J. Eng. 2023, 29, 134–149. [Google Scholar] [CrossRef]
- Esan, M.T. Review of gypsum reinforced composites as building materials. Discov. Civ. Eng. 2024, 1, 5. [Google Scholar] [CrossRef]
- Carney, J.; Carney, E. Gypsum in construction: Origin and properties. Mater. Struct. 1995, 28, 92–100. [Google Scholar] [CrossRef]
- Lushnikova, N.; Dvorkin, L. Sustainability of gypsum products as a construction material. In Sustainability of Construction Materials, 2nd ed.; Khatib, J.M., Ed.; Woodhead Publishing: Cambridge, UK, 2016; pp. 643–681. [Google Scholar] [CrossRef]
- Kamarou, M.; Korob, N.; Kwapinski, W.; Romanovski, V. High-quality gypsum binders based on synthetic calcium sulfate dihydrate produced from industrial wastes. J. Ind. Eng. Chem. 2021, 100, 324–332. [Google Scholar] [CrossRef]
- Dima, C.; Badanoiu, A.; Cirstea, S.; Nicoara, A.I.; Stoleriu, S. Lightweight gypsum materials with potential use for thermal insulations. Materials 2020, 13, 5454. [Google Scholar] [CrossRef] [PubMed]
- Guan, Q.; Sui, Y.; Zhang, F.; Yu, W.; Bo, Y.; Wang, P.; Peng, W.; Jin, J. Preparation of α-calcium sulfate hemihydrate from industrial by-product gypsum: A review. Physicochem. Probl. Miner. Process. 2021, 57, 168–181. [Google Scholar] [CrossRef]
- Konig, E. Process of Producing a Building Product, Particularly a Gypsum Slab. U.S. Patent 4,328,178; filed 14 May 1979, and issued 4 May 1982, Available online: https://patents.google.com/patent/US4328178A/en (accessed on 19 August 2025).
- Kamensky, V.G. Obtaining high-strength gypsum stone. In Problems of Heat and Mass Transfer–77; AS BSSR: Minsk, Belarus, 1977; pp. 92–103. (In Russian) [Google Scholar]
- Danilov, V.I.; Merkin, A.P. Single-stage technology of phosphogypsum products. Build. Mater. 1975, 5, 36–40. (In Russian) [Google Scholar]
- Meshcheryakov, Y.G. Gypsum By-Products and Their Use in the Production of Building Materials; Stroyizdat: Leningrad, Russia, 1982; p. 144. (In Russian) [Google Scholar]
- Ferronskaya, A.V. Gypsum in modern construction. Build. Mater. 1995, 2, 16–19. (In Russian) [Google Scholar]
- Zhang, F.; Tan, T.H.; Sinoh, S.S.S.; Hung, C.-C.; Mo, K.H. Interaction of various parameters on the properties of semi-dry gypsum-based blocks produced by compression forming method. Constr. Build. Mater. 2024, 411, 134479. [Google Scholar] [CrossRef]
- Abbas, T.F.; Abbas, Z.K. Production Load–bearing Concrete Masonry Units by Using Recycled Waste Crushed Clay Bricks; A Review. J. Eng. 2022, 28, 13–27. [Google Scholar] [CrossRef]
- Pignotti, G.B.; Matos, A.M.; Ferreira, F.G.S. Non-Structural Vibro-Compressed Concrete Incorporating Industrial Wastes. Recycling 2024, 9, 26. [Google Scholar] [CrossRef]
- Widayanto, E.; Soehardjono, A.; Wisnumurti, W.; Zacoeb, A. The effect of vibropressing compaction process on the compressive strength based concrete paving blocks. AIMS Mater. Sci. 2020, 7, 203–216. [Google Scholar] [CrossRef]
- Hanuseac, L.; Barbuta, M.; Bejan, L.; Rosu, R.; Timu, A. Experimental study on hollow blocks with wastes. Proceedings 2021, 63, 79. [Google Scholar] [CrossRef]
- Dvorkin, L.; Dvorkin, O.; Ribakov, Y.; Zhitkovsky, V. Using granite siftings for producing vibro-pressed fine-grained concrete. KSCE J. Civ. Eng. 2017, 21, 2252–2258. [Google Scholar] [CrossRef]
- Ganjian, E.; Jalull, G.; Sadeghi-Pouya, H. Using waste materials and by-products to produce concrete paving blocks. Constr. Build. Mater. 2015, 77, 270–275. [Google Scholar] [CrossRef]
- Batyanovsky, E.I.; Bondarovich, A.I. Vibro-Pressed Concrete: Technology and Properties; BNTU: Minsk, Belarus, 2018; p. 262. (In Russian) [Google Scholar]
- DSTU BV.2.7-82:2010; Construction Materials. Gypsum Binder. Technical Conditions. (Ukrainian Standard). SE “Ukrainian Scientific Research and Design Institute of Building Materials and Products”: Kyiv, Ukraine, 2010; p. 29.
- EN 12390-1:2021; Testing Hardened Concrete—Part 1: Shape, Dimensions and Other Requirements for Specimens and Moulds. CEN: Brussels, Belgium, 2021.
- Lichnov, I.; Kahanov, V. Vibro-pressed Concrete in Ukraine: Problems, Trends and Prospects for Development. In Lecture Notes in Civil Engineering, Proceedings of the CEE, Rzeszów, Poland 6–8 September 2023; Blikharskyy, Z., Koszelnik, P., Lichołai, L., Nazarko, P., Katunský, D., Eds.; Springer: Cham, Switzerland, 2024; Volume 438. [Google Scholar] [CrossRef]
- Box, G.E.P.; Hunter, J.S.; Hunter, W.G. Statistics for Experimenters: Design, Discovery, and Innovation, 2nd ed.; Wiley: Hoboken, NJ, USA, 2005; p. 655. [Google Scholar]
- Dvorkin, L.; Dvorkin, O.; Ribakov, Y. Mathematical Experiments Planning in Concrete Technology; Nova Science Publishers: New York, NY, USA, 2012; p. 172. [Google Scholar]
- TIBCO Statistica 14.0 Installation Guide. Available online: https://docs.tibco.com/pub/stat/14.0.0/doc/pdf/TIB_stat_14.0_installation.pdf (accessed on 13 July 2025).


| Type of Gypsum Binder | Properties of Gypsum Binder | |||||
|---|---|---|---|---|---|---|
| Normal Consistency, % | Setting Time, Min. | Fineness of Grinding (Residue on Sieve 0.2 mm) | Strength, MPa After 2 h. | |||
| Initial | Final | Compression | Bending | |||
| G 5 | 62 | 5 | 10 | 2.1 | 5.3 | 2.7 |
| G 10 | 55 | 4 | 12 | 1.3 | 10.8 | 4.7 |
| Sand Type | Partial Residues, % on Sieves with Opening Sizes, mm | Grain Content <0.16, % | Dust Particle Content, % | Fineness Modulus (Mf) | |||||
|---|---|---|---|---|---|---|---|---|---|
| 5 | 2.5 | 1.25 | 0.63 | 0.32 | 0.16 | ||||
| Sand 1 | 0.4 | 1.8 | 8.2 | 13.9 | 44.0 | 29.7 | 2.0 | 1.2 | 2.0 |
| Sand 2 | 1.6 | 9.6 | 25.7 | 33.8 | 18.6 | 12.1 | 1.1 | 0.2 | 3.0 |
| No. | Factors | Variation Levels | Variation Interval | |||
|---|---|---|---|---|---|---|
| Natural Type | Coded Type | −1 | 0 | +1 | ||
| 1 | Water–gypsum ratio (W/G) | X1 | 0.15 | 0.25 | 0.35 | 0.10 |
| 2 | Mass ratio of aggregate to gypsum, (A/G) | X2 | 0 | 1 | 2 | 1 |
| 3 | Duration of vibrocompacting, (τ, s) | X3 | 5 | 15 | 25 | 10 |
| 4 | Dynamic pressure value (P, MPa) | X4 | 0.012 | 0.062 | 0.112 | 0.05 |
| No. | Coded Values of Factors | Composition of Concrete Mix, kg/m3 | Values of Output Parameters | ||||||
|---|---|---|---|---|---|---|---|---|---|
| X1 | X2 | X3 | X4 | Gypsum | Aggregate (Sand) | Water | fc1d, MPa | ρo, kg/m3 | |
| 1 | +1 | +1 | +1 | +1 | 678 | 1356 | 237 | 7.82 | 1938 |
| 2 | +1 | +1 | +1 | −1 | 678 | 1356 | 237 | 3.85 | 1910 |
| 3 | +1 | +1 | −1 | +1 | 678 | 1356 | 237 | 5.08 | 1949 |
| 4 | +1 | +1 | −1 | −1 | 678 | 1356 | 237 | 1.28 | 1825 |
| 5 | +1 | −1 | +1 | +1 | 1388 | 0 | 486 | 14.17 | 1708 |
| 6 | +1 | −1 | +1 | −1 | 1388 | 0 | 486 | 9.88 | 1645 |
| 7 | +1 | −1 | −1 | +1 | 1388 | 0 | 486 | 10.71 | 1836 |
| 8 | +1 | −1 | −1 | −1 | 1388 | 0 | 486 | 6.33 | 1714 |
| 9 | −1 | +1 | +1 | +1 | 784 | 1569 | 118 | 2.63 | 1772 |
| 10 | −1 | +1 | +1 | −1 | 784 | 1569 | 118 | 1.04 | 1640 |
| 11 | −1 | +1 | −1 | +1 | 784 | 1569 | 118 | 1.92 | 1730 |
| 12 | −1 | +1 | −1 | −1 | 784 | 1569 | 118 | 0.82 | 1559 |
| 13 | −1 | −1 | +1 | +1 | 1922 | 0 | 288 | 5.43 | 1504 |
| 14 | −1 | −1 | +1 | −1 | 1922 | 0 | 288 | 3.51 | 1225 |
| 15 | −1 | −1 | −1 | +1 | 1922 | 0 | 288 | 4.12 | 1356 |
| 16 | −1 | −1 | −1 | −1 | 1922 | 0 | 288 | 2.98 | 1128 |
| 17 | +1 | 0 | 0 | 0 | 911 | 911 | 319 | 9.41 | 1901 |
| 18 | −1 | 0 | 0 | 0 | 1114 | 1114 | 167 | 6.97 | 1687 |
| 19 | 0 | +1 | 0 | 0 | 727 | 1454 | 182 | 7.41 | 1928 |
| 20 | 0 | −1 | 0 | 0 | 1612 | 0 | 403 | 19.23 | 1683 |
| 21 | 0 | 0 | +1 | 0 | 1002 | 1002 | 251 | 11.56 | 1906 |
| 22 | 0 | 0 | −1 | 0 | 1002 | 1002 | 251 | 9.45 | 1746 |
| 23 | 0 | 0 | 0 | +1 | 1002 | 1002 | 251 | 13.45 | 1915 |
| 24 | 0 | 0 | 0 | −1 | 1002 | 1002 | 251 | 6.23 | 1586 |
| 25 | 0 | 0 | 0 | 0 | 1002 | 1002 | 251 | 12.25 | 1830 |
| 26 | 0 | 0 | 0 | 0 | 1002 | 1002 | 251 | 12.10 | 1848 |
| 27 | 0 | 0 | 0 | 0 | 1002 | 1002 | 251 | 12.40 | 1854 |
| No. | Coded factors Value | Natural Factors Value | Compressive Strength, MPa | Average Density, kg/m3 | ||||||||
|---|---|---|---|---|---|---|---|---|---|---|---|---|
| V1 | V2 | V3 | X1 | X2 | Sand Fractions Content, % | A/G | W/G | |||||
| V1 (0–0.32 mm) | V2 (0.32–1.25 mm) | V3 (1.25–5 mm) | ||||||||||
| 1 | 1 | 0 | 0 | −1 | −1 | 35 | 40 | 25 | 1 | 0.15 | 1.8 | 1973 |
| 2 | 1 | 0 | 0 | +1 | +1 | 35 | 40 | 25 | 3 | 0.35 | 10.5 | 2433 |
| 3 | 0 | 1 | 0 | −1 | −1 | 5 | 70 | 25 | 1 | 0.15 | 5.8 | 2068 |
| 4 | 0 | 1 | 0 | +1 | −1 | 5 | 70 | 25 | 3 | 0.15 | 1.6 | 2141 |
| 5 | 0 | 1 | 0 | +1 | +1 | 5 | 70 | 25 | 3 | 0.35 | 8.5 | 2497 |
| 6 | 0 | 1 | 0 | −1 | +1 | 5 | 70 | 25 | 1 | 0.35 | 10.7 | 2218 |
| 7 | 0 | 0 | 1 | −1 | −1 | 5 | 40 | 55 | 1 | 0.15 | 5.8 | 2022 |
| 8 | 0 | 0 | 1 | +1 | 0 | 5 | 40 | 55 | 3 | 0.25 | 5.7 | 2191 |
| 9 | 0 | 0 | 1 | −1 | +1 | 5 | 40 | 55 | 1 | 0.35 | 9.0 | 2239 |
| 10 | 0 | 0.5 | 0.5 | 0 | 0 | 20 | 55 | 25 | 2 | 0,15 | 3.0 | 2071 |
| 11 | 0.8 | 0.2 | 0 | −1 | +1 | 29 | 46 | 25 | 1 | 0.35 | 10.4 | 2121 |
| 12 | 0.3 | 0 | 0.7 | +1 | +1 | 14 | 40 | 46 | 3 | 0.35 | 19.3 | 2414 |
| 13 | 0.5 | 0 | 0.5 | +1 | −1 | 20 | 40 | 40 | 3 | 0.15 | 1.1 | 2047 |
| 14 | 0.6 | 0 | 0.4 | 0 | 0 | 23 | 40 | 37 | 2 | 0.25 | 21.6 | 2341 |
| 15 | 0 | 0.4 | 0.6 | 0 | +1 | 5 | 52 | 43 | 2 | 0.15 | 5.9 | 2116 |
| 16 | 0 | 0.5 | 0.5 | −1 | 0 | 5 | 55 | 40 | 1 | 0.25 | 23.9 | 2220 |
| 17 | 0 | 0.5 | 0.5 | −1 | 0 | 5 | 55 | 40 | 1 | 0.25 | 24.3 | 2253 |
| 18 | 0 | 0.5 | 0.5 | −1 | 0 | 5 | 55 | 40 | 1 | 0.25 | 23.4 | 2240 |
| 19 | 0 | 0.5 | 0.5 | −1 | 0 | 5 | 55 | 40 | 1 | 0.25 | 22.9 | 2206 |
| No. | Factors | Variation Levels | Variation Interval | |||
|---|---|---|---|---|---|---|
| Natural Type | Coded Type | −1 | 0 | +1 | ||
| 1 | Sand fineness modulus, (Mf) | X1 | 2.0 | 2.5 | 3.0 | 0.5 |
| 2 | Gypsum’s strength, (Rg, MPa) | X2 | 5 | 7.5 | 10 | 2.5 |
| 3 | Mass ratio of aggregate to gypsum, (A/G) | X3 | 1 | 2 | 3 | 1 |
| No. | Coded Factors Value | Natural Factors Value | Values of Output Parameters | |||||||
|---|---|---|---|---|---|---|---|---|---|---|
| X1 | X2 | X3 | Mf | Rg, MPa | A/G | W/G | W, l/m3 | fc1d, MPa | Kc | |
| 1 | −1 | +1 | +1 | 2.0 | 10 | 3 | 0.23 | 69.6 | 18.8 | 0.90 |
| 2 | −1 | +1 | −1 | 2.0 | 10 | 1 | 0.16 | 95.1 | 39.2 | 0.96 |
| 3 | −1 | −1 | +1 | 2.0 | 5 | 3 | 0.29 | 88.5 | 12.3 | 0.86 |
| 4 | −1 | −1 | −1 | 2.0 | 5 | 1 | 0.23 | 142.4 | 19.6 | 0.89 |
| 5 | +1 | +1 | +1 | 3.0 | 10 | 3 | 0.20 | 60.1 | 21.9 | 0.94 |
| 6 | +1 | +1 | −1 | 3.0 | 10 | 1 | 0.14 | 82.5 | 42.8 | 0.96 |
| 7 | +1 | −1 | +1 | 3.0 | 5 | 3 | 0.27 | 82.2 | 16.7 | 0.89 |
| 8 | +1 | −1 | −1 | 3.0 | 5 | 1 | 0.22 | 129.8 | 21.6 | 0.88 |
| 9 | −1 | 0 | 0 | 2.0 | 7.5 | 2 | 0.24 | 94.9 | 23.6 | 0.91 |
| 10 | +1 | 0 | 0 | 3.0 | 7.5 | 2 | 0.22 | 86.5 | 25.4 | 0.94 |
| 11 | 0 | +1 | 0 | 2.5 | 10 | 2 | 0.18 | 73.1 | 39.8 | 0.96 |
| 12 | 0 | −1 | 0 | 2.5 | 5 | 2 | 0.25 | 102.5 | 17.7 | 0.89 |
| 13 | 0 | 0 | +1 | 2.5 | 7.5 | 3 | 0.25 | 75.9 | 17.5 | 0.91 |
| 14 | 0 | 0 | −1 | 2.5 | 7.5 | 1 | 0.19 | 112.1 | 29.5 | 0.92 |
| 15 | 0 | 0 | 0 | 2.5 | 7.5 | 2 | 0.23 | 90.7 | 25.7 | 0.92 |
| 16 | 0 | 0 | 0 | 2.5 | 7.5 | 2 | 0.23 | 91.0 | 26.1 | 0.91 |
| 17 | 0 | 0 | 0 | 2.5 | 7.5 | 2 | 0.23 | 91.0 | 25.4 | 0.93 |
| Concrete Class | A | A/G | (W/G)opt | Kc | Ve.a., l | G, kg/m3 | S, kg/m3 | W, l/m3 |
|---|---|---|---|---|---|---|---|---|
| C8/10 | G5 | 2.98 | 0.297 | 0.88 | 12.3 | 551 | 1643 | 163 |
| G7 | 3.21 | 0.257 | 0.91 | 8.5 | 527 | 1690 | 136 | |
| G10 | 3.65 | 0.234 | 0.95 | 5.0 | 484 | 1766 | 113 | |
| C12/15 | G5 | 2.24 | 0.284 | 0.89 | 10.8 | 660 | 1476 | 187 |
| G7 | 2.69 | 0.249 | 0.92 | 7.6 | 592 | 1591 | 147 | |
| G10 | 3.27 | 0.227 | 0.96 | 4.3 | 522 | 1708 | 119 | |
| C16/20 | G5 | - | - | - | - | - | - | - |
| G7 | 1.99 | 0.237 | 0.93 | 7.3 | 709 | 1409 | 168 | |
| G10 | 2.84 | 0.220 | 0.96 | 3.9 | 573 | 1629 | 126 | |
| C20/25 | G5 | - | - | - | - | - | - | - |
| G7 | - | - | - | - | - | - | - | |
| G10 | 2.32 | 0.211 | 0.96 | 3.9 | 650 | 1510 | 137 |
Disclaimer/Publisher’s Note: The statements, opinions and data contained in all publications are solely those of the individual author(s) and contributor(s) and not of MDPI and/or the editor(s). MDPI and/or the editor(s) disclaim responsibility for any injury to people or property resulting from any ideas, methods, instructions or products referred to in the content. |
© 2025 by the authors. Licensee MDPI, Basel, Switzerland. This article is an open access article distributed under the terms and conditions of the Creative Commons Attribution (CC BY) license (https://creativecommons.org/licenses/by/4.0/).
Share and Cite
Dvorkin, L.; Zhitkovsky, V.; Ribakov, Y. Design of Technological Parameters for Vibrocompression of Gypsum Concrete. Materials 2025, 18, 3902. https://doi.org/10.3390/ma18163902
Dvorkin L, Zhitkovsky V, Ribakov Y. Design of Technological Parameters for Vibrocompression of Gypsum Concrete. Materials. 2025; 18(16):3902. https://doi.org/10.3390/ma18163902
Chicago/Turabian StyleDvorkin, Leonid, Vadim Zhitkovsky, and Yuri Ribakov. 2025. "Design of Technological Parameters for Vibrocompression of Gypsum Concrete" Materials 18, no. 16: 3902. https://doi.org/10.3390/ma18163902
APA StyleDvorkin, L., Zhitkovsky, V., & Ribakov, Y. (2025). Design of Technological Parameters for Vibrocompression of Gypsum Concrete. Materials, 18(16), 3902. https://doi.org/10.3390/ma18163902


