Article

The Development of a Fatigue Failure Prediction Model for Bitumen Based on a Novel Accelerated Cyclic Shear Test

Department of Civil and Environmental Engineering, Washington State University, Pullman, WA 99163, USA
*
Author to whom correspondence should be addressed.
Materials 2025, 18(16), 3729; https://doi.org/10.3390/ma18163729
Submission received: 14 July 2025 / Revised: 29 July 2025 / Accepted: 7 August 2025 / Published: 8 August 2025
(This article belongs to the Special Issue Material Characterization, Design and Modeling of Asphalt Pavements)

Abstract

Fatigue failure of bitumen significantly influences the durability and service life of asphalt pavement. Current fatigue tests have drawbacks such as long durations, unrealistic traffic loading simulations, and difficulties of identifying failure mechanisms. Similarly, existing prediction models are often overly complex and inaccurate. To solve these drawbacks, in this study, a novel accelerated cyclic shear test in stress-controlled mode using a dynamic shear rheometer was introduced to evaluate the fatigue performance and reveal the fatigue failure mechanism of bitumen. The sigmoidal function was applied to develop a simplified fatigue failure prediction model for bitumen through stress and temperature shifts. The results demonstrate that bitumen’s response under the newly proposed loading method aligns consistently with behaviour characteristic of a plasticity-controlled failure mechanism. The variable parameter load ratio significantly influenced the bitumen’s time-to-failure, which increased as the load ratio decreased. Bitumen exhibited the longest time-to-failure when the load ratio (minimum stress/maximum stress) was 0.1. The developed model effectively predicted the time-to-failure of bitumen across different load ratios and under various temperature and stress conditions.

1. Introduction

Fatigue failure represents a critical concern for asphalt pavement throughout its service life [1,2]. Repeated traffic loading and varying climatic conditions contribute to the progressive development of permanent deformation and microdamage, ultimately resulting in fatigue damage and eventual failure. Fatigue failure typically occurs either at the bitumen–aggregate interface, leading to adhesive failure, or within the bitumen itself, resulting in cohesive failure [3,4]. Bitumen also interacts with mineral filler to form asphalt mastic, whose fatigue resistance is significantly influenced by both the origin and the quantity of the filler [5]. As the binder is between aggregate particles, bitumen is critical to the fatigue resistance of asphalt mixtures. Therefore, evaluating its performance accurately prior to field application is essential.
The strategic highway research program (SHRP) introduced the fatigue factor (G*sinδ), measured through a dynamic shear rheometer (DSR) oscillation test, as an early rheological parameter for quantifying the fatigue resistance of bitumen [6]. However, its validity has been questioned, as G*sinδ is a stiffness-based parameter measured under simplified conditions that fails to accurately reflect the complex loading and temperature variations experienced by bitumen in real-world pavement [7,8,9,10]. The Glover–Rowe parameter ( G 2 / G ) is another fatigue index that was proposed to assess the fatigue resistance of bitumen [11,12]. Ilyin and Yadykova [13] applied equation G 2 G < 1.8 · 10 5 P a at an angular frequency of 0.005 rad/s and a temperature of 15 °C to investigate the fatigue resistance of bitumen. The time sweep (TS) test is a well-established method for assessing the fatigue properties of bitumen. Numerous researchers have developed viscoelastic indices and fatigue failure criteria based on TS experimental studies to improve our understanding of bitumen fatigue behaviour [10,14,15,16,17]. However, some fatigue criteria depend on the applied load-controlled mode (stress-controlled or strain-controlled), such as the plateau value (PV) energy parameter [18,19]. Additionally, the TS test is time-consuming due to its slow damage growth. The TS test typically applies load amplitudes within the linear viscoelastic (LVE) range of bitumen. However, in real-world conditions, bitumen often experiences loading beyond this range, leading to nonlinear viscoelastic and viscoplastic responses [6,20]. Chen et al. [21] reported that the damage resistance of bitumen under large-amplitude fatigue loading exhibits a stronger correlation with the fatigue performance of asphalt mixtures, as compared to small-amplitude fatigue loadings. Concurrently, extensive research has been conducted to develop novel fatigue tests for bitumen. Bahia and colleagues developed the linear amplitude sweep (LAS) test [22], which subjects bitumen to oscillatory shear strain with progressively increasing amplitudes until failure occurs. When combined with viscoelastic continuum damage (VECD) analysis, the LAS test has been effectively utilized for fatigue evaluation [23,24,25]. Zhang and Oeser [26] observed that the damage mechanism of bitumen varies with the applied load amplitude, which means that different load amplitudes potentially reflect distinct fatigue failure mechanisms. From a rheological perspective, bitumen exhibits increased flow behaviour under high shear stresses, indicating that plastic flow damage predominates the deterioration process [26,27].
Most current research primarily investigates the damage and failure of bitumen based on its viscoelastic response, while relatively few studies have investigated the significant influence of plasticity on the deformation and failure mechanism of bitumen. Unlike elastic deformation, which is reversible upon unloading, plastic deformation leads to permanent strain accumulation. For instance, in DSR tests at high temperatures or stress/strain amplitudes, bitumen may exhibit irreversible deformation, which cannot be characterized by purely viscoelastic models. Studies [28,29,30] on polymers have consistently emphasized the crucial role of plastic components in materials’ fatigue failure by defining a plasticity-controlled failure mechanism. Some studies [28,31,32] have demonstrated that plasticity controlling can assess the failure mechanisms of polymers in both cyclic and creep tests. Bitumen exhibits behaviour similar to these polymers, characterized by increased molecular mobility and progressive deformation under specific loading conditions, ultimately leading to a constant plastic flow [11,33,34]. Therefore, it is essential to improve existing methods by considering plasticity. This will enhance the understanding of the plastic flow and failure of bitumen from a plasticity perspective and support the development of more accurate prediction models.
This study aims to bridge existing gaps and enhance the evaluation of the fatigue performance of bitumen under diverse loading paths. A novel stress-controlled accelerated cyclic shear test was developed by regulating the load ratio R (R = minimum stress/maximum stress) through varying oscillation amplitudes while maintaining the steady stress, which can effectively combine features of both creep and cyclic loading tests. A new index, time-to-failure (tf), was defined as the key parameter of fatigue behaviour. The fatigue failure mechanism of bitumen under the novel loading mode was investigated. A sigmoidal function was utilized to develop a fatigue failure model capable of predicting fatigue behaviour across various R values, stress levels, and temperatures. The model’s accuracy was validated by comparing the experimental results with the predicted results generated by the developed fatigue model.

2. Methodology

2.1. Accelerated Cyclic Shear Test

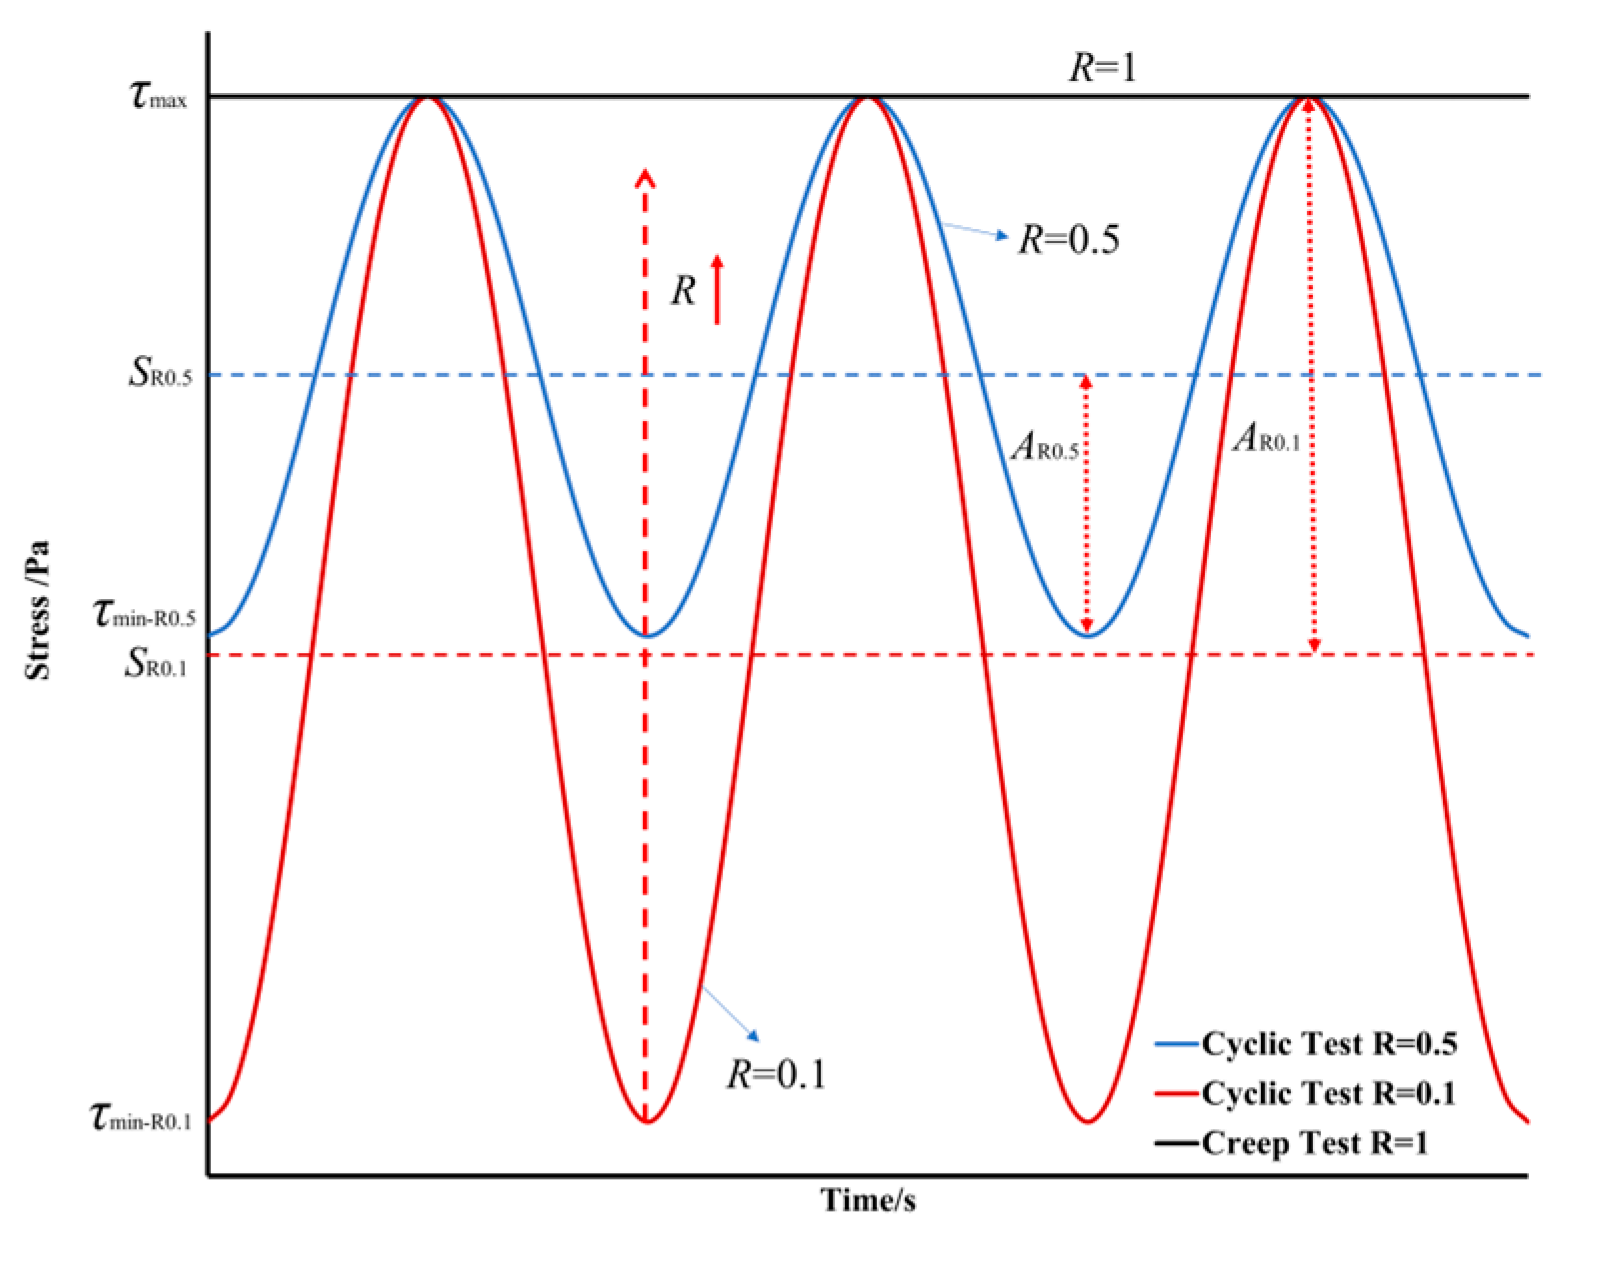
The cyclic loading test is a commonly employed method for assessing the fatigue performance of bitumen. However, under the bidirectional sinusoidal oscillating loading that is commonly applied by the DSR, as shown in Figure 1a, the resulting plastic deformation is partially offset, introducing challenges in accurately estimating the fatigue life of bitumen under realistic traffic loading. To address this drawback, this study introduces an accelerated cyclic shear test by incorporating the static loading and cyclic sinusoidal loading to achieve new unidirectional sinusoidal cyclic loading, as shown in Figure 1b. This loading can be characterized by the maximum stress (τmax), minimum stress (τmin), steady stress (S), and load amplitude (A). These parameters are expressed in terms of load ratio (R), as defined in Equation (1). This loading mode establishes a correlation between the creep test and cyclic test through R, as the cyclic test with R = 1 is the creep test. The details of the applied cyclic loads are illustrated in Figure 2. It can be found that a load ratio of R = 1 corresponds to creep tests, while values of R < 1 indicate cyclic tests. Furthermore, as the R decreases, the load amplitude increases.
R = τ m i n τ m a x = τ m i n 2 A + τ m i n
where R is the load ratio, τmin is the minimum value of the cyclic load, τmax is the maximum value of the cyclic load, and A is the cyclic load amplitude.
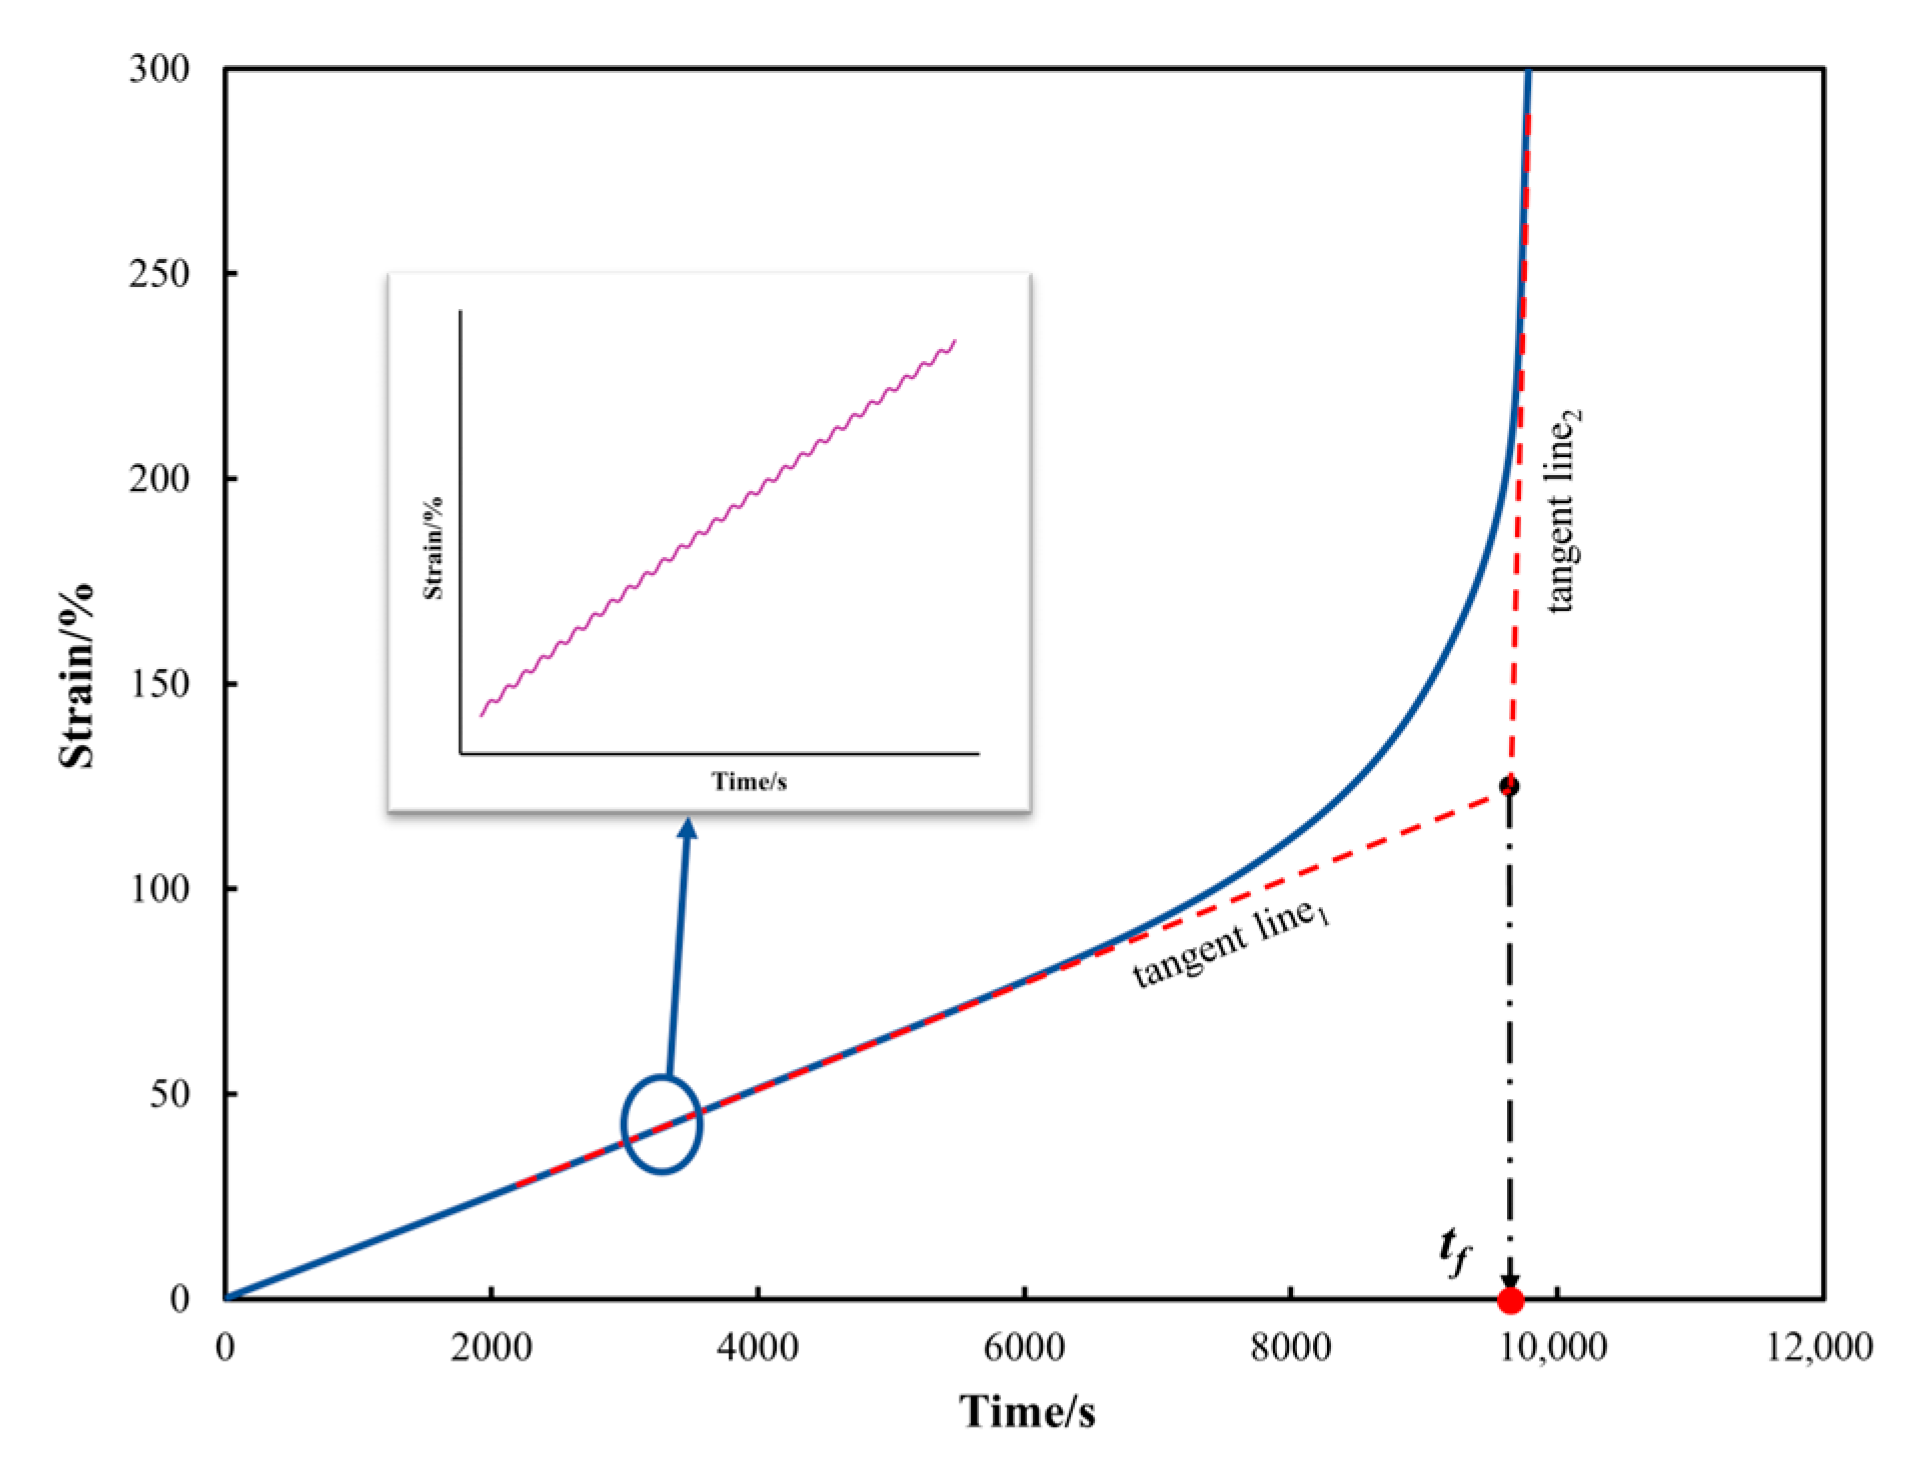
In this study, a new time-to-failure (tf) index is defined using a straightforward geometrical method to represent the fatigue failure of bitumen, which overcomes the complex calculations associated with existing failure indices. The tf is defined as the time corresponding to the intersection point of the tangents of the second and third stages of the accumulated strain curve. Figure 3 is the schematic illustration of the geometric method used to determine the tf under the novel accelerated cyclic shear test.

2.2. Materials and Experiments

The PG58-28 and PG64-22 bitumen used in this study were randomly sourced from Washington and Idaho States in the United States, respectively. The properties of the bitumen are listed in Table 1. Given that the accelerated cyclic shear test introduced in this study represents a novel experimental method, only the two original (unmodified and unaged) bitumen types were evaluated in this study. Modified and aged bitumen were not considered in this study but will be addressed in future research.
All tests in this study were performed under a stress-controlled model by a Malvern Gemini 150 dynamic shear rheometer (DSR) with an 8 mm diameter plate and 2 mm gap parallel plates setup according to AASHTO T 315 [35]. The selection of test temperatures in this study considered the high-temperature limitation of the 8 mm parallel plate setup and the potential risk of debonding at the interface between the parallel plates and specimen. Therefore, the selected temperatures were in the medium temperature range of 20–45 °C. To ensure accurate deformation data, all tests were conducted in duplicate, and the results reported in this paper represent the average values of the two measurements. Creep tests (R = 1) and cyclic tests (R < 1) were performed over a wide range of stresses that were carefully chosen for each bitumen and temperature to obtain failure within a time scale ranging from 102 s to 105 s. The R was changed according to the test requirements for every cyclic test, which was set to increase gradually from 0.1 to 1 (R = 0.1, 0.3, 0.5, 0.7, 1). In all cyclic tests, the loading frequency was maintained at a constant 10 Hz. The test matrixes are listed in Table 2. The tf was utilized as an evaluation index for assessing the failure of bitumen. For the test results, data obtained at 20 °C, 35 °C, and 45 °C were used for the analysis and development of the fatigue failure model, while the experimental data at 30 °C and 40 °C were reserved for model validation.

3. Results and Analysis

3.1. Time-to-Failure

Figure 4 illustrates the relationship between the R and the tf for PG58-28 and PG64-22 bitumen under various stresses and temperatures. Under the same maximum stress, the tf decreases as the R increases, with the load ratio of R = 1 corresponding to the minimum tf. This finding indicates that bitumen exhibits a longer failure duration under unidirectional cyclic loading compared to creep testing. This phenomenon is attributed to the reduced accumulation of plastic strain during cyclic loading compared to static loading under the same maximum stress. Among all the tested R values, the bitumen exhibits the longest tf at R = 0.1 across all temperature conditions. Furthermore, the PG64-22 bitumen exhibits a longer tf than the PG58-28 bitumen under the same maximum stress, R value, and temperature, indicating its superior resistance to shear-induced plastic flow.
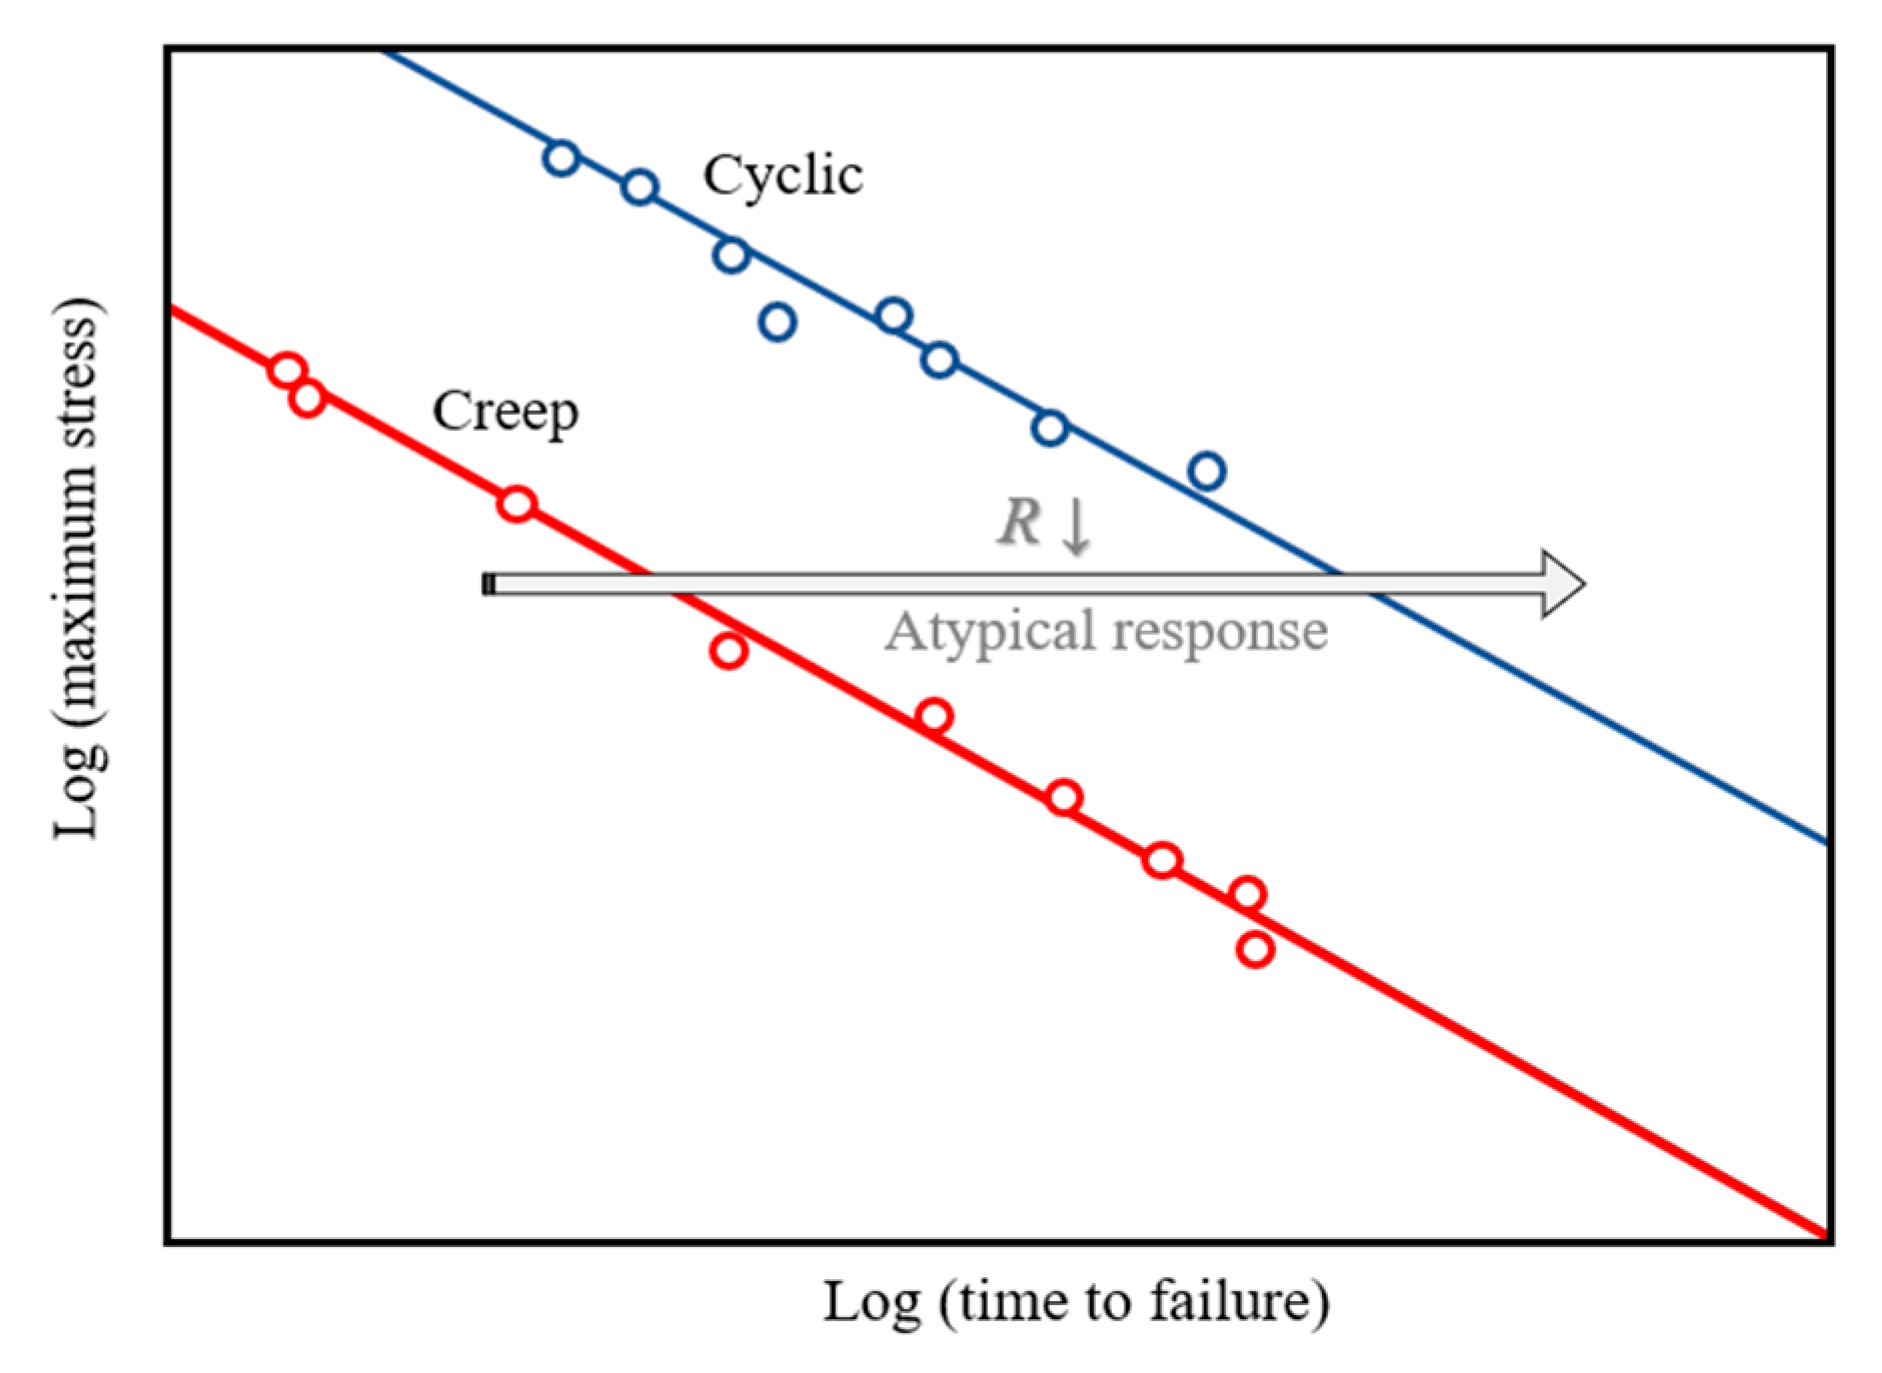
Several researchers [28,29,30] have reported that the average stress level in unidirectional cyclic loading is lower than that in creep loading under the same maximum stress. Consequently, this results in reduced plastic accumulation and an extended material lifetime. This phenomenon, referred to as the “atypical response”, is illustrated in Figure 5. Kanters et al. [36] attributed the “atypical response” to a failure mechanism governed by the mean stress, referred to as plasticity-controlled failure. Moreover, several studies [31,32,36,37] have suggested that the tf is the most reliable characterization for evaluating a material’s failure in creep and cyclic tests. Therefore, this study investigates whether bitumen exhibits characteristics consistent with plasticity-controlled failure.
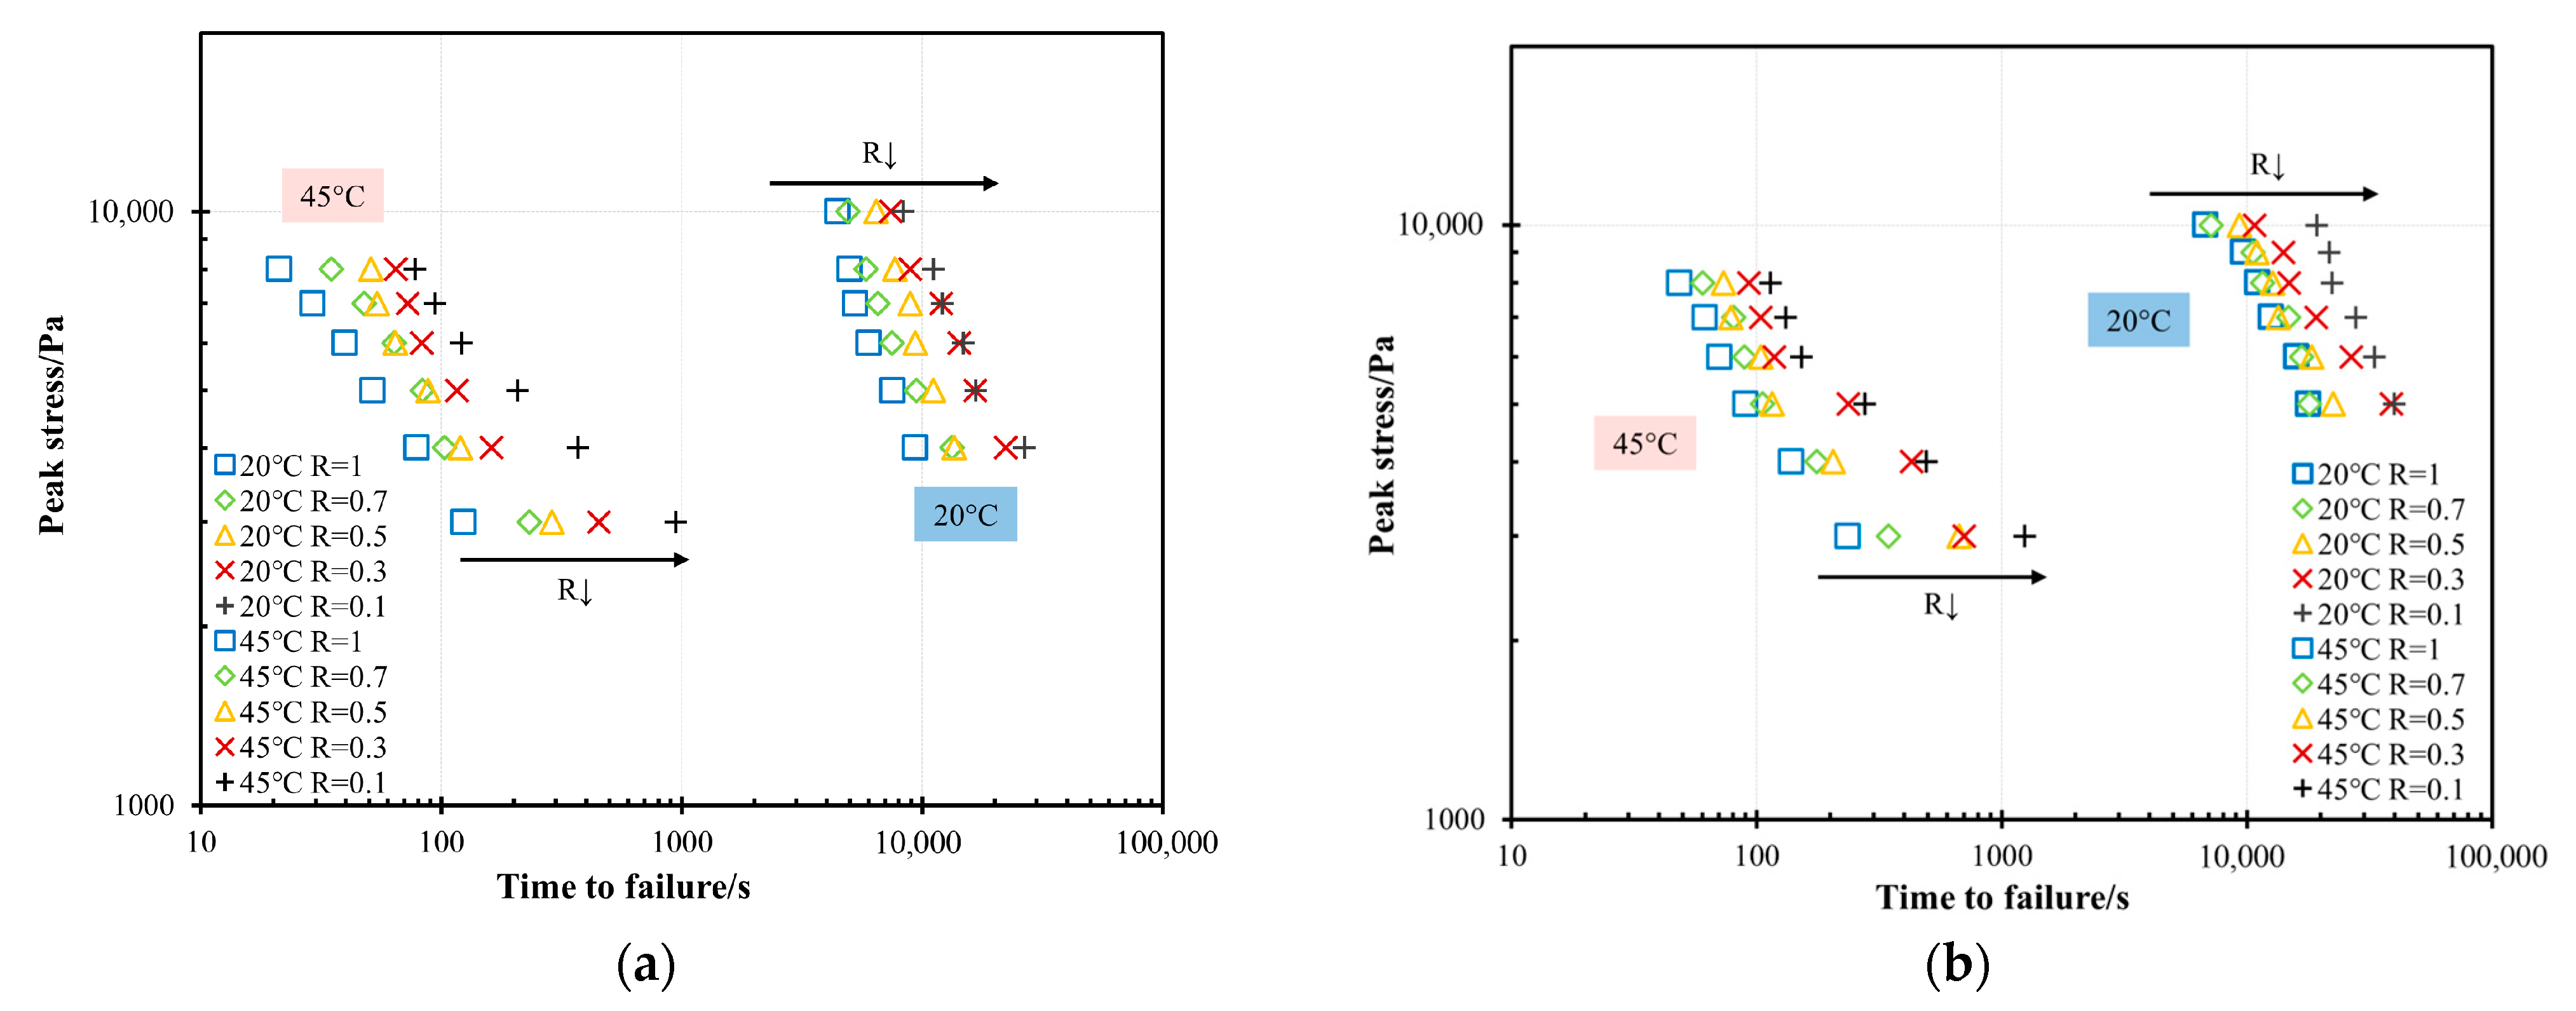
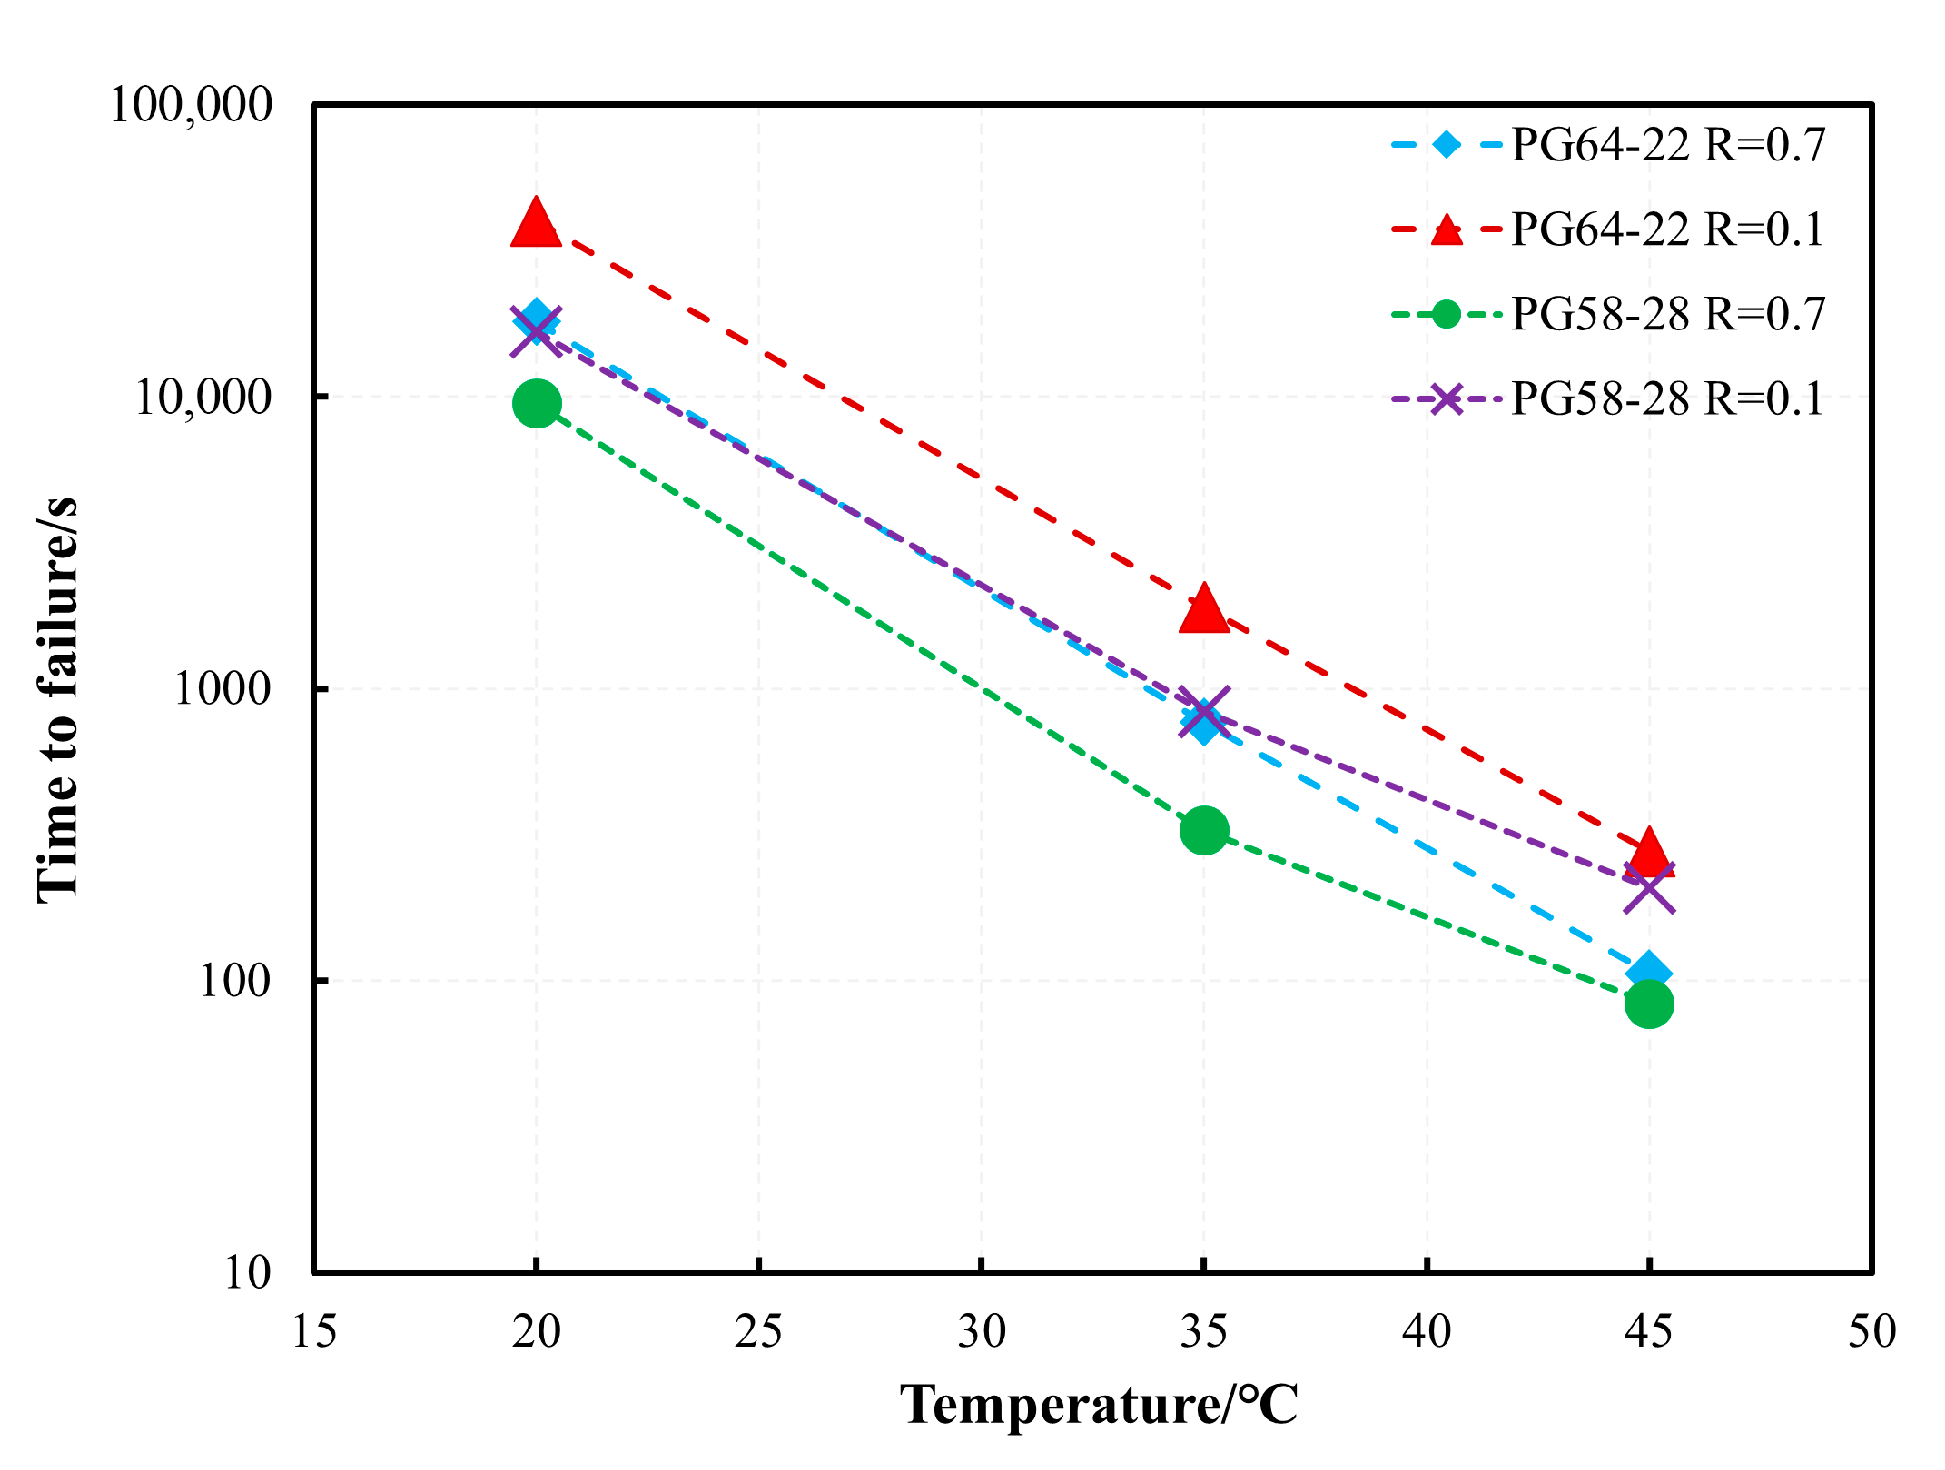
Figure 6 illustrates the relationship between the maximum stress and tf for PG58-28 and PG64-22 bitumen at 20 °C and 45 °C. As expected, an increase in maximum stress led to a gradual decrease in tf at the same temperature and R value. This phenomenon is attributed to elevated stress enhancing bitumen mobility, leading to a more rapid accumulation of plastic deformation over time and consequently a shorter tf. A key observation is that the evolutionary trend of the test data aligns entirely with the “atypical response” described above, indicating that the failure mechanism of bitumen under the accelerated cyclic shear loading is governed by plasticity-controlled failure. The influence of temperature on the tf of both bitumen types is also shown in Figure 6. With the increasing temperature, the plastic flow of bitumen intensifies, accelerating the accumulation of plastic deformation and leading to a shorter tf. Using a maximum stress of 5000 Pa as an example, Figure 7 illustrates the relationship between temperature and tf for PG58-28 and PG64-22 bitumen at R = 0.1 and R = 0.7. The results show that the tf at 20 °C is two orders of magnitude greater than at 45 °C, emphasizing the significant influence of temperature on bitumen’s fatigue failure.

3.2. Model Development

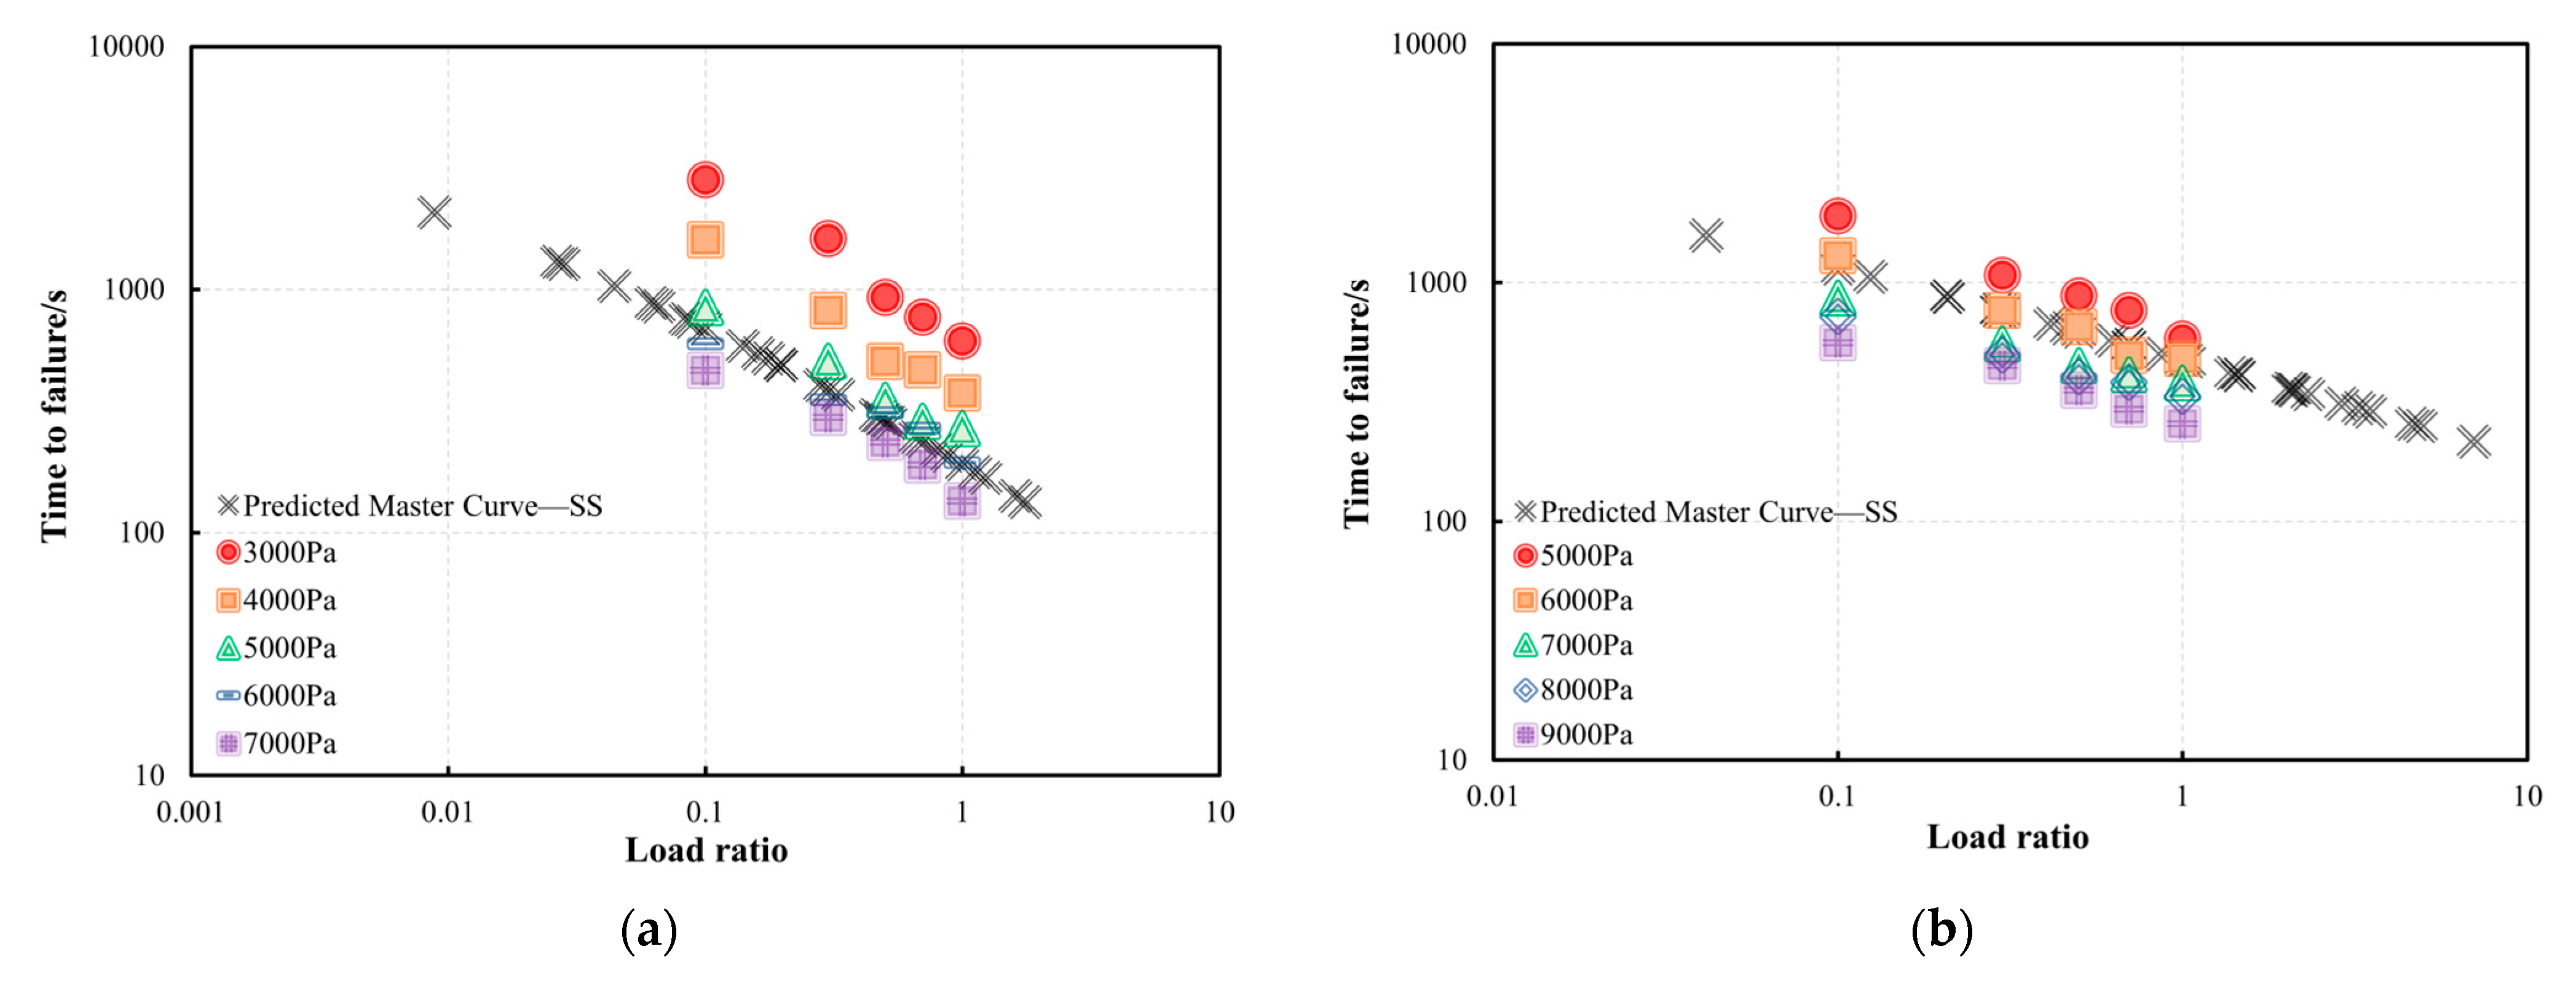
To develop a predictive model for the tf of bitumen in the accelerated cyclic shear test, a sigmoidal function, as presented in Equation (2), was employed to establish the relationship between the R and tf across a broad range of temperatures and stresses. The modelling process consists of two steps: a stress shift to a reference stress, followed by a temperature shift to a reference temperature. In the stress shift process, the relationship between tf and R for a given stress, represented in double logarithmic coordinates, can be horizontally shifted to a reference stress to construct a master curve. Similarly, in the temperature shift process, the tf-R relationship at different temperatures can be further shifted to generate a master curve at the reference temperature. However, when accounting for plasticity-controlled failure, these horizontal shifts deviate from the traditional time–temperature superposition principle applicable within the viscoelastic range [38,39].
l o g t f = a + b 1 + 1 e x p d + e l o g R
where R is the load ratio, tf is the time-to-failure, and a, b, d, and e are the regression coefficients.

3.2.1. Stress Shift

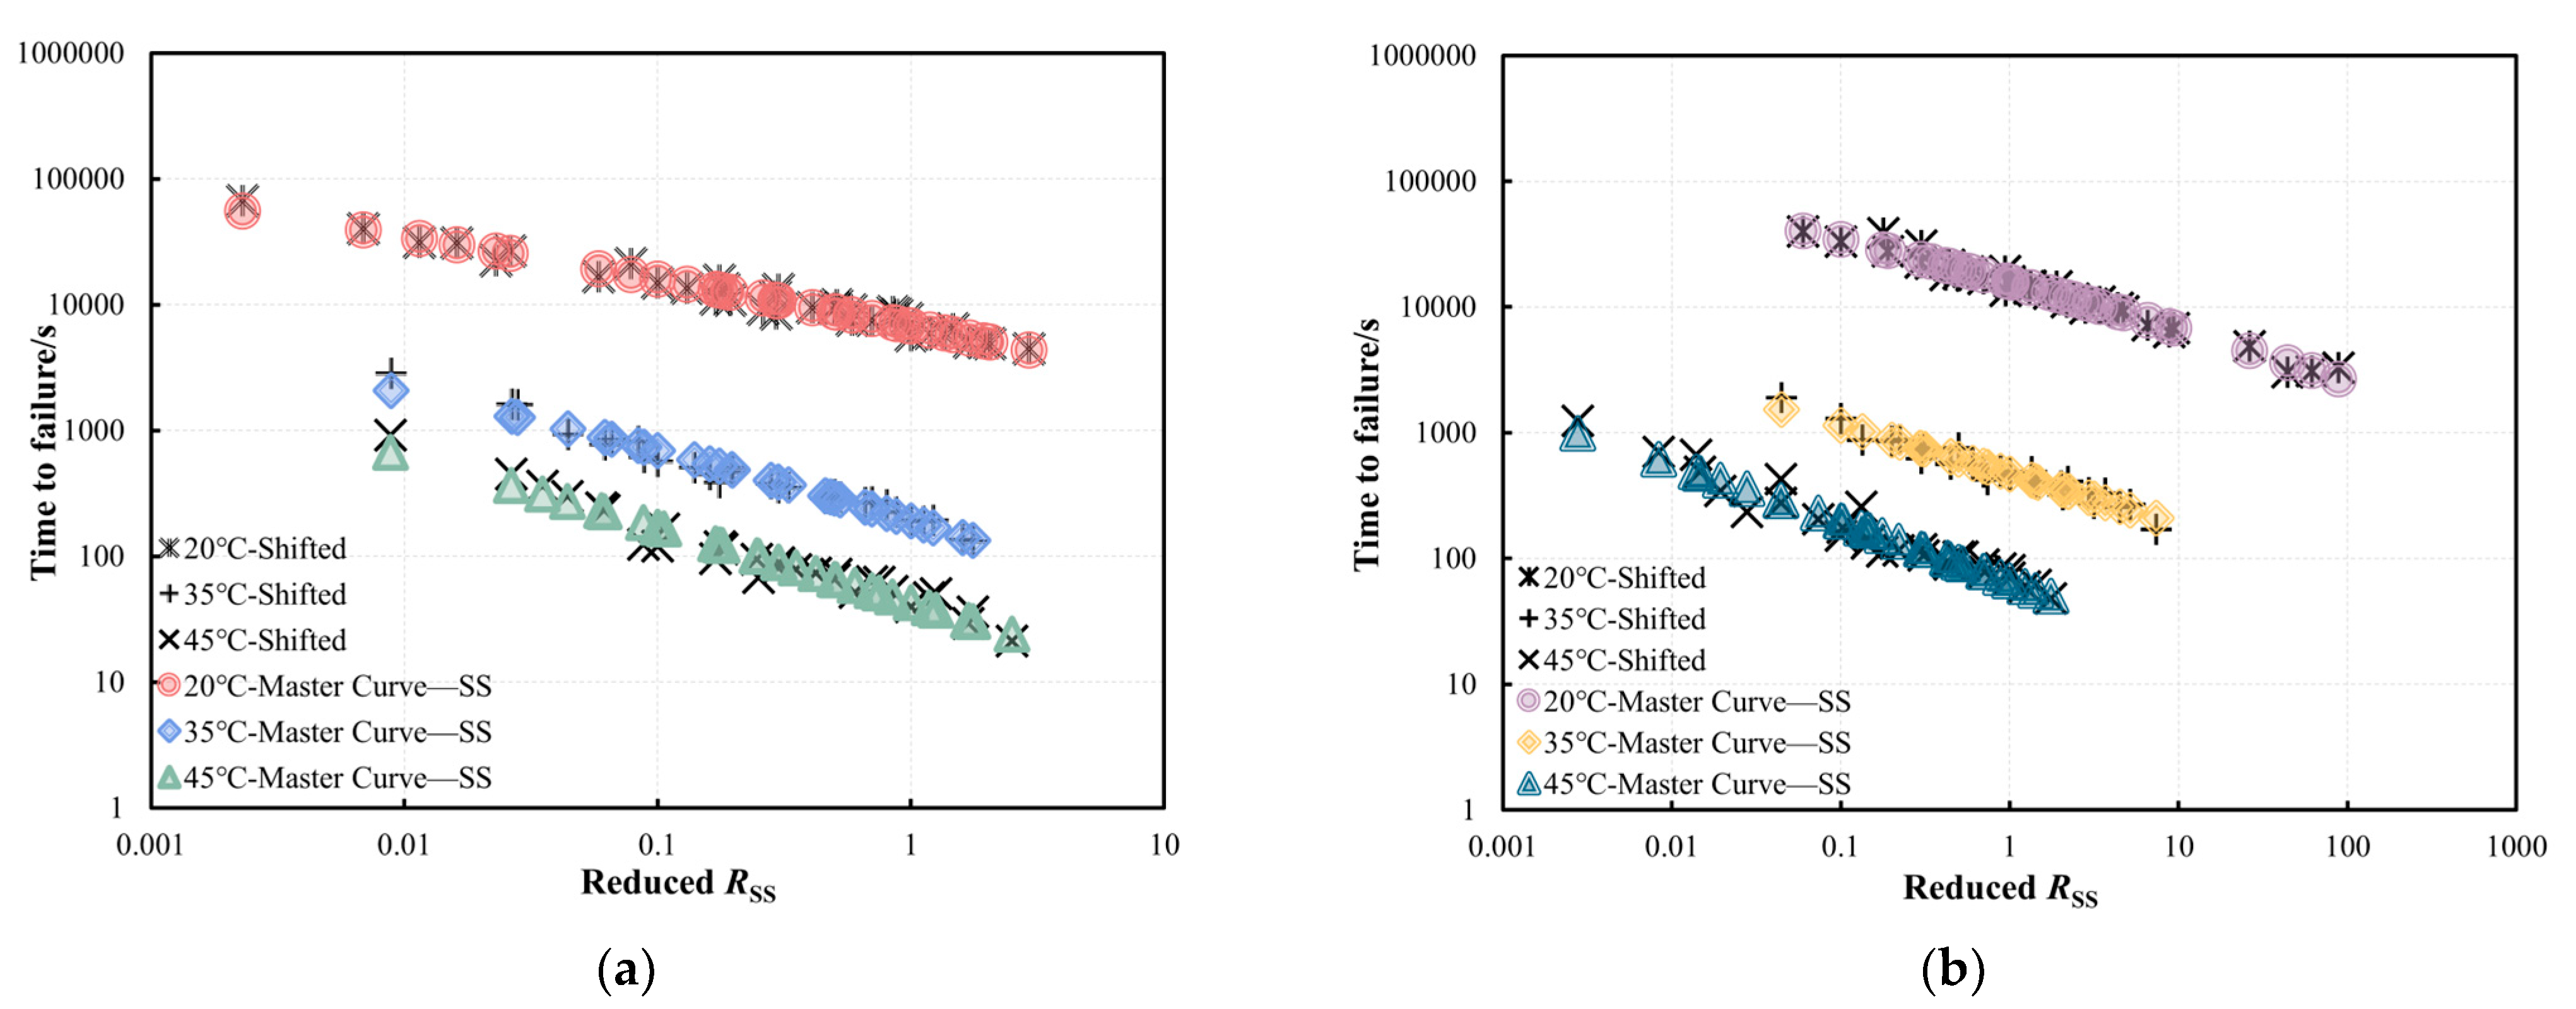
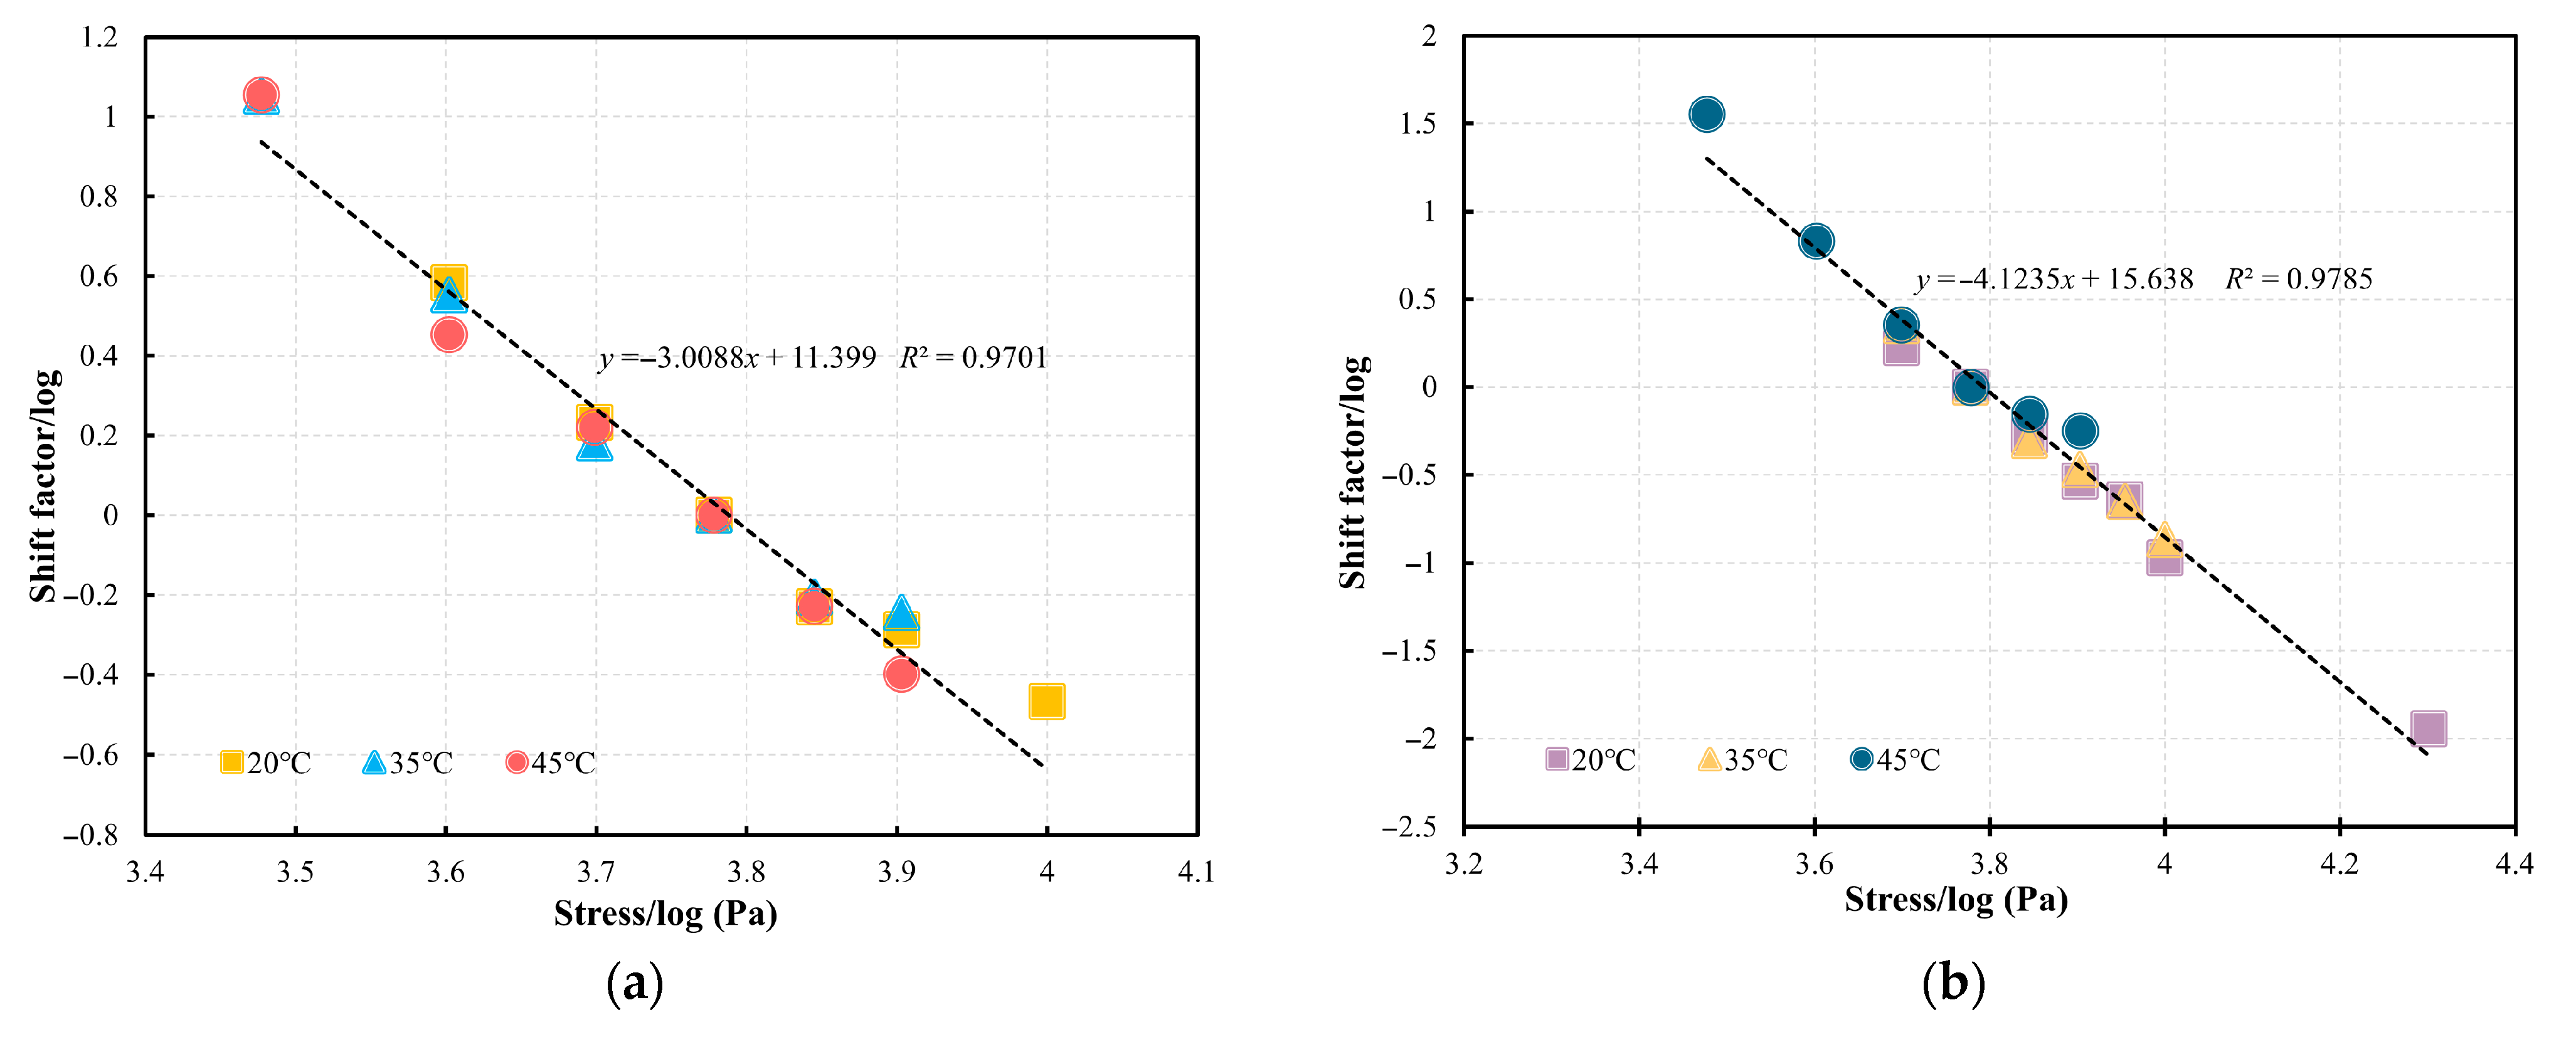
The master curves for PG58-28 and PG64-22 bitumen were initially developed through stress shift (SS) at 35 °C with 6000 Pa as the reference stress as an example, as shown in Figure 8. Once the master curve is established by the SS, the predicated tf under various stresses at 35 °C can be determined by using the developed failure prediction model that incorporates the R after shifting. For example, under low-stress conditions that are time-consuming, the tf can be estimated by performing cyclic tests at higher stresses with specific R values and applying appropriate shift factors. Similarly, the master curves for the two bitumen types at 20 °C and 45 °C referenced at a stress level of 6000 Pa can be constructed as shown in Figure 9. The obtained sigmoidal model parameters are listed in Table 3. The shift factors obtained from the SS for PG58-28 and PG64-22 bitumen are presented in Figure 10a,b, respectively. At 20 °C, 35 °C, and 45 °C, significant overlaps are observed in the relationships between the logarithmic shift factors and logarithmic stresses for both types of bitumen. This suggests that the relationship between shift factors and stresses established at a single temperature can be utilized to predict the tf at other temperatures. As a result, the influence of temperature can be neglected, allowing a unified linear relationship to be applied for fitting. In the subsequent sections, the fitted linear equations will be utilized to validate the failure prediction model.

3.2.2. Temperature Shift

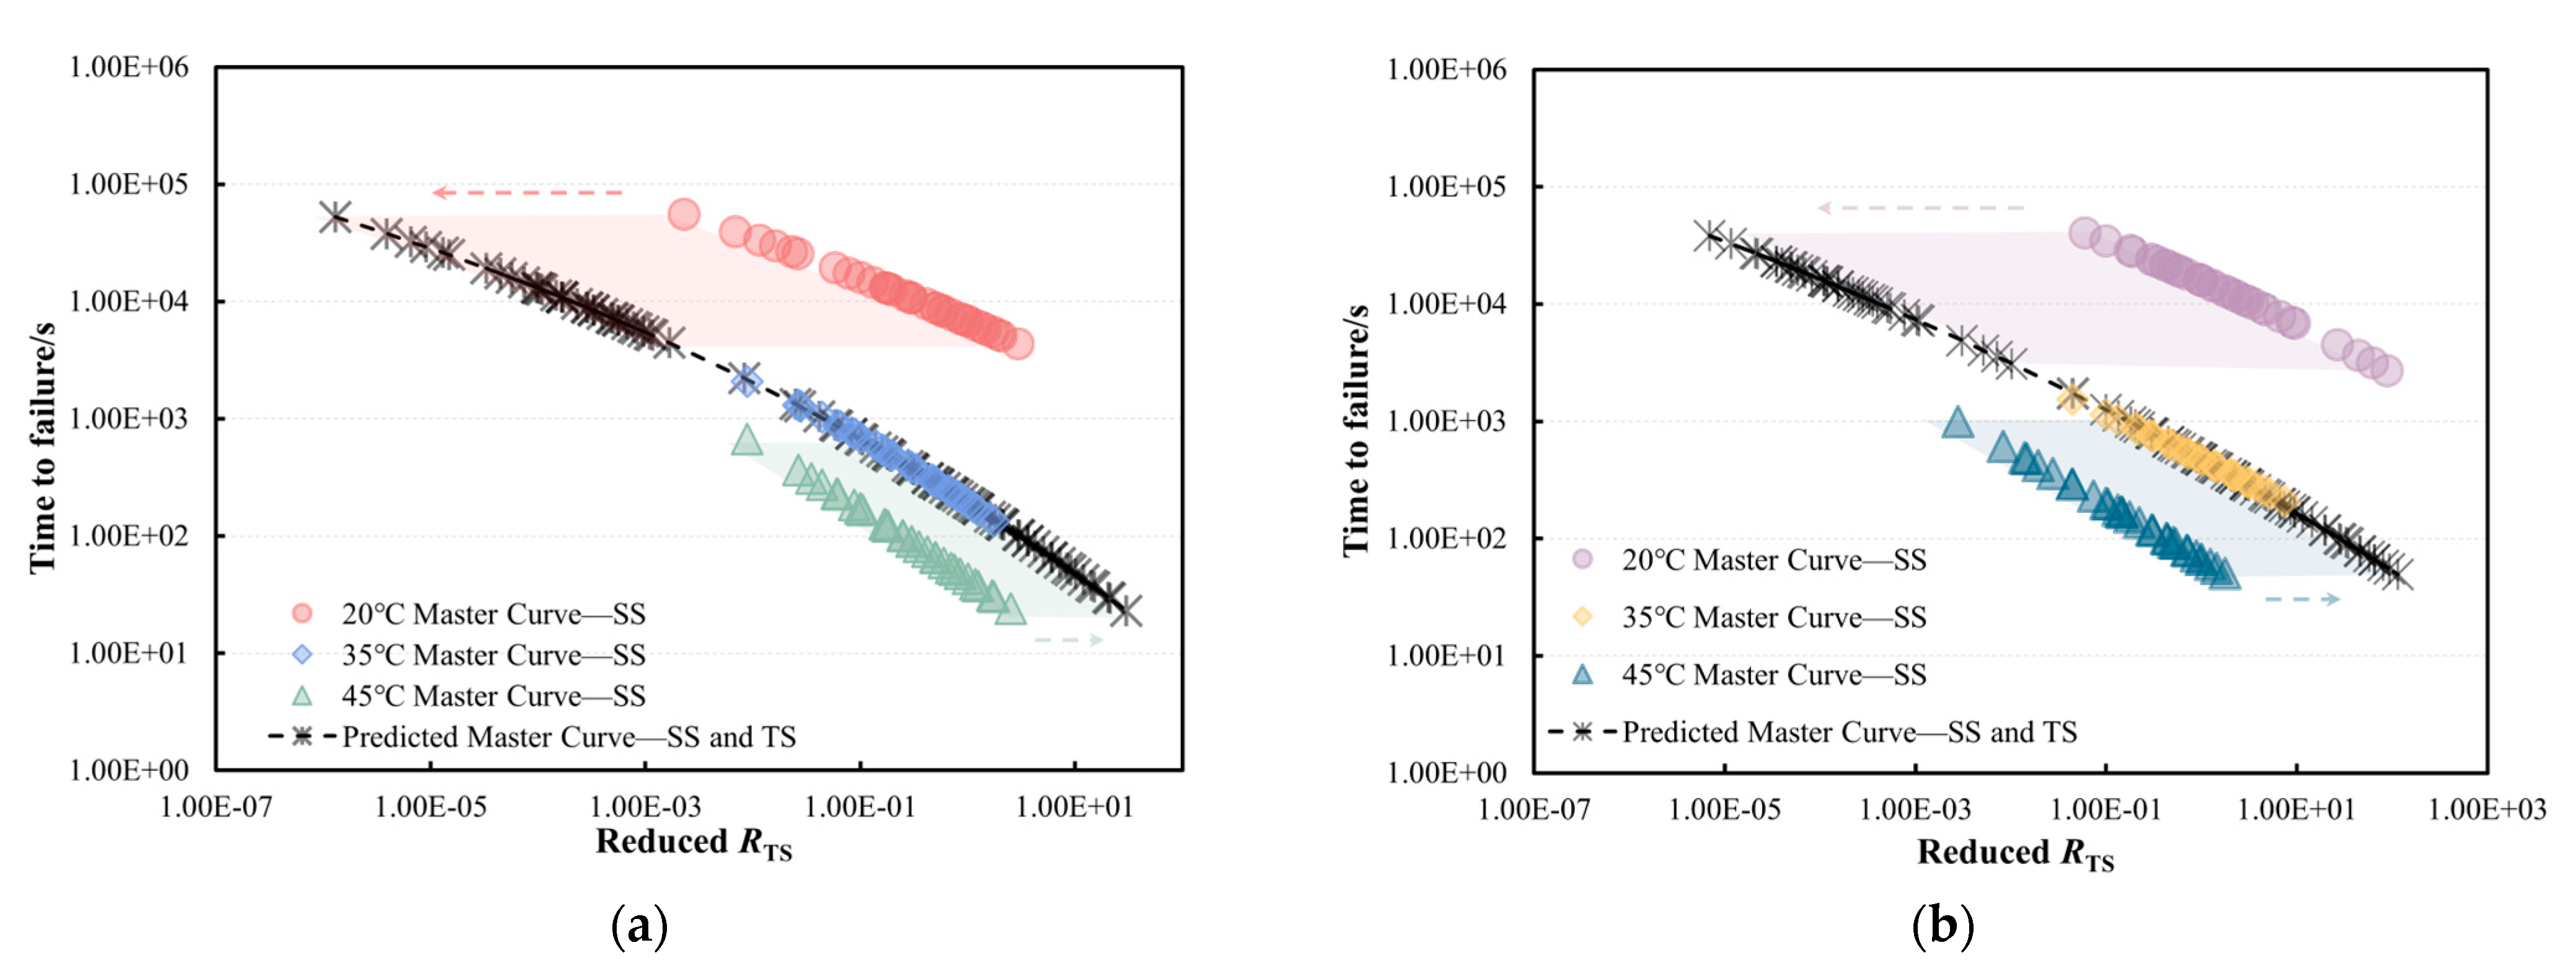
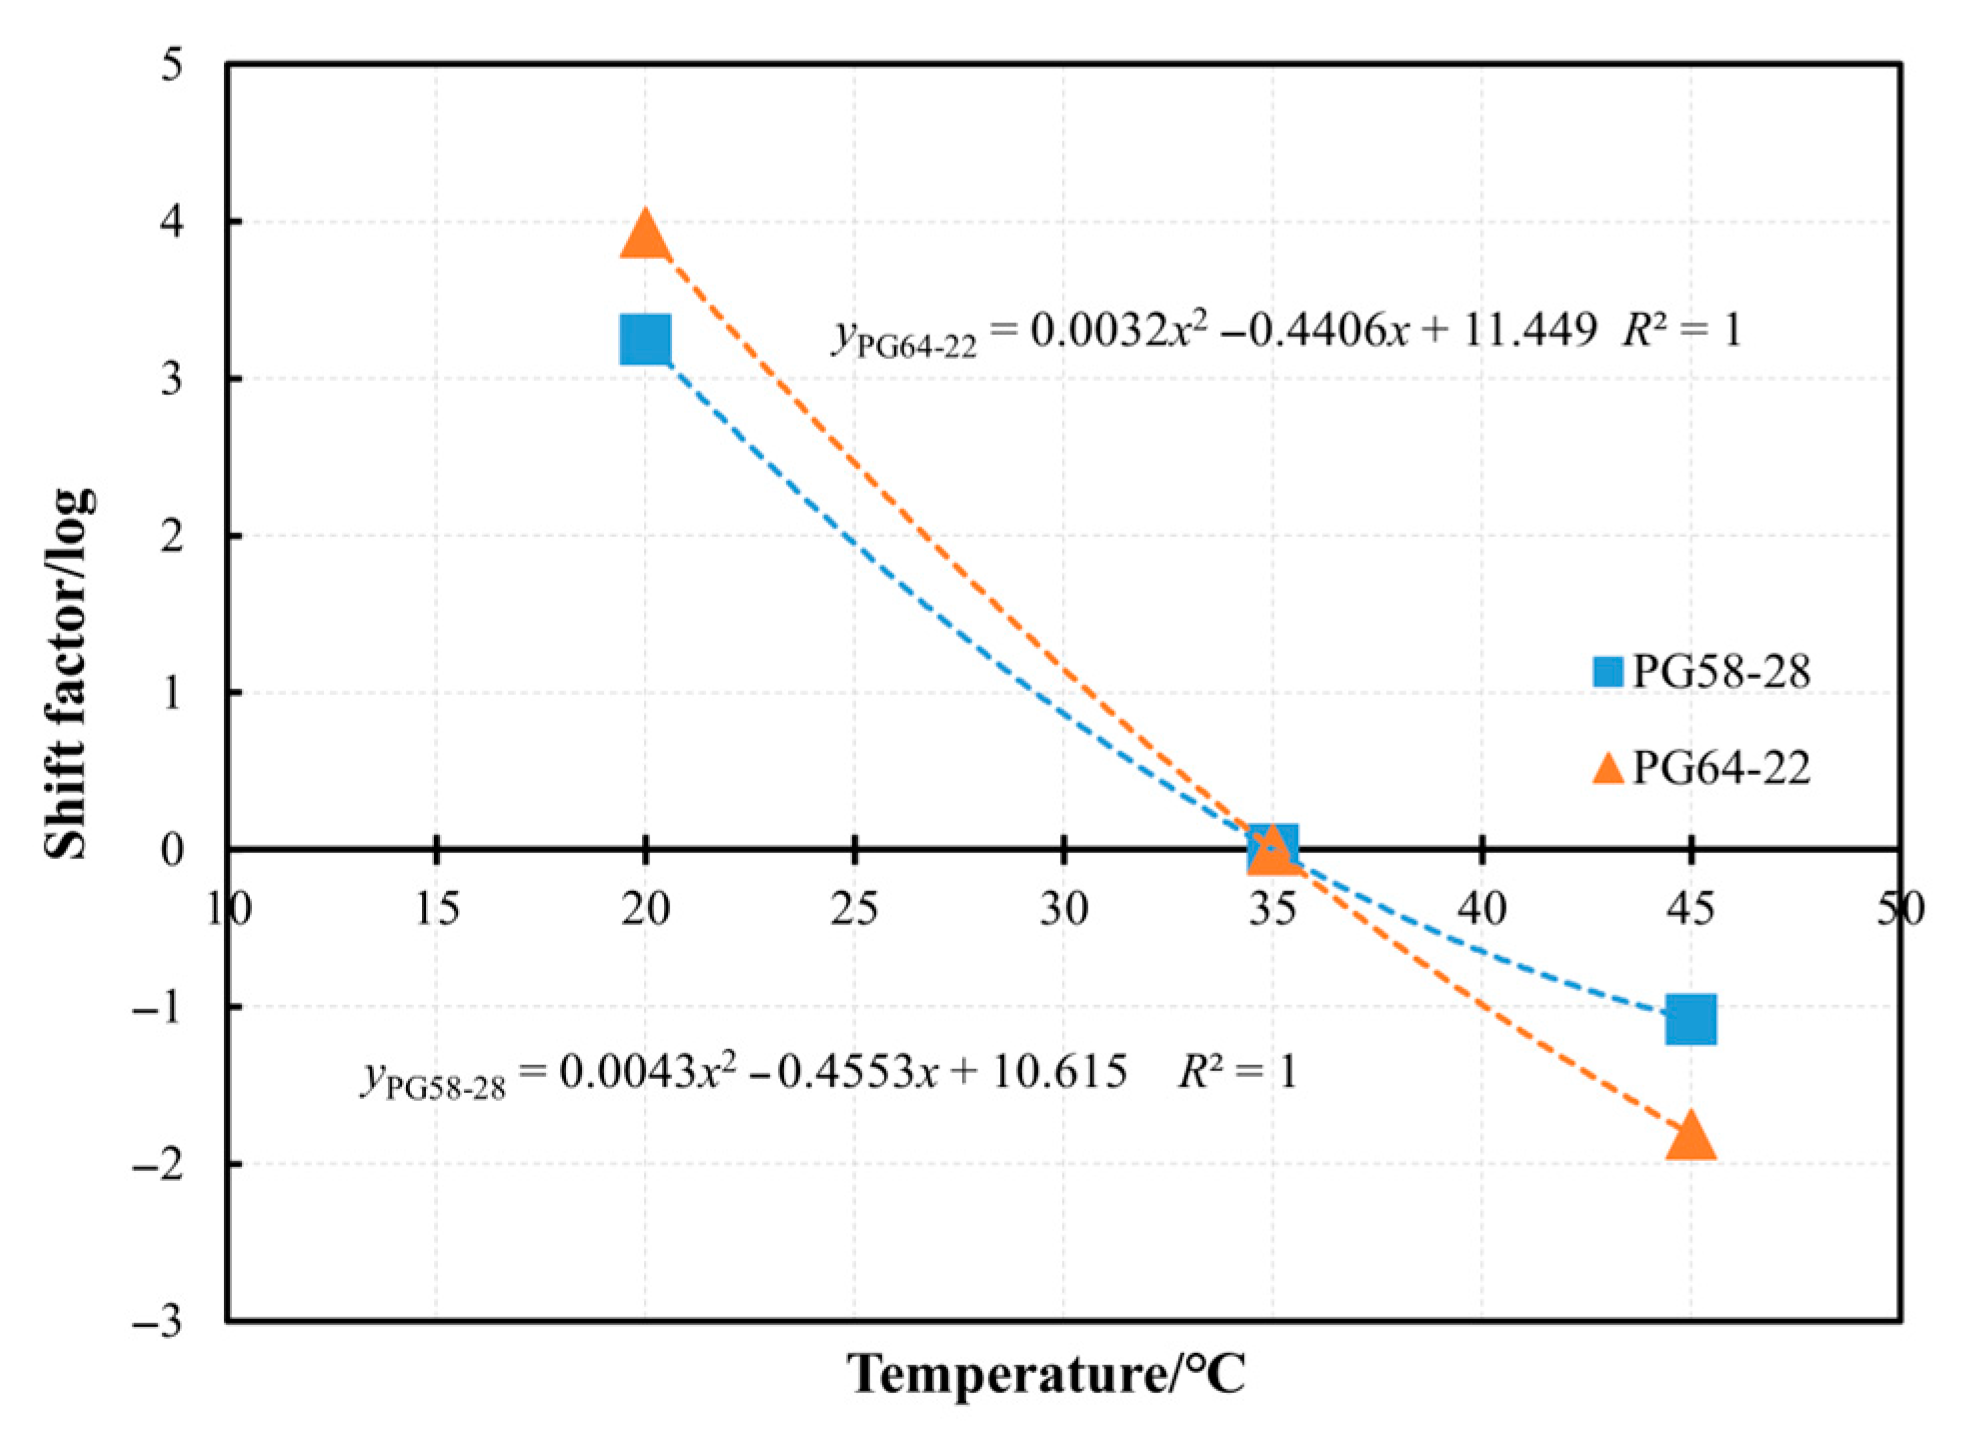
The master curves at 20 °C, 35 °C, and 45 °C, referenced at a stress level of 6000 Pa, can be horizontally shifted to construct a secondary master curve, referred to as temperature shift (TS). The fitting results are presented in Figure 11, while the fitted models for the two bitumen types are provided in Equations (3) and (4), respectively. Observation of these results suggests that the tf of bitumen at a given temperature can be predicted using data obtained at a different temperature. Specifically, cyclic test results from challenging conditions, such as extremely low temperatures, can be extrapolated from tests conducted at higher temperatures with reduced load ratios. Similarly, the tf at very high load ratios can be estimated by performing tests at lower temperatures. The relationships between shift factors and temperatures for PG58-28 and PG64-22 bitumen were fitted using quadratic polynomial functions, as shown in Figure 12. By integrating these fitting formulas with the master curve models, the tf can be predicted across various temperatures and stress levels.
l o g t f = 146.911 + 153.942 1 + 1 e x p 3.448 0.125 l o g R T S
l o g t f = 1,573,957 + 206.797 1 + 1 e x p 3.482 0.0738 l o g R T S
where tf is the time-to-failure and RTS is the reduced load ratio after TS.

3.3. Model Validation

Based on the relationships shown in Figure 12, the corresponding shift factors and reduced reference load ratio (RTS) at a stress level of 6000 Pa can be determined, as presented in Table 4. By substituting the RTS into the fitted master curve models for PG58-28 and PG64-22 bitumen, represented by Equations (3) and (4), the tf at the validation temperatures of 30 °C and 40 °C can be predicted. Figure 13 compares the measured and predicted tf for the two bitumen types under a reference stress of 6000 Pa. The analysis demonstrates strong correlations between the predicted and measured values across various load ratios, confirming the accuracy of the failure prediction model in capturing the plasticity-controlled failure behaviour of bitumen under the new accelerated cyclic shear loading. At 30 °C, as shown in Figure 13a, the prediction model for the PG64-22 bitumen exhibits higher accuracy compared to that of the PG58-28 bitumen, achieving a correlation coefficient of 0.97. The models demonstrate excellent predictive accuracy of tf for both bitumen types at the verification temperature of 40 °C.
To predict the tf under various stresses at the verification temperatures of 30 °C and 40 °C, the relationship between shift factor and stress as shown in Figure 10 is used to determine the corresponding stress shift factors. The results presented in Table 5 show that the bitumen exhibits identical stress shift factors at same stress for the validation temperatures of 30 °C and 40 °C. The RTS that is calculated using Equation (5) is then incorporated into the master curve model developed at 35 °C, as defined by Equations (3) and (4), to predict the tf of PG58-28 and PG64-22 bitumen, respectively.
R T S = R α S S α T S
where R is the load ratio—here R=0.1, 0.3, 0.5, 0.7, 1— RTS is the reduced load ratio after TS, αSS is the shift factor from SS, and αTS is the shift factor from TS.
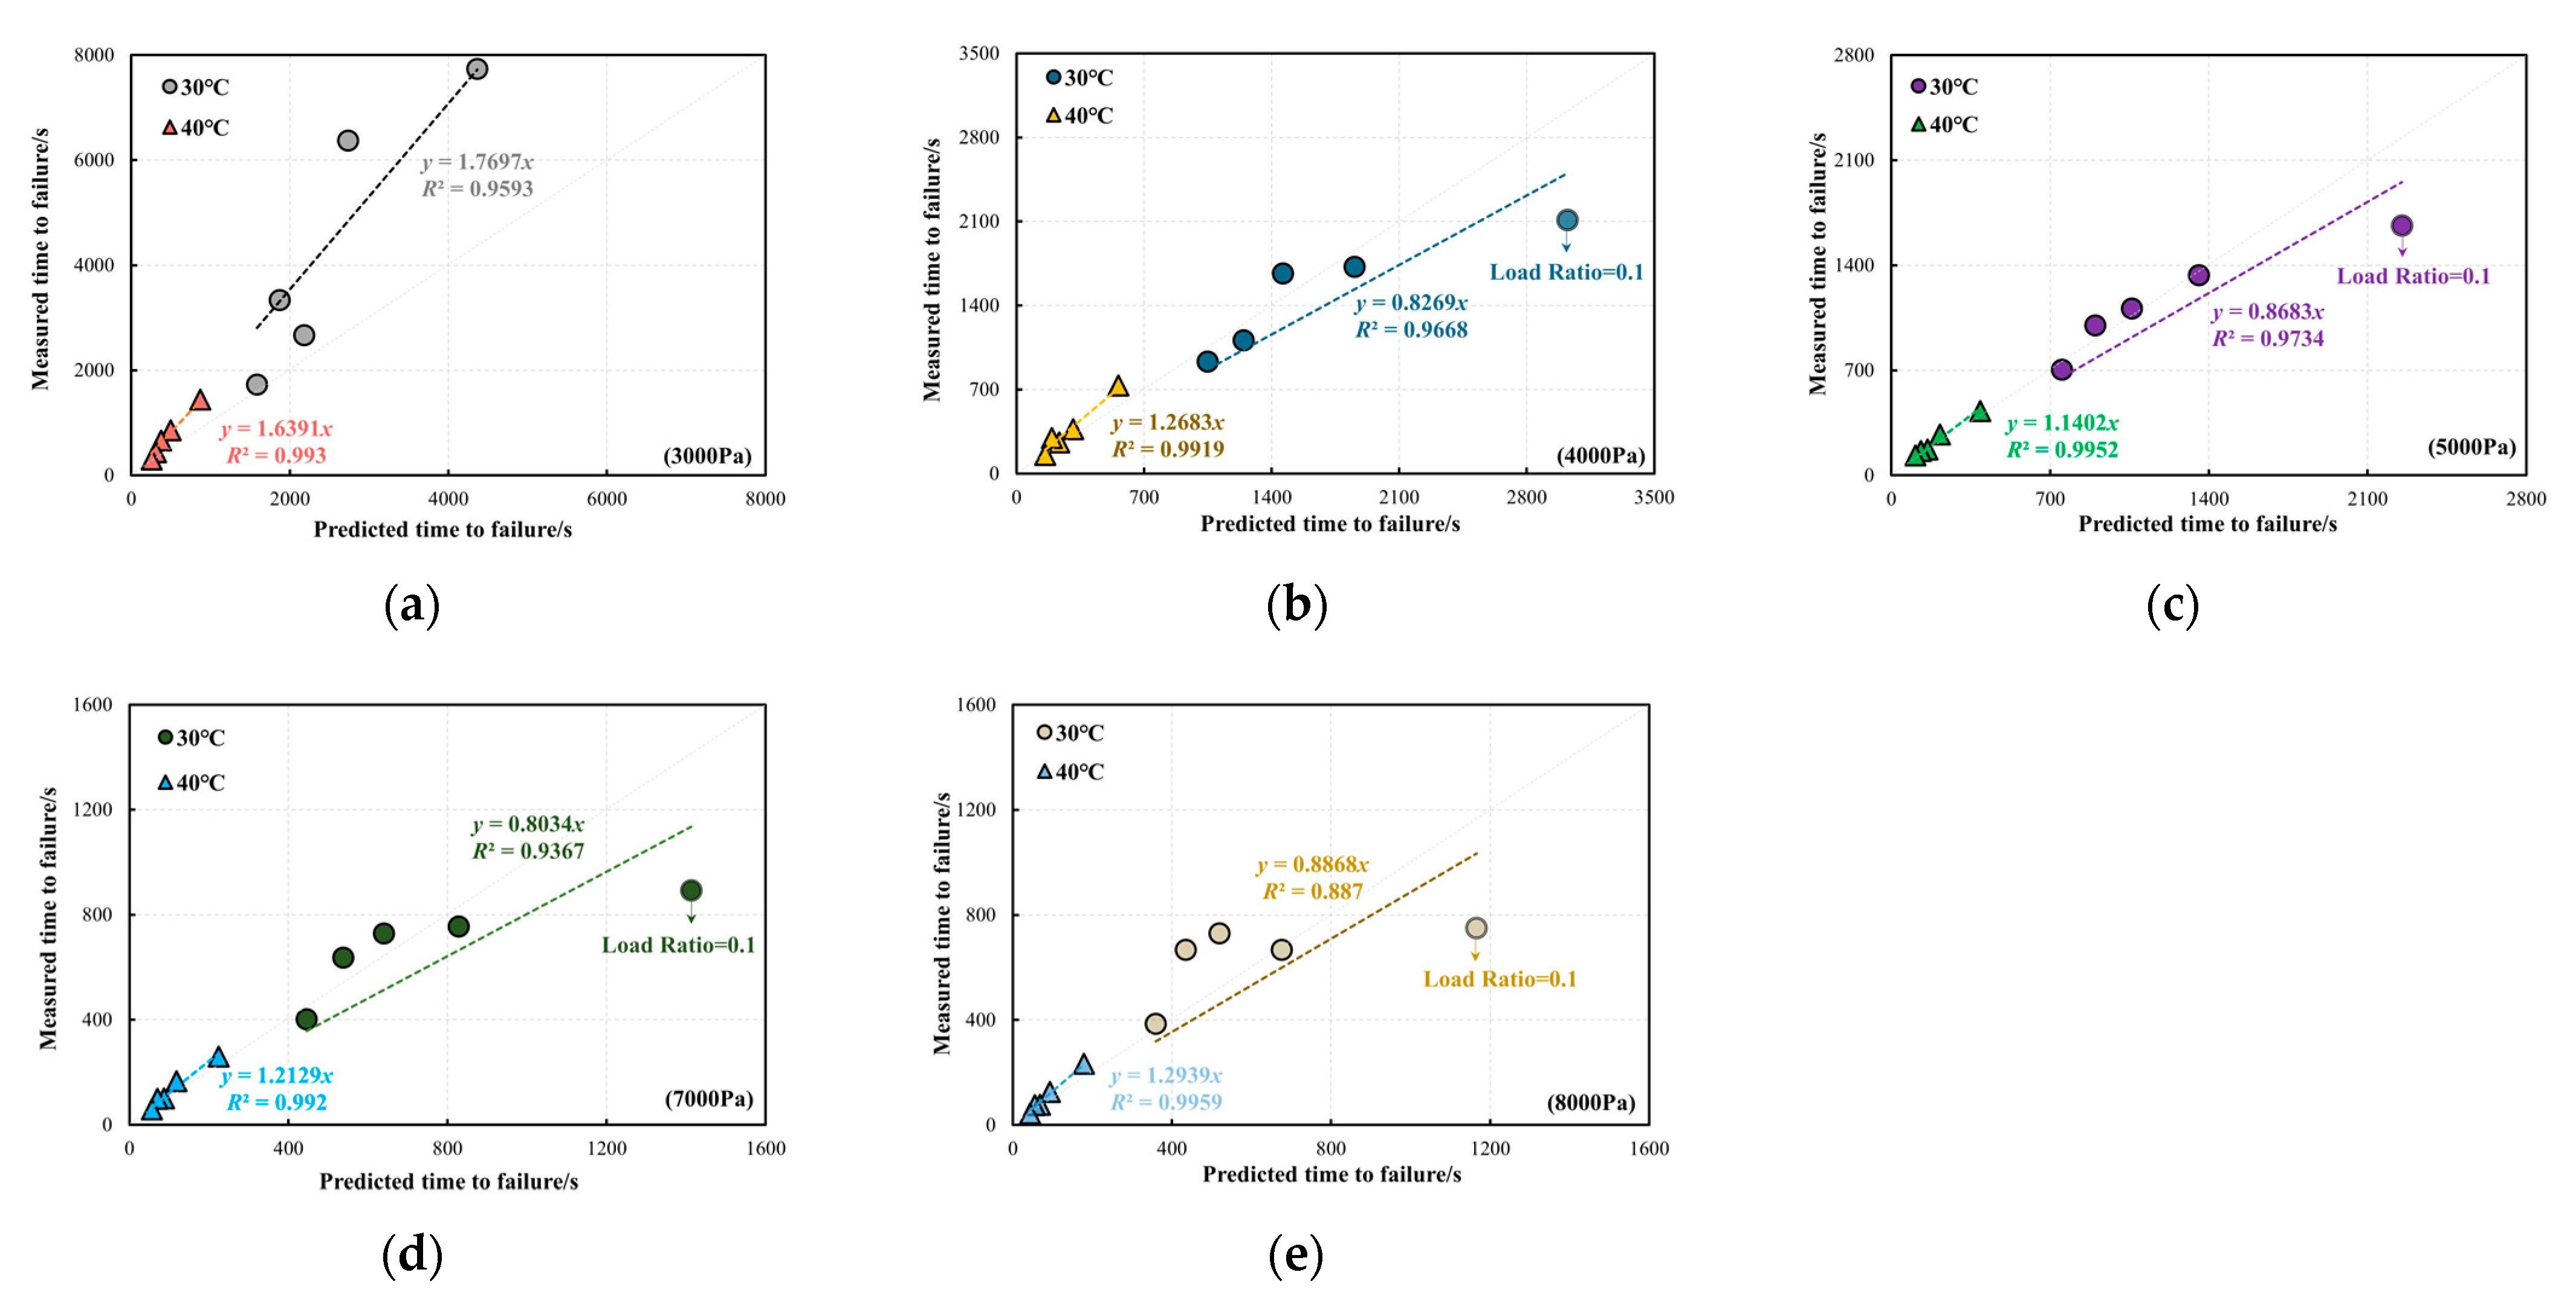
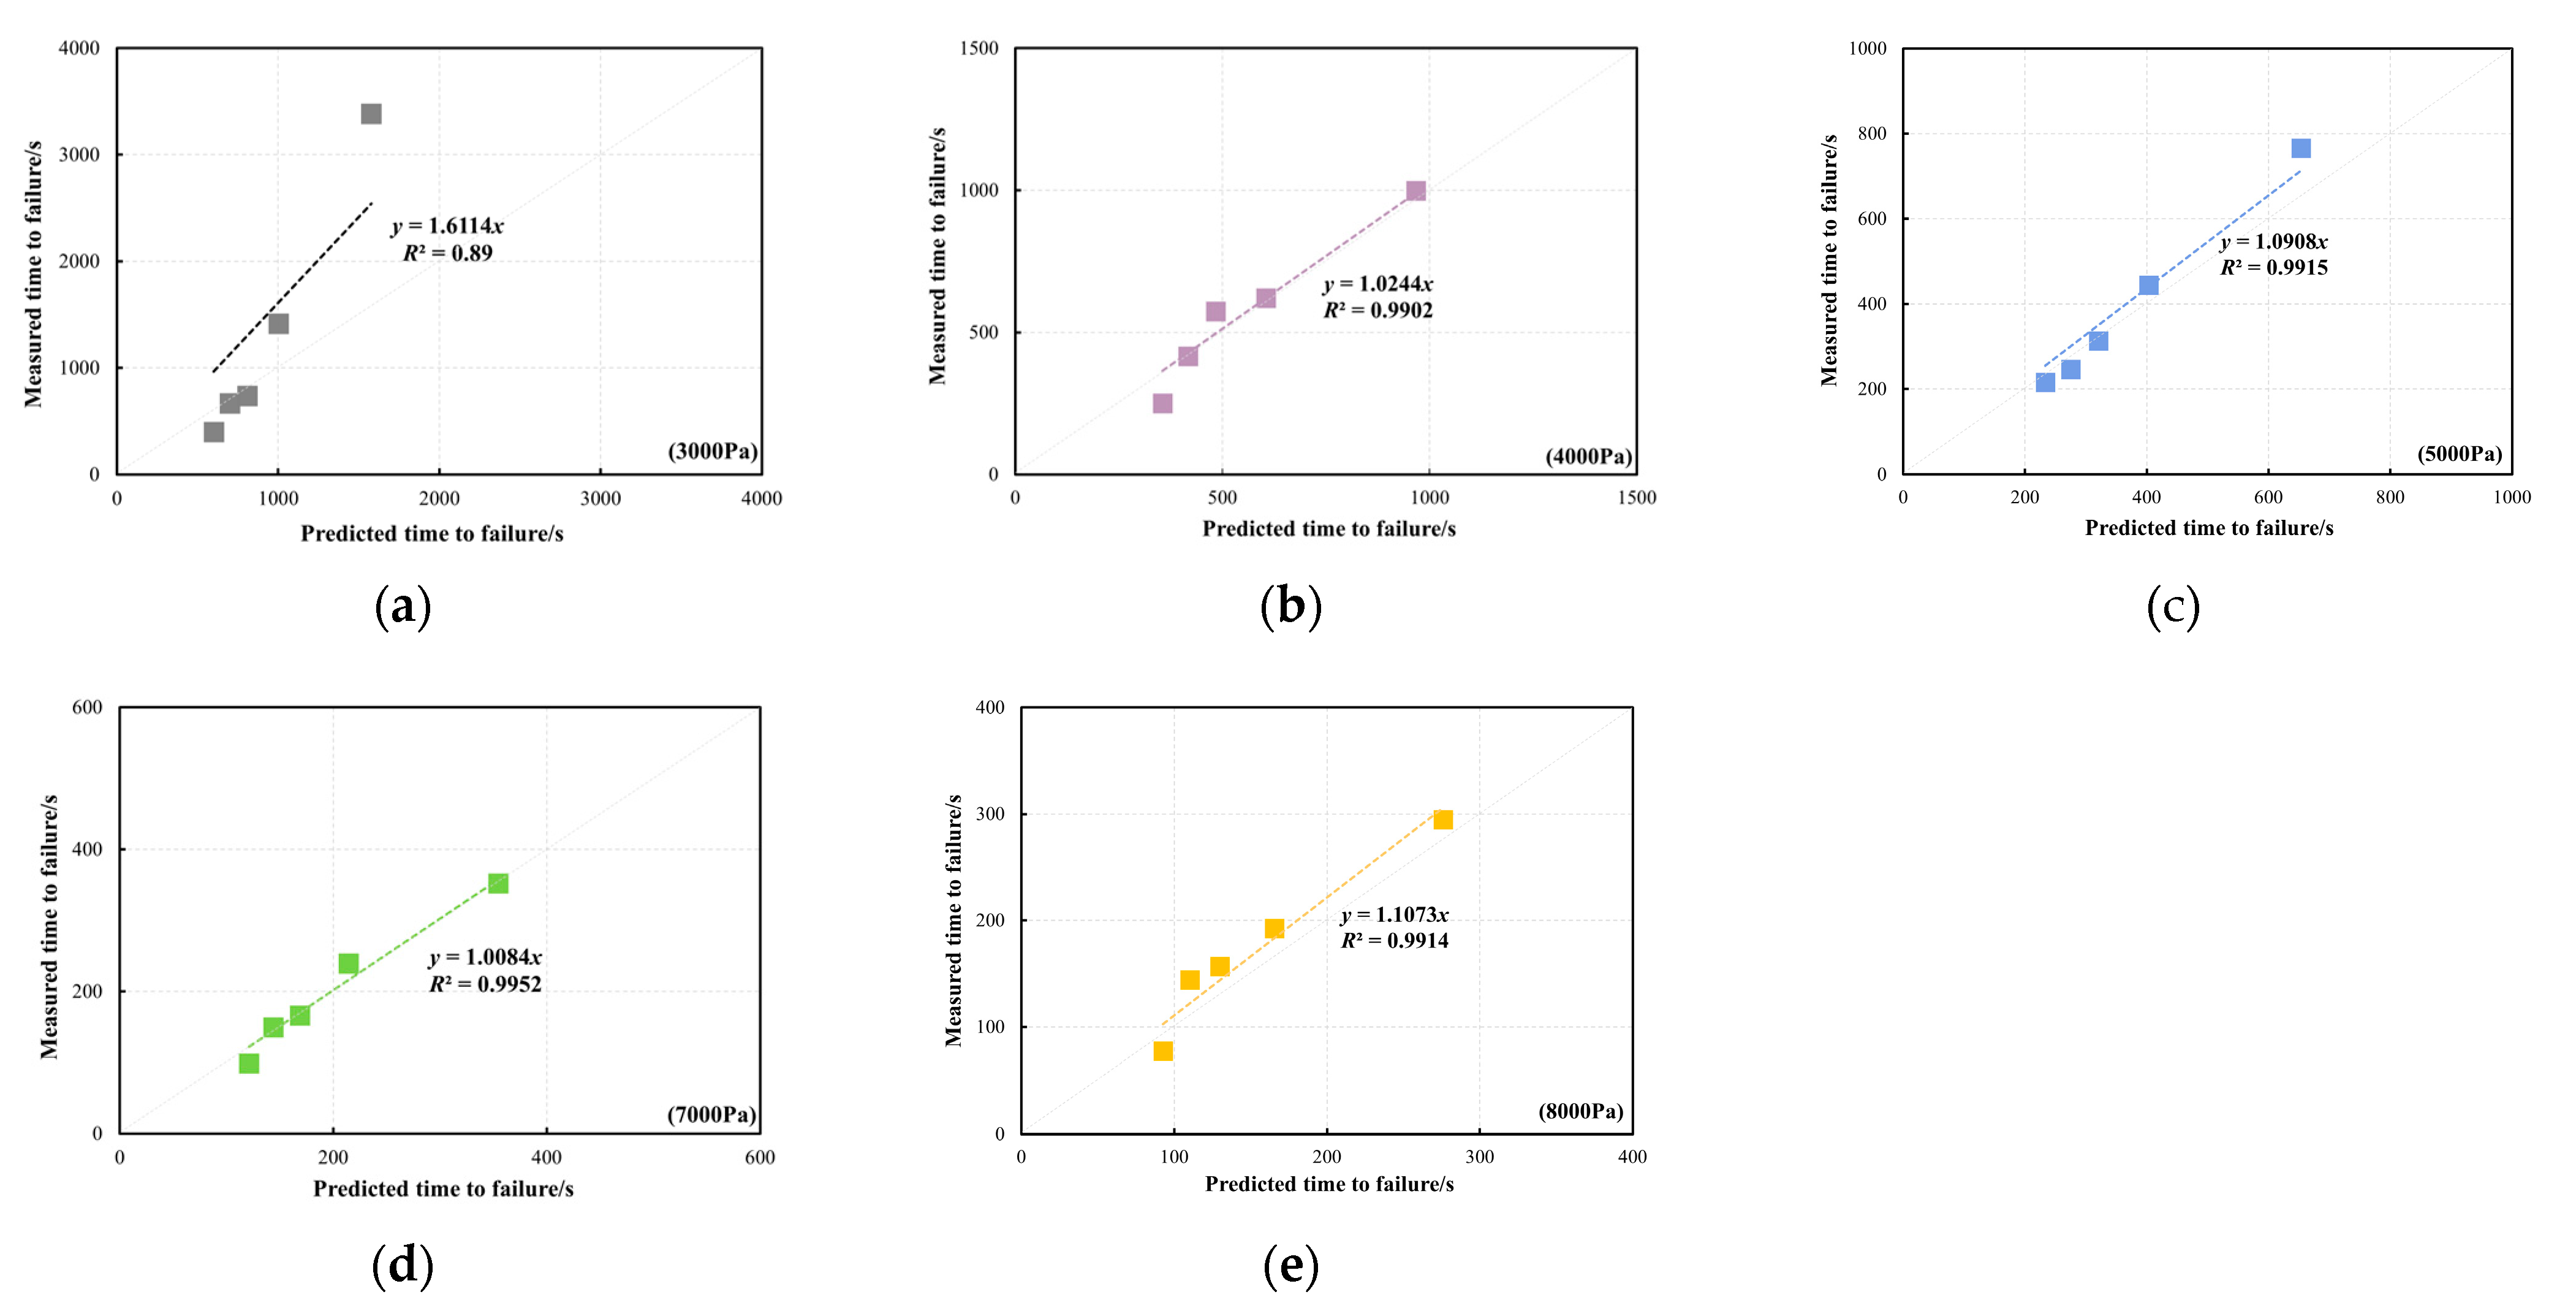
Figure 14 presents a comparison between the predicted and measured tf for the PG58-28 bitumen at the two validation temperatures. The results clearly indicate that at 30 °C, the bitumen exhibits a longer tf compared to 40 °C. Under a stress level of 3000 Pa, as shown in Figure 14a, the experimentally measured tf at both validation temperatures is higher than the values predicted by the model. This discrepancy is attributed to the slow plastic flow of bitumen under relatively low stresses, which allows self-healing to occur during the shear loading process. Under other stresses at 30 °C and 40 °C, the correlation between measured and predicted tf is strong, particularly at 40 °C. This indicates that the developed model reliably predicts the failure behaviour of bitumen. As observed in Figure 14, under the condition of 30 °C and R = 0.1, the predicted tf is generally higher than the measured values. This discrepancy arises as an R value of 0.1 represents the loading condition with the highest cyclic load amplitude among all cases examined in this study. Although the plastic accumulation of material under large-oscillation conditions is lower than under small-amplitude conditions, the fatigue behaviour induced by high-amplitude cyclic loading is particularly more pronounced. As a result, the measured tf for bitumen is shorter than the predicted tf under R = 0.1. However, at 40 °C the increased temperature enhances the plastic flow of bitumen, allowing it to absorb stress by plastic flow without accumulating significant fatigue damage. This effect is not fully captured in the predicted tf.
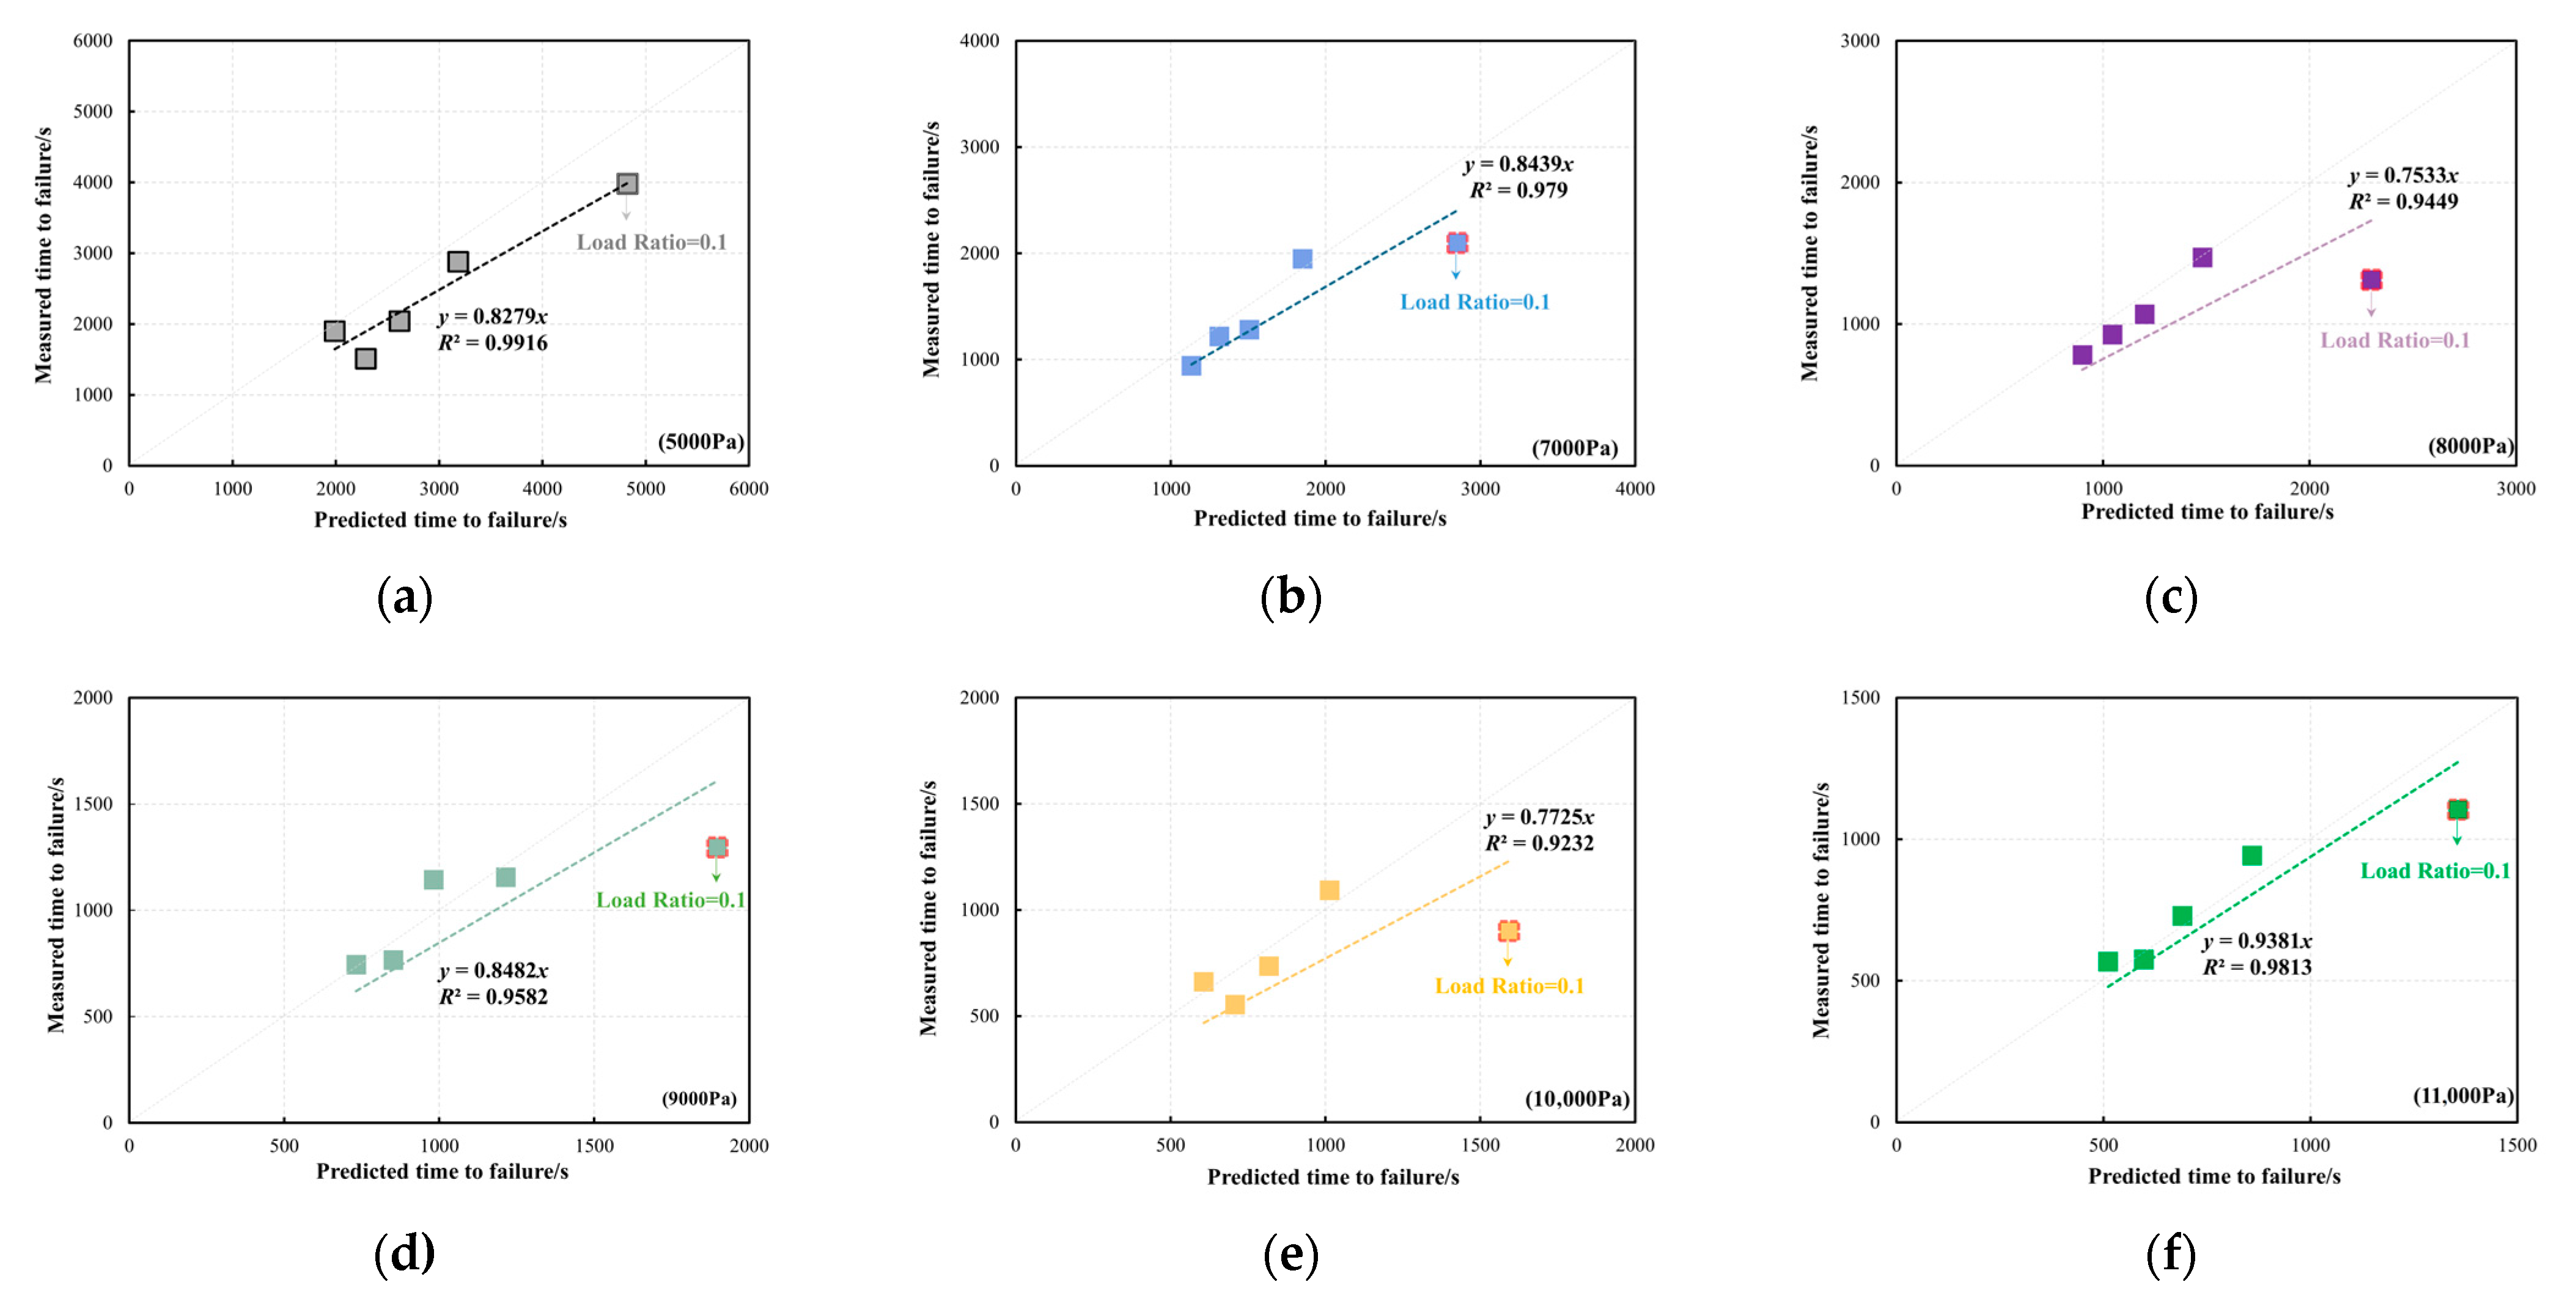
Figure 15 presents a comparison between the predicted and measured tf of the PG64-22 bitumen at the validation temperature of 30 °C. The validation stresses range from 5000 Pa to 11,000 Pa with an increment of 1000 Pa. It can be noticed that the measured tf of the bitumen samples at R = 0.1 is lower than the predicted tf across different validated stresses. The comparisons between the predicted and measured tf of the PG64-22 bitumen at 40 °C are shown in Figure 16. A strong linear correlation is observed between the predicted tf from the developed master curve model and the measured tf across various validated stresses, except under the validated stress of 3000 Pa. Under a stress of 3000 Pa, the measured tf of the PG64-22 bitumen exceeded the predicted values, which is likely due to the self-healing behaviour of bitumen during the shear process under low stresses. However, this phenomenon was not observed at 30 °C due to the relatively higher initial stress. Similarly to the PG58-28 bitumen, a strong correlation between the predicted and measured tf is observed at the validation temperature of 40 °C, demonstrating the excellent prediction efficiency of the developed model.

4. Conclusions and Recommendations

4.1. Conclusions

This study proposed a novel accelerated cyclic shear test integrating both creep and unidirectional cyclic shear loading tests to investigate the fatigue behaviour and failure mechanism of bitumen. A new fatigue failure prediction model was developed to predict the fatigue life of bitumen. Based on the comprehensive experimental and modelling framework, the following conclusions can be drawn:
(1)
The proposed novel accelerated cyclic shear test establishes a link between creep and cyclic loading modes by precisely controlling R. Experimental results demonstrated that lower load ratios (e.g., R = 0.1) significantly reduce plastic strain accumulation, resulting in notably extended tf compared to static loading (R = 1). This finding supports the existence of a plasticity-controlled fatigue failure mechanism, which is distinct from viscoelastic fatigue behaviour.
(2)
The tf was validated as a robust and sensitive indicator for plasticity-induced fatigue failure. The observed “atypical response”—longer fatigue lifetimes at lower R despite identical peak stresses—is consistent with findings in thermoplastic and polymer fatigue research. This supports the assertion that mean stress significantly governs the evolution of failure in bitumen under these conditions.
(3)
A master curve model based on a sigmoidal function incorporating stress and temperature shifts was developed and validated. Although the approach deviates from traditional time–temperature superposition principles used for the viscoelastic behaviour of bitumen, the temperature and stress shift techniques accurately predicted tf across a wide range of conditions. The model achieved high correlation coefficients (R2 > 0.95) at validation temperatures (30 °C and 40 °C), which confirms its predictive accuracy.
(4)
The study employed two original bitumen types (PG58-28 and PG64-22), which were randomly sourced. Despite differences in their material properties, both showed similar fatigue trends and were well-described by the proposed model, with variations captured by model parameters. The results in this study provide evidence of the approach’s initial reproducibility and potential generalizability under the studied conditions. However, to further validate the robustness of the conclusions and ensure applicability across a broader range of materials, future work will extend the testing and modelling framework to include modified and aged bitumen.

4.2. Recommendations

Future studies should extend the current framework to include modified and aged bitumen, extended temperature ranges, and more complex loadings; incorporate microstructural material parameters into the master curve formulation; and validate across multiple laboratories and equipment platforms. Furthermore, coupling the macroscopic model with micromechanical or chemomechanical simulations could lead to a unified constitutive description of plasticity-induced fatigue in bitumen.

Author Contributions

Conceptualization, Y.W. and L.W.; methodology, L.W.; investigation, Y.W. and L.W.; data curation, L.W.; writing—original draft preparation, L.W.; writing—review and editing, Y.W.; supervision, L.W. All authors have read and agreed to the published version of the manuscript.

Funding

This research received no external funding.

Institutional Review Board Statement

Not applicable.

Informed Consent Statement

Not applicable.

Data Availability Statement

The original contributions presented in this study are included in the article. Further inquiries can be directed to the corresponding author.

Acknowledgments

The authors would like to give thanks to Haifang Wen of Washington State University for valuable advising.

Conflicts of Interest

The authors declare no conflicts of interest.

References

  1. Ye, Y.; Yang, X.; Chen, C. Experimental researches on visco-elastoplastic constitutive model of asphalt mastic. Constr. Build. Mater. 2009, 23, 3161–3165. [Google Scholar] [CrossRef]
  2. Das, B.P.; Das, S.; Siddagangaiah, A.K. Probabilistic modeling of fatigue damage in asphalt mixture. Constr. Build. Mater. 2021, 269, 121300. [Google Scholar] [CrossRef]
  3. Qiu, X.; Xiao, S.; Yang, Q.; Luo, X.; Wang, Y.; Wang, F. Asphalt-Aggregate Interface Failure Mechanism and Its Characterization Methods. Transp. Res. Congr. 2016, 2016, 182–194. [Google Scholar] [CrossRef]
  4. Guo, F.; Pei, J.; Zhang, J.; Li, R.; Liu, P.; Wang, D. Study on the adhesion property between asphalt binder and aggregate: A state-of-the-art review. Constr. Build. Mater. 2020, 256, 119474. [Google Scholar] [CrossRef]
  5. Rieksts, K.; Pettinari, M.; Haritonovs, V. The influence of filler type and gradation on the rheological performance of mastics. Road Mater. Pavement Des. 2018, 20, 964–978. [Google Scholar] [CrossRef]
  6. Zhou, F.; Mogawer, W.; Li, H.; Andriescu, A.; Copeland, A. Evaluation of fatigue tests for characterizing asphalt binders. J. Mater. Civ. Eng. 2013, 25, 610–617. [Google Scholar] [CrossRef]
  7. Bonnetti, K.S.; Nam, K.; Bahia, H.U. Measuring and defining fatigue behavior of asphalt binders. Transp. Res. Rec. 2002, 1810, 33–43. [Google Scholar] [CrossRef]
  8. Sabouri, M.; Mirzaiyan, D.; Moniri, A. Effectiveness of Linear Amplitude Sweep (LAS) asphalt binder test in predicting asphalt mixtures fatigue performance. Constr. Build. Mater. 2018, 171, 281–290. [Google Scholar] [CrossRef]
  9. Uwanuakwa, I.D.; Okafor, G.; Mgbemena, I.; Udom, D.; Agwa, S. Artificial intelligence prediction of rutting and fatigue parameters in modified asphalt binders. Appl. Sci. 2020, 10, 7764. [Google Scholar] [CrossRef]
  10. Wang, C.; Chen, Z.; Xiao, F.; Xu, J.; Li, G.; Huang, B. Identifying fatigue failure in asphalt binder time sweep tests. Constr. Build. Mater. 2016, 121, 535–546. [Google Scholar] [CrossRef]
  11. Glover, C.J.; Davison, R.R.; Domke, C.H.; Ruan, Y.; Juristyarini, P.; Knorr, D.B.; Jung, S.H. Development of a New Method for Assessing Asphalt Binder Durability with Field Validation No. FHWA/TX-05/1872-2; Texas Transportation Institute, Texas A&M University: College Station, TX, USA, 2005. [Google Scholar]
  12. Rowe, G.M. Prepared discussion for the AAPT paper by Anderson et al.: Evaluation of the relationship between asphalt binder properties and non-load related cracking. J. Assoc. Asphalt Paving Technol. 2011, 80, 649–662. [Google Scholar]
  13. Ilyin, S.O.; Yadykova, A.Y. Eco-friendly bitumen binders from heavy crude oil and a relaxation approach to predicting their resistance to rutting and cracking. J. Clean. Prod. 2024, 434, 139942. [Google Scholar] [CrossRef]
  14. Yue, M.; Yue, J.; Wang, R.; Xiong, Y. Evaluating the fatigue characteristics and healing potential of asphalt binder modified with Sasobit® and polymers using linear amplitude sweep test. Constr. Build. Mater. 2021, 289, 123054. [Google Scholar] [CrossRef]
  15. Ameri, M.; Seif, M.; Abbasi, M.; Molayem, M.; KhavandiKhiavi, A. Fatigue performance evaluation of modified asphalt binder using dissipated energy approach. Constr. Build. Mater. 2017, 136, 184–191. [Google Scholar] [CrossRef]
  16. Akbari, A.; Modarres, A. Evaluating the effect of nano-clay and nano-alumina on the fatigue response of bitumen using strain and time sweep tests. Int. J. Fatigue 2018, 114, 311–322. [Google Scholar] [CrossRef]
  17. Underwood, B.S. A continuum damage model for asphalt cement and asphalt mastic fatigue. Int. J. Fatigue 2016, 82, 387–401. [Google Scholar] [CrossRef]
  18. Lv, S.; Wang, X.; Li, Y.; Zhang, Q.; Chen, Z. Laboratory investigation of fatigue parameters characteristics of aging asphalt mixtures: A dissipated energy approach. Constr. Build. Mater. 2020, 230, 116972. [Google Scholar] [CrossRef]
  19. Subhy, A.; Presti, D.L.; Airey, G. New simplified approach for obtaining a reliable plateau value in fatigue analysis of bituminous materials. Eng. Fail. Anal. 2017, 79, 263–273. [Google Scholar] [CrossRef]
  20. Cao, W.; Wang, C. Fatigue performance characterization and prediction of asphalt binders using the linear amplitude sweep based viscoelastic continuum damage approach. Int. J. Fatigue 2019, 119, 112–125. [Google Scholar] [CrossRef]
  21. Chen, H.; Zhang, Y.; Bahia, H.U. The role of binders in mixture cracking resistance measured by ideal-CT test. Int. J. Fatigue 2021, 142, 105947. [Google Scholar] [CrossRef]
  22. Johnson, C.; Bahia, H.U. Evaluation of an accelerated procedure for fatigue characterization of asphalt binders. Road Mater. Pavement Des. 2010. submitted. [Google Scholar]
  23. Underwood, B.S.; Bahia, H.U.; Kelly, J.A.; von Quintus, H. Response and fatigue performance modeling of ALF pavements using 3-D finite element analysis and a simplified viscoelastic continuum damage model. Asphalt Paving Technol. 2009, 2009, 829–868. [Google Scholar]
  24. Liu, J.; Wang, Y.D.; Liu, J. Implementation of the linear amplitude sweep test to evaluate fatigue resistance of highly polymerized asphalt binders. J. Mater. Civ. Eng. 2022, 34, 04022070. [Google Scholar] [CrossRef]
  25. Meneses, J.P.C.; Silva, H.R.; Ibanez, J. Asphalt binder linear amplitude sweep test: Contribution related to the α-value estimation. J. Mater. Civ. Eng. 2021, 33, 04020459. [Google Scholar] [CrossRef]
  26. Zhang, Z.; Oeser, M. Understanding the damage mechanism of asphalt binder under controlled-stress fatigue loads in dynamic shear rheometer. Constr. Build. Mater. 2021, 292, 123463. [Google Scholar] [CrossRef]
  27. Shi, C.; Cai, X.; Yi, X.; Wang, T.; Yang, J. Energy-based characterization of the fatigue crack density evolution of asphalt binders through controlled-stress fatigue testing. Constr. Build. Mater. 2021, 300, 124275. [Google Scholar] [CrossRef]
  28. Erartsın, O.; van Drongelen, M.; Govaert, L.E. Identification of plasticity-controlled creep and fatigue failure mechanisms in transversely loaded unidirectional thermoplastic composites. J. Compos. Mater. 2021, 55, 1947–1965. [Google Scholar] [CrossRef]
  29. Visser, H.A.; van Drongelen, M.; Schipper, D.; Govaert, L.E. Lifetime assessment of load-bearing polymer glasses: The influence of physical ageing. Macromol. Mater. Eng. 2010, 295, 1066–1081. [Google Scholar] [CrossRef]
  30. Klompen, E.T.J.; Bourdet, C.; van der Klift, F.; Govaert, L.E.; Peters, G.W.M. Quantitative prediction of long-term failure of polycarbonate. Macromolecules 2005, 38, 7009–7017. [Google Scholar] [CrossRef]
  31. Kanters, M.J.; Kurokawa, T.; Govaert, L.E. Competition between plasticity-controlled and crack-growth controlled failure in static and cyclic fatigue of thermoplastic polymer systems. Polym. Test. 2016, 50, 101–110. [Google Scholar] [CrossRef]
  32. Engels, T.A.; Fokker, P.; Akkerman, R.; Govaert, L.E.; Drongelen, M.V. Time-dependent failure of amorphous polylactides in static loading conditions. J. Mater. Sci. Mater. Med. 2010, 21, 89–97. [Google Scholar] [CrossRef] [PubMed]
  33. Liu, S.; Shi, Y.; Zhao, Y.; Li, Y.; Yu, R. Analysis and application of relationships between low-temperature rheological performance parameters of asphalt binders. Constr. Build. Mater. 2010, 24, 471–478. [Google Scholar] [CrossRef]
  34. Li, R.; Zhu, X.; Wang, Y. Investigation of the physicochemical interactions and modification effects of polyurethane on asphalt binder. Transp. Res. Rec. 2024, 2678, 876–890. [Google Scholar] [CrossRef]
  35. AASHTO T 315 2022; Standard Method of Test for Determining the Rheological Properties of Asphalt Binder Using a Dynamic Shear Rheometer (DSR). American Association of State Highway and Transportation Officials: Washington, DC, USA, 2022.
  36. Kanters, M.J.; Remerie, K.; Govaert, L.E. A new protocol for accelerated screening of long-term plasticity-controlled failure of polyethylene pipe grades. Polym. Eng. Sci. 2016, 56, 676–688. [Google Scholar] [CrossRef]
  37. Chudnovsky, A.; Fleck, N.; Krawczak, P.; Govaert, L.; van Drongelen, M. Lifetime assessment of engineering thermoplastics. Int. J. Eng. Sci. 2012, 59, 108–139. [Google Scholar] [CrossRef]
  38. Wen, H.; Bahia, H. Characterizing fatigue of asphalt binders with viscoelastic continuum damage mechanics. Transp. Res. Rec. 2009, 2126, 55–62. [Google Scholar] [CrossRef]
  39. Dorleans, V.; Nechyporchuk, O.; van Drongelen, M.; Govaert, L.E. Time-temperature superposition in viscoelasticity and viscoplasticity for thermoplastics. Polym. Test. 2021, 101, 107287. [Google Scholar] [CrossRef]
Figure 1. Schematic illustration of (a) bidirectional sinusoidal oscillating loading and (b) the new unidirectional sinusoidal cyclic loading applied by the DSR.
Materials 18 03729 g001
Figure 2. Schematic illustration of the accelerated cyclic shear loading.
Materials 18 03729 g002
Figure 3. A schematic illustration of the geometric method used to determine the tf.
Materials 18 03729 g003
Figure 4. Time-to-failure of PG58-28 and PG64-22 bitumen under different load ratios at (a) 20 °C (b) 35 °C (c) 45 °C.
Materials 18 03729 g004
Figure 5. Schematic illustration of the “atypical response” [28].
Materials 18 03729 g005
Figure 6. Time-to-failure of (a) PG 58-28 (b) PG 64-22 under different peak stresses and load ratios at 20 °C and 45 °C in the accelerated cyclic shear test.
Materials 18 03729 g006
Figure 7. Time-to-failure at different temperatures of PG58-28 and PG64-22 bitumen in the accelerated cyclic shear test.
Materials 18 03729 g007
Figure 8. Master curves for (a) PG58-28 and (b) PG64-22 bitumen at 35 °C under reference stress of 6000 Pa.
Materials 18 03729 g008
Figure 9. Master curves after the SS of (a) PG58-28 and (b) PG64-22 bitumen at 20 °C, 35 °C, and 45 °C under a reference stress of 6000 Pa.
Materials 18 03729 g009
Figure 10. Shift factors of the SS of (a) PG58-28 and (b) PG64-22 bitumen at 20 °C, 35 °C, and 45 °C.
Materials 18 03729 g010
Figure 11. Master curves after the SS and TS of (a) PG58-28 and (b) PG64-22 bitumen under a reference stress of 6000 Pa.
Materials 18 03729 g011
Figure 12. Shift factors of TS at different temperatures of PG58-28 and PG64-22 bitumen.
Materials 18 03729 g012
Figure 13. Comparison of the predicted and measured tf of PG58-28 and PG64-22 bitumen under 6000 Pa at (a) 30 °C and (b) 40 °C.
Materials 18 03729 g013
Figure 14. Comparison between the predicted and measured tf of PG58-28 bitumen at the validation temperatures of 30 °C and 40 °C: (a) 3000 Pa, (b) 4000 Pa, (c) 5000 Pa, (d) 7000 Pa, (e) 8000 Pa.
Materials 18 03729 g014
Figure 15. Comparison between the predicted and measured tf of PG64-22 bitumen at the validation temperature of 30 °C: (a) 5000 Pa, (b) 7000 Pa, (c) 8000 Pa, (d) 9000 Pa, (e) 10,000 Pa, (f) 11,000 Pa.
Materials 18 03729 g015
Figure 16. Comparison between the predicted and measured tf of PG64-22 bitumen at the validation temperature of 40 °C: (a) 3000 Pa, (b) 4000 Pa, (c) 5000 Pa, (d) 7000 Pa, (e) 8000 Pa.
Materials 18 03729 g016
Table 1. Properties of bitumen in this study.
IndicatorPG 58-28PG 64-22
Flash Point (°C)300315
Viscosity at 135 °C (Pa·s)0.420.47
RTFO Mass Loss (%)0.360.40
G */sinδ (Original) (kPa)1.231.35
G */sinδ (RTFO-aged) (kPa)2.983.10
Table 2. Test matrix of PG58-28 (B1) and PG64-22 (B2) bitumen.
Maximum Load τmax (Pa)Load Ratio (R)Temperature (°C)
2030354045
20000.1, 0.3, 0.5, 0.7, 1 B1B1, B2
3000B1 B1B1, B2B1, B2
4000B1B1B1B1, B2B1, B2
5000B1, B2B1, B2B1, B2B1, B2B1, B2
6000B1, B2B1, B2B1, B2B1, B2B1, B2
7000B1, B2B1, B2B1, B2B1, B2B1, B2
8000B1, B2B1, B2B1, B2B1, B2B1, B2
9000B1, B2B2B2
10,000B1, B2B2B2
11,000 B2
Table 3. Sigmoidal model parameters of the SS of PG58-28 and PG64-22 bitumen.
BitumenTemperatures (°C)Sigmoidal Model Parameters After SS
abde
PG58-2820−57.58265.2802.765−0.108
35−329.003334.1934.735−0.216
45−165.391176.0142.922−0.073
PG64-2220−49.26056.5362.855−0.122
35−173.211182.6473.258−0.061
45−173.521185.2992.869−0.052
Table 4. Shift factors of PG58-28 and PG64-22 bitumen under reference stress of 6000 Pa.
Temperature
(°C)
Temperature Shift FactorsLoad Ratio RReduced RTS
PG58-28PG64-22PG58-28PG64-22
306.69912.9120.10.01490.0077
0.30.04480.0232
0.50.07460.0387
0.70.10450.05421
10.14930.0774
400.1920.08810.10.52121.1350
0.31.56363.4050
0.52.60605.6751
0.73.64847.9451
15.212011.3501
Table 5. Stress shift factors of PG58-28 and PG64-22 bitumen.
Verified Stress (Pa)Stress Shift Factor (30 °C/40 °C)
PG58-28PG64-22
30008.650419.9568
40003.64026.0940
50001.86012.4283
60001.07471.1449
70000.67590.6064
80000.45230.3496
9000-0.2151
10,000-0.1393
11,000-0.0940
Disclaimer/Publisher’s Note: The statements, opinions and data contained in all publications are solely those of the individual author(s) and contributor(s) and not of MDPI and/or the editor(s). MDPI and/or the editor(s) disclaim responsibility for any injury to people or property resulting from any ideas, methods, instructions or products referred to in the content.