Influence of Sample Mass and Pouring Temperature on the Effectiveness of Thermal Analysis for Estimating Gray Iron Inoculation Potential
Abstract
1. Introduction
2. Materials and Methods
2.1. Design of Experiments
2.2. Experimental Heats
2.3. Eutectic Cell Count
3. Results and Discussion
3.1. Chemical Composition
3.2. Thermal Analysis
3.2.1. Values of Tmax and Mass
3.2.2. The Temperature of Austenite Solidification (TAS)
3.2.3. The Minimal Temperature of Eutectic Arrest (TEmin)
3.2.4. Detection of Unsuitable Sampling
3.2.5. The Maximal Temperature of the Eutectic Arrest (TEmax)
3.2.6. Recalescence (TEmax–TEmin)
3.2.7. Angle on the Eutectic Deep Peak (α)
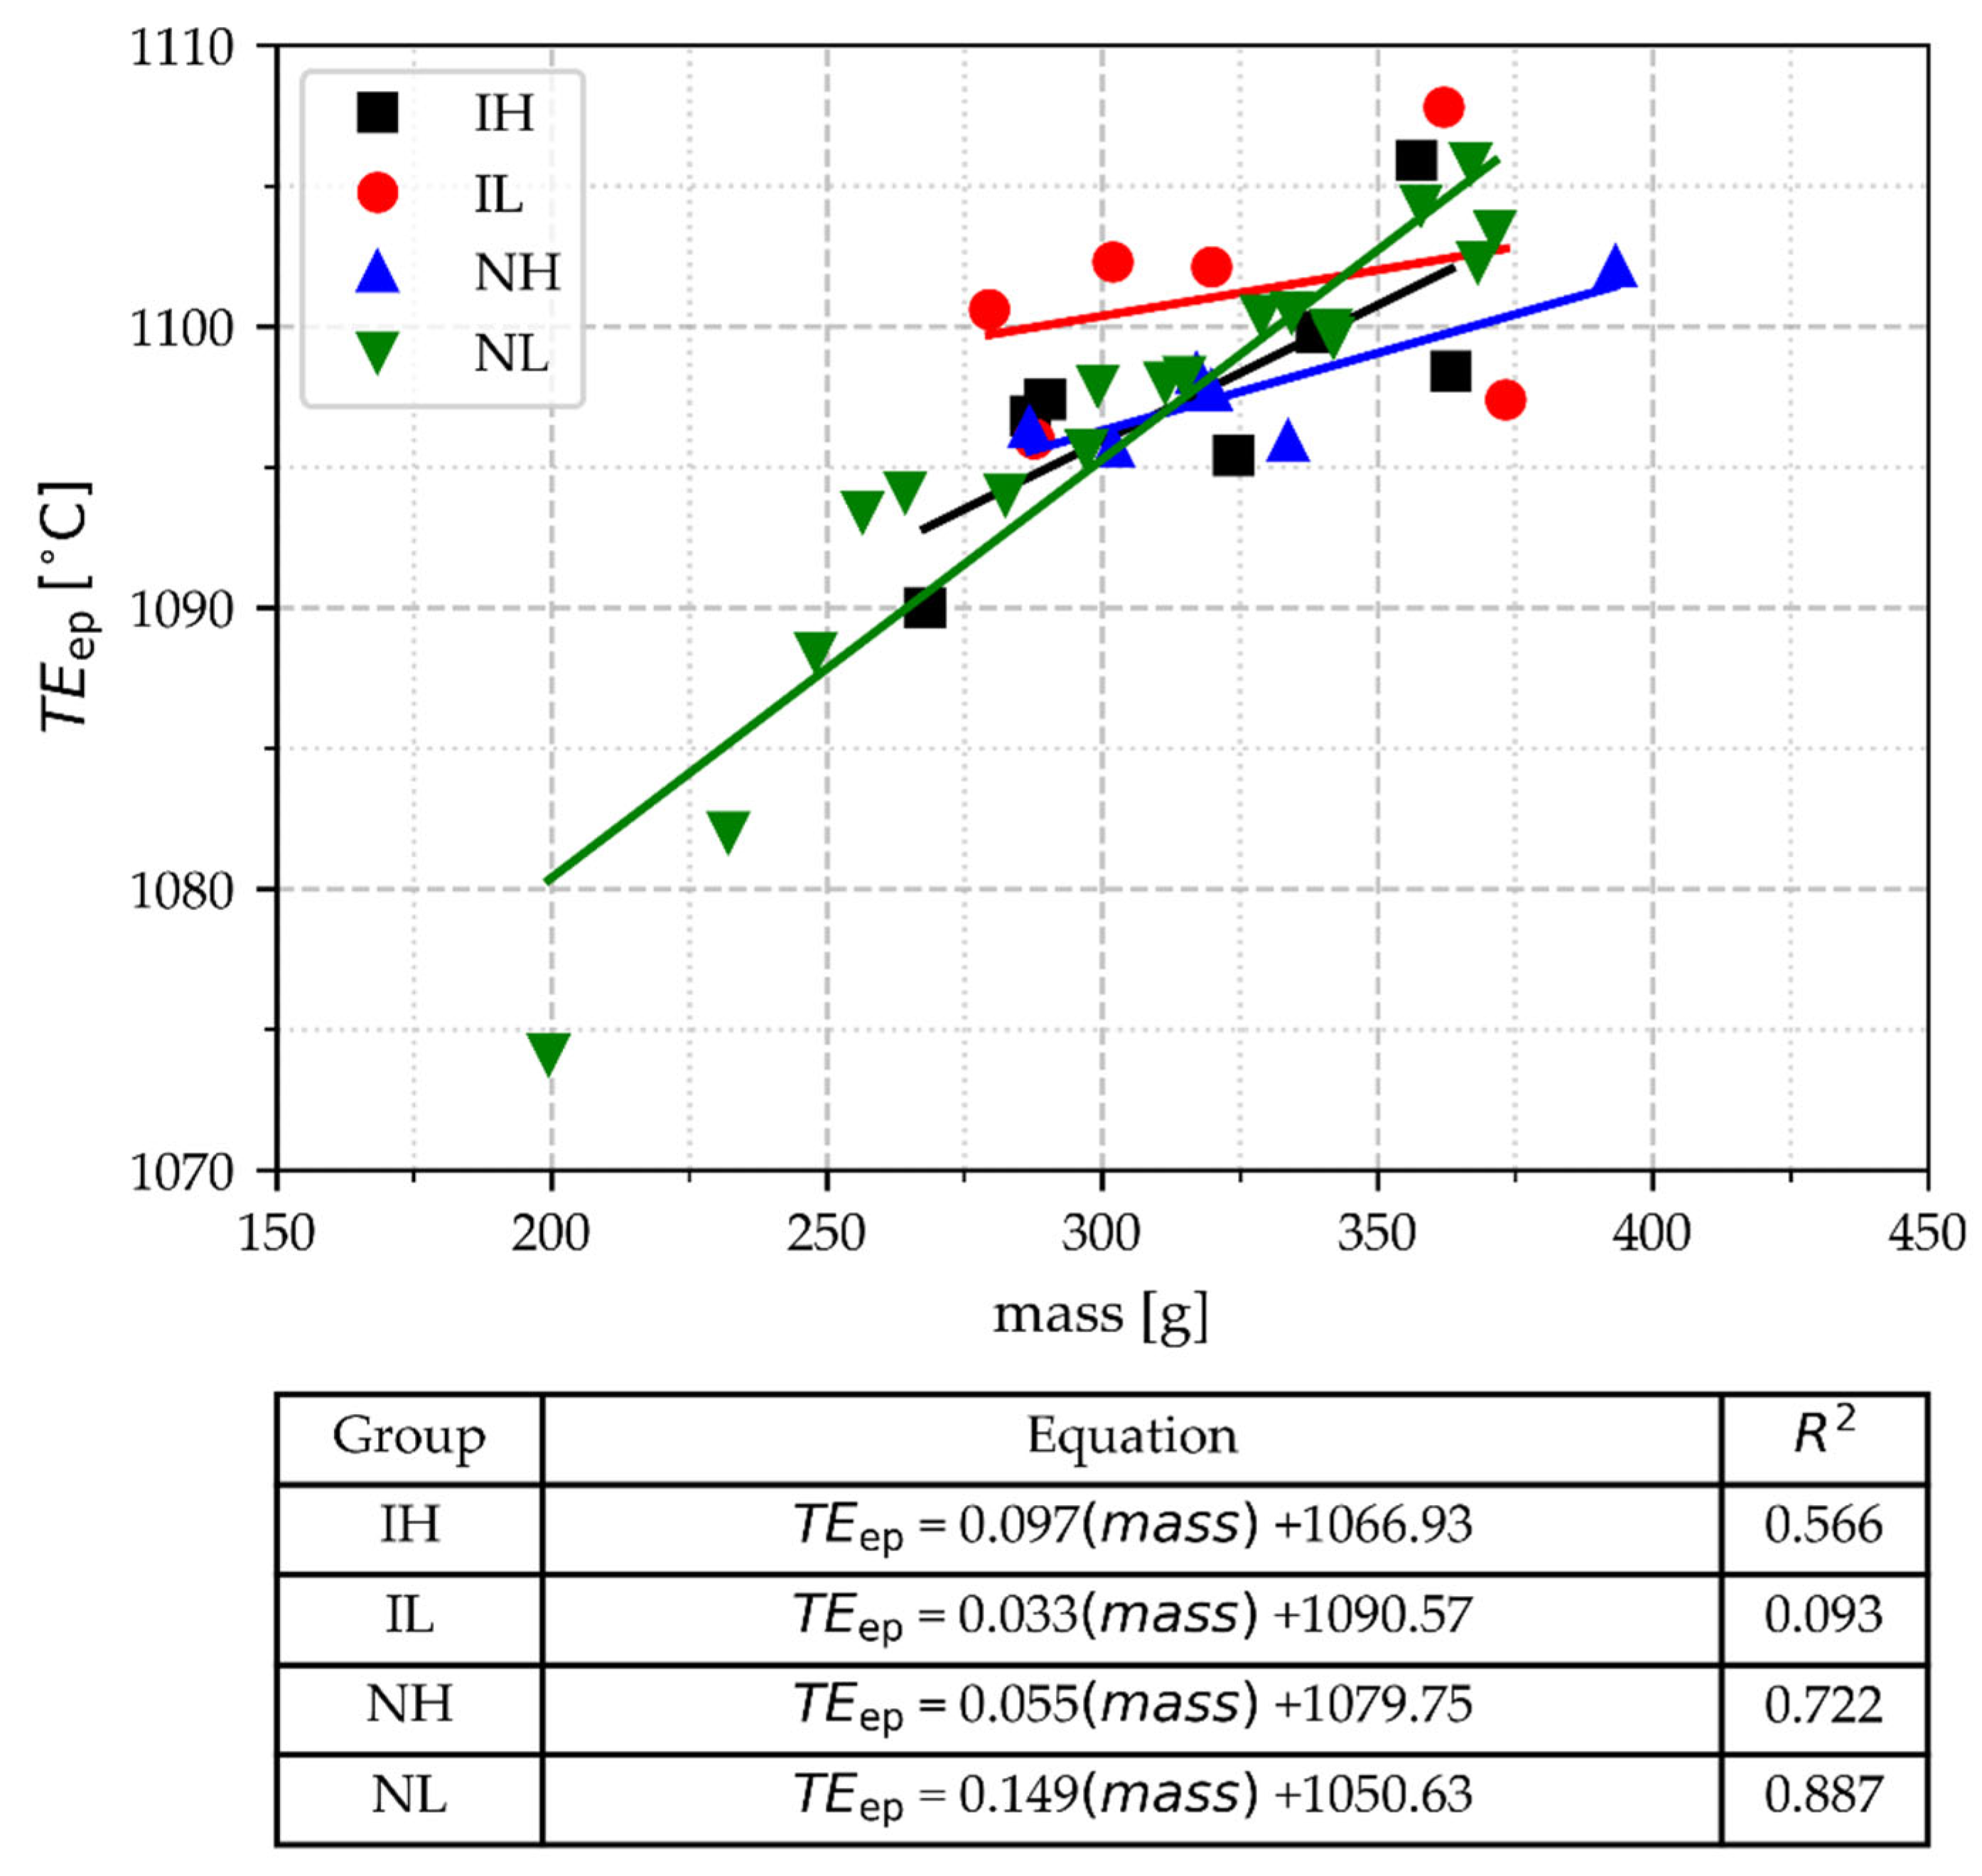
3.2.8. The Temperature of Deep Peak (TEep)
3.3. Microstructure
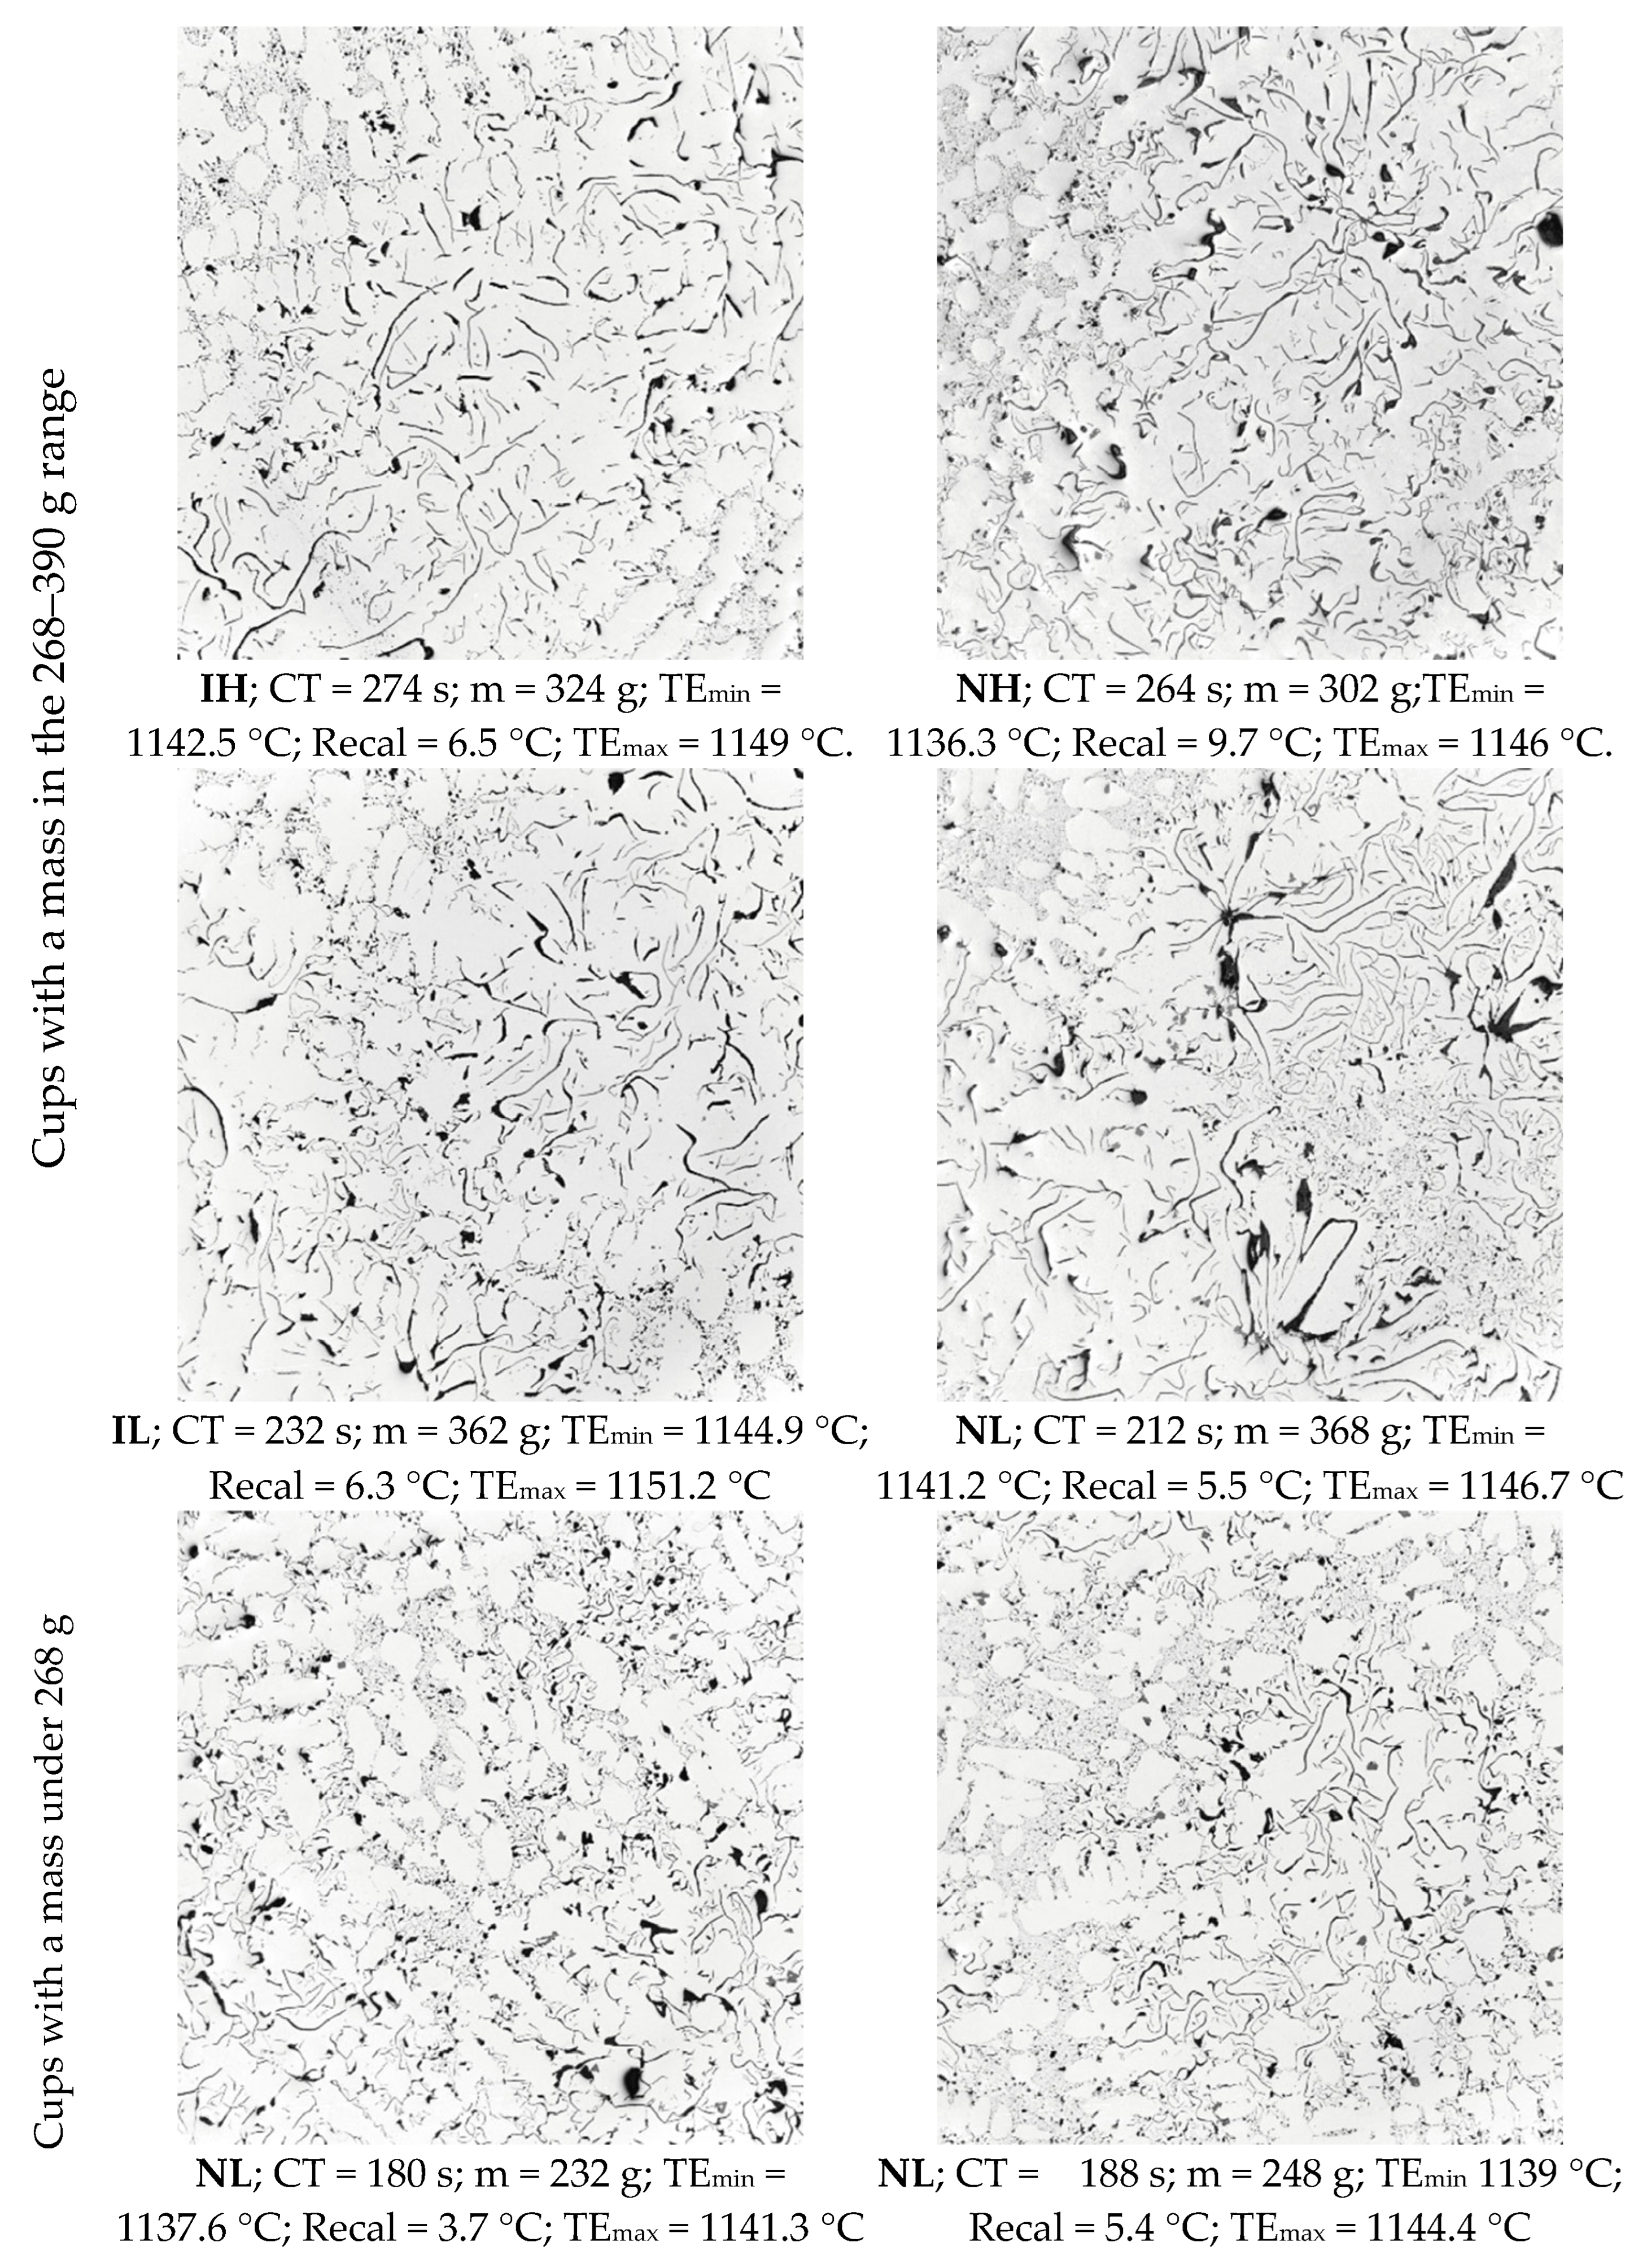
3.3.1. Graphite Flake Morphology
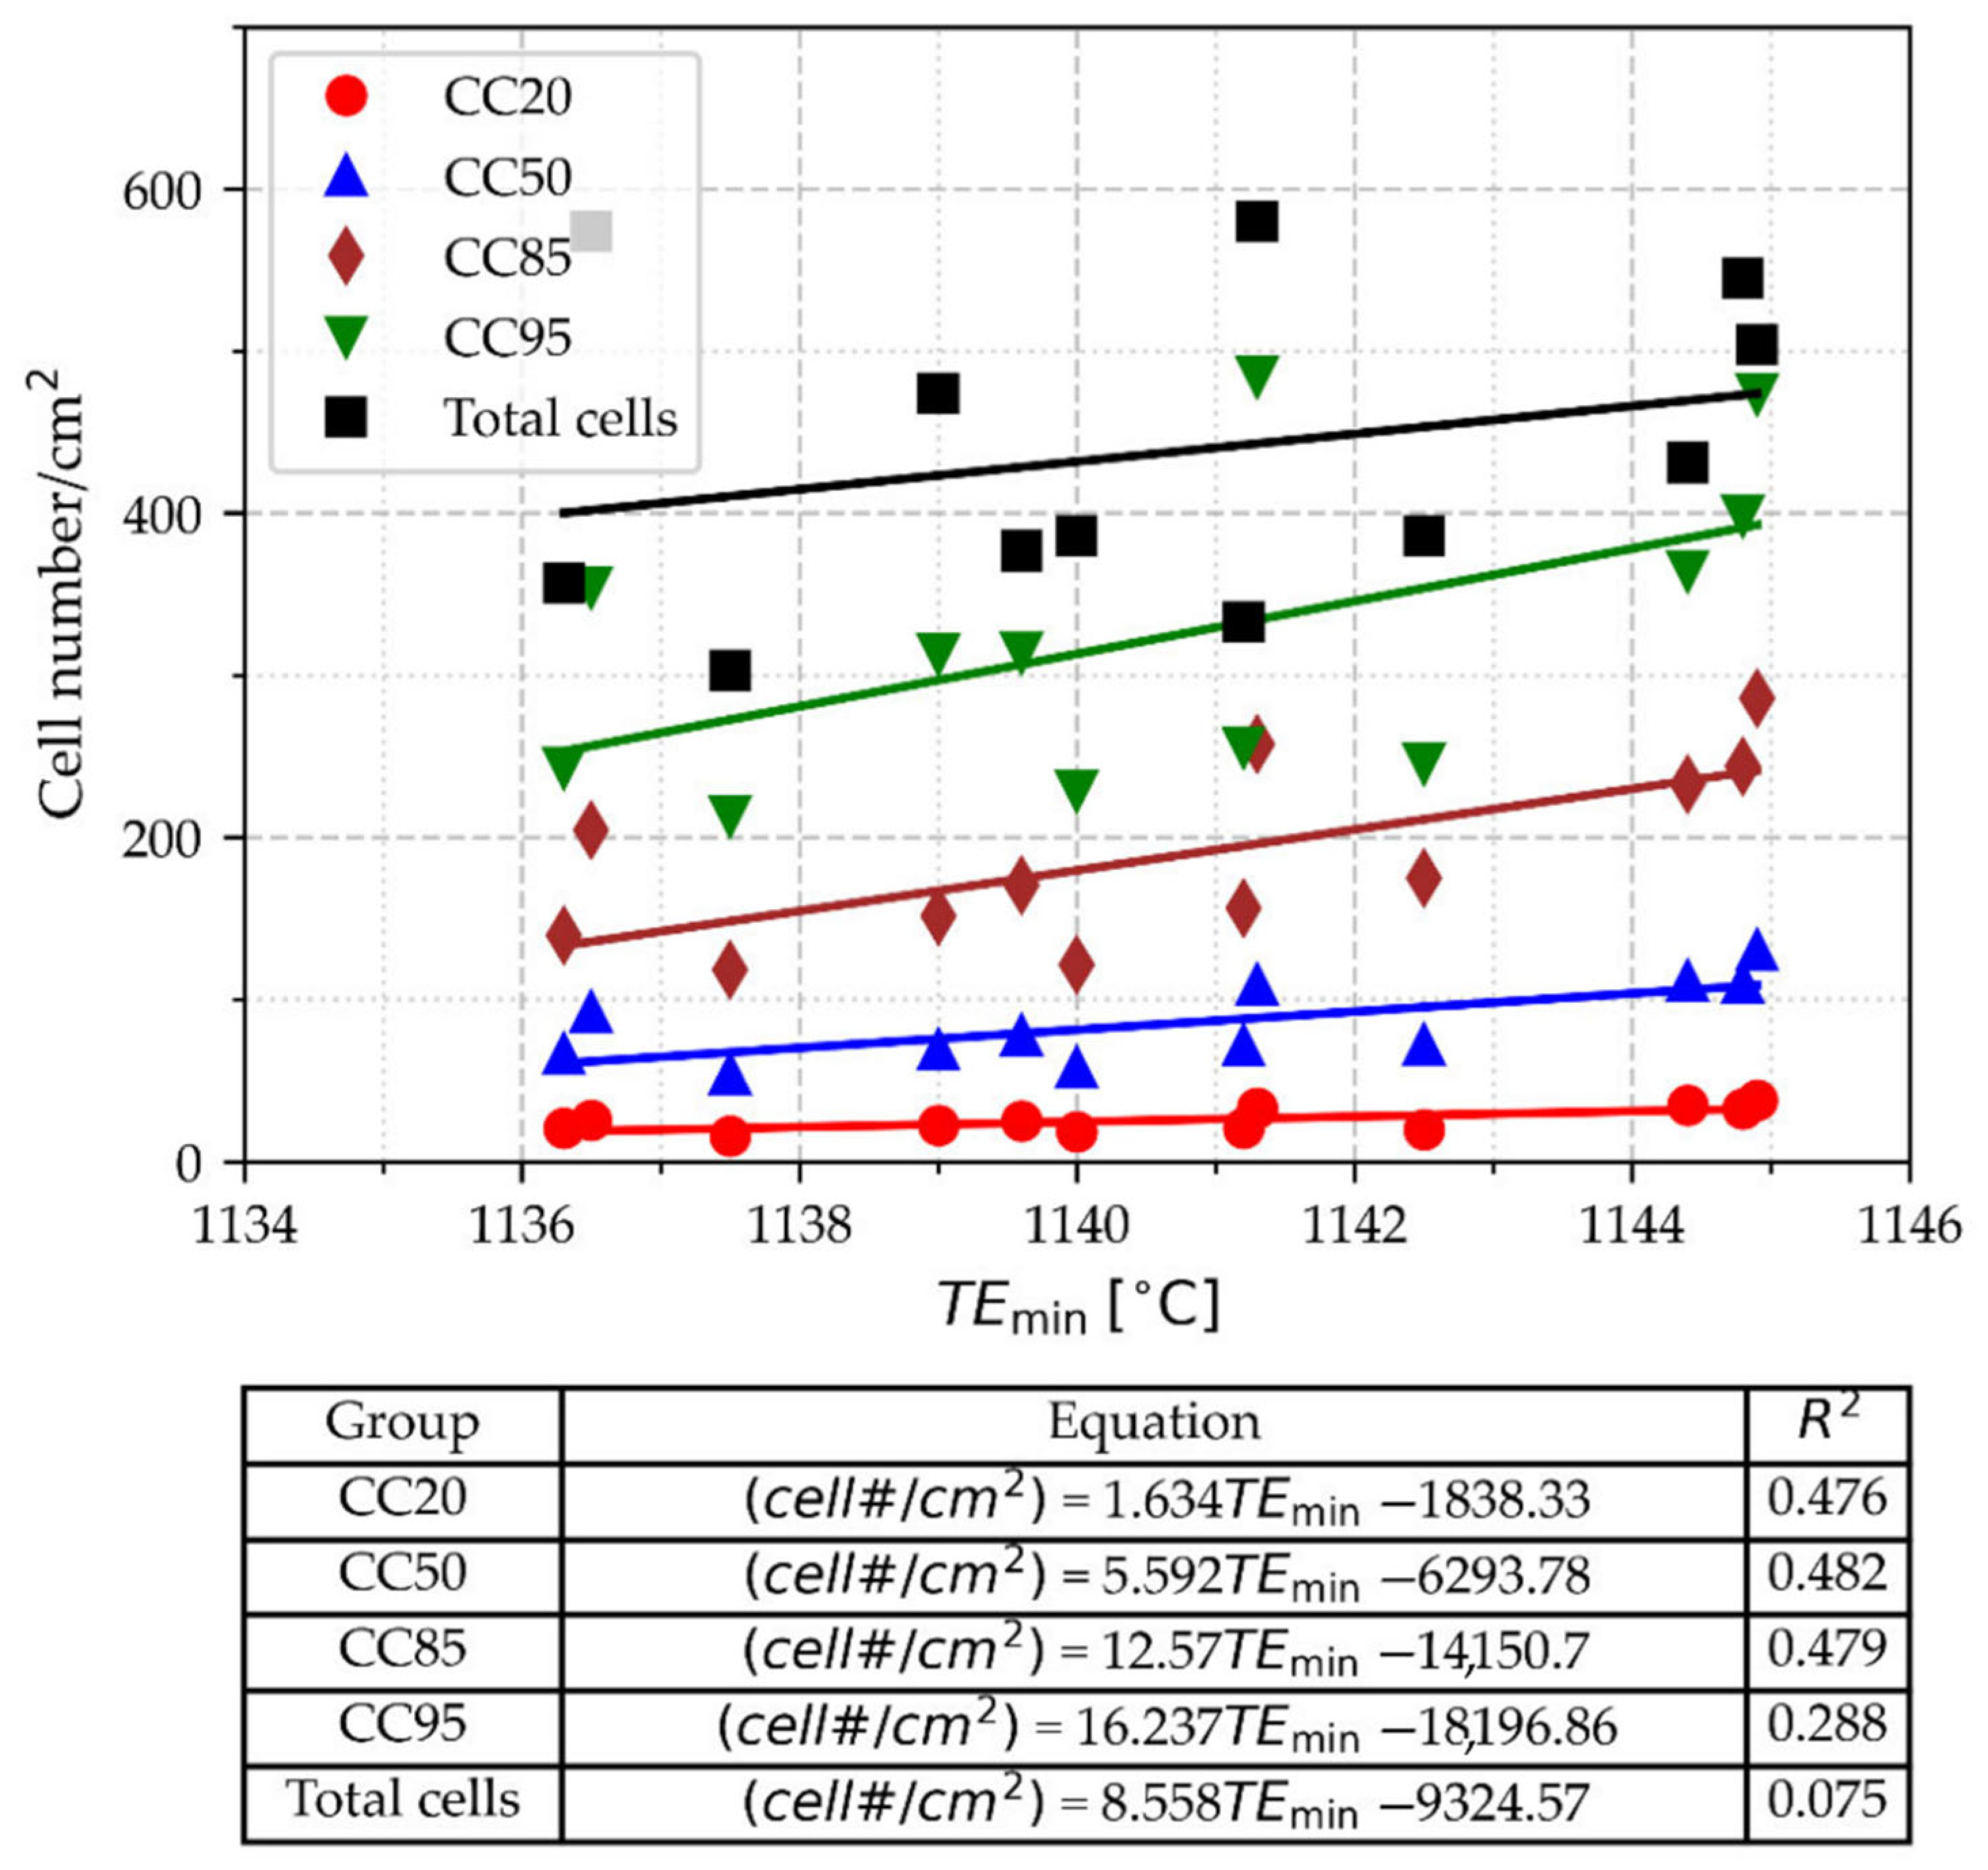
3.3.2. Cell Count
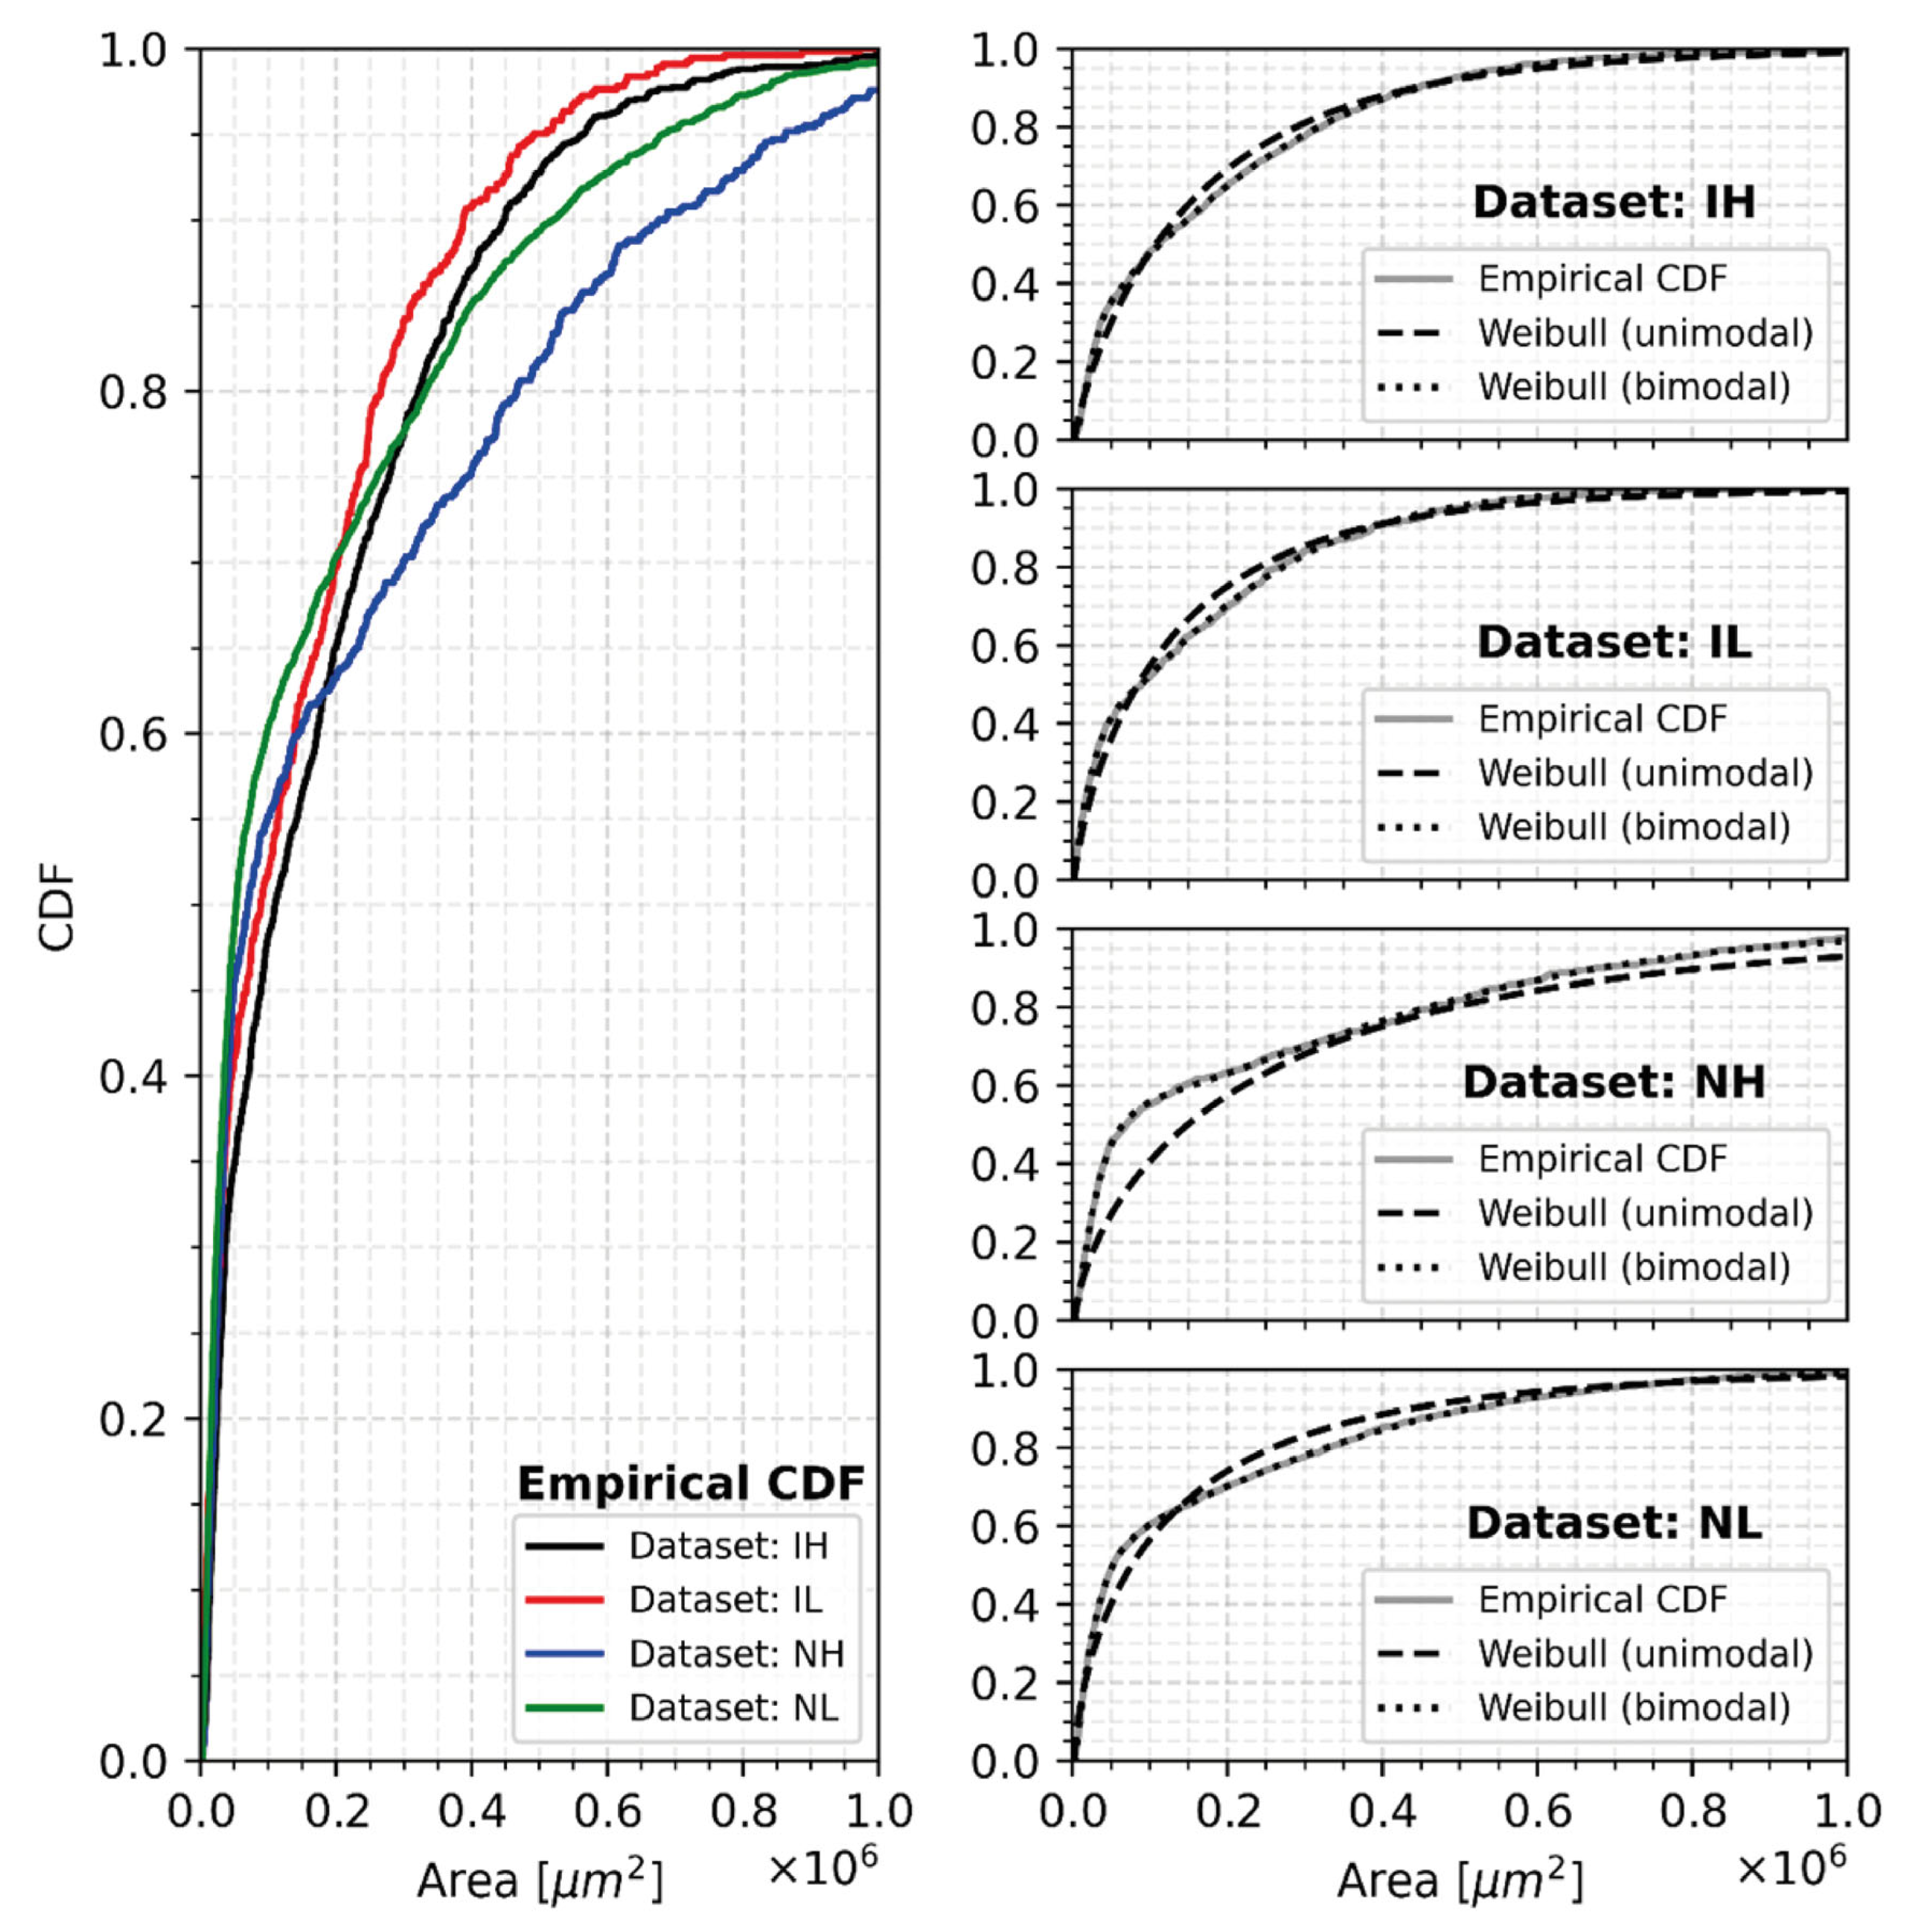
3.3.3. Statistical Analysis of Cell Count
4. Summary and Conclusions
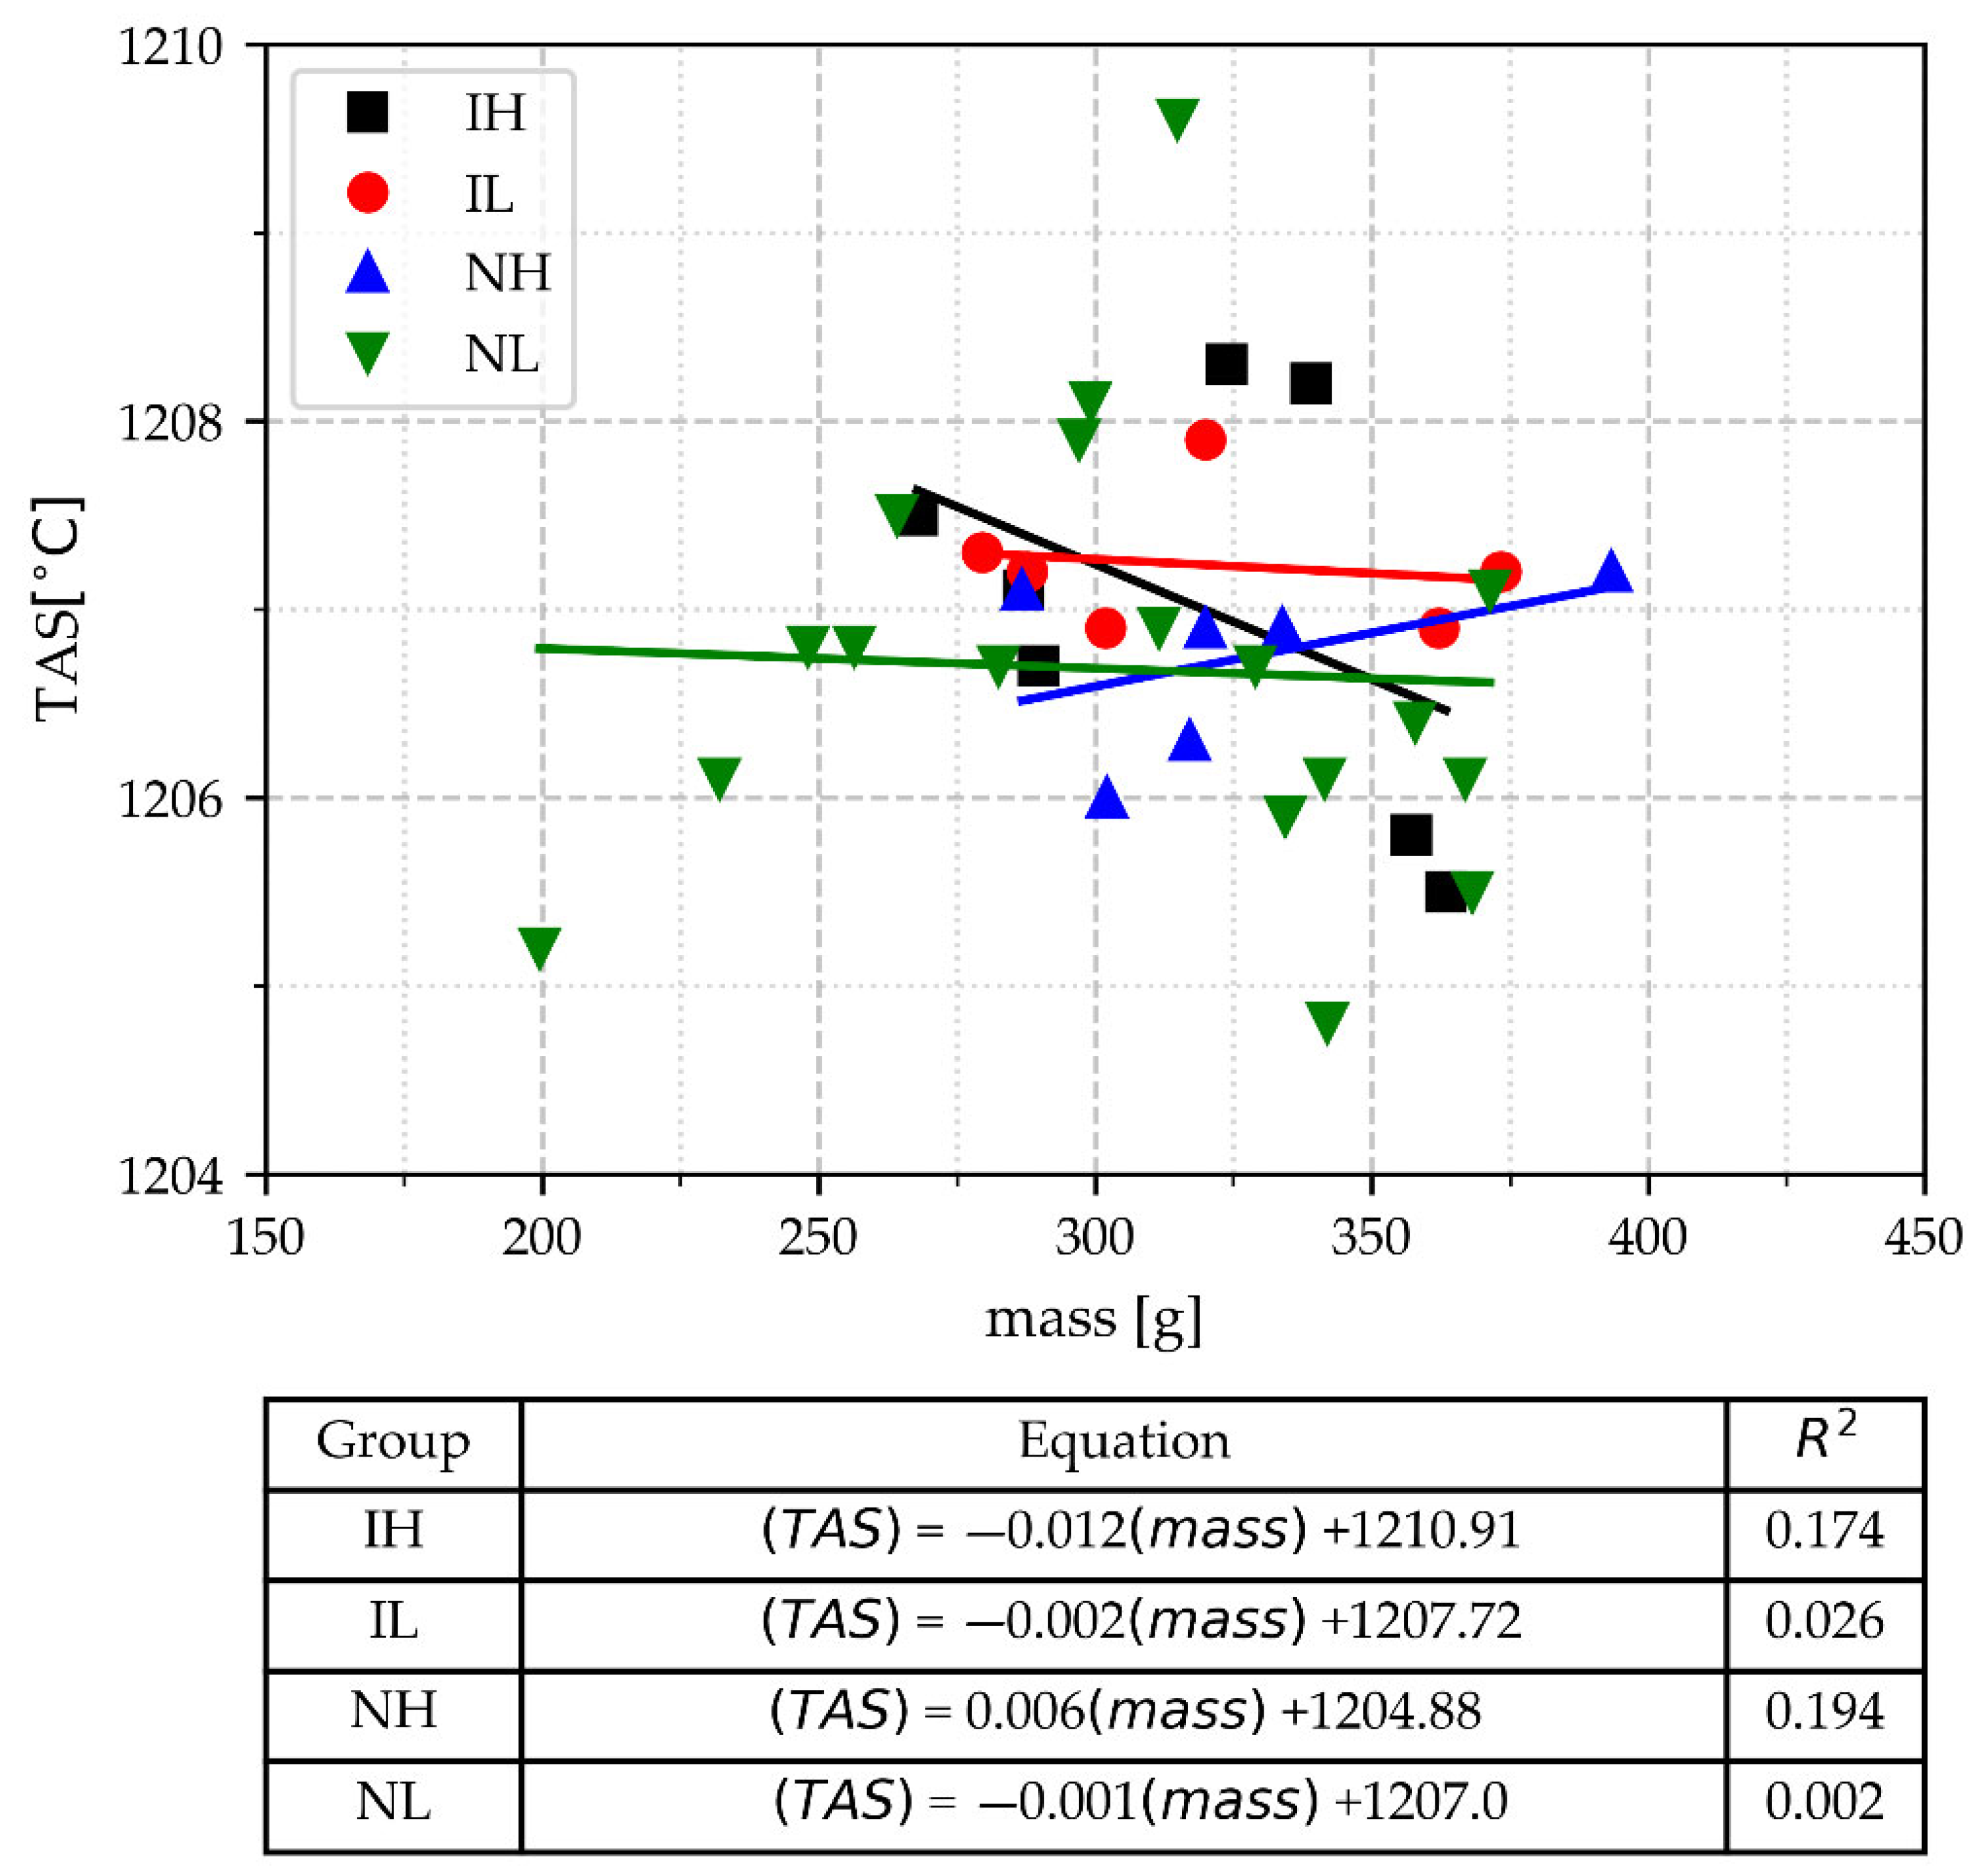
- The capability of the temperature of austenite solidification (TAS) for estimating CE is not affected by the pouring temperature (Tmax), inoculation, or the cup’s mass, even if the cups are from the group with a lighter mass. The values of the CE estimated with the TAS (CETA) are placed into a nearly identical range of values as compared with CE values obtained by chemical analysis.
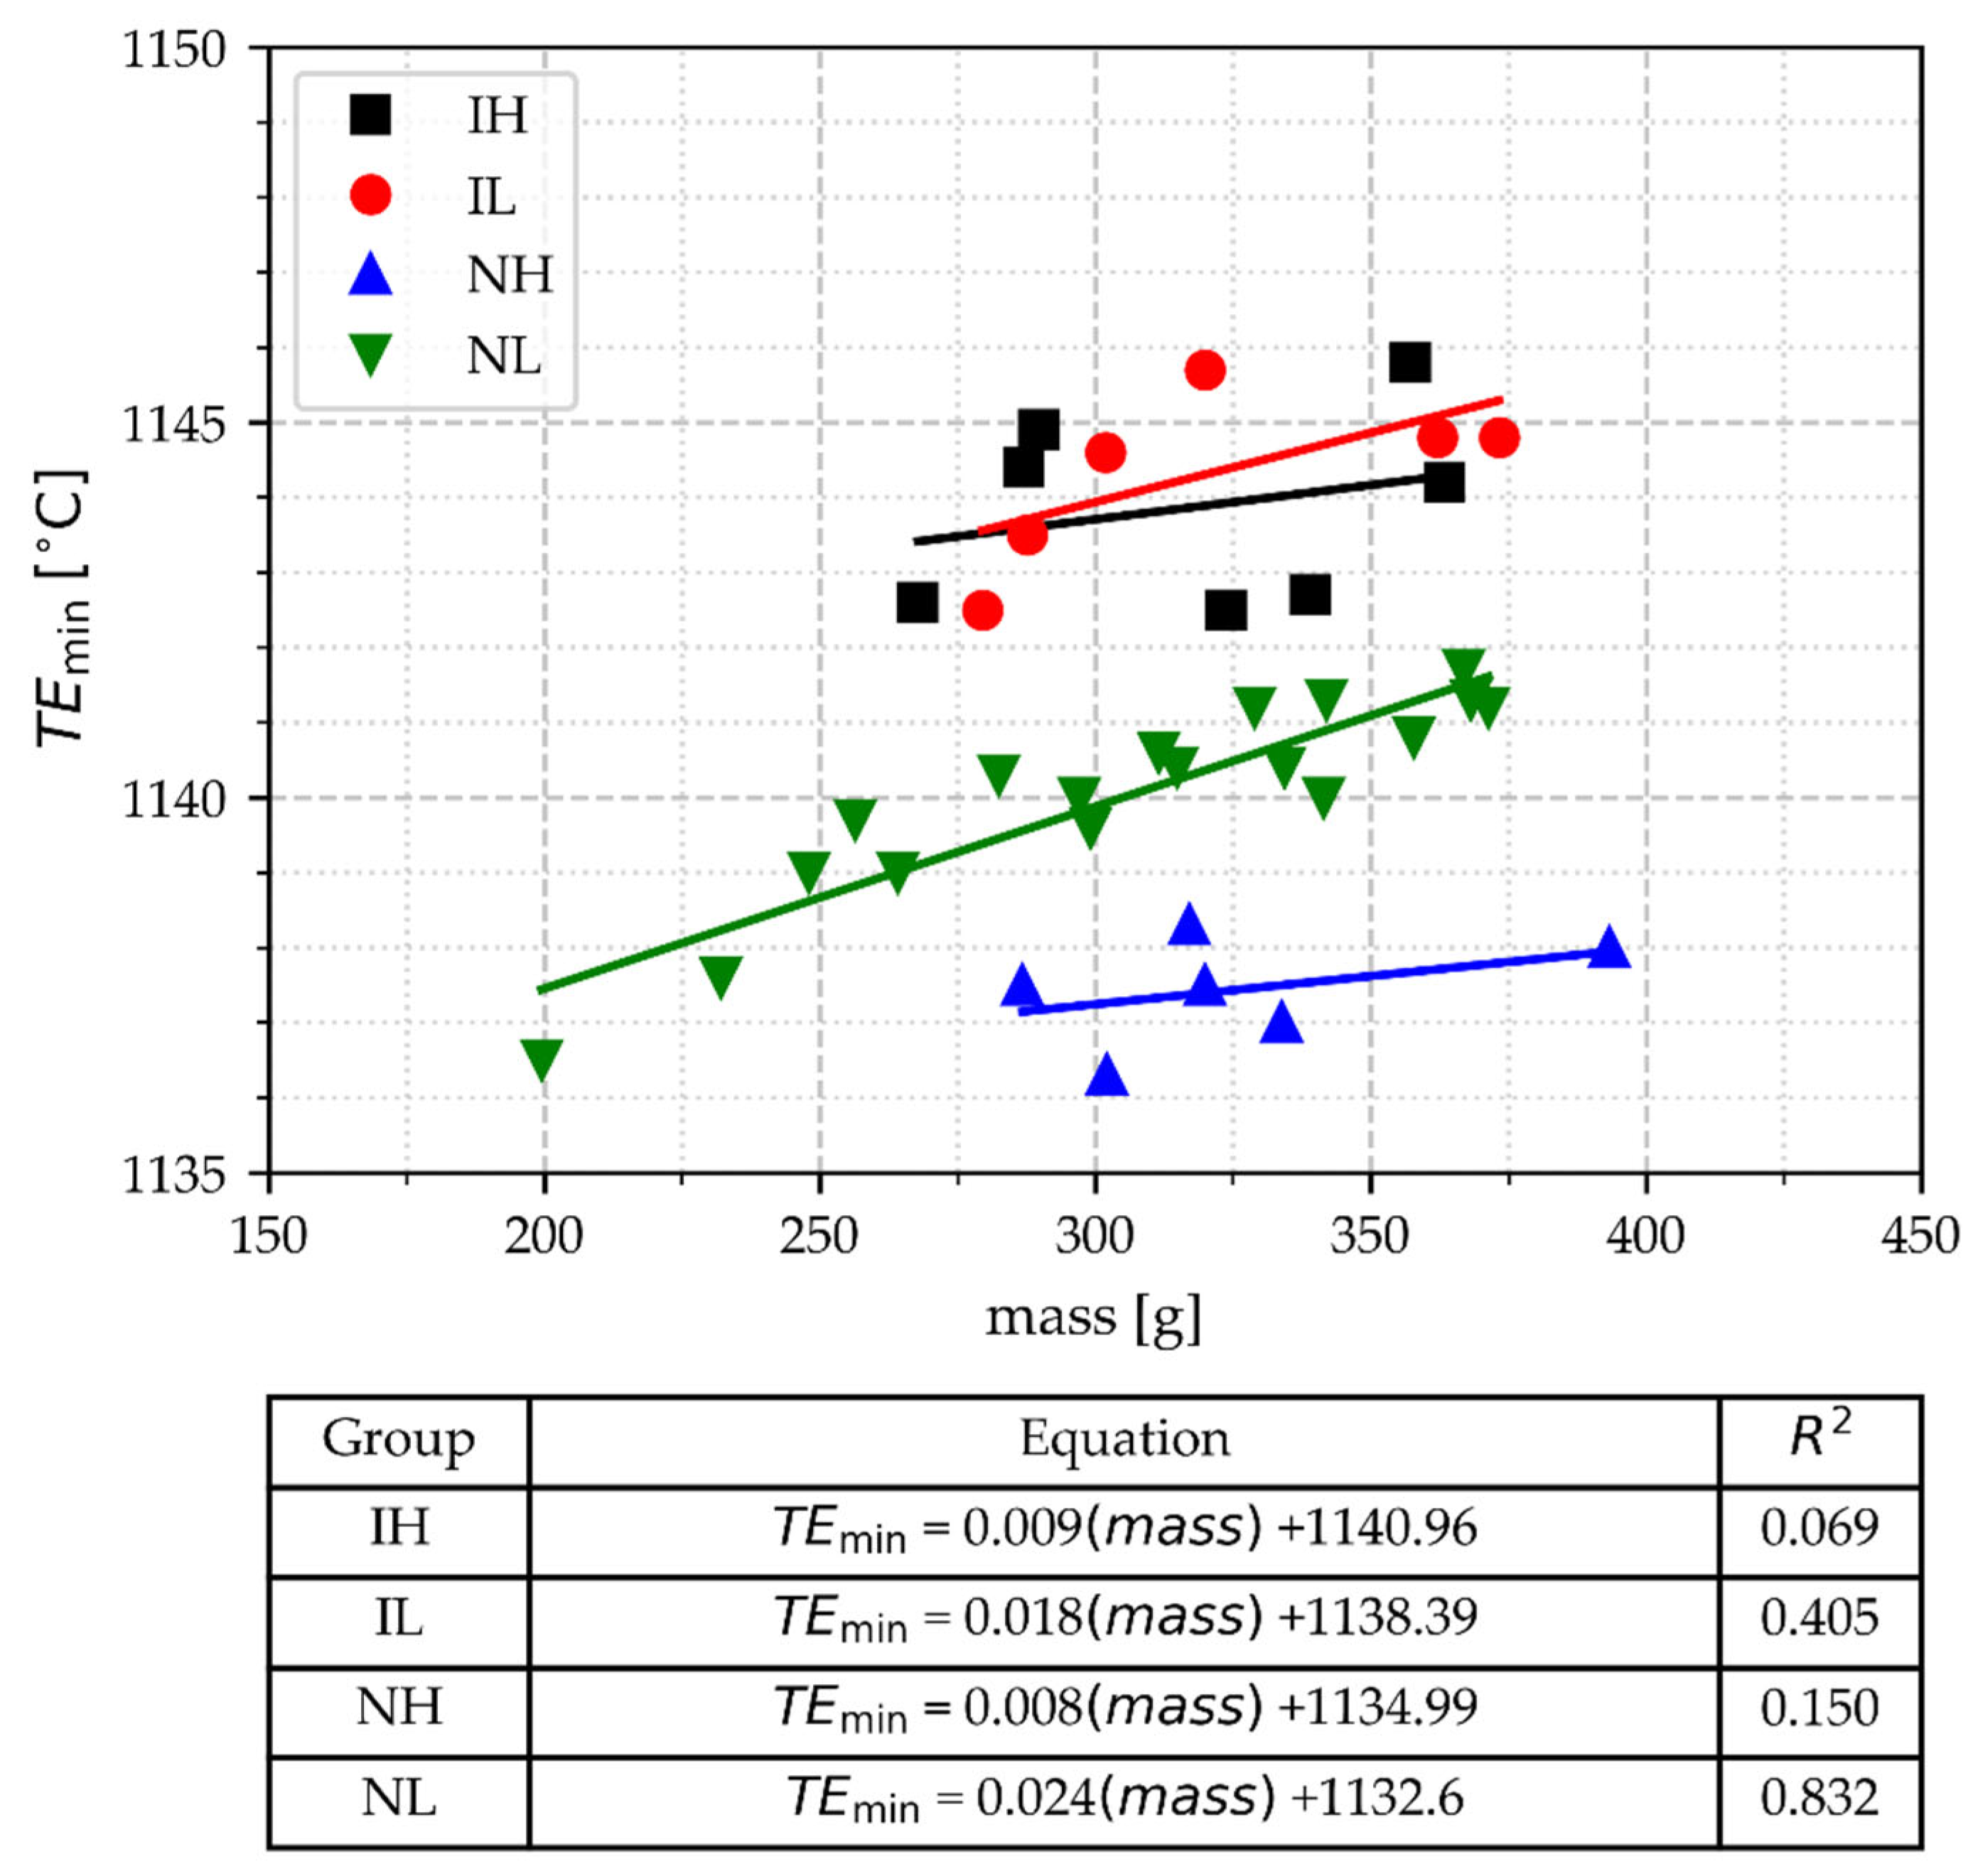
- TEmin was able to discriminate the group of inoculated cups from non-inoculated cups. TEmin values for inoculated samples filled at low and at high pouring temperatures overlap. In contrast, the TEmin allows for distinguishing the non-inoculated samples by their pouring temperature range, except for two data points corresponding to lighter cups.
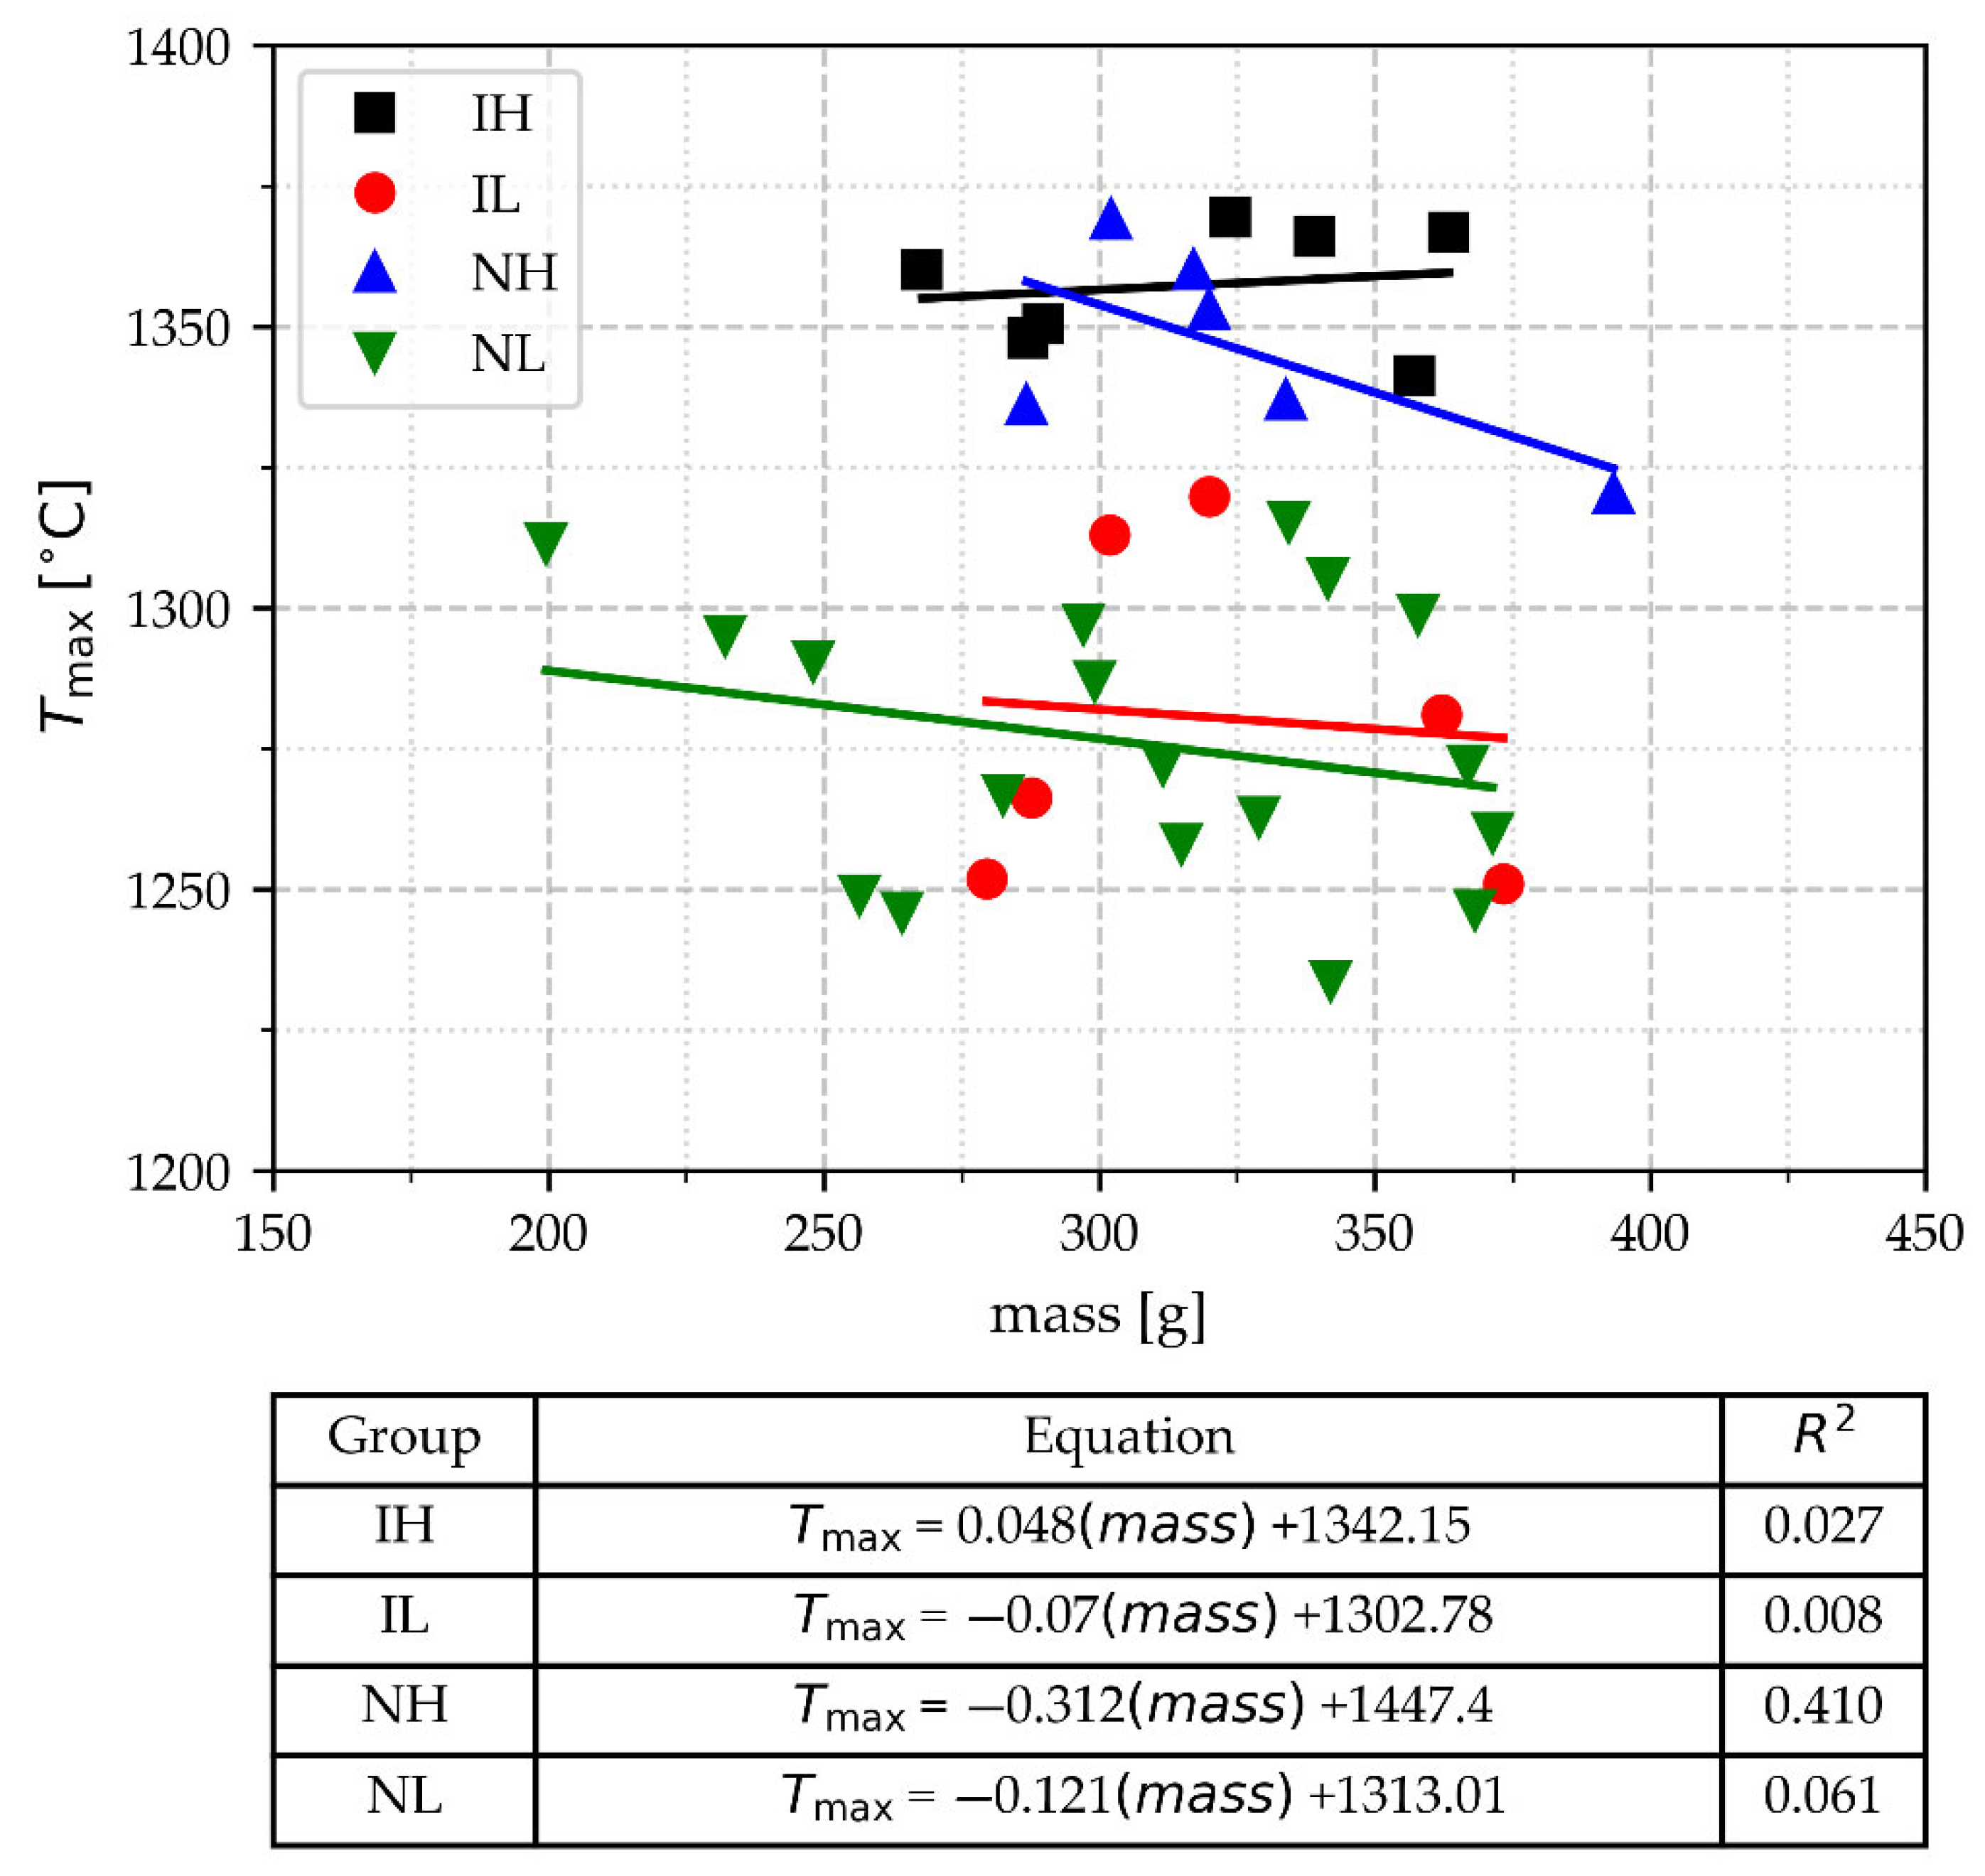
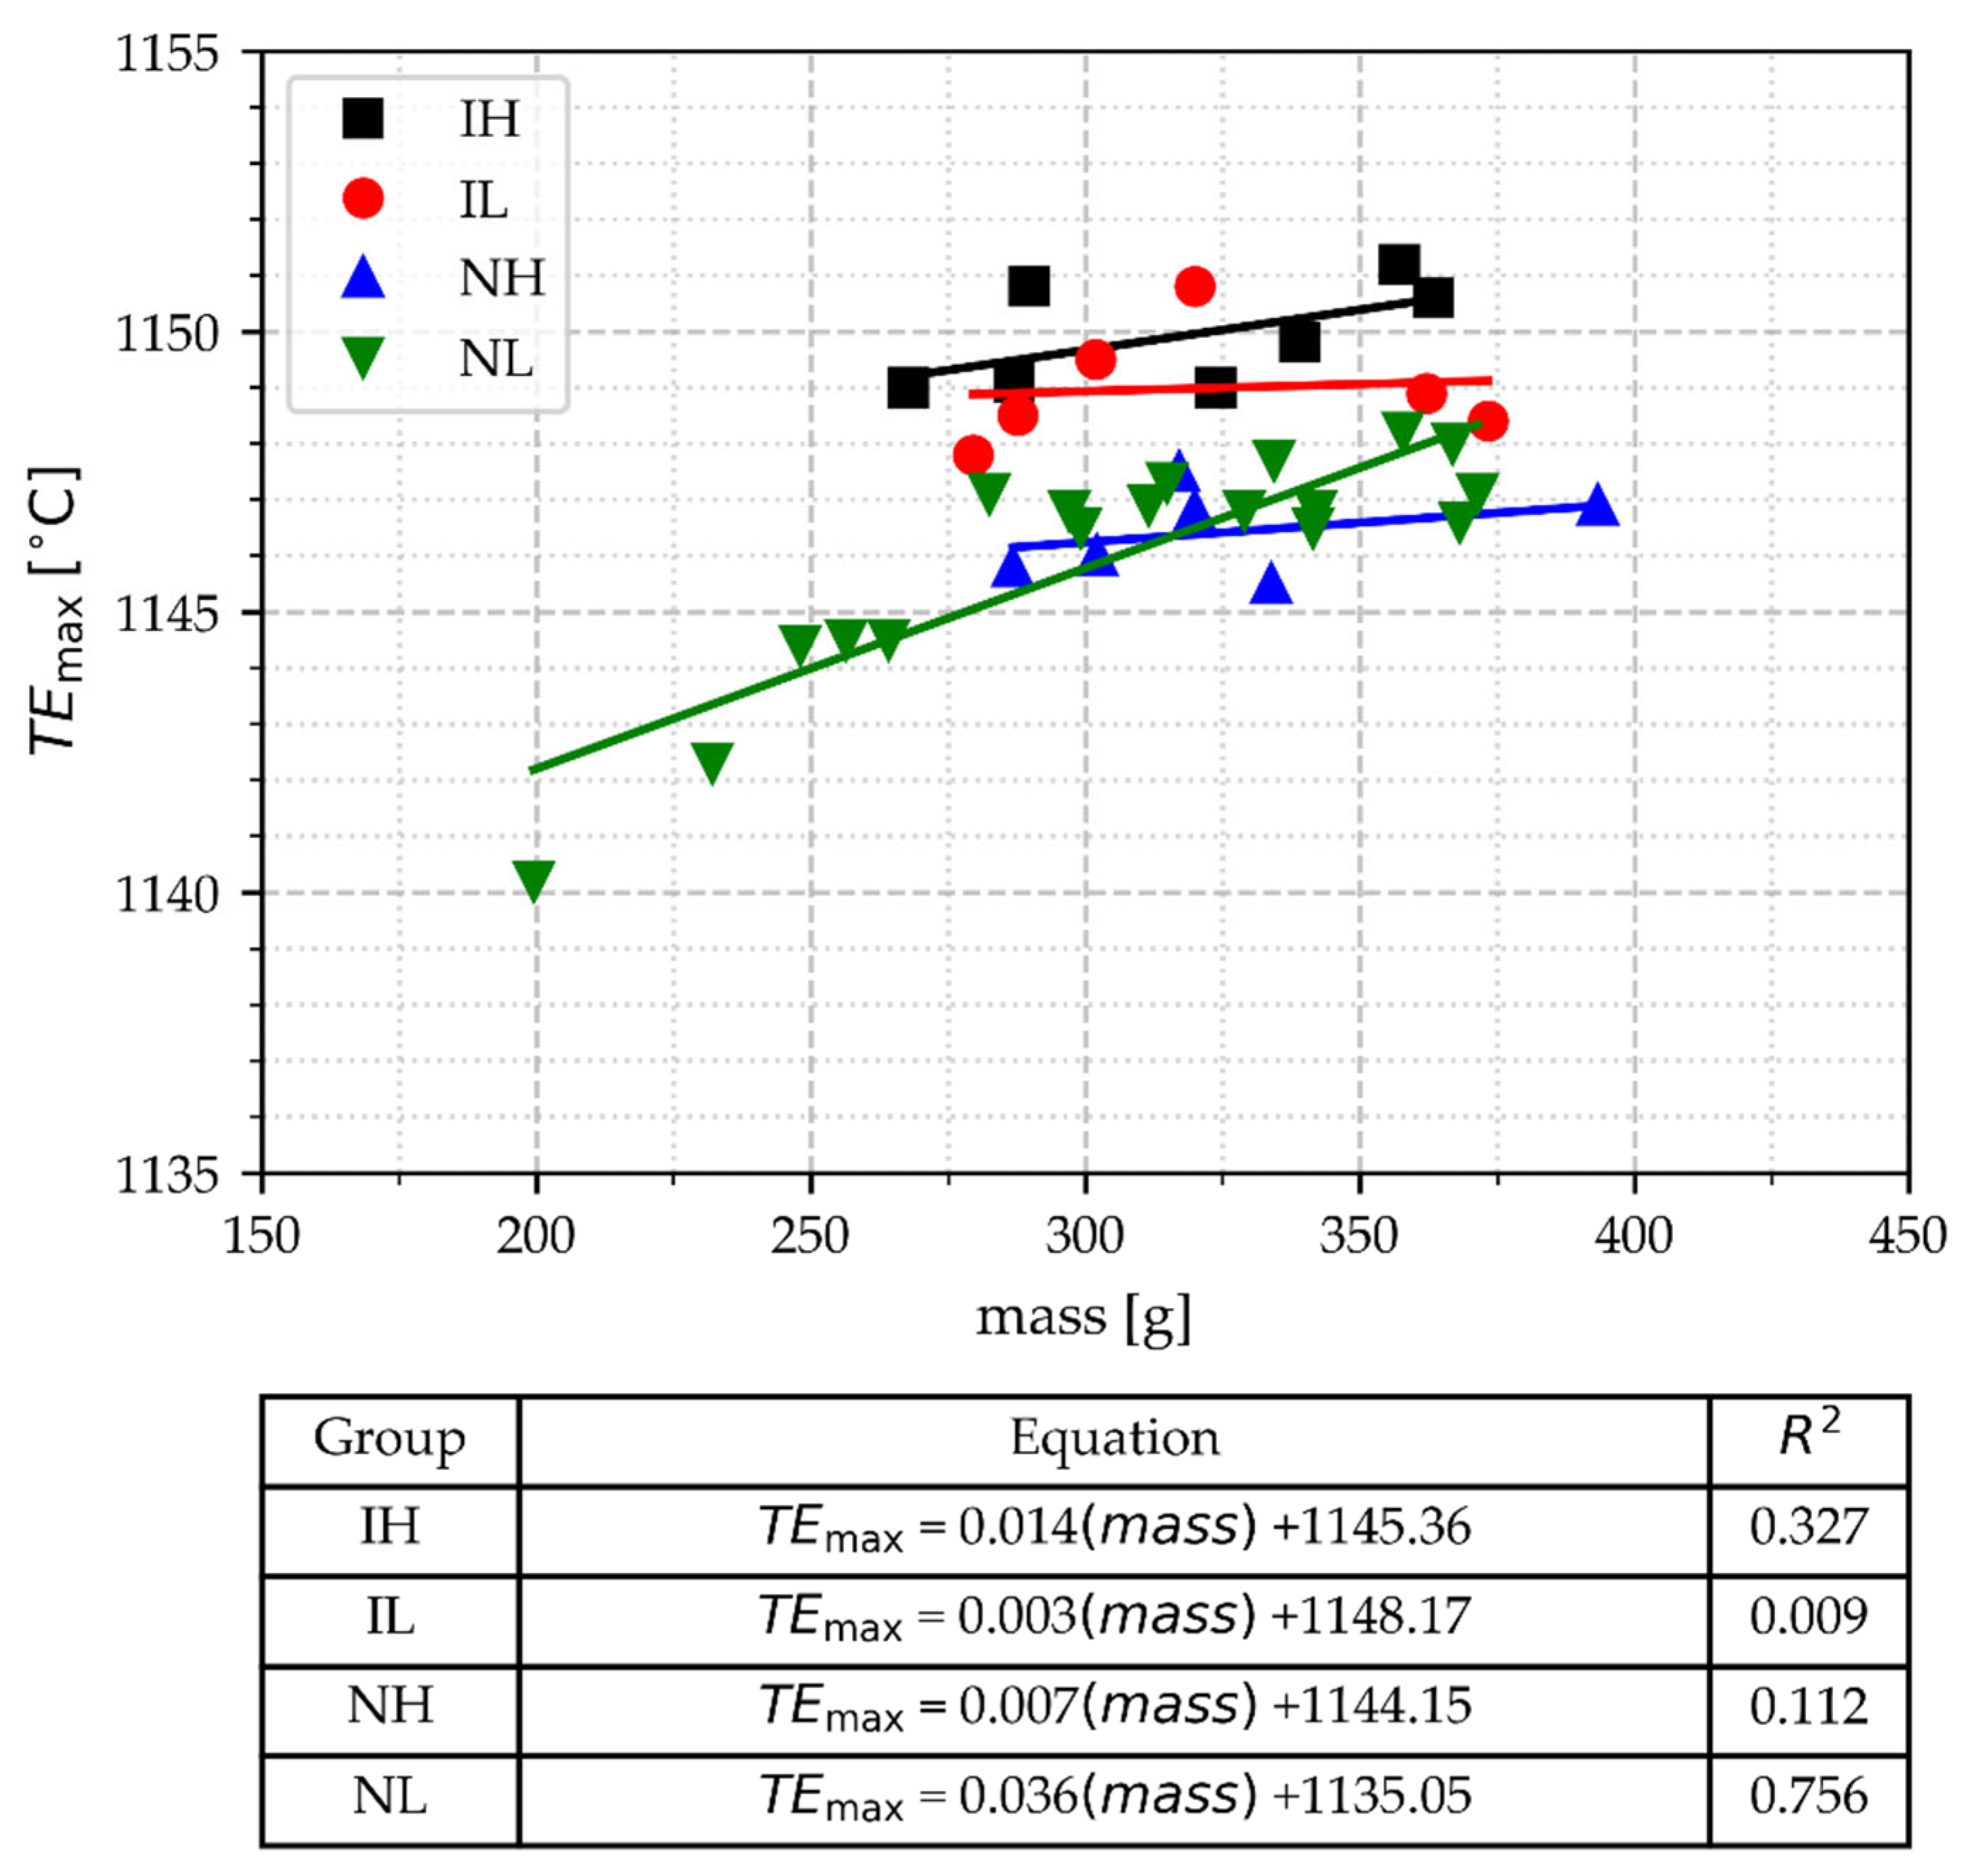
- The results showed that TEmax allows for the distinction between cups inoculated and those not inoculated, with some overlapping in its boundary. However, in both types of samples—those inoculated and those not inoculated—it is not possible to distinguish between those poured at high and low temperatures. Lighter samples with cooling times under 180 s are related to the lowest values of TEmax.
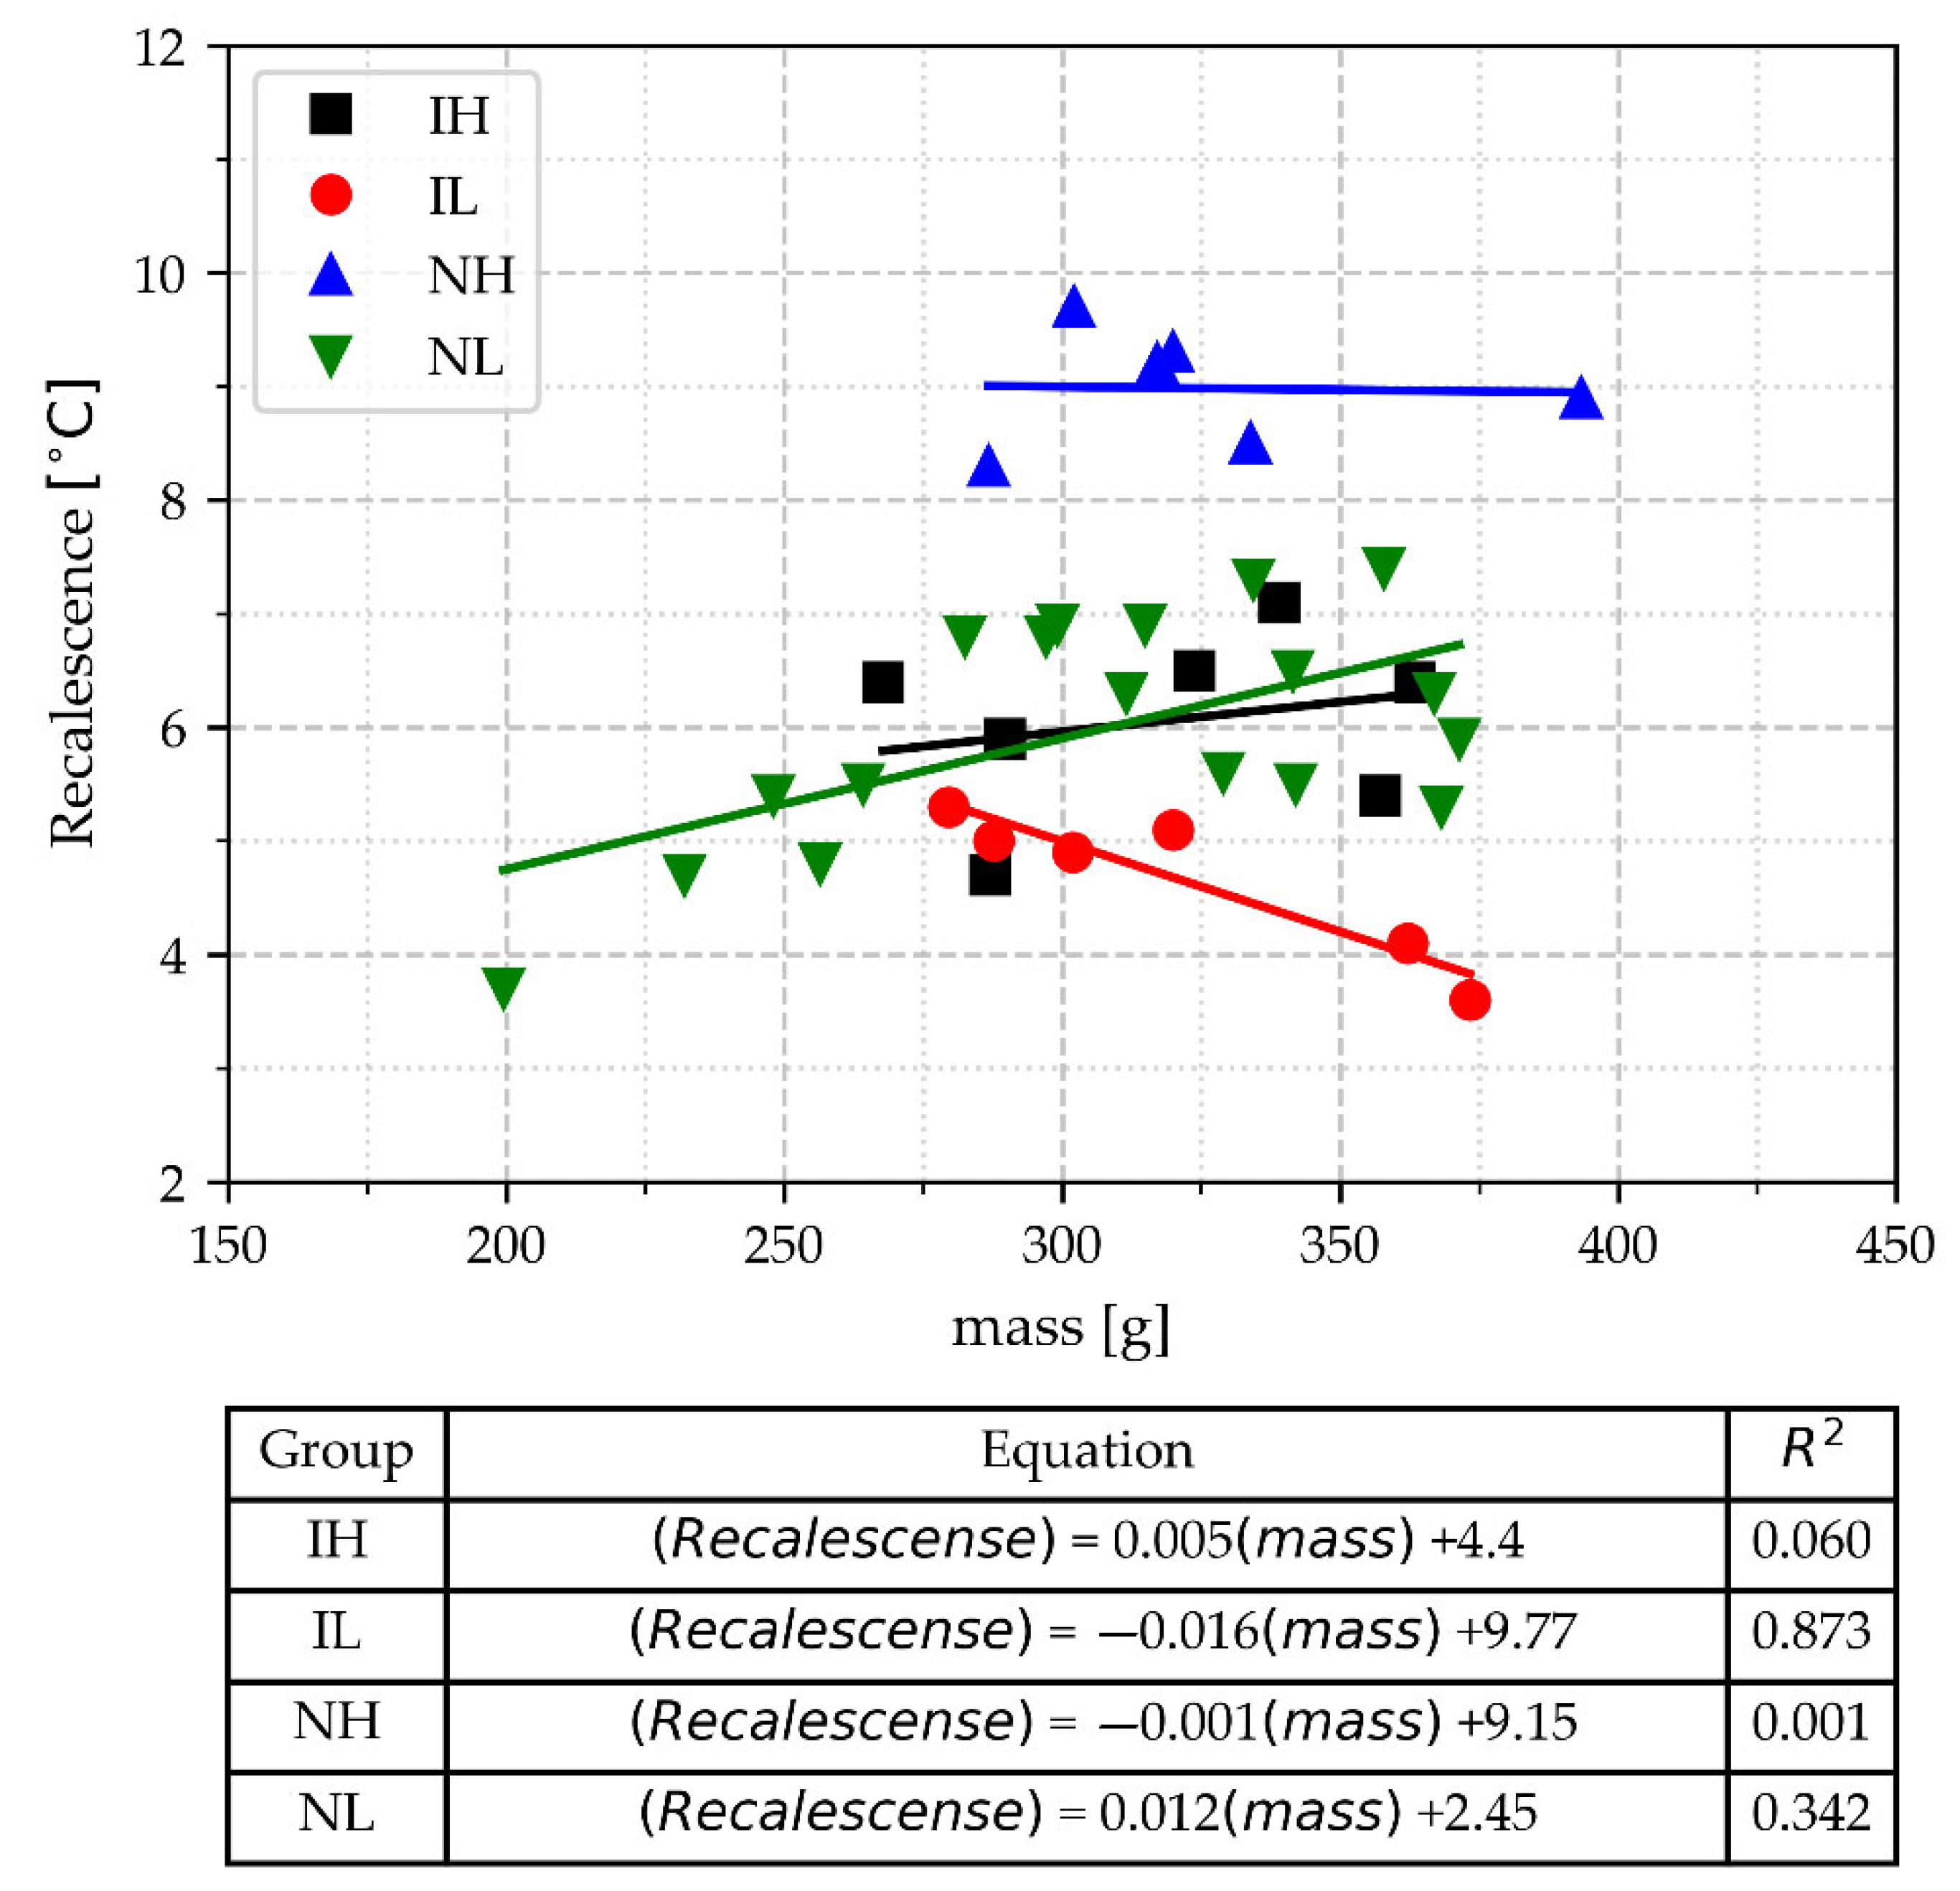
- In cups with a mass range of 268–390 g, the recalescence (Recal) can distinguish the samples that are non-inoculated and poured at a high-temperature range from the others. It can even discriminate between the group of inoculated samples poured at a low-temperature range and the samples of other processing conditions, except for three non-inoculated light samples poured at a low-temperature range, which have recalescence values that overlap with this group. This overlap hinders Recal’s ability to detect poor inoculation conditions in the melt because these non-inoculated light samples are confused with those of good inoculation conditions.
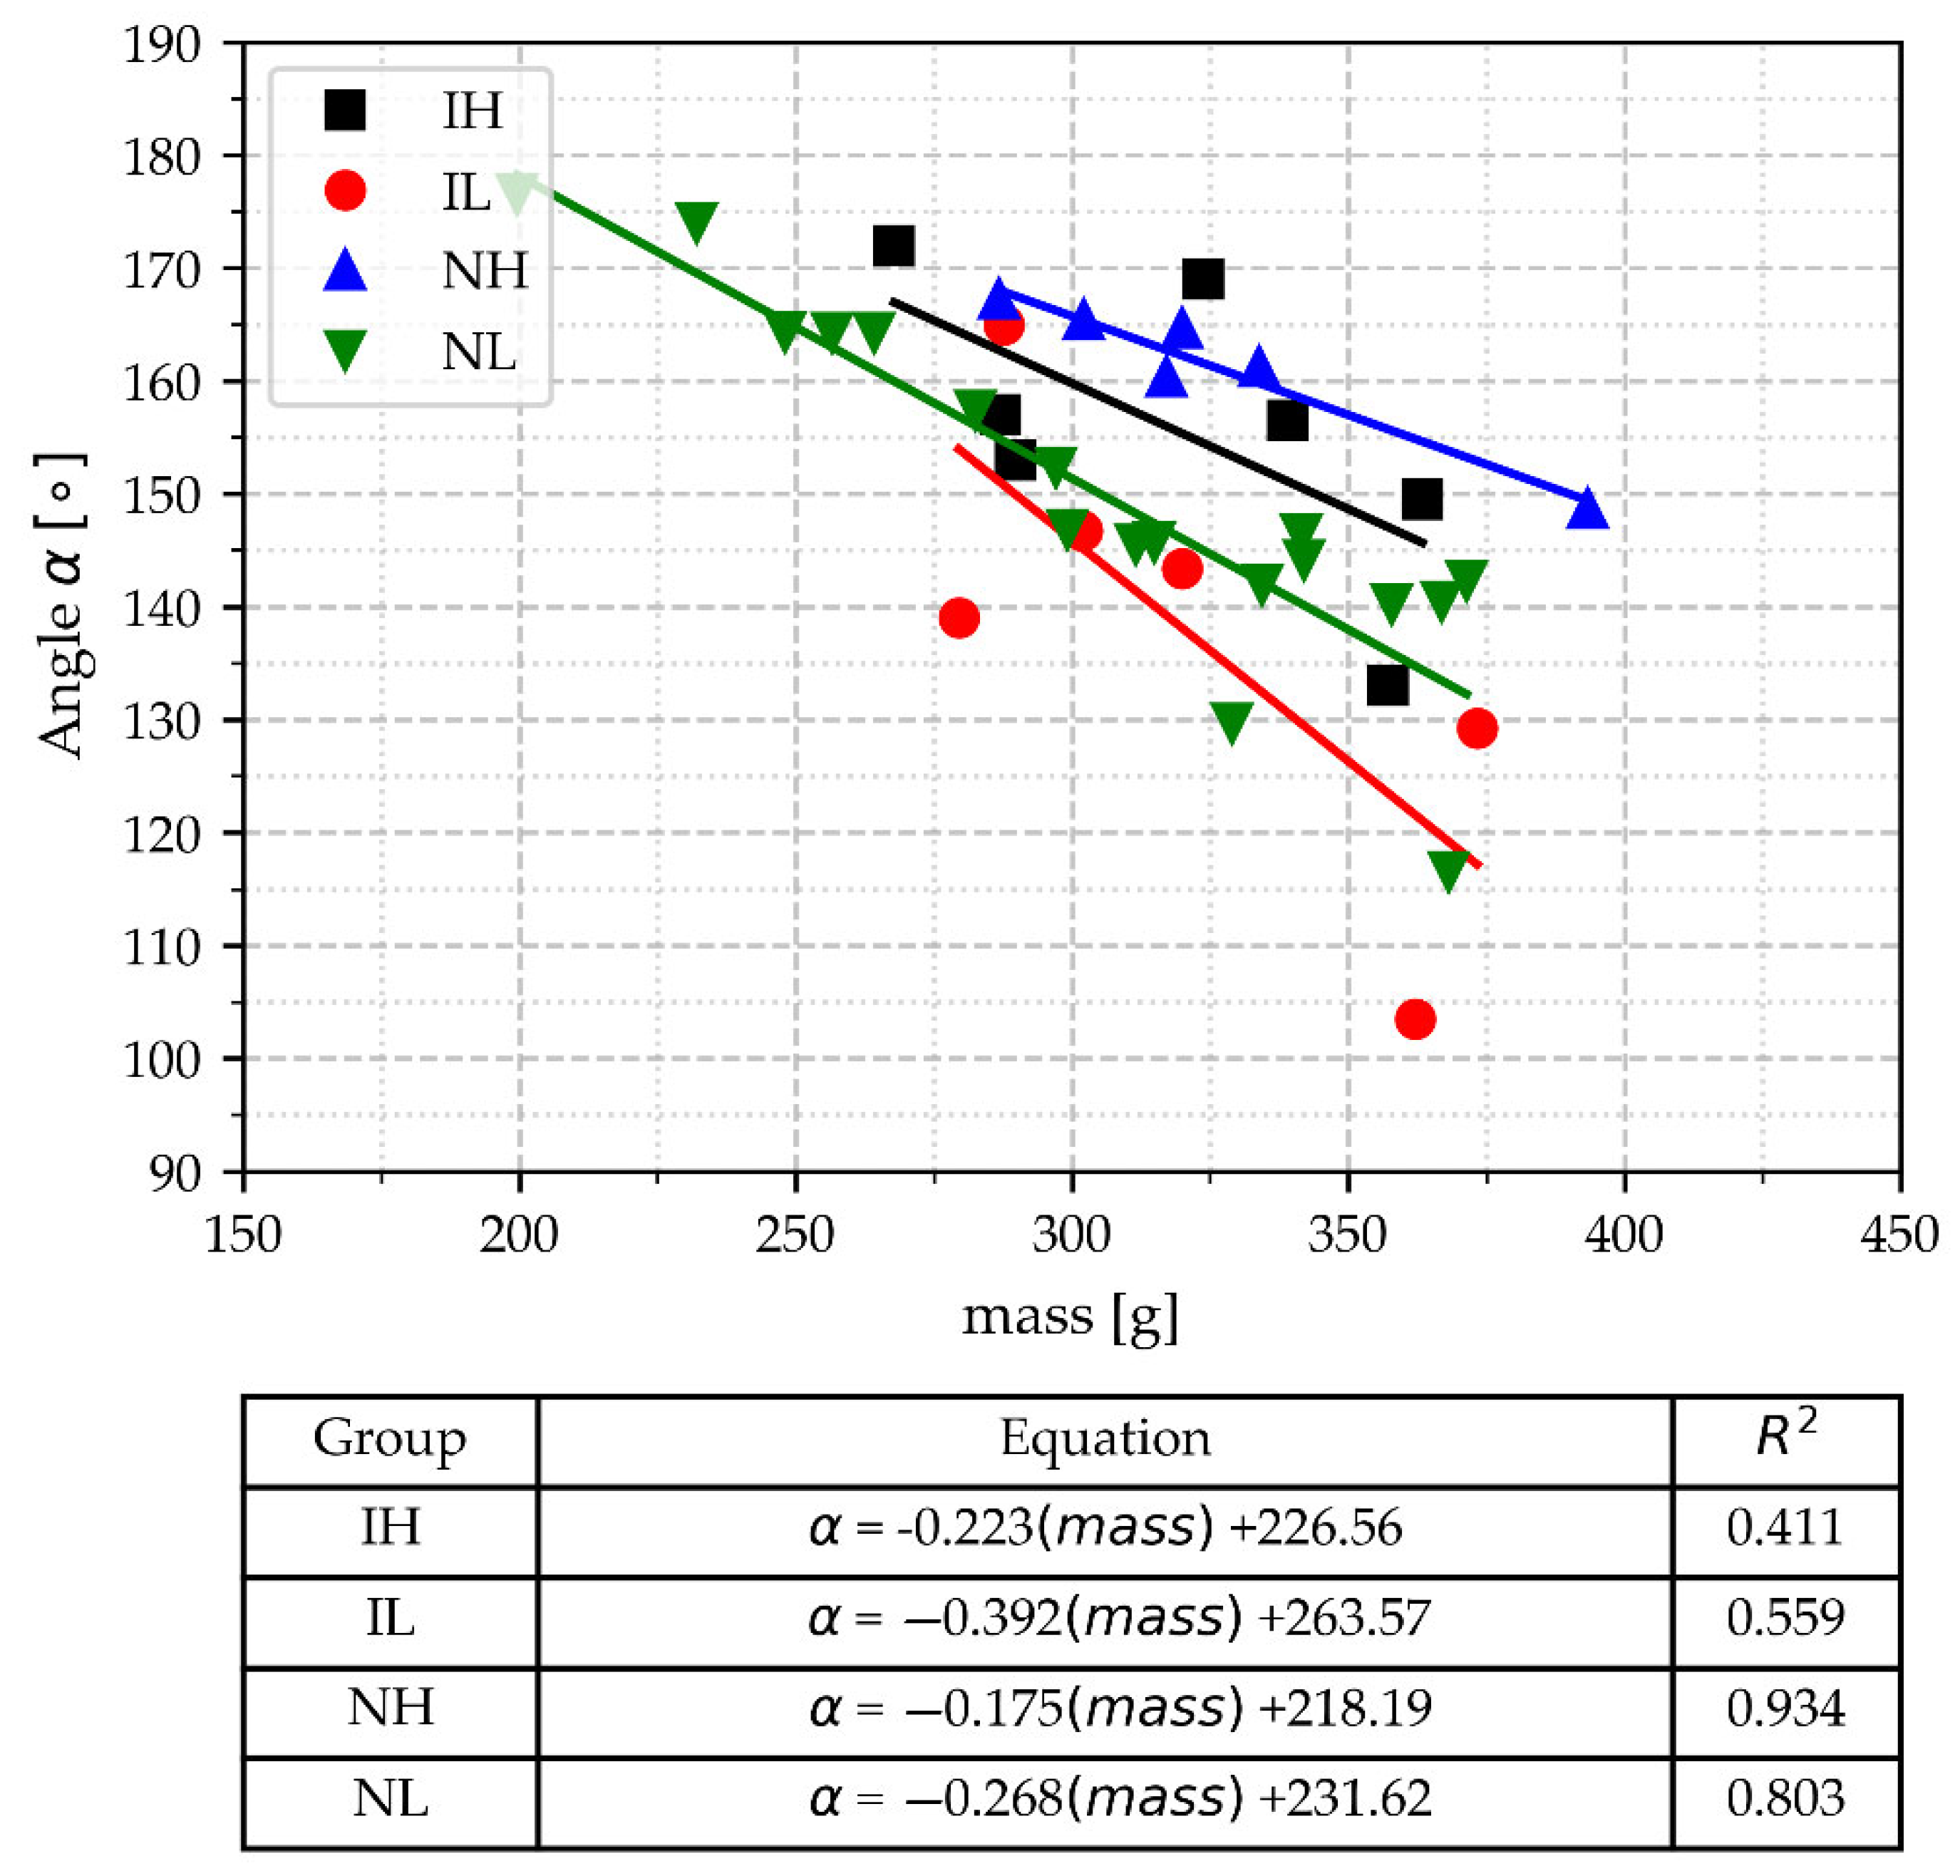
- Parameters related to the deep peak at the end of the eutectic arrest angle α and TEep are very dependent on the cups’ mass, i.e., there is not any value of these parameters that allows them to distinguish between samples with different processing conditions, except that the lowest values of TEep are associated to the lightest three samples.
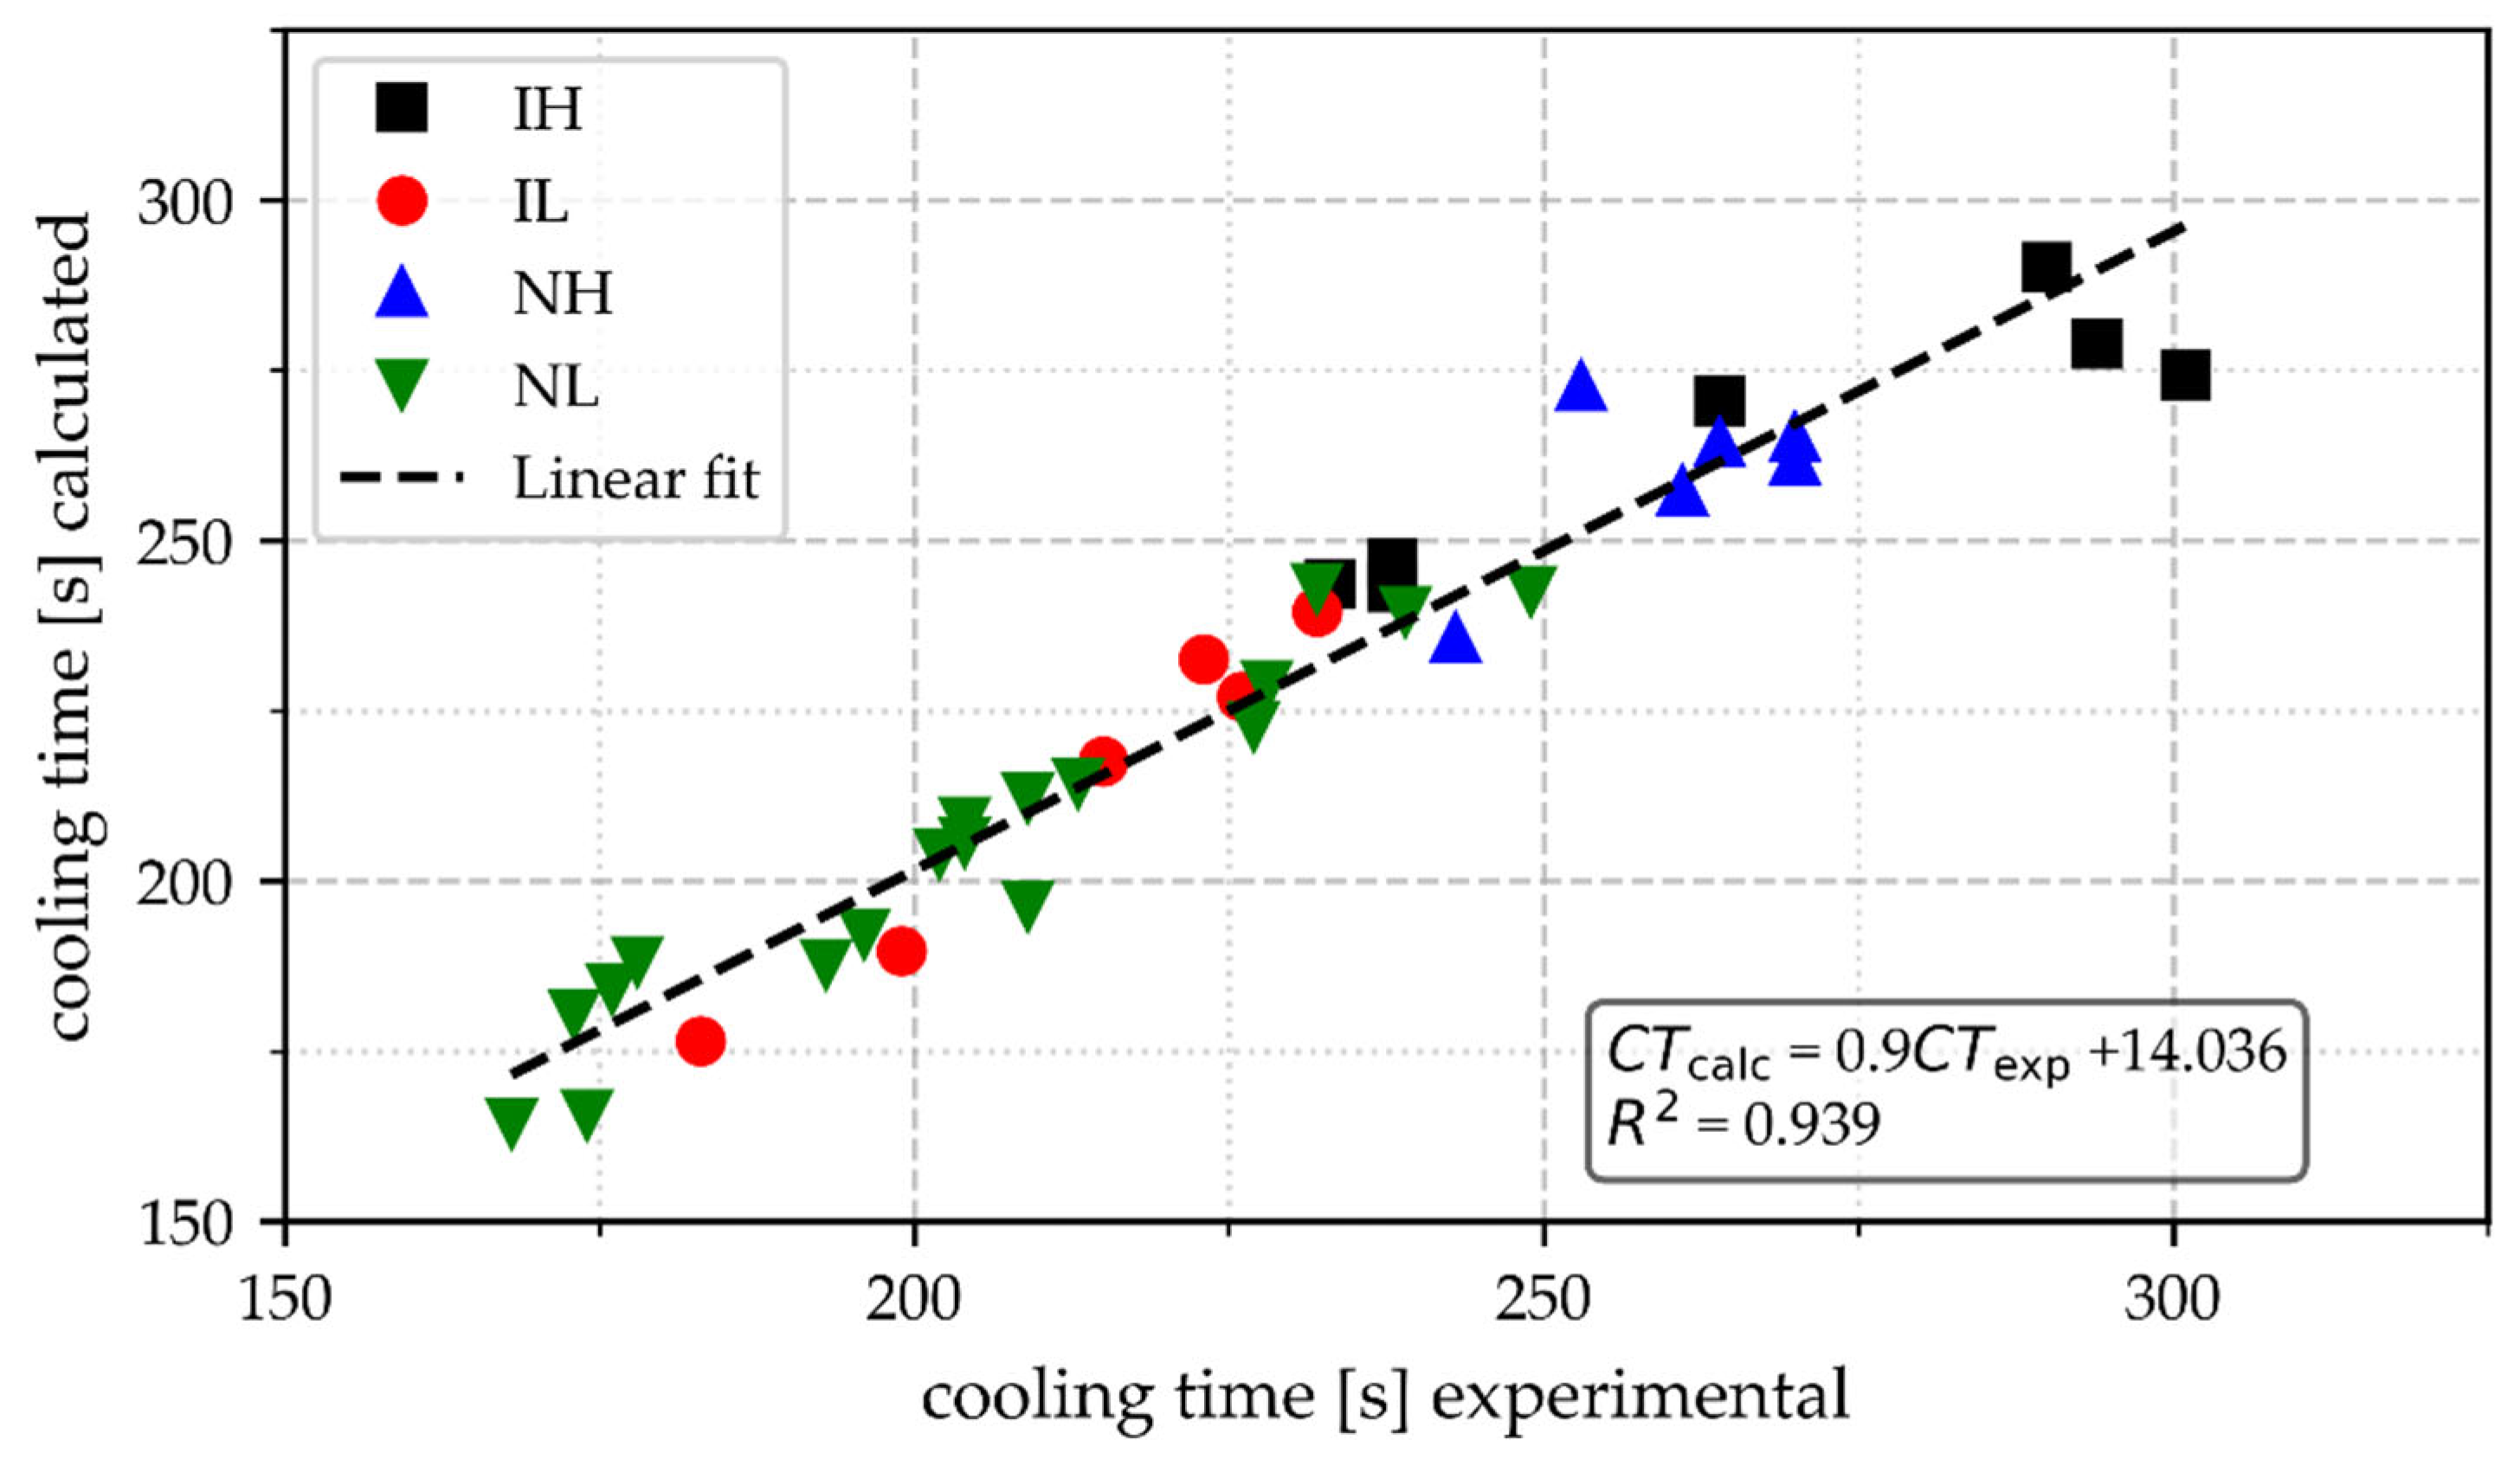
- The mass of the cups and Tmax are well related to the cooling time as defined here. Light samples poured at a low-temperature range are associated with cooling time (CT) values of less than 180 s. These CTs should be avoided when TA is intended for controlling inoculation potential.
- Visual inspection of selected samples shows that inoculation is also related to the formation of graphite distribution A, and graphite distribution B tends to appear more likely in non-inoculated samples. The appearance of islands of graphite D and E also seems to increase as TEmin decreases.
- The distribution of cells according to their surface corresponds well to a bimodal one; the distribution of the population of the small cells is more important in the non-inoculated samples than in the inoculated ones.
- This result suggests that the cutting criteria value for cell count is not constant across the entire set of samples. However, a reasonable approach is to cut the smaller cells, which represent around 15% of the total cell surface area, to mitigate the effect of small cells on the relationship between CC and TEmin.
Author Contributions
Funding
Institutional Review Board Statement
Informed Consent Statement
Data Availability Statement
Acknowledgments
Conflicts of Interest
Abbreviations
| TA | Thermal analysis |
| CE | Carbon equivalent |
| FI | Full cup, inoculated |
| NF NI | Non-full cup, non-inoculated |
| NM | Normal mass range |
| NH | Non-inoculated high temperature |
| IL | Inoculated low temperature |
| DAmax | First derivative maximum point |
| TAS | Austenite solidification temperature |
| TL | Liquidus temperature |
| DEmin | First zero crossing of the first derivative at the eutectic arrest |
| DEmax | Second zero crossing of the first derivative at the eutectic arrest |
| DEep | Minimum point of the final negative peak in the first derivative at the eutectic arrest |
| TEmin | Temperature corresponding to the DEmin |
| TEmax | Temperature corresponding to the DEmax |
| TEep | Temperature corresponding to the DEep |
| Tmax | Peak temperature measured by the thermocouple after pouring |
| CT | Cooling time (time interval between Tmax and 1050 °C) |
| CEAT | Carbon equivalent determined by thermal analysis |
| OLS | Ordinary least squares |
| CC | Eutectic cell count |
| ECDF | Empirical cumulative distribution functions |
| ϕ | Weight parameter, bimodal distribution |
| k | Shape parameter, Weibull distribution |
| σ | Scale parameter, Weibull distribution |
| μ | Location parameter, Weibull distribution |
References
- Heine, R.W. The Carbon Equivalent Fe-C-Si Diagram and Its Application to Cast Irons. AFS Cast Met. Res. J. 1971, 7, 49–54. [Google Scholar]
- Van der Perre, W. Thermal Analysis of Cast Iron; Heraeus Electro-Nite International N.V.: Houthalen, Belgium, 2007; pp. 1–27. [Google Scholar]
- Cree, J.; Grybush, I.; Robles, M.; Sorrell, R.; Hoover, A.; Cruise, J.; Krause, K. Statistical Comparisons of Four Thermal Analysis Sample Cup Types for Chemistry Control of Ductile Base Iron. Int. J. Met. 2021, 15, 729–746. [Google Scholar] [CrossRef]
- Suárez, R.; Larranaga, P.; Udroiu, A. Cooling Curve (Thermal) Analysis. In Cast Iron Science and Technology; ASM Handbooks; ASM International: Almere, The Netherlands, 2017; Volume 1, pp. 149–159. ISBN 978-1-62708-179-5. [Google Scholar]
- Regordosa, A.; Lacaze, J.; Sertucha, J.; Castro-Roman, M.J.; de la Torre, U.; Dezellus, O. Is Thermal Analysis Able to Provide Carbon and Silicon Contents of Cast Irons? Int. J. Met. 2023, 17, 592–603. [Google Scholar] [CrossRef]
- Lacaze, J. Kinetic Effects on the Austenite Carbon Equivalent and Eutectic Carbon Equivalent of Silicon Cast Irons. Int. J. Met. 2023, 17, 2062–2071. [Google Scholar] [CrossRef]
- Cree, J.; Hoover, A. Statistical Comparisons & Correlations of Thermal Analysis, Ultrasonic Velocity and Image Analysis Metallography Methods for Quantification of Ductile Iron Microstructure. Int. J. Met. 2023, 17, 54–81. [Google Scholar]
- Laubertova, M.; Ruzickova, S.; Trpcevska, J.; Briancin, J. Experimental Study of a Representative Sample to Determine the Chemical Composition of Cast Iron. Materials 2024, 17, 1255. [Google Scholar] [CrossRef]
- Backerud, L.; Nilsson, K.; Steen, H. Study of Nucleation and Growth of Graphite in Magnesium-Treated Cast Iron by Means of Thermal Analysis. In Proceedings of the Metallurgy of Cast Iron; Georgi Publishing Company: St Saphorin, Switzerland, 1975; pp. 625–637. [Google Scholar]
- Hecht, M. Analyse thermique dérivée et contrôle des fontes à graphite sphéroidal. Fonderie 1978, 379, 181–192. [Google Scholar]
- Basutkar, P.K.; Loper, C.R., Jr. Part I: Correlation of Microstructures with Thermal Analysis in Heavy Section Ductile Iron Castings. AFS Trans. 1971, 79, 169–175. [Google Scholar]
- Stefanescu, D.M. Thermal Analysis—Theory and Applications in Metalcasting. Int. J. Met. 2015, 9, 7–22. [Google Scholar] [CrossRef]
- Schüssler, J.; Bührig-Polaczek, A. Thermal Analysis of Ductile Iron: A New Way to Predict the Mechanical Properties. Int. J. Met. 2024, 18, 1943–1956. [Google Scholar] [CrossRef]
- Dorula, J.; Kopyciński, D.; Guzik, E.; Szczęsny, A.; Gurgul, D. The Influence of Undercooling ΔT on the Structure and Tensile Strength of Grey Cast Iron. Materials 2021, 14, 6682. [Google Scholar] [CrossRef]
- Cree, J.W.; Hoover, A.M.; Pelland, B.C.; Pearson, G.R.; Cruse, J.L.; Naik, N.A. Statistical Analysis of Effects of Boron and Titanium, Plus Plain Thermal Analysis (TA) Cup Type on Quantified Image Analysis Metallography, Ultrasonic Velocity and Mechanical Properties of Gray Iron. Int. J. Met. 2025, 1–19. [Google Scholar] [CrossRef]
- Dorula, J.; Kopyciński, D.; Guzik, E.; Szczęsny, A. Procedure of Eliminating Porosity in Grey Cast Iron with Low Sulphur Content. Materials 2022, 15, 6273. [Google Scholar] [CrossRef] [PubMed]
- Jelínek, R.; Bořil, P.; Kaněra, M.; Doubrava, J.; Záděra, A. Fading of Inoculation Effect in Grey Cast Iron. Arch. Foundry Eng. 2025, 25, 138–143. [Google Scholar] [CrossRef]
- Yu, A.; Whaley, M. Shrinkage Investigation of Ductile Iron Castings. Int. J. Met. 2024, 18, 2059–2078. [Google Scholar] [CrossRef]
- Neacsu, E.L.; Riposan, I.; Cojocaru, A.M.; Stan, S.; Stan, I. Carbide to Graphite Transition Control by Thermal Analysis in Grey Cast Irons. Metals 2020, 10, 993. [Google Scholar] [CrossRef]
- Suárez, O.M.; Heine, R.W.; Loper, C.R., Jr. Determination of Chilling Tendency of Base Iron Melts Through Thermal Analysis. AFS Trans. 1999, 107, 679–684. [Google Scholar]
- Suárez, O.M.; Loper, C.R., Jr. Chill Wedge Test and Chilling Tendency in Gray Cast Irons. AFS Trans. 2001, 109, 1–11. [Google Scholar]
- Riposan, I.; Chisamera, M.; Stan, S.; Barstow, M. Identifying Chill Tendency of Cast Iron Melts by Thermal Analysis. Int. J. Cast Met. Res. 2013, 26, 152–159. [Google Scholar] [CrossRef]
- Diószegi, A.; Svensson, I.L. On the Problems of Thermal Analysis of Solidification. Mater. Sci. Eng. A-Struct. Mater. Prop. Microstruct. Process. 2005, 413–414, 474–479. [Google Scholar] [CrossRef]
- Sillén, R. Ductile Iron News. 2007, 2, pp. 100–104. Available online: https://citeseerx.ist.psu.edu/document?repid=rep1&type=pdf&doi=f54a44268753e5eb4783ebc9893423b320ee8bdd (accessed on 20 July 2025).
- Stefanescu, D.M.; Suarez, R.; Kim, S.B. 90 Years of Thermal Analysis as a Control Tool in the Melting of Cast Iron. China Foundry 2020, 17, 69–84. [Google Scholar] [CrossRef]
- Stefanescu, D.M. Analysis of the Rationale and Accuracy of the Use of Carbon Equivalent and Thermal Analysis in the Quality Control of Cast Iron. Int. J. Met. 2021, 16, 1057–1078. [Google Scholar] [CrossRef]
- Suarez, O.M.; Loper, C.R., Jr. Influence of thermal analysis cups on assessment of critical temperatures during cast iron solidification. AFS Trans. 1997, 105, 929–937. [Google Scholar]
- Enriquez Farías, A.V. Control of Cast Iron Composition Using Cooling Curves and Artificial Neural Networks. Master’s Thesis, Cinvestav Unidad Saltillo, Ramos Arizpe, México, 2018. [Google Scholar]
- De Sy, A. Oxygen, Oxides, Superheating and Graphite Nucleation in Cast Iron. Mod. Cast. 1967, 52, 67–78. [Google Scholar]
- Seidu, S.O.; Ripoşan, I. Thermal Analysis of Inoculated Ductile Irons. UPB Sci. Bull. Ser. B: Chem. Mater. Sci. 2011, 73, 241–254. [Google Scholar]
- Chisamera, M.; Stan, S.; Riposan, I.; Stefan, E.; Costache, G. Thermal Analysis of Inoculated Gray Cast Irons. Metall. Mater. Sci. 2008, 31, 11–16. [Google Scholar]
- Ekpoom, U.; Heine, R.W. Thermal Analysis by Differential Heat Analysis (DHM) of Cast Iron. AFS Trans. 1981, 89, 27–30. [Google Scholar]
- Castro-Roman, M.d.J. Étude Expérimentale et Modélisation de la Solidification des Pièces COULÉES en fonte à Graphite Spheroidal: Influence de la Vitesse de Refroidissement et de L’inoculation. Ph.D. Thesis, Institut National Polytechnique de Lorraine, Nancy, France, 1991. [Google Scholar]
- Ye, H.; Li, Q.; Gu, J.; Yang, X.; Long, M.; Zeng, R.; Yang, M.; Gao, Y.; Li, S.; Zhu, F. Use a Smaller Cylindrical Thermal Analysis Sample Cup to Rapidly Predict Carbon and Silicon Content in Cast Iron. Int. J. Cast Met. Res. 2022, 35, 181–186. [Google Scholar] [CrossRef]
- Stan, S.; Riposan, I.; Chisamera, M.; Barstow, M. Undesirable Graphite Morphologies Incidence in Inoculated Grey Irons. Adv. Mater. Res. 2007, 23, 307–310. [Google Scholar] [CrossRef]
- ASTM A247; Standard Test Method for Evaluating the Microstructure of Graphite in Iron Castings. ASTM International: West Conshohocken, PA, USA, 2019.
- Jackson, K.A.; Hunt, J.D. Lamellar and Rod Eutectic Growth. Trans. Metall. Soc. Aime 1966, 236, 1129–1142. [Google Scholar]
- Jones, H.; Kurz, W. Growth Temperatures and the Limits of Coupled Growth in Unidirectional Solidification of Fe-C Eutectic Alloys. Metall. Trans. A 1980, 11, 1265–1273. [Google Scholar] [CrossRef]
- Magnin, P.; Kurz, W. Solidification of Eutectics. In Casting; ASM Handbook; ASM International: Almere, The Netherlands, 1988; Volume 15. [Google Scholar]
- Lacaze, J.; Castro, M.; Lesoult, G. Solidification of Spheroidal Graphite Cast Irons-II. Numerical Simulation. Acta Mater. 1998, 46, 997–1010. [Google Scholar] [CrossRef]
- Fras, E.; Kapturkiewicz, W.; Burbielko, A. Secondary Nucleation of Eutectic Graphite Grains. AFS Trans. 1996, 104, 1–4. [Google Scholar]
- Leube, B.; Arnberg, L. Modeling Gray Iron Solidification Microstructure for Prediction of Mechanical Properties. Int. J. Cast Met. Res. 1999, 11, 507–514. [Google Scholar] [CrossRef]
- Rinne, H. The Weibull Distribution: A Handbook; Chapman and Hall/CRC: Boca Raton, FL, USA, 2008; ISBN 978-0-429-14257-4. [Google Scholar]




| Test | High Temperature | Test | Low Temperature | ||||
|---|---|---|---|---|---|---|---|
| H1 | FI | NF-I | F-NI | L1 | F-I | NF-I | F-NI |
| H2 | NF-NI | F-NI | NF-I | L2 | NF-NI | F-NI | NF-I |
| H3 | F-I | NF-NI | F-NI | L3 | F-I | NF-NI | F-NI |
| H4 | F-I | NF-NI | NF-I | L4 | F-I | NF-NI | NF-I |
| HEAT | C | Si | Mn | S | P | Cu | Pb | Zn | Ti | Al | B | Cr | CE * | CEAT ** | |
|---|---|---|---|---|---|---|---|---|---|---|---|---|---|---|---|
| Base metal | M1 | 3.28 | 1.92 | 0.43 | 0.143 | 0.04 | 0.039 | 0.010 | 0.029 | 0.01 | 0.003 | 0.004 | 0.042 | 3.78 | - |
| High temperature | H1 | 3.22 | 1.88 | 0.42 | 0.141 | 0.035 | 0.041 | 0.010 | 0.0027 | 0.005 | 0.002 | 0.00402 | 0.042 | 3.71 | 3.691 |
| H2 | 3.23 | 1.9 | 0.42 | 0.142 | 0.036 | 0.039 | 0.010 | 0.0028 | 0.005 | 0.002 | 0.00402 | 0.040 | 3.72 | 3.721 | |
| H3 | 3.20 | 1.89 | 0.42 | 0.142 | 0.036 | 0.040 | 0.010 | 0.0290 | 0.005 | 0.002 | 0.00402 | 0.042 | 3.69 | 3.707 | |
| H4 | 3.22 | 1.89 | 0.39 | 0.140 | 0.036 | 0.041 | 0.010 | 0.0028 | 0.004 | 0.002 | 0.00359 | 0.040 | 3.71 | 3.706 | |
| Low temperature | L1 | 3.24 | 1.89 | 0.41 | 0.144 | 0.035 | 0.042 | 0.011 | 0.0029 | 0.005 | 0.002 | 0.00356 | 0.040 | 3.73 | 3.716 |
| L2 | 3.25 | 1.89 | 0.4 | 0.144 | 0.035 | 0.040 | 0.011 | 0.0030 | 0.004 | 0.002 | 0.00392 | 0.045 | 3.74 | 3.713 | |
| L3 | 3.25 | 1.88 | 0.41 | 0.142 | 0.034 | 0.039 | 0.010 | 0.0280 | 0.005 | 0.002 | 0.0037 | 0.040 | 3.74 | 3.709 | |
| L4 | 3.24 | 1.92 | 0.42 | 0.142 | 0.036 | 0.040 | 0.012 | 0.0290 | 0.005 | 0.002 | 0.00422 | 0.050 | 3.74 | 3.710 |
| Group | #/cm2 | Mean mm2 | Std. mm2 | Min mm2 | Q1 mm2 | Q2 mm2 | Q3 mm2 | Max mm2 |
|---|---|---|---|---|---|---|---|---|
| IH | 366 | 183,341 | 199,888 | 3071 | 30,946 | 110,390 | 277,944 | 2,049,441 |
| IL | 451 | 151,918 | 166,856 | 3014 | 22,372 | 89,510 | 234,114 | 972,272 |
| NH | 275 | 234,204 | 303,243 | 3424 | 24,138 | 70,314 | 393,676 | 1,940,605 |
| NL | 446 | 173,347 | 231,299 | 3003 | 19,658 | 53,305 | 260,849 | 1,474,339 |
| Distribution Parameters * | K-S Test | |||
|---|---|---|---|---|
| Group | k | σ | μ | p-Value |
| IH | 0.8385 | 162,657 | 3071 | 1.7 × 10⁻⁵ |
| IL | 0.7927 | 130,849 | 3015 | 0.01 |
| NH | 0.6976 | 247,702 | 3423 | 7.3 × 10⁻²¹ |
| NL | 0.6786 | 127,423 | 3003 | 8.9 × 10⁻²³ |
| Distribution Parameters ** | K-S Test | |||||||
|---|---|---|---|---|---|---|---|---|
| Group | ϕ | k1 | σ1 | μ1 | k2 | σ2 | μ2 | p-Value |
| IH | 0.4208 | 1.2376 | 28,161 | 4738 | 1.229 | 244,779 | 61,184 | 0.9988 |
| IL | 0.5338 | 0.9538 | 31,471 | 2839 | 1.28 | 213,581 | 84,665 | 0.9998 |
| NH | 0.5576 | 1.1842 | 31,354 | 3644 | 1.3948 | 465,811 | 65,456 | 0.9896 |
| NL | 0.6084 | 1.0494 | 29,175 | 4161 | 1.2955 | 344,638 | 75,538 | 0.5489 |
Disclaimer/Publisher’s Note: The statements, opinions and data contained in all publications are solely those of the individual author(s) and contributor(s) and not of MDPI and/or the editor(s). MDPI and/or the editor(s) disclaim responsibility for any injury to people or property resulting from any ideas, methods, instructions or products referred to in the content. |
© 2025 by the authors. Licensee MDPI, Basel, Switzerland. This article is an open access article distributed under the terms and conditions of the Creative Commons Attribution (CC BY) license (https://creativecommons.org/licenses/by/4.0/).
Share and Cite
del Campo-Castro, R.; Castro-Román, M.; Castro-Cedeno, E.-I.; Herrera-Trejo, M. Influence of Sample Mass and Pouring Temperature on the Effectiveness of Thermal Analysis for Estimating Gray Iron Inoculation Potential. Materials 2025, 18, 3640. https://doi.org/10.3390/ma18153640
del Campo-Castro R, Castro-Román M, Castro-Cedeno E-I, Herrera-Trejo M. Influence of Sample Mass and Pouring Temperature on the Effectiveness of Thermal Analysis for Estimating Gray Iron Inoculation Potential. Materials. 2025; 18(15):3640. https://doi.org/10.3390/ma18153640
Chicago/Turabian Styledel Campo-Castro, Raymundo, Manuel Castro-Román, Edgar-Ivan Castro-Cedeno, and Martín Herrera-Trejo. 2025. "Influence of Sample Mass and Pouring Temperature on the Effectiveness of Thermal Analysis for Estimating Gray Iron Inoculation Potential" Materials 18, no. 15: 3640. https://doi.org/10.3390/ma18153640
APA Styledel Campo-Castro, R., Castro-Román, M., Castro-Cedeno, E.-I., & Herrera-Trejo, M. (2025). Influence of Sample Mass and Pouring Temperature on the Effectiveness of Thermal Analysis for Estimating Gray Iron Inoculation Potential. Materials, 18(15), 3640. https://doi.org/10.3390/ma18153640


