Article

Testing Using the DCP Probe of a Subgrade Modeled from Difficult-to-Compact Sand in a Calibration Chamber

1
Faculty of Civil Engineering and Environmental Sciences, Bialystok University of Technology, 45E Wiejska Street, 15-351 Bialystok, Poland
2
Faculty of Civil and Environmental Engineering and Architecture, Rzeszow University of Technology, 12 Powstancow Warszawy Street, 35-959 Rzeszow, Poland
3
Faculty of Civil Engineering and Architecture, Lublin University of Technology, 38D Nadbystrzycka Street, 20-618 Lublin, Poland
*
Author to whom correspondence should be addressed.
Materials 2025, 18(15), 3548; https://doi.org/10.3390/ma18153548
Submission received: 14 May 2025 / Revised: 19 July 2025 / Accepted: 21 July 2025 / Published: 29 July 2025
(This article belongs to the Section Construction and Building Materials)

Abstract

The aim of the article is to analyze the possibilities of using a lightweight dynamic cone probe DCP to determine the quality of compaction of surface layers of embankments (from 0.10 m to approx. 0.80 m below ground level). For this purpose, comparative tests of non-cohesive soil used for the construction of embankments were carried out using the DCP test and direct tests of the degree of compaction IS in a calibration chamber with the following dimensions: height 1.10 m and diameter 0.75 m. The subsoil was prepared from difficult-to-compact sand (Sa) with a uniformity coefficient of CU = 3.10 and curvature coefficient of CC = 0.99. The soil in the laboratory in the calibration chamber was compacted in layers using a vibratory plate compactor. A database for statistical analysis was obtained, n = 68 cases described by seven variables: z, ρ, w, ρd, IS, PI, N10(DCP). It was found that the DCP probe can be used to assess the degree of compaction of embankments made of non-cohesive soil, using the developed relationship IS = f(z, N10(DCP)).

1. Introduction

Traditional direct methods of controlling soil compaction based on the degree of compaction IS are time-consuming and labor-intensive.
To determine the degree of compaction using classical methods, it is necessary to examine the bulk density ρ (e.g., using a cutting cylinder or a sand cone) of the soil in the embankment, then take a soil sample from the embankment and analyze the moisture content w in the laboratory (using the drying method [1]) and the maximum dry density ρdmax (using the Proctor method [1,2]). These tests cause interruptions in the technological process of constructing the embankment.
Increasing requirements regarding the use of rapid control methods for the quality of embankment compaction have led to the search for new indirect methods of quickly assessing compaction parameters. Efforts are also being made to find correlations between compaction measurement results obtained using different methods. The aim of the comparative studies described in the article is to improve and simplify the process of ongoing quality control of compaction in the surface layers of embankments made of non-cohesive soils. A quick assessment of compaction parameters directly translates into the pace of earthwork operations.
There is considerable interest in simple indirect testing methods (field methods), which are characterized by ease and speed of measurement execution. There is also interest in the simplicity of operation and mobility of testing equipment, as well as the possibility of obtaining immediate results for compaction control. Such methods include dynamic probing techniques. Dynamic probing is also used to assess the bearing capacity and deformability of coarse-grained soil layers, to evaluate the geotechnical parameters of the tested layer, to assess the uniformity of the layer, to identify weak or strong soil layers, and to determine the top of the bedrock [3].
One of the methods for rapid quality control of compaction in surface soil layers is probing with the Dynamic Cone Penetrometer (DCP) in accordance with the International American Society for Testing and Materials Standard ASTM D6951-03:2003 [4]. The DCP has been used for many years, in many countries, especially in English-speaking countries [5,6,7,8,9]. In European countries, the DCP probe has been and still is rarely used.
The aim of this study was to investigate the possibility of using the DCP probe for compaction control of surface soil layers (from 0.00 m to approximately 0.80 m below ground level (b.g.l.)) in various types of embankments. In embankments, the degree of compaction IS is commonly used as a measure of soil compaction quality. IS is a symbol frequently used in the literature and in the Polish standard PN-S-02205:1998 [10]. In the European standard EN 16907-1:2018 [2], the degree of compaction is denoted by the symbol DPr and explained as the achieved compaction level in %, related to the Proctor maximum dry density ρdmax.
Additionally, the study examined whether there are correlations between penetration index PI or N10(DCP) values obtained using the DCP probe and reference IS values determined by direct methods. The established correlation could be applied in construction practice for the quick self-assessment of the compaction of layers of embankments made from non-cohesive soils.
In countries with a climate where periodic negative air temperatures occur, embankments are most often built from non-cohesive soils with an appropriate grain size. The soils for embankment construction should be non-frost-heaving and not frost susceptible. In countries where negative air temperatures do not occur, embankments can be built from cohesive soils—in this case, calibration of DCP sounding is also necessary for cohesive soils.
Moreover, the soil for the construction of embankments must be well compactable, so that the soil, after compaction, reaches the required values of the degree of compaction IS, specified for a given embankment depending on its intended use and load [2,10]. For example, according to PN-S-02205:1998 [10], the required IS values for road embankments range from 0.95 to 1.03, depending on the type of road and the depth b.g.l. of the tested fill layer. In sustainable management, it is beneficial to use local soils for the construction of embankments, even if they do not compact very well. This article presents studies using the DCP sounding of poorly compactable sand.

2. DCP Probe

2.1. DCP Probe Applications

The DCP (Dynamic Cone Penetrometer) was first mentioned in 1956. The pioneer of this device was Scala (in [11]) who proposed the device for testing unpaved road surfaces in Australia, with the following parameters: hammer mass m = 9 kg, hammer drop height h = 0.508 m (Kumar et al. [12] report a drop height h = 0.51 m), and a cone apex angle of 30° [13].
Ayers et al. [14] report that in the early 1980s, the cone-shaped DCP was not commonly used in the United States. During this period, other instruments were often used, such as the Clegg hammer [15] or the PANDA device [16].
The DCP device gained recognition from many researchers due to its rapid measurement capability, robustness, mobility, simple operation, low cost, and high efficiency.
The DCP device was standardized in the USA in 2003 [4]. The DCP is primarily used for testing the surface soil layers of embankments and subgrades composed of non-cohesive soils, to a maximum depth of 2.00 m below ground level (b.g.l.). It can also be used to assess railway embankment surfaces [17], highway and airport pavements, as well as unpaved surfaces [14]. The DCP device can be used to evaluate the quality of sand bedding compaction [18,19] and the subgrade of shallow foundations [20]. Using the DCP, it is possible to determine the number of pavement layers, the thickness of each layer, and the strength of a given layer—especially for rural roads [21]. Wu and Sargand [22] state that the DCP can be used to depths greater than 0.90 m b.g.l. Based on conducted studies, some researchers have determined that the DCP can be used to depths of up to 3.00 m b.g.l. [13] and even up to 10.00 m b.g.l. [23]. Wu and Sargand [22] suggest that DCP testing should be halted when the penetration depth exceeds 0.60 m and at least 10 consecutive blows result in a Penetration Index (PI) reading of less than 1 mm per blow. Salgado and Yoon [11] and Hashemi and Nikudel [23] do not recommend using the DCP for gravel. Webster et al. [24] emphasize that the DCP is not suitable for testing soils containing particles larger than 50.8 mm in diameter. Livneh [25] believes that the DCP test can be used to determine the California Bearing Ratio (CBR), based on established correlations, to a depth of 0.80 m b.g.l. Seyman [26] recommends using the DCP to identify weak spots in soil that is presumed to be uniformly compacted.
The DCP probe is used for indirect testing of many properties of cohesive and non-cohesive soils based on established correlations of the probe’s PI readings with other geotechnical parameters, such as CBR, shear strength φ’, resilient modulus Mr, relative density Dr, modulus of subgrade reaction ES, moisture content w, dry unit weight γd (in [19,27]). Example calibration equations taken from the literature are shown in Table 1.
The DCP probe was also used for comparative studies with other field instruments (in [19]): Falling Weight Deflectometer (FWD), Nuclear gauge, Soil Stiffness Gauge (SSG), Plate Load Test (PLT), and Clegg hammer.
There are a few reports in the literature about the use of the DCP probe for testing the degree of compaction index IS, defined according to Formula (2).
Juntasan et al. [28] describe calibration studies conducted in Northeast Thailand on four types of soils, classified according to AASHTO as: A-2-4 (silty or clayey gravel sand, with a number of tests n = 19), A-3 (fine sand, n = 10), A-4 (silty soil, n = 26), A-7-5 (clayey soil, n = 5). The soils were compacted using a small manual compactor in a circular concrete pit with a diameter of 0.5 m and a height of 0.3 m. The bulk density of the soil was directly measured using a sand cone, the optimum moisture content, and the maximum dry density using the standard Proctor method. A non-typical type of DCP probe with a cone diameter of 20 mm and a cone apex angle of 20° was calibrated, with a weight of 2.3 kg dropping from a height of 508 mm along a guiding rail. Two levels were marked on the lower part of the rod: the lower one at a height of 83 mm from the tip of the cone and the upper one at a height of 166 mm from the tip of the cone.
The number of blows of the weight N needed to drive the cone to a depth from the lower to the upper level, that is, to a depth of 83 mm (N83mm), was measured. Regression Equations (1)–(4) were developed for each soil group, in the form (1):
y = a · ln x + b
where y is the degree of compaction, x is the number of DCP blows, and a and b are the parameters of the models.
Models with parameters in the ranges: a = 5.602–15.590, b = 58.478–89.878 were obtained. The proposed models, IS = f(N83mm) in each group of soils had high determination
Yang et al. [7] analyzed the effect of moisture and the compaction index on PI, Mr, and CBR. The soil studied was high liquid limit clay (CH) with good gradation from central south China with ρdmax = 1.76 t/m3 and wopt = 16.8%. Laboratory tests were conducted on samples measuring: diameter 152 mm, height 120 mm, compacted manually in a cylinder. Soil samples were tested at moisture levels ranging from w = 5–22%. The degree of compaction, denoted in the article by the symbol K, was 90%, 93%, and 96%. The tests were performed with a DCP probe with a cone of 20 mm in diameter and a vertex angle of 60°, with a weight of 8.0 kg dropped from a height of 575 mm.
The result of this study was the penetration ratio PR (mm/drop). The maximum penetration depth with the DCP probe was 120 mm. Based on 18 sets of test results, a regression equation for the degree of compaction K was developed. The tests were repeated in the field on an embankment from which samples were taken for laboratory testing, at 62 measurement points, with a penetration depth using the DCP probe of up to 300 mm p.p.t. The bulk density ρ tests were conducted using the sand cone method. The regression equations for K from laboratory and field studies are presented in Table 1. It was found that the results of the PR probing depend on the soil moisture and its degree of compaction K. The two-factor linear regression equations K = f(w, PR) have correlation coefficients R > 0.80.
The research by Belicanta et al. [29] aimed to develop an equation for interpreting the results of soil tests using the DCP probe. The DCP probe had a cone with a diameter of 20 mm and a vertex angle of 60°, with a weight of 8.0 kg falling from a height of 575 mm. The value of PI (cm/blow) was calculated as the average penetration value from 10 consecutive blows of the weight. The tests were conducted in the field on the soil in the city of Bandairantes, Parana, Brazil: lateritic silty clay, evolved from basaltic rock. In the field, PI (cm/blow), the unit weight of the soil γ (kN/m3) was measured using the sand cone method, and the moisture in (%) was determined by drying. Standard Proctor tests were conducted on the collected samples, resulting in average values of γdmax = 16.3 kN/m3, wopt = 23.5%.
It has been found that the PI value is inversely proportional to the density index and is dependent on soil moisture. For the studied soil, an equation was developed for estimating the degree of compaction, denoted by the symbol DC, as a function of PI and w, shown in Table 1. Data analysis showed that for the studied soil, the calibration equation has great potential for application in construction, with a recommendation that the tested layer should not be thicker than 200 mm.
From the above literature review, it is evident that the DCP probe has mostly been calibrated in countries with warm climates, for practical use in monitoring the compaction of specific embankments. Laboratory studies were conducted on small-sized samples. The studies presented were mostly carried out on cohesive soils. In the equations by Yang et al. [7] and Belicanta et al. [29], the variable moisture was included as an independent variable, which is considered a redundant variable here, as it is used to calculate the dependent variable, the degree of compaction, according to Equations (2) and (3). The overall conclusion from the presented studies is that the value of the degree of compaction depends on the soil compaction, as indicated by the value of the penetration index (PI). The results of the presented studies are difficult to generalize to other than the studied groups of soils; therefore, the authors of the cited articles advocate calibrating the DCP probe each time for specific soils.
This article presents studies on non-cohesive soil—poorly graded sand that is difficult to compact. The studies were conducted in a calibration chamber with a diameter of 750 mm, simulating field conditions regarding soil volume. Calibration tests were performed at depths from 0.00 to approximately 800 mm below ground level.
The next soils we will study will be non-cohesive soils with coarser grading, well-graded, and easily compactable. Then it will be possible to determine whether the calibration equations can be generalized for all studied non-cohesive soils or for specific groups of soils.

2.2. Interpretation of DCP Soil Testing Results

The DCP device is one of the indirect methods of soil testing—it is calibrated for a specific purpose, i.e., empirical equations are developed to relate the readings obtained from the test with other sought-after geotechnical parameters.
The result of the soil test using the conical DCP device is the PI (Penetration Index), or DPI (Dynamic Penetration Index), or DCPI (Dynamic Cone Penetration Index), measured in mm per blow [4,27,30].
Regression equations for the PI with the California Bearing Ratio (CBR) or Relative Density Dr have been most commonly developed (Table 1). Research is still ongoing regarding the use of the DCP device for evaluating various geotechnical parameters.
Table 1. Examples of correlations obtained from DCP probe results.
Authors (Year)FormulaScope of ApplicationCoefficient of Determination
Webster et al. (1992) [24]CBR = 292/DCP1.12cohesive soils and non-cohesive soilsNot specified
Zohrabi and Scott (2003)
[31]
CBR = 240 DCP−0.97cohesive soils and non-cohesive soilsR2 = 0.89
CBR = 243 [DCP/(1 + w)]−1.01R2 = 0.90
George et al. (2009) [5]CBR = 47.32 (DCPI)−0.7852lateritic soilsR2 = 0.82
Jordão et al. (2012) [32]CBR = 980.55 DCP−1.257silty clayR2 = 0.86
Monteiro et al. (2016)
[33]
CBR = 143.13 (DCP)−0.879silty or clayey gravel and sandR2 = 0.89
CBR = 43.91 (DCP)−0.547clayey soilsR2 = 0.71
CBR = 58.154 (DCP)−0.397stone fragments, gravel, and sandR2 = 1.00
Hamid (2017) [18]Dr = 230.55/(DCPI)0.417silty sand; CU = 1.98; (+1% silt)R2 = 0.98
Dr = 231/(DCPI)0.419silty sand; CU = 1.98; (+4% silt)R2 = 0.98
Dr = 214/(DCPI)0.405silty sand; CU = 1.98; (+8% silt)R2 = 0.98
Wilches et al. (2018) [34]CBR = 112.03/(DCP)0.803fine-grained soils, clayR2 > 0.80
MacRobert et al. (2019)
[9]
Dr = −50 logDPI + 148sandy soils; CU = 1.2–9.4RE = ±11%
Dr = −52 log(DPI · D50)0.3 + 150RE = ±9%
Juntasan et al. (2015)
[28]
IS = 5.785 ln(N83mm) + 86.654
silty or clayey gravel sand;
ρdmax = 1.821 t/m3; n = 19
R2 > 0.96
IS = 8.751 ln(N83mm) + 73.902fine sand; ρdmax = 1.867 t/m3; n = 10R2 > 0.96
Yang et al. (2015) [7]K = 131.57 − 1.05w − 5.00PR
for wwopt
K = 46.76 − 3.18w − 1.79PR
for wwopt
clay (CH); CU = 5.59
Laboratory tests
R2 = 0.76


R2 = 0.67
K = 134.57 − 1.08w − 5.39PR
for wwopt; n = 18
K = 49.36 − 3.47w − 1.92PR
for wwopt; n = 44
clay (CH); CU = 5.59
Field tests
R2 = 0.81


R2 = 0.80
Belicanta et al. (2016)
[29]
D C = 100 · γ d 16.3 = 210 P I · e 9.5 w 26.5 26.5 ; PI (cm/blow)lateric silty clayNo data
CBR—California Bearing Ratio; DCP or DPI or DCPI or PR or PI—the penetration of the cone tip of the DCP device in millimeters caused by one hammer blow; w—soil moisture content; wopt—optimum moisture content; Dr—relative density of the soil; D50—grain diameter in mm, for which 50% of the soil particles are smaller; CU—uniformity coefficient (gradation); Is or K or DC—degree of compaction; N83mm—number of DCP blows required for 83 mm penetration; ρdmax—maximum dry density; e ≈ 2.718—Euler’s number; γ d —dry unit weight; R2—coefficient of determination; RE—relative error; n—number of studies.

2.3. Description of the DCP Device

The DCP device and its conical tip are shown in Figure 1, and the technical specifications of the device are presented in Table 2.

3. Description of the Tests Performed

3.1. Description of the Tested Soil

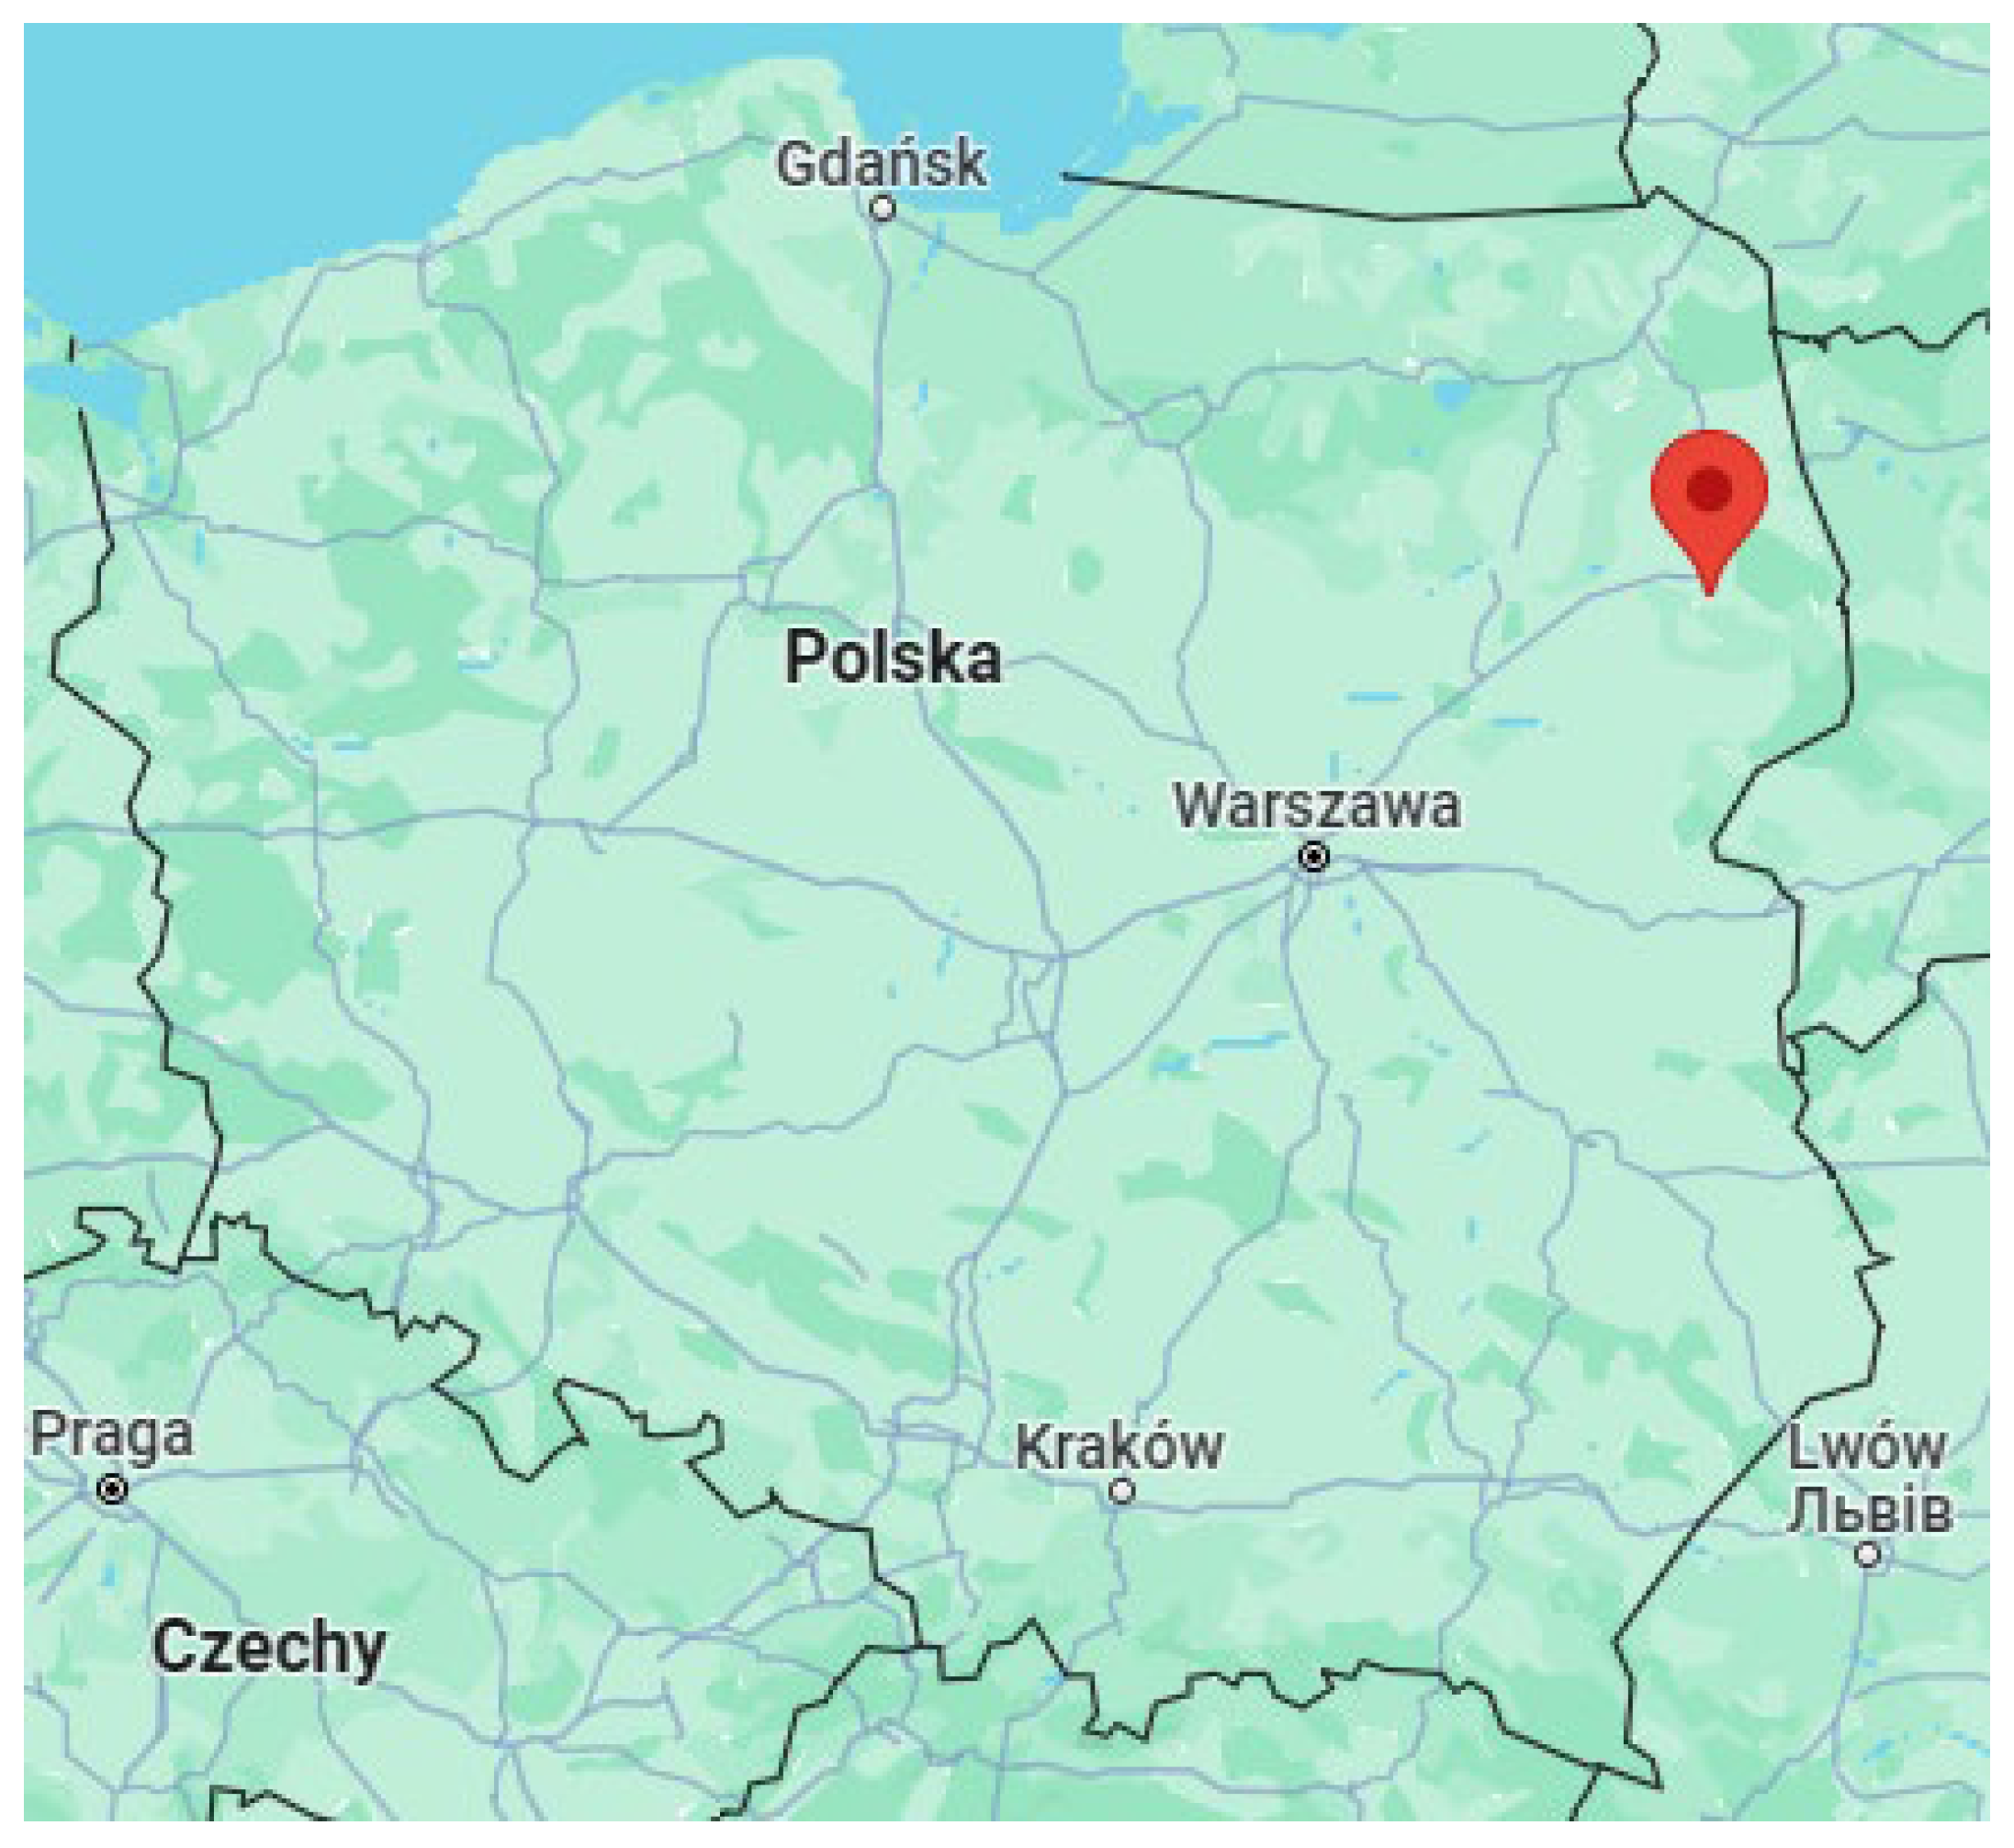
The soil substrates for testing in the calibration chamber [35] were prepared from non-cohesive soil of post-glacial origin taken near the city of Bialystok, Poland (Figure 2).
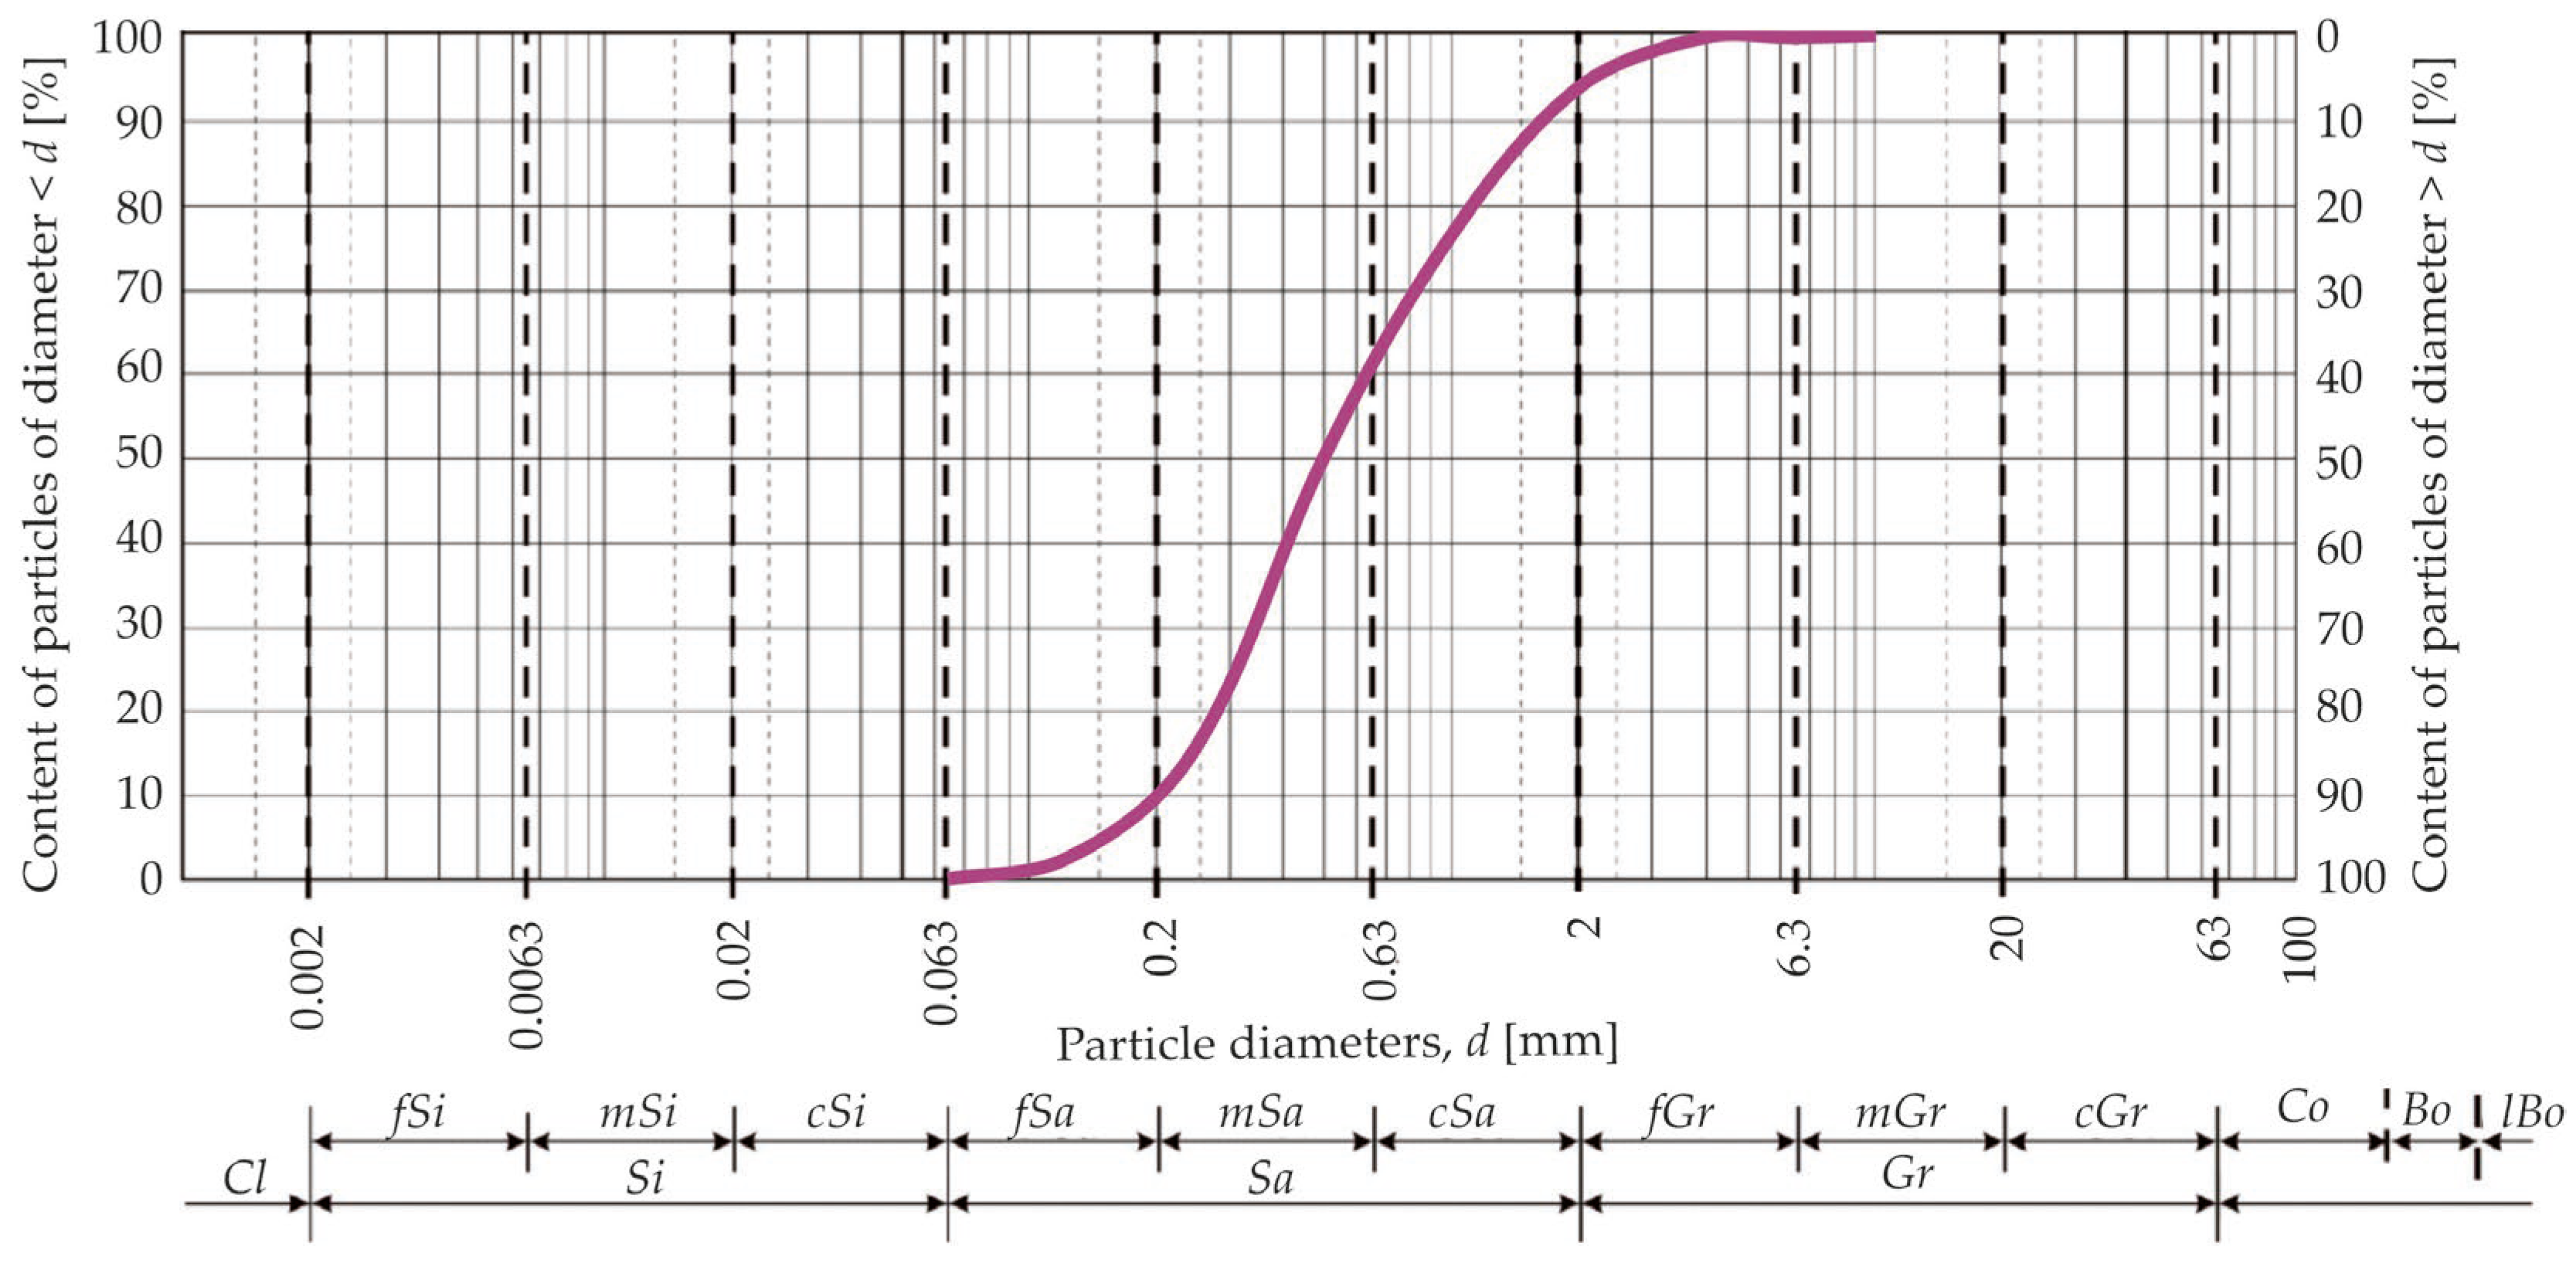
The name of the studied soil was read from the triangle in the European standard EN ISO 14688-2:2004 [36]: sand (Sa). The grain size distribution of the soil was determined using the sieve analysis method in accordance with CEN ISO/TS 17892-4:2004 [37]. The grain size distribution curve of the tested sand is shown in Figure 3. Grain size and the geotechnical parameters of the soil are presented in Table 3. Based on the values of the uniformity coefficient (CU) and the coefficient of curvature (CC), it was determined that the tested sand was poorly graded, and therefore difficult-to-compact, according to EN ISO 14688-2:2004 [36].
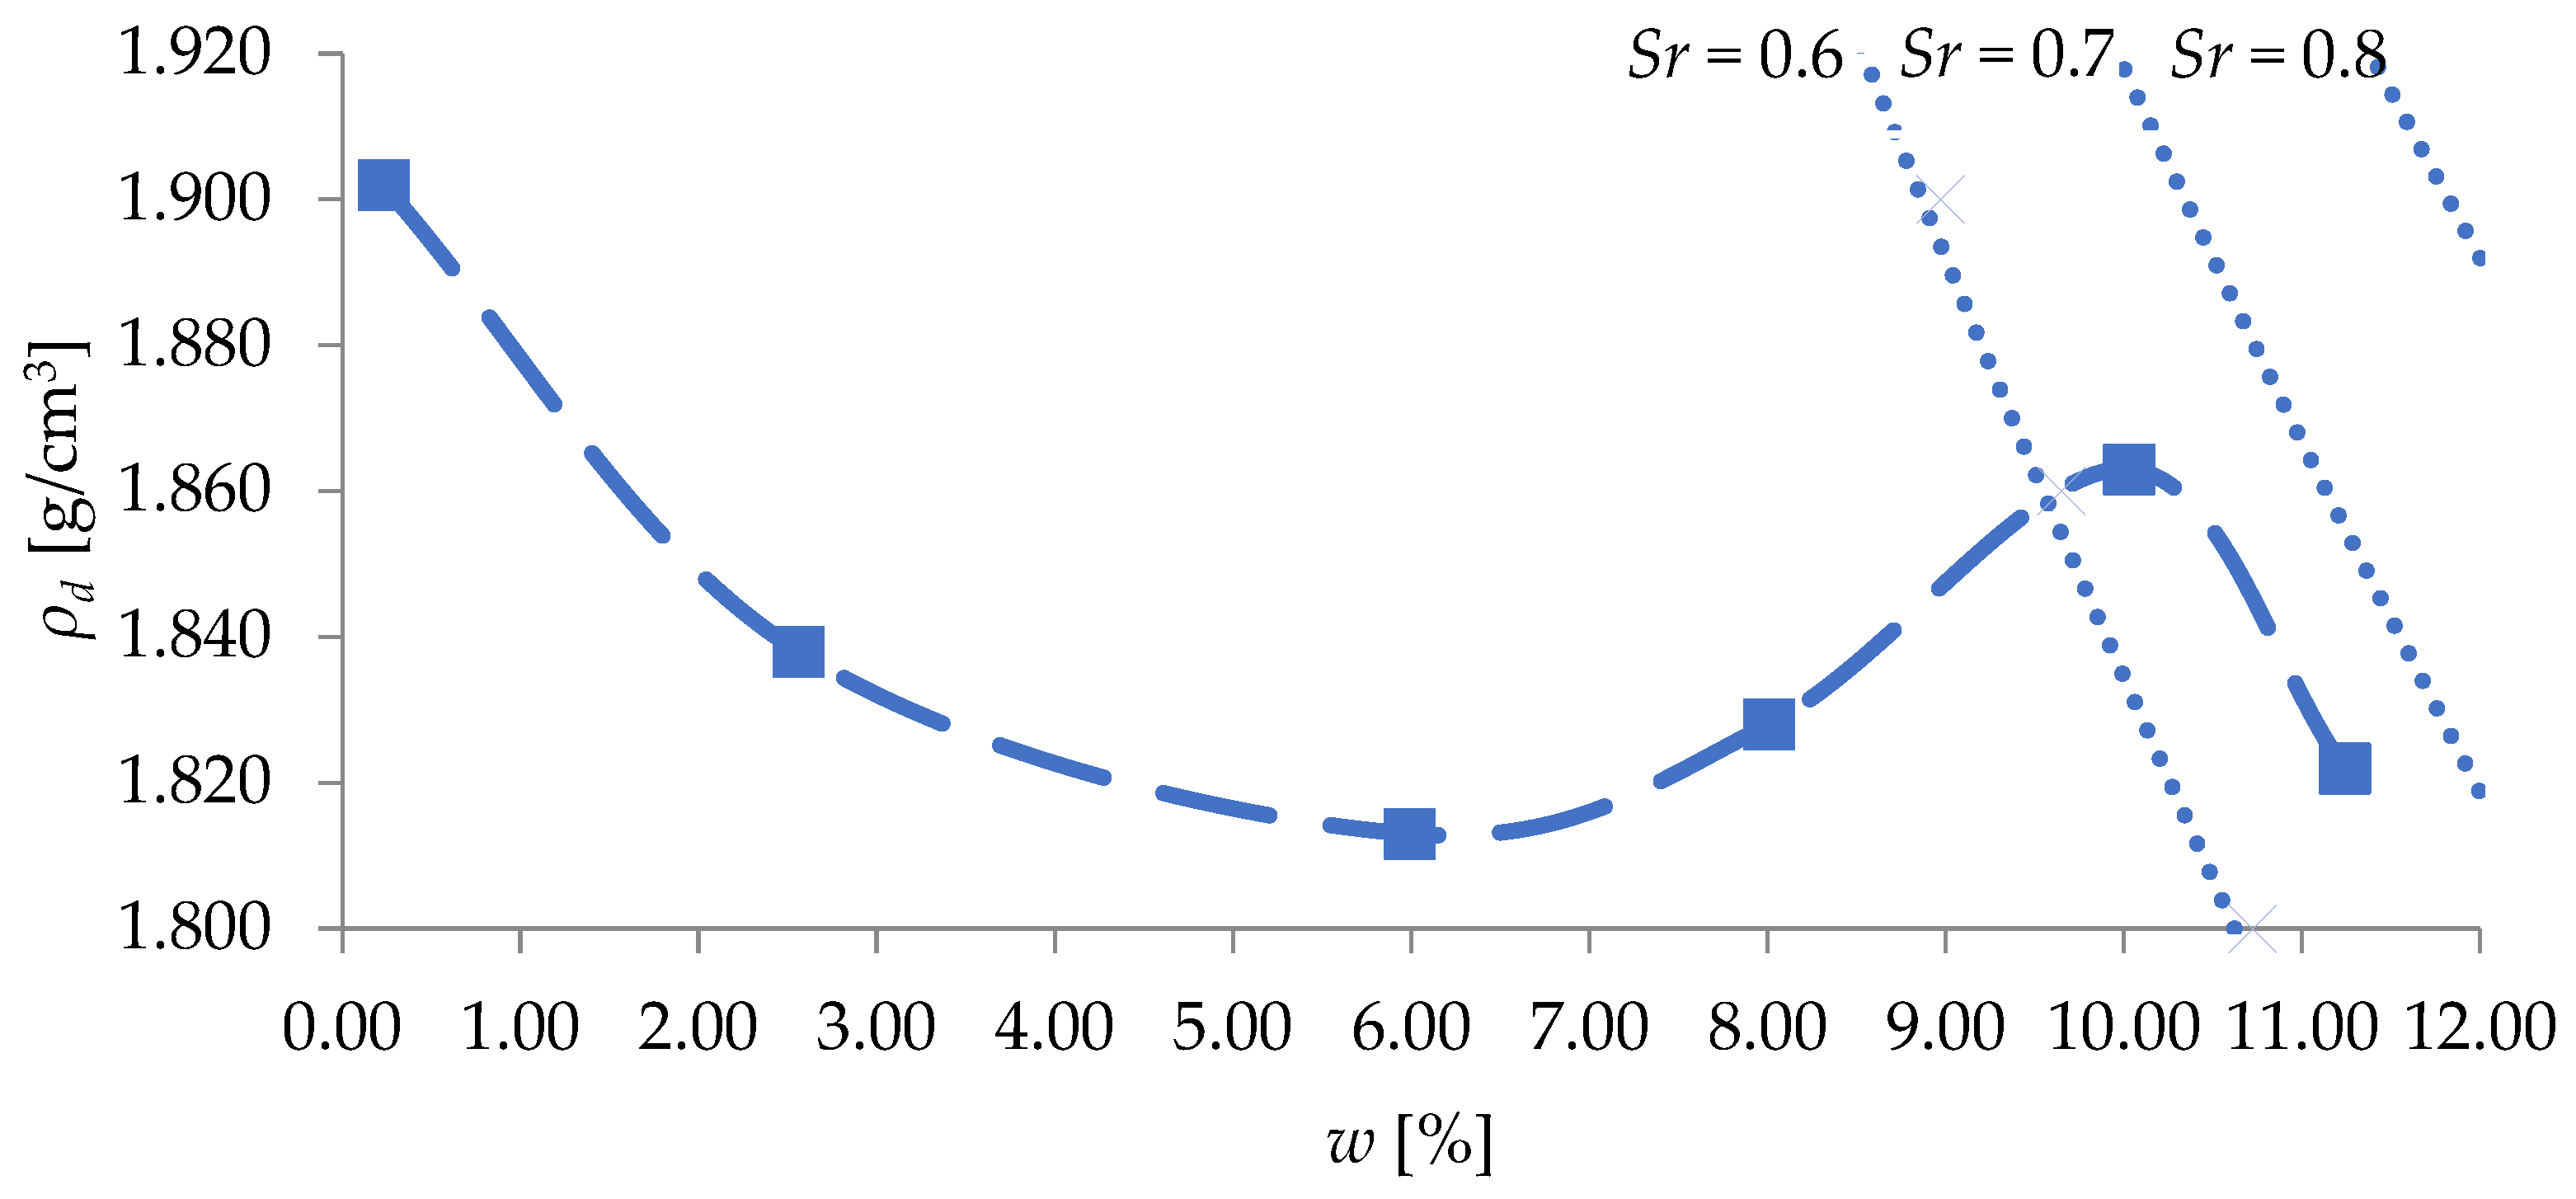
Compaction parameters of the tested soil: the maximum dry density ρdmax and the optimum moisture content wopt were determined using the standard Proctor method according to the Polish standard PN-B-04481:1988 [1], which corresponds to A+A method as per EN 13286-2:2010 [38], using a mechanical Proctor apparatus. The compaction curve of the tested sand is shown in Figure 4.

3.2. Calibration Chamber

The test beds were prepared in a steel calibration chamber with dimensions: height 1.10 m, diameter 0.75 m, and wall thickness 5.8 mm. The calibration chamber was placed on a rigid floor, standing on a rubber pad (Figure 5).

3.3. Substrate Modeling in a Calibration Chamber

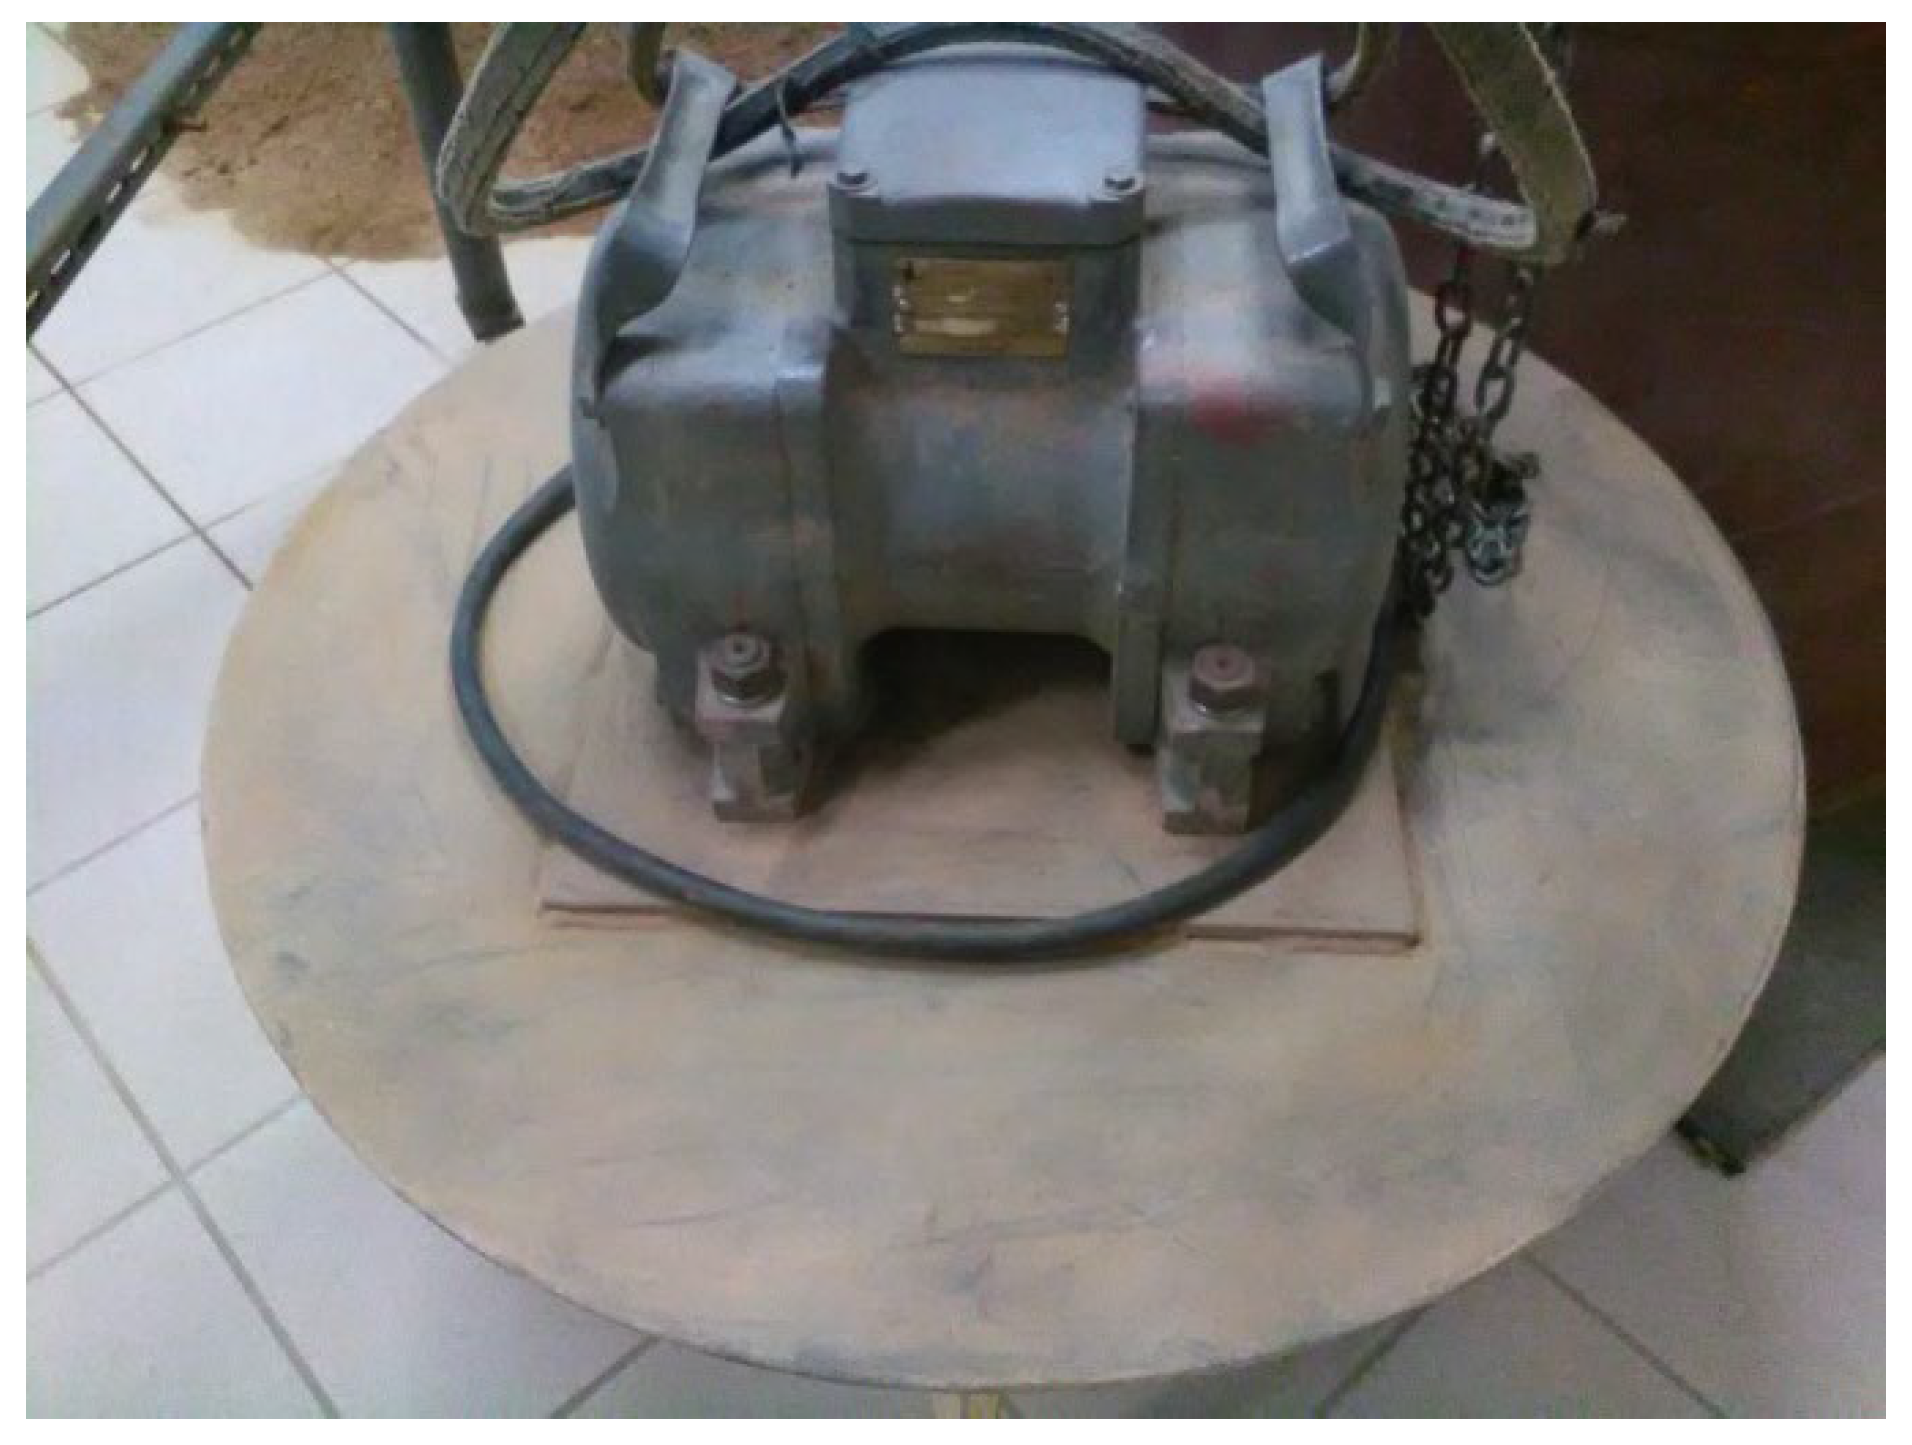
The soil in the calibration chamber was compacted in layers approximately 0.25 m thick using an EWC 22A vibratory plate compactor (Figure 6).
The technical parameters of the EWC 22A vibratory plate compactor were as follows: frequency 50 Hz, total weight 73 kg, compaction plate diameter 720 mm, and plate thickness 6.5 mm.
A total of eight model test beds were prepared. To vary the compaction parameters, the soil was compacted in 3 or 4 layers, with post-compaction thicknesses ranging from 0.14 m to 0.29 m. To achieve different levels of compaction, each layer was compacted for different durations: from 1 min to 20 min. The total thickness of the compacted model bed ranged from 0.75 m to 0.81 m. The sand was compacted at various moisture contents.

3.4. Measures of Density Tested

For artificially compacted soils (both cohesive and non-cohesive), the degree of compaction IS is the direct measure used to assess the quality of compaction in embankment soils during earthworks. The directly measured values of IS were calculated using the following Formula (2):
I S = ρ d ρ d m a x = γ d γ d m a x
where ρd or γ d is the dry density or dry unit weight of the soil in the calibration chamber [g/cm3] or [kN/cm3]; ρdmax or γ d m a x is the maximum dry density or max dry unit weight [g/cm3] or [kN/cm3] at the optimum moisture content wopt, determined in the laboratory using the standard Proctor method according to [1,38].
The dry density of the soil ρd was calculated according to Formula (3):
ρ d = 100 · ρ 100 + w
where ρ is the bulk density of the soil, tested with two measuring cylinders with volumes of 205.17 cm3 and 43.96 cm3 according to CEN ISO/TS 17892-2:2004 [40] and calculated as the average value of the two cylinders; w is the moisture content of the soil tested by the drying method according to CEN ISO/TS 17892-1:2004 [41] and calculated as the average value of the moisture content of the two samples.

3.5. Performing Tests

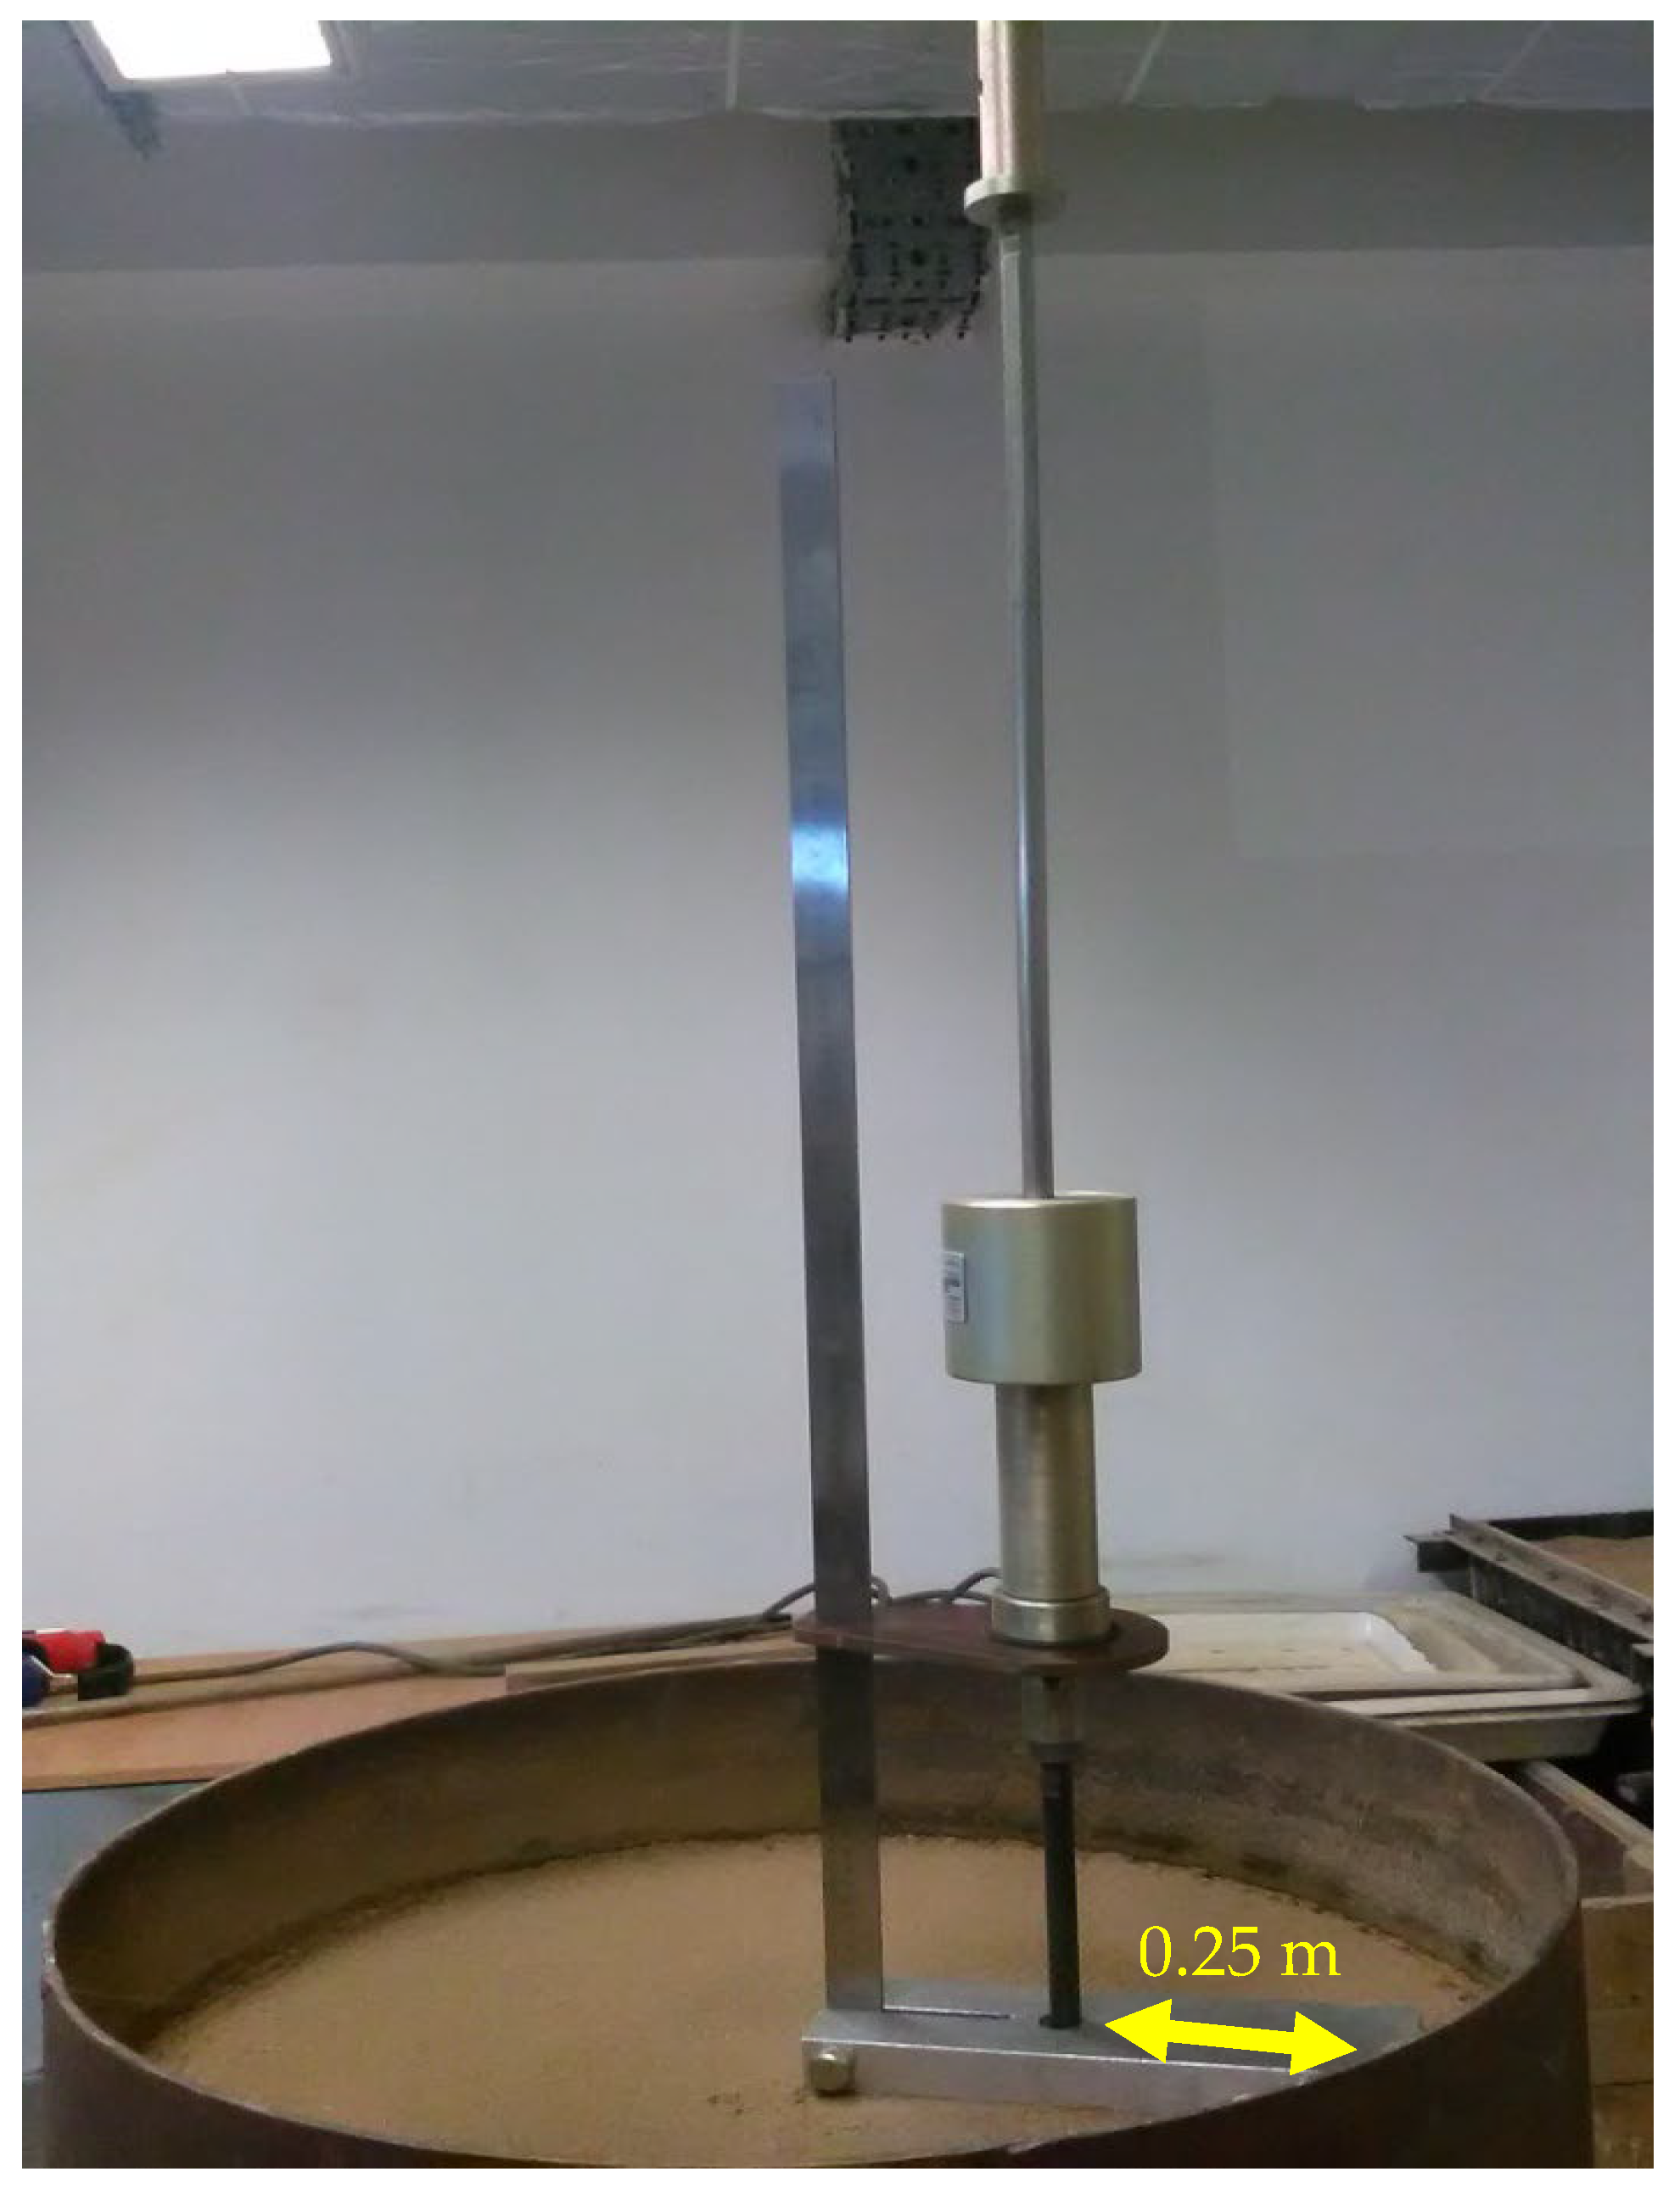
The testing of the model subgrade in the calibration chamber was carried out in the following sequence. The DCP probe was positioned vertically on the leveled surface of the subgrade prepared in the calibration chamber, at a minimum distance of 0.25 m from the chamber walls, in accordance with the recommendations of Nguyen and Mohajerani [6] (Figure 7). The hammer was lifted along the guide to a height of 0.575 m and then released freely. After each blow of the hammer, the penetration depth of the cone (PI in mm) was read from the attached vertical ruler. These steps were repeated until the cone penetrated through the full thickness of the prepared subgrade.
The number of blows (N10) required for 10 cm of DCP probe penetration was calculated and recorded as N10(DCP), similarly to the light dynamic probing test (DPL) according to EN ISO 22476-2:2005 [42]. Based on consistent successive N10(DCP) values, the thicknesses of subgrade layers with similar compaction levels were determined. Next, the soil in the calibration chamber was excavated layer by layer, as defined above, to a specified depth z, at which point measuring cylinders were pressed into the soil to determine the bulk density ρ, and samples were collected for determining the moisture content w. Then, the dry density of the soil ρd was calculated using Equation (3), and the degree of compaction IS was calculated using Equation (2) for each layer of the model subgrade.

4. Results

4.1. Summary of Research Results

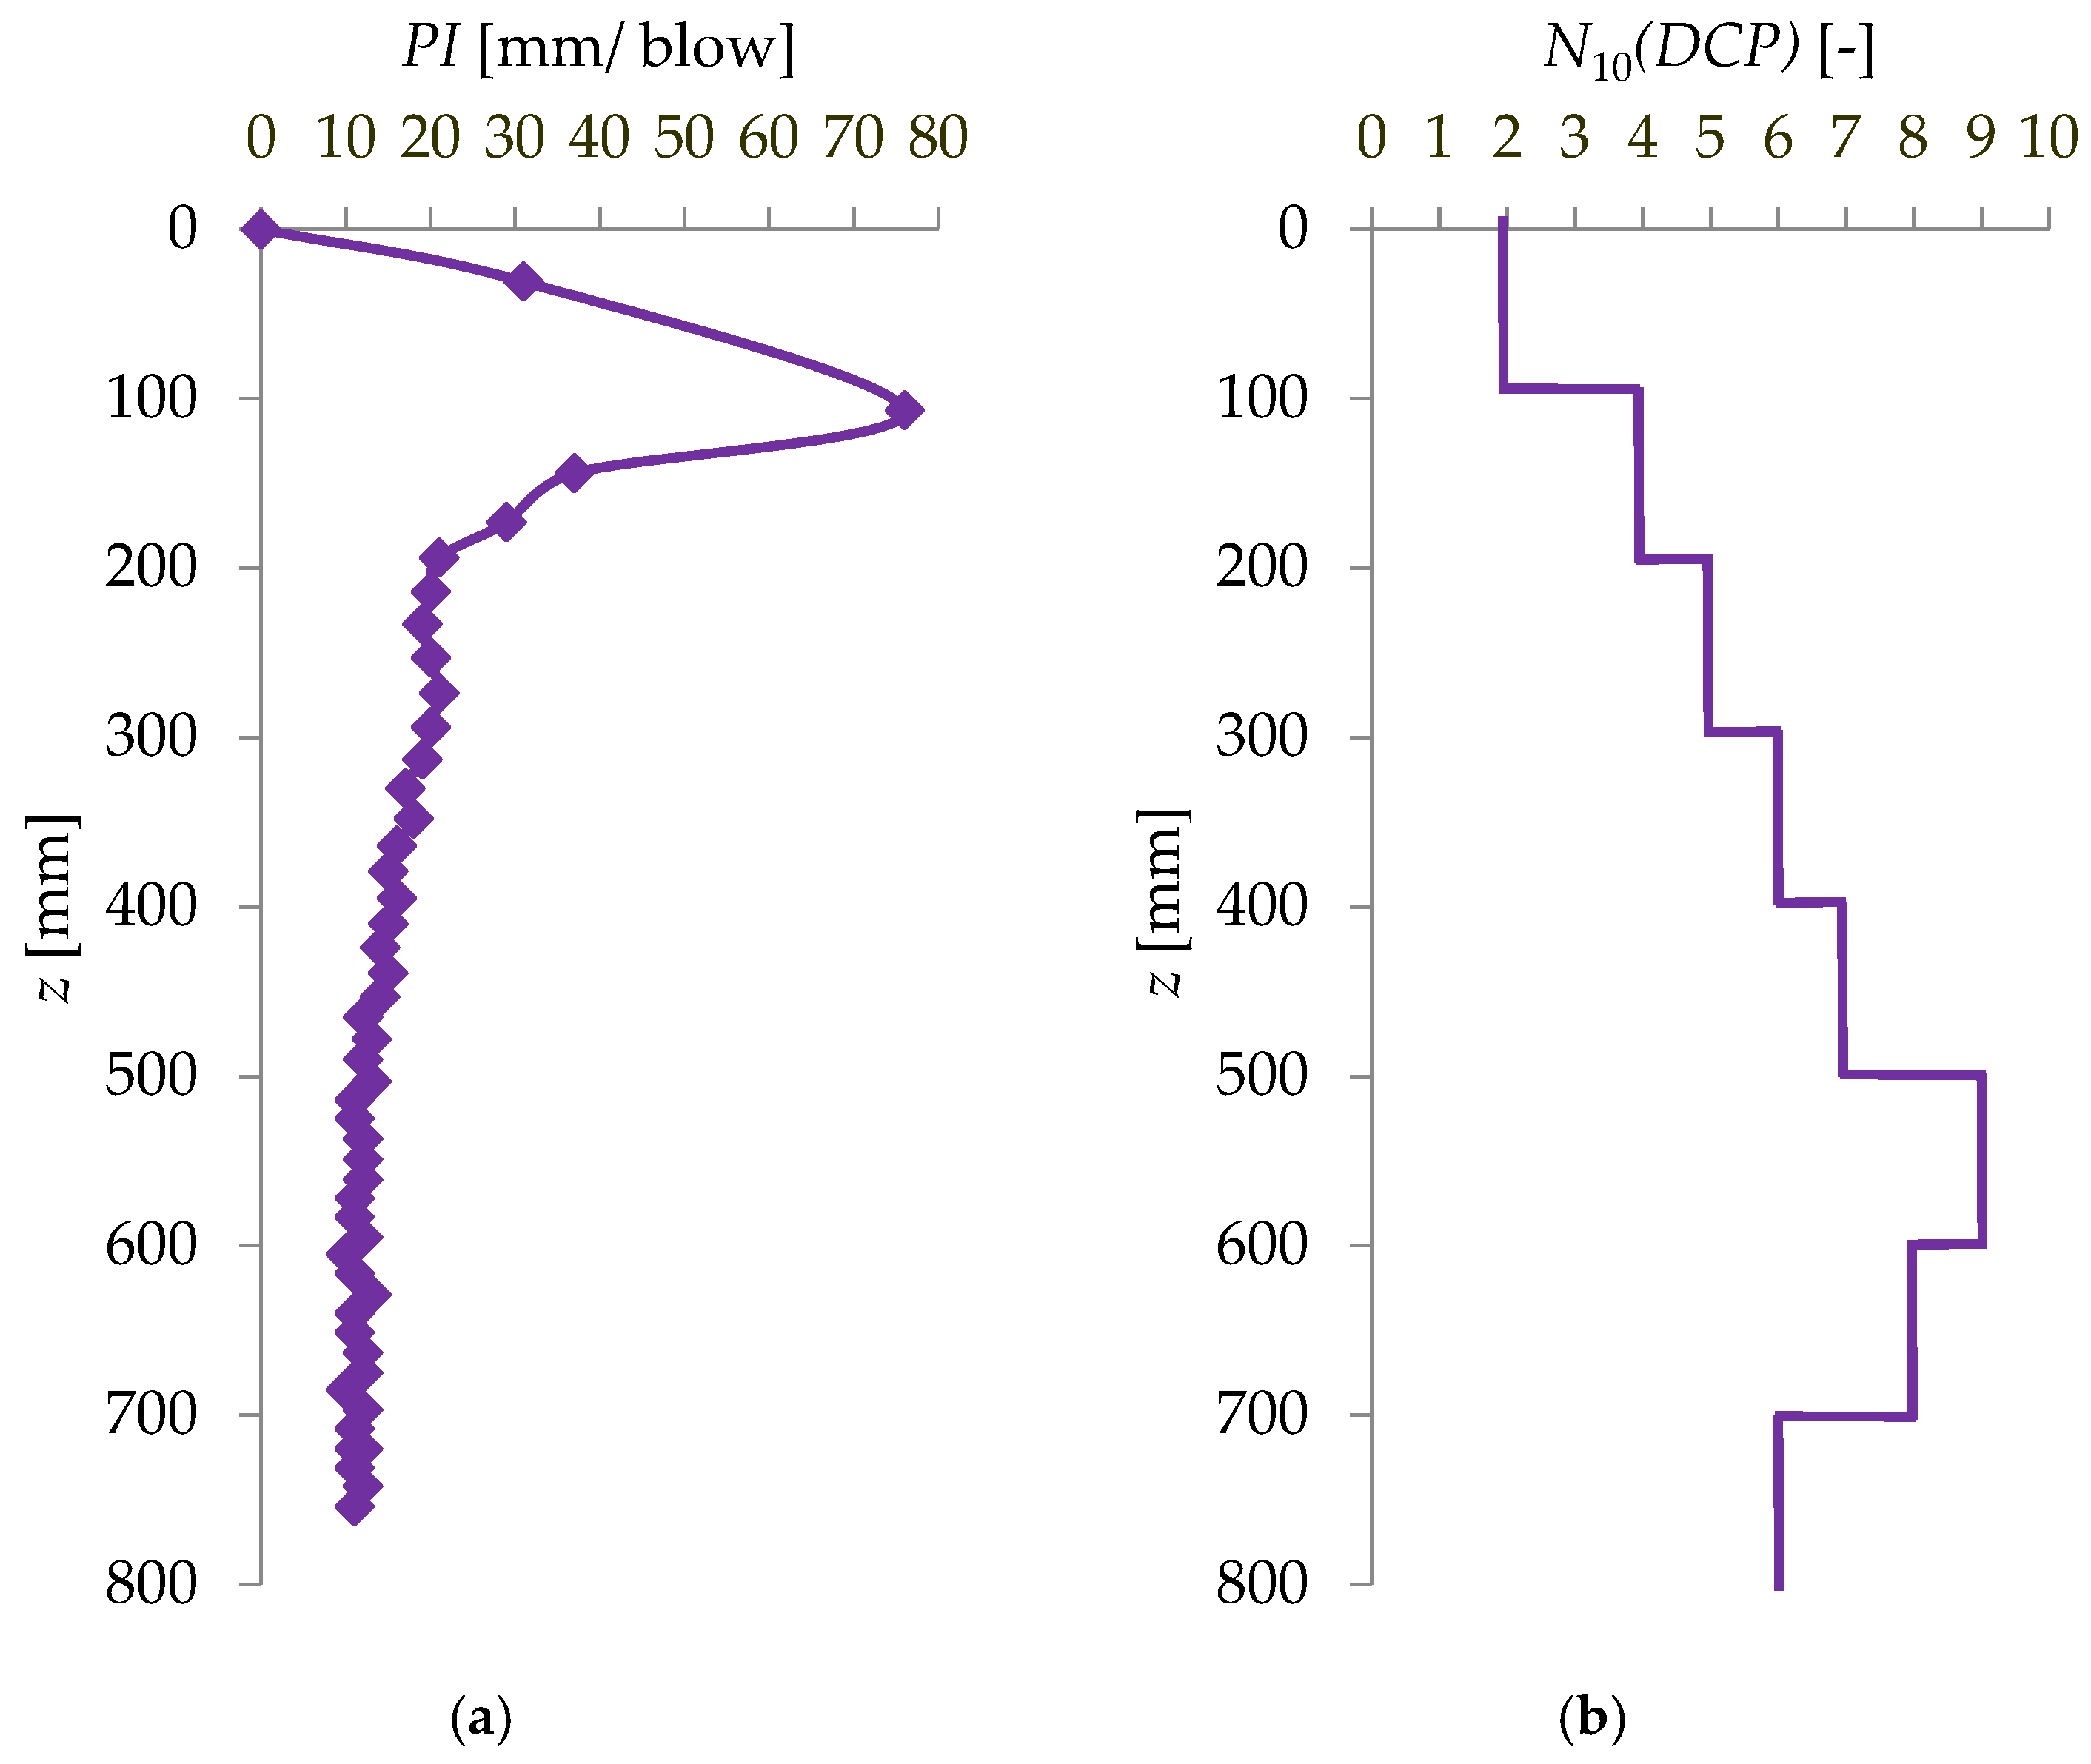
Example graphs of DCP sounding results are shown in Figure 8.
A database named Dataset1 was created, consisting of n1 = 68 cases, described by seven variables: z, ρ, w, ρd, IS, PI, and N10(DCP).
Next, a database named Dataset2 was created, consisting of n2 = 42 cases, described by the same seven variables: z, ρ, w, ρd, IS, PI, and N10(DCP), with the exception that the test results for z from 0.0 m to z = 0.20 m b.g.l. were removed in order to eliminate the maximum settlement values observed at depths from 0.00 to approximately 0.20 m b.g.l.
The range of measurement results for the eight subgrade models in Dataset1 and Dataset2 is shown in Table 4.
It can be observed that the coefficient of variation for PI in Dataset1 is V1 = 58.5%, while for N10(DCP), it accounts for V1 = 69.0%. After eliminating the initial settlement increase, in Dataset2, the coefficients of variation of these parameters decreased to V2 = 40.5% and V2 = 40.4%, respectively. The coefficients of variation for the geotechnical parameters ρd and IS were low, about 2.0% in both datasets, which may indicate that the compaction in the surface layer at z = 0.0–0.2 m b.g.l. is similar to the compaction in deeper layers.

4.2. Statistical Analysis of Test Results

The statistical analysis of the research results contained in the databases according to Table 4 was performed using the computer program STATISTICA version 13.3 [43,44]. Two issues were analyzed:
(1)
Which geotechnical parameters are dependent on PI?
(2)
Can relationships be developed for the degree of compaction IS based on the results obtained from DCP tests?
A simple linear regression model was considered according to Equation (4):
y = a + b y ± ε
If the parameter a significantly differs from 0, a systematic error in the method occurs. When the slope coefficient b significantly differs from 1, a random error occurs. The correlation coefficient r between variables y and x should significantly differ from 0. The significance of the correlation coefficient r also depends on the number of cases n in the dataset. For a sample size of n1 = 68, a statistically significant correlation coefficient should be r ≥ 0.24, and for n2 = 42, it should be r ≥ 0.31 [45].
Additionally, a multiple linear regression model was considered according to Equation (5):
y = a 0 + a 1 x 1 + + a n x n ± ε
In Equations (4) and (5), y are dependent variables; x, x1, , xn are independent variables; a and a0 are the intercepts; b, a1, , an are the coefficients of the equations; ε is the standard error of estimation [44]. In addition, nonlinear models were considered [44].
The error measures of the models are: the correlation coefficient r, the coefficient of determination R2 = r2, and the relative error RE expressed by Equation (6):
R E i = y i y ^ i y i 100 %
in which y i are the known values of the dependent variable from the studies; y ^ i are the values of the dependent variable predicted by the model.
Further statistical analyses were performed on the data from Dataset1 and Dataset2, and statistical inference was carried out at the adopted test probability level (p = 0.05) [43,44,46].
The compatibility of the distributions of the variables IS, PI, and N10(DCP) with the normal distribution was verified using the Kolmogorov–Smirnov (K-S) test. It was found that the distributions of the studied variables in both datasets correspond to the normal distribution (p > 0.20 and p < 0.10 for Dataset1, and p > 0.20 for Dataset2).
Pearson linear correlation coefficients r were calculated [43]. The linear correlation matrices for Dataset1 and Dataset2 are presented in Table 5, where statistically significant correlation coefficients r are marked in bold font with colorful backgrounds, indicating the strength of correlation between the variables.
It can be observed that in Dataset1, the values of PI and N10(DCP) mainly depend on the depth of the test z (with r = −0.751 and r = 0.809), and the degree of compaction IS (with r = −0.260 and r = 0.440). Of course, the value of the compaction index IS is strongly dependent on the bulk density ρ and the soil moisture w, based on which the dry density ρd is calculated using Formula (3).
In Dataset2, the values of PI and N10(DCP) depend on the degree of compaction IS (with r = −0.512 and r = −0.512), and to a somewhat lesser extent, on the depth of the test z (with r = −0.409 and r = −0.409).
The developed statistically significant simple and multiple linear and nonlinear regression equations according to Formulas (7)–(17) for Dataset1 and Dataset2 are presented in Table 6.
Based on Table 6, it can be seen that the multiple regression models for the dependent variables PI and N10(DCP), expressed by Equations (11) and (12) in Dataset1, have the highest coefficients of determination R2 = 0.613 and R2 = 0.806, respectively. This means that these equations explain 61.3% and 80.6% of the variability in the dependent variables. The R2 values in Dataset1 are higher than those in Dataset2, so it can be concluded that the DCP test results can be interpreted from the surface of the terrain, and the results obtained in the 0.00–0.20 m b.g.l. range should not be discarded. Moreover, in Dataset1 the variables have a wider range of variability.
Therefore, the possibility of developing calibration equations in Dataset1 for the DCP probe was analyzed. Based on these equations, the value of the degree of compaction IS of the tested sand could be determined using the measured values of PI or N10(DCP) and the depth of testing z.
The models Is = f(PI) and Is = f(z, PI) were rejected due to very low R2 values, 0.068–0.128 and 0.085–0.222, respectively, or they are statistically insignificant.
Next, the model Is = f(z, N10(DCP)) was analyzed. Since the values of N10(DCP) are correlated with the depth of the test z (as shown in Table 5), multicollinearity of the independent variables was checked using the calculated variance inflation factor (VIF) and tolerance analysis, as well as partial and semi-partial correlation [44,47]. Since the “pure” contribution of variable z in explaining the dependent variable IS was slightly smaller than that of variable N10(DCP), the VIF for variable z was calculated as VIF = 3.20. According to Daoud [48], 1 < VIF ≤ 5 means moderate correlation. Therefore, the selected best model was adopted in the form of Equation (18):
IS = 0.927 – 0.069z + 0.005N10(DCP) ± 0.013 with R2 = 0.412
The adopted model is statistically significant (at p ˂ 0.00000). All words of the selected model are statistically significant (at p = 0.00000). Analysis of the residuals showed that the residuals are uncorrelated and have a normal distribution [44]. Although it explains only 41.2% of the variability of the dependent variable, it predicts the degree of compaction with a relatively small relative error of approximately RE = ±3%, which is sufficient for practical purposes. A comparison of the predicted Is values according to Equation (18) and the measured values is shown in Figure 9.

5. Conclusions

In the study, the DCP probe was calibrated for its application for the indirect assessment of the degree of compaction IS in surface embankment layers. The reference values were obtained from direct degree of compaction tests. The tested subgrades were modeled from sand (Sa) in a calibration chamber to eliminate potential heterogeneities in grain size distribution, moisture content, and compaction. Based on the research results, the following conclusions can be drawn:
  • The results of DCP testing can be interpreted from the ground surface.
  • The DCP test results (PI and N10(DCP)) of sand mainly depend on the test depth z and the degree of compaction IS.
  • A statistically significant calibration equation for the DCP probe was developed, which allows determining the degree of compaction IS of the tested sand (Sa) based on the measured values of N10(DCP) and test depth z, with a relative error of RE = ±3%: IS = 0.927 − 0.069z + 0.005N10(DCP) ± 0.013.
  • Based on the conducted research and analyses, it is concluded that the DCP probe can be used to assess the compaction index of surface layers of embankments made of poorly graded non-cohesive soil (sand (Sa)), using the developed regression equation Is = f(z, N10(DCP)).
  • The DCP probe has great application possibilities for studying the degree of compaction of soils. In this article, the DCP probe was calibrated on one soil type: poorly graded sand. The probe should be calibrated on other cohesionless soils with different grain size distributions.
  • Studies will be undertaken on several cohesionless soils with coarser grain sizes, with medium, well, and gap graded.
  • Calibration equations for individual soils will be developed. The possibility of generalizing the calibration equations for all cohesionless soils or groups of cohesionless soils will be examined.
  • The developed calibration equations will be verified based on field studies on road embankments.

Author Contributions

Conceptualization, M.J.S. and D.T.; experimental investigation, D.T.; analysis of the experimental and statistical results, M.J.S. and D.T.; data curation, M.S. and D.O.; writing—original draft preparation, D.T.; writing—review, W.K. and E.B.-B.; writing—editing, M.S. and M.P.; visualization, W.K. and M.P.; supervision, M.S. and E.B.-B.; project administration, W.K.; funding acquisition, M.J.S., W.K. and M.S. All authors have read and agreed to the published version of the manuscript.

Funding

The work was carried out in cooperation with the partners from Bialystok University of Technology, Poland (No. WZ/WB-IIL/8/2023), Rzeszow University of Technology, Poland and Lublin University of Technology, Poland, and was supported by Polish Ministry of Science and Higher Education.

Institutional Review Board Statement

Not applicable.

Informed Consent Statement

Not applicable.

Data Availability Statement

The original contributions presented in this study are included in the article. Further inquiries can be directed to the corresponding author.

Conflicts of Interest

The authors declare no conflicts of interest.

References

  1. PN-B-04481:1988; Grunty Budowlane. Badania Próbek Gruntu. Polish Committee for Standardization (PKN): Warsaw, Poland, 1988.
  2. EN 16907-1:2018; Earthworks—Part 1: Principles and General Rules. CEN: Brussels, Belgium, 2018.
  3. Hawrysz, M.; Stróżyk, J. Kontrowersyjna interpretacja wyników sondowań dynamicznych w praktyce inżynierskiej. Inżynieria Morska I Geotech 2015, 36, 203–207. [Google Scholar]
  4. D6951-03:2003; ASTM Standard. Standard Test Method for Use of the Dynamic Cone Penetrometer in Shallow Pavement Applications. ASTM International: West Conshohocken, PA, USA, 2003.
  5. George, V.; Rao, N.C.; Shivashankar, R. PFWD, DCP and CBR correlations for evaluation of lateritic subgrades. Int. J. Pavement Eng. 2009, 10, 189–199. [Google Scholar] [CrossRef]
  6. Nguyen, B.T.; Mohajerani, A. A new lightweight dynamic cone penetrometer for laboratory and field applications. Aust. Geomech. 2012, 47, 41–50. [Google Scholar]
  7. Yang, B.; Zhang, R.; Zha, X.; Liu, C.; Pan, Q. Improved testing method of dynamic cone penetrometer in laboratory for evaluating compaction properties of soil subgrade. Road Mater. Pavement Des. 2015, 17, 487–498. [Google Scholar] [CrossRef]
  8. Ganju, E.; Kim, H.; Prezzi, M.; Salgado, R.; Siddiki, N.Z. Quality assurance and quality control of subgrade compaction using the dynamic cone penetrometer. Int. J. Pavement Eng. 2016, 19, 966–975. [Google Scholar] [CrossRef]
  9. MacRobert, C.J.; Bernstein, G.S.; Nchabeleng, M.M. Dynamic Cone Penetrometer (DCP) relative density correlations for sands. Soils Rocks 2019, 42, 201–207. [Google Scholar] [CrossRef]
  10. PN-S-02205:1998; Roads—Earthwork—Specifications and Testing. Polish Committee for Standardization (PKN): Warsaw, Poland, 1998.
  11. Salgado, R.; Yoon, S. Dynamic Cone Penetration Test (DCPT) for Subgrade Assessmen. Technical Summary, Technology Transfer and Project Implementation Information, INDOT Research Report, No. FHWA/IN/JTRP-2002/30. 2003. Available online: https://docs.lib.purdue.edu/cgi/viewcontent.cgi?article=1544&context=jtrp (accessed on 22 April 2025).
  12. Kumar, R.S.; Ajami, A.S.; Valkati, B. Comparative study of grade soil strenght estimation models developed based on CBR, DCP and FWD test results. Int. Adv. Res. J. Sci. Eng. Technol. 2015, 2, 92–102. [Google Scholar] [CrossRef]
  13. Paige-Green, P.; DuPlessis, L. The Use and Interpretation of the Dynamic Cone Penetrometer (DCP) Test. CSIR Built Environment, Version 2, Pretoria. 2009. Available online: https://rtdcp.co.za/wp-content/uploads/2019/11/The_use_and_interpretation_of_the_Dynamic_Cone_Penetrometer_01.pdf (accessed on 30 April 2025).
  14. Ayers, M.E.; Thompson, M.R.; Uzarski, D.R. Rapid shear strength evaluation of in situ granular materials. Transp. Res. Rec. 1989, 1227, 134–146. [Google Scholar]
  15. Al-Amoudi, O.S.B.; Asi, I.M.; Wahhab, H.I.A.-A.; Khan, Z.A. Clegg hammer—California-Bearing Ratio correlations. J. Mater. Civ. Eng. 2002, 14, 512–523. [Google Scholar] [CrossRef]
  16. Langton, D. The Panda light weight penetrometer for soil investigation and monitoring material compaction. Ground Eng. 1999, 32, 33–37. [Google Scholar]
  17. Byun, Y.-H.; Hong, W.-T.; Lee, J.-S. Characterization of railway substructure using a hybrid cone penetrometer. Smart Struct. Syst. 2015, 15, 1085–1101. [Google Scholar] [CrossRef]
  18. Hamid, A.M. Effect of Fine Material on Penetration Resistance. Leadership in Sustainable Infrastructure. In Proceedings of the 2017 Canadian Society for Civil Engineering Conference, CSCE SCGC, Vancouver, BC, Canada, 31 May–3 June 2017; Available online: https://www.researchgate.net/publication/317671646_effect_of_fine_material_on_penetration_resistance (accessed on 23 April 2025).
  19. Hamid, A.M. The Dynamic cone Penetration Test: A review of its correlations and applications. In Proceedings of the International Conference on Advances in Civil and Environmental Engineering (ACEE), Penang, Malaysia, 28–30 July 2015; pp. 1–16. [Google Scholar]
  20. Stanichevsky, M.; Basio, J.J. The Dynamic Penetration Cone Index as an alternative for the control of a subgrade surface. In Proceedings of the 16th International Conference on Soil Mechanics and Geotechnical Engineering, Osaka, Japan, 12–15 September 2005. [Google Scholar]
  21. Manjunath, K.C.; Amarnath, M.S. Structural evaluation of low volume road pavements using pavement dynamic cone penetrometr. Int. J. Res. Eng. Technol. (IJRET) 2013, 2, 187–191. [Google Scholar]
  22. Wu, S.; Sargand, S. Use of Dynamic Cone Penetrometer in Subgrade and Base Acceptance. Ohio Research Institute for Transportation and the Environment (ORITE), Final Technical Report, No. FHWA/ODOT-2007/01. 2007. Available online: https://rosap.ntl.bts.gov/view/dot/39670 (accessed on 29 April 2025).
  23. Hashemi, M.; Nikudel, M.R. Application of Dynamic Cone Penetrometer test for assessment of liquefaction potential. Eng. Geol. 2016, 208, 51–62. [Google Scholar] [CrossRef]
  24. Webster, S.L.; Grau, R.H.; Williams, T.P. Description and Application of Dual Mass Dynamic Cone Penetrometer. U.S. Army Corps of Engineers, Waterways Experiment Station, Instruction Report, No. GL-92-3. 1992. Available online: https://apps.dtic.mil/sti/pdfs/ADA251960.pdf (accessed on 28 April 2025).
  25. Livneh, M. Validation of correlations between a number of penetration tests and in situ California Bearing Ratio tests. Transp. Res. Rec. 1989, 1219, 56–67. [Google Scholar]
  26. Seyman, E. Laboratory Evaluation of In-Situ Tests as Potential Quality Control/Quality Assurance Tools. Master’s Thesis, Graduate School, LSU Digital Commons, Louisiana State University, Baton Rouge, LA, USA, 2003. Available online: https://repository.lsu.edu/gradschool_theses/2601/ (accessed on 25 April 2025).
  27. Hussein, A.A.; Alshkane, Y.M. Prediction of CBR amd Mr of fine grained soil using DCP. In Proceedings of the 4th International Engineering Conference on Developments & Computer Engineering Applications, Erbil, Iraq, 12–14 September 2018; pp. 268–282. [Google Scholar]
  28. Juntasan, P.; Narong, S.; Kaewhanam, N. Evaluation of Highway Subgrade Compaction by Dynamic Cone Penetrometer. Mahasarakham Int. J. Eng. Technol. 2015, 1, 6–10. [Google Scholar]
  29. Belicanta, A.; Lukiantchuki, J.A.; Reis, J.H. Control of soil compaction in pavement layers: A new approach using the dynamic cone penetrometer (DCP). In Proceedings of the 5th International Conference on Geotechnical and Geophysical Site Characterization (ISC5), Gold Coast, QLD, Australia, 5–9 September 2016. [Google Scholar]
  30. Kaur, P.; Gill, K.S.; Walia, B.S. Correlation between soaked CBR value and CBR value obtained with dynamic cone penetrometer. Int. J. Res. Eng. Appl. Sci. (IJREAS) 2012, 2, 1243–1250. [Google Scholar]
  31. Zohrabi, M.; Scott, P.L. The Correlation Between the CBR Value and Penetrability of Pavement Construction Materials. Prepared for Transport for London (Street Management), TRL Report TRL587. 2003. Available online: https://www.trl.co.uk/uploads/trl/documents/TRL587.pdf (accessed on 24 April 2025).
  32. Jordão, H.P.; de Figueiredo Lopes Lucena, A.E.; das Chagas Filho, M.B.; Rodrigues, J.K.G.; Gama, D.A. Contribution to the project of urban Pavement of Low Volume of Traffic by use of the Dynamic Cone Penetrometer. Soils Rocks 2012, 35, 1–8. [Google Scholar] [CrossRef]
  33. Monteiro, F.F.; de Oliveira, F.H.L.; Zitllau, O.; de Aguiar, M.F.P.; de Carvalho, L.M.C. CBR value estimation using Dynamic Cone Penetrometer—A case study of Brazil’s Midwest Federal Highway. Electron. J. Geotech. Eng. 2016, 21, 4649–4656. [Google Scholar]
  34. Wilches, F.J.; Diaz, J.J.F.; Avila, J.R.H. Correlation between California Bearing Ratio (CBR) and Dynamic Cone Penetrometer (DCP) for soil from Sincelejo city in Colombia. Int. J. Appl. Eng. Res. 2018, 13, 2068–2071. [Google Scholar]
  35. Tymosiak, D. Validation of Selected Methods of Testing Density Measures of Non-Cohesive Soil Compaction. Ph.D. Thesis, Bialystok University of Technology, Bialystok, Poland, 2023. [Google Scholar]
  36. EN ISO 14688-2:2004; Geotechnical Investigations. Determination and Classification of Soils. Part 2: Principles of Classification. CEN: Brussels, Belgium, 2004.
  37. CEN ISO/TS 17892-4:2004; European Technical Specification. Geotechnical Investigation and Testing—Laboratory Testing of Soil—Part 4: Determination of Particle Size Distribution. CEN: Brussels, Belgium, 2004.
  38. EN 13286-2:2010-11; Unbound and Hydraulically Bound Mixtures—Part 2: Test Methods for Laboratory Dry Density and Water Content—Proctor Compaction + Amendment EN 13286-2:2010/AC:2014-07. CEN: Brussels, Belgium, 2010.
  39. Sulewska, M.J.; Tymosiak, D. Analysis of compaction parameters of the exemplary non-cohesive soil determined by Proctor methods and vibrating table test. Ann. Wars. Univ. Life Sci. Land Reclam. 2018, 50, 99–108. [Google Scholar] [CrossRef]
  40. CEN ISO/TS 17892-2:2004; European Technical Specification. Geotechnical Investigation and Testing—Laboratory Testing of Soil—Part 2: Determination of Density of Fine Grained Soil. CEN: Brussels, Belgium, 2004.
  41. CEN ISO/TS 17892-1: 2004; European Technical Specification. Geotechnical Investigation and Testing—Laboratory Testing of Soil—Part 1: Determination of Water Content. CEN: Brussels, Belgium, 2004.
  42. EN ISO 22476-2:2005; European Standard. Geotechnical Investigation and Testing—Field Testing—Part 2: Dynamic Probing (ISO 22476-2:2005) + Amendment EN ISO 22476-2:2005/A1:2011. CEN: Brussels, Belgium, 2005.
  43. Stanisz, A. Przystępny Kurs Statystyki z Zastosowaniem STATISTICA PL na Przykładach z Medycyny. T. 1: Statystyki Pod-Stawowe; StatSoft Polska Sp. z o.o.: Kraków, Poland, 2006. [Google Scholar]
  44. Stanisz, A. Przystępny Kurs Statystyki z Zastosowaniem STATISTICA PL na Przykładach z Medycyny. T. 2: Modele Liniowe i Nieliniowe; StatSoft Polska Sp. z o.o.: Kraków, Poland, 2007. [Google Scholar]
  45. Peternek, P.; Kośny, M. Kilka uwag o testowaniu istotności współczynnika korelacji. Zesz. Nauk. Wyższej Szkoły Bank. We Wrocławiu 2011, 20, 341–350. [Google Scholar]
  46. Rabiej, M. Statystyka z Programem STATISTICA; Wydawnictwo Helion: Gliwice, Poland, 2012. [Google Scholar]
  47. Gruszyński, M.; Mierzejewski, P. Wstęp do Ekonometrii w stu Oknach; Szkoła Główna Handlowa: Warszawa, Poland, 2002. [Google Scholar]
  48. Daoud, J.I. Multicollinearity and regression analysis. J. Phys. Conf. Ser. 2017, 949, 012009. [Google Scholar] [CrossRef]
Figure 1. DCP device according to ASTM D6951-03:2003 [4]: (a) view of the DCP device; (b) conical tip of the DCP (photo by D. Tymosiak).
Materials 18 03548 g001
Figure 2. Location of the site where soil was taken for testing near the city of Bialystok, Poland. Map data ©2025 Google (www.google.com/maps, accessed on 30 April 2025).
Materials 18 03548 g002
Figure 3. Sand (Sa) grain size curve [35].
Materials 18 03548 g003
Figure 4. Compaction curve of sand (Sa) obtained using the standard Proctor method [39], where ρd is the dry density; w is the moisture content; Sr is the degree of saturation (i.e., the proportion of pore space filled with water), indicated by the dotted line.
Materials 18 03548 g004
Figure 5. Calibration chamber (photo by D. Tymosiak).
Materials 18 03548 g005
Figure 6. Vibratory plate compactor EWC 22A (photo by D. Tymosiak).
Materials 18 03548 g006
Figure 7. Examination of the modeled substrate with the DCP probe (photo by D. Tymosiak).
Materials 18 03548 g007
Figure 8. Sample DCP probing charts for subgrade No. 1 [35]: (a) relationship between PI and penetration depth z, (b) relationship between the number of blows N10(DCP) and penetration depth z.
Materials 18 03548 g008
Figure 9. A comparison of the predicted Is values according to Equation (18) and the measured values IS.
Materials 18 03548 g009
Table 2. Technical parameters of the DCP device according to ASTM D6951-03:2003 [4].
ParameterValue of Parameter
Hammer mass m [kg]8 ± 0.01
Hammer drop height h [mm]575 ± 10
Apex angle of the cone [°]60 ± 1
Diameter of the base of the conical tip d [mm]20.0 ± 2.5
Mass of the rod [kg/m]1.55
Outer diameter of the rod [mm]15.8
Impact energy of the hammer per unit area [kJ/m2]143.7
Test result PI [mm/1 blow]PI (Penetration Index)
Table 3. Geotechnical parameters of the tested sand (Sa) [35].
Geotechnical ParameterSymbolValue
Fraction content:fgr; csa; mSa; fsa5%; 35%; 50%; 10%
Grain size distribution: D10, D30, D60 (grain diameters
for which 10%, 30%, and 60% of the soil
sample, respectively, are finer)
D100.200 mm
D300.350 mm
D600.620 mm
Uniformity coefficient CU = D60/D103.10
Curvature coefficientCC = (D30)2/D10·D600.988
Maximum dry density of the soil ρdmax1.863 g/cm3
Optimum moisture contentwopt10.03%
Bulk density of the soilρ1.717–1.903 g/cm3
Moisture content of the soilw3.40–5.81%
Dry density of the soil ρd1.649–1.803 g/cm3
Table 4. The range of values of the tested geotechnical parameters.
ParameterDataset1Dataset2
Values RangeStandard Deviation
S1
Coefficient of
Variation
V1 [%]
Values RangeStandard Deviation
S2
Coefficient of
Variation
V2 [%]
z [m]0.02–0.700.2368.30.21–0.700.1530.3
ρ [g/cm3]1.732–1.9030.0372.11.756–1.9030.0422.3
w [%]3.4–5.80.612.63.8–5.80.612.1
ρd [g/cm3]1.650–1.8030.0321.91.687–1.8030.0342.0
IS [-]0.886–0.9680.0171.90.906–0.9680.0192.0
PI [mm/1 blow]6.0–57.012.958.56.0–30.05.740.5
N10(DCP)
[blow number/10 cm]
1.0–17.04.069.04.0–17.03.440.4
Designation: The gray color marks the Dataset2.
Table 5. Pearson linear correlation r coefficient matrix.
Dataset1
VariablezρwρdISPIN10(DCP)
z1.000
ρ0.1461.000
w0.2390.4981.000
ρd0.1000.9620.2531.000
IS0.1000.9620.2531.0001.000
PI−0.751−0.2280.012−0.260−0.2601.000
N10(DCP)0.8090.4630.2860.4400.440−0.7761.000
Dataset2
VariablezρwρdISPIN10(DCP)
z1.000
ρ0.0251.000
w0.2400.6031.000
ρd−0.0260.9750.4161.000
IS−0.0260.9750.4161.0001.000
PI−0.409−0.451−0.022−0.512−0.5121.000
N10(DCP)0.4840.6320.3690.6250.625−0.8311.000
Designations: Pearson’s r linear correlation coefficient. Materials 18 03548 i001 0.99–0.60; Materials 18 03548 i002 (−0.21)–(−0.60); Materials 18 03548 i003 0.59–0.20; Materials 18 03548 i004 (−0.61)–(−0.99); Materials 18 03548 i005 0.19–(−0.20).
Table 6. Regression equations in Dataset1 and in Dataset2.
Dataset1
FunctionRegression EquationR2Formula No.
PI = f(z)PI = 46.9 − 108.2z + 82.2z2 ± 8.30.600(7)
PI = f(IS)PI = 203.7 − 195.1IS ± 12.60.068(8)
N10(DCP) = f(z)N10(DCP) = 11.9 + 11.0logz ± 2.3 0.681(9)
N10(DCP) = f(IS)N10(DCP) = −5368.3 + 5392.6IS – 11,369.0logIS ± 3.60.273(10)
PI = f(z, IS)PI = −31.2logz − 293.3logIS ± 8.2
(the intercept is statistically insignificant)
0.613(11)
N10(DCP) = f(z, IS)N10(DCP) = 17.3 + 10.5logz + 182.6logIS ± 1.80.806(12)
Dataset2
FunctionRegression equationR2Formula No.
PI = f(IS)PI = 86.6 − 83.4IS2 ± 5.00.263(13)
N10(DCP) = f(z)N10(DCP) = 12.9 + 14.2logz ± 2.90.292(14)
N10(DCP) = f(IS)N10(DCP) = −97.4 + 113.4IS ± 2.70.391(15)
PI = f(z, IS)PI = 170.9 − 16.5z − 159.7IS ± 4.40.441(16)
N10(DCP) = f(z, IS)N10(DCP) = 20.5 + 14.5logz + 247.4logIS ± 1.90.691(17)
Disclaimer/Publisher’s Note: The statements, opinions and data contained in all publications are solely those of the individual author(s) and contributor(s) and not of MDPI and/or the editor(s). MDPI and/or the editor(s) disclaim responsibility for any injury to people or property resulting from any ideas, methods, instructions or products referred to in the content.